 Xin Huang
 Yanbo Cao1
 Shuangyun Peng
 Siyang Li
- 1Yunnan Earthquake Agency, Kunming, China
- 2Faculty of Geography, Yunnan Normal University, Kunming, China
- 3Kunming Comprehensive Investigation Center of Natural Resources, China Geological Survey, Kunming, China
Introduction: Plateau mountain ecosystems are highly sensitive to seismic disturbances due to their complex topography and fragile ecological environment. However, existing research still lacks a systematic understanding of the spatiotemporal dynamics and underlying driving mechanisms of ecosystem recovery in such regions following strong earthquakes. Thus, further in-depth investigation is urgently needed.
Methods: This study employed the 2014 Ludian M6.5 earthquake in Yunnan, China, as a case study. Using the Remote Sensing Ecological Index (RSEI) derived from Landsat imagery, we quantitatively assessed ecological disturbance and recovery over nearly a decade. The Geodetector model was applied to identify key driving factors of ecological quality changes.
Results: (1) Disturbance effects: the earthquake caused a significant short-term decline of 21.3% in the mean RSEI of the affected area, with the degree of degradation intensifying alongside seismic intensity. (2) Recovery dynamics: the ecosystem exhibited a three-stage nonlinear evolution pattern of “rapid recovery – steady recovery – stable surpassing.” By 2021, approximately 91% of the region had experienced ecological quality improvement, while 8.75% of the area still showed degradation, mainly concentrated in zones with intensive human activities. (3) Driving mechanisms: before the earthquake, the ecological pattern was primarily governed by natural background factors such as climate and soil; after the earthquake, aspect became the dominant factor reshaping the ecological pattern; and during the recovery period, the driving mechanisms presented a composite feature characterized by the persistent influence of the topography–climate system combined with the progressively increasing role of human interventions.
Discussion: The findings revealed the complex interplay between seismic disturbance, topographic constraints, and human activities in shaping ecological recovery patterns in plateau mountain regions. The study provides a theoretical basis and practical insights for post-disaster ecological restoration and sustainable management in seismically active mountainous areas.
1 Introduction
Earthquakes, being abrupt and intense geological disasters, not only cause extensive casualties and property damage (Korup et al., 2010) but also trigger secondary disasters such as landslides, collapses, debris flows, and barrier lakes (Pan et al., 2021). These cascading effects severely damage forests, grasslands, farmland, and wildlife habitats, destabilizing biodiversity and ecosystem services (Ouyang et al., 2008; Kang et al., 2021) and threatening regional ecological security. Research has shown that ecosystem damage in earthquake-affected areas often leads to long-term environmental risks (Wang et al., 2008). However, due to the self-repairing capacity of ecosystem structures, ecosystem functions can gradually recover and stabilize over time (Marc et al., 2015; Tanya et al., 2021). Therefore, systematically evaluating the ecological impacts of earthquakes, quantitatively analyzing post-disaster ecological succession and recovery processes (Zhang et al., 2025), and constructing multidimensional frameworks to identify driving factors are essential for the restoration of disaster areas and ecological conservation.
Current research on the assessment of ecological environment quality under earthquake disturbances focuses primarily on two aspects: identification of changes in ecological quality and their driving factors in affected regions. Regarding changes in ecological quality, existing studies employ methods such as field surveys and monitoring, ecological models, and remote sensing technologies. Among these, field surveys and monitoring, through on-site sampling and analysis of soil, water quality, vegetation, and other aspects in disaster areas, can obtain real and reliable ecological environment quality monitoring data (Hirayama et al., 2020; Hamada et al., 2024). providing a reliable basis for ecological environment quality assessment. However, due to limitations in sampling costs, human resources, and natural conditions, this method has certain limitations in the spatial and temporal continuity of data coverage (Yin et al., 2025). Nevertheless, the obtained in-situ data remains an important validation benchmark for other methods. Ecological modeling methods, such as ecosystem process models (Duan et al., 2021; Cattani et al., 2023), landscape ecological models (Luo et al., 2023; Tian et al., 2023), and eco-hydrological models (Jakovljevic and Lozanov-Crvenkovic, 2015; Chen et al., 2021), can provide large-scale and long-term simulations of the dynamic changes in ecological environment quality from a macro perspective, offering an important tool for understanding the long-term evolution of ecosystems post-earthquake. However, to construct operable ecological models, it is usually necessary to simplify and make assumptions about complex ecosystems, which may lead to discrepancies between the modeled ecological changes and the actual situation. Despite this, the method still holds unique advantages in revealing the mechanisms of post-earthquake ecological evolution and predicting long-term trends. In recent years, with the rapid development of earth observation technologies, remote sensing monitoring, with its advantages of high precision, efficiency, and large-scale coverage (Yuan et al., 2021), has become an important means of obtaining long-term, high-precision ecological environment data, and is widely used in ecological environment quality monitoring and evaluation. Relevant studies, based on multi-temporal remote sensing image data, have quantified the ecological environment’s disturbance and recovery from earthquakes through the construction of indices such as normalized vegetation Index (Pandey et al., 2022), vegetation coverage (Nakata et al., 2023), and net primary productivity (Duan et al., 2024). However, single indices fail to capture the complexity and multidimensionality of ecosystems (Li et al., 2025). To address these limitations, integrated ecological evaluation indices have emerged (Xu, 2013). proposed the Remote Sensing Ecological Index (RSEI), which synthesizes four indicators—greenness, wetness, dryness, and heat—using principal component analysis. This composite index overcomes the constraints of single-index approaches by providing a more comprehensive, cross-temporal, and cross-spatial assessment of ecological quality. It enables rapid, accurate, and objective assessment of ecological environment quality in disaster-affected areas (Xu et al., 2019), effectively addressing the shortcomings of the aforementioned methods. Consequently, the RSEI has become an essential tool for dynamic monitoring of ecological environment quality.
Research on the driving factors of ecological quality typically employs methods such as correlation analysis, regression models, and Geodetector (Wang et al., 2024a). Studies have highlighted that natural factors exert a greater impact on ecological quality variation than anthropogenic and disaster-related factors. Among these, climate variability (e.g., precipitation and temperature) and topographic features (e.g., elevation, slope) (Liu et al., 2023, Liu et al., 2024; Yang et al., 2023; He et al., 2025) are recognized as primary drivers of ecological change in earthquake-affected areas.
In recent years, significant progress has been made in the assessment of ecological environment quality and its driving mechanisms in earthquake-stricken areas, providing a scientific basis for post-disaster ecological restoration and protection. However, existing studies remain largely focused on typical earthquake cases (e.g., the Wenchuan Earthquake in China (Yunus et al., 2020), the Chi-Chi Earthquake in Taiwan (Chou et al., 2009), the Kumamoto Earthquake in Japan (Saito et al., 2022), and the Gorkha Earthquake in Nepal (Maerki et al., 2021)). In contrast, much less attention has been paid to the seismically active regions of the Yunnan–Guizhou Plateau, particularly the plateau–mountain earthquake disaster areas represented by the Ludian earthquake in Yunnan. At present, the impacts of earthquakes on the ecological environment of the Ludian region and its ecological recovery processes remain unclear, necessitating in-depth research. Moreover, the Ludian disaster area is located on the northeastern edge of the Yunnan-Guizhou Plateau, characterized by steep and deeply incised mid-mountain topography, with particularly significant terrain fragmentation and local slopes (Wang et al., 2016). The lithology is dominated by easily weathered carbonate rocks which have weak erosion resistance, and this, combined with concentrated heavy rainfall from the subtropical monsoon climate (Hu et al., 2007), further exacerbates the risk of secondary disasters such as landslides and debris flows after earthquakes. These unique natural conditions and disaster contexts may lead to a significantly different response pattern of the ecosystem to seismic disturbances in this region compared to other earthquake-affected areas. However, systematic and targeted research on the post-earthquake response mechanisms of ecosystems in such special regions is still lacking.
Therefore, this study takes the 2014 Ludian Earthquake (Mw 6.5) as a case study. Leveraging the Google Earth Engine (GEE) platform, the RSEI was constructed to quantify the impacts of the earthquake on Ludian’s ecological environment and analyze the dynamics of ecological recovery over nearly a decade. Geodetector was used to identify key factors driving spatial variations in ecological quality and reveal their underlying mechanisms. The findings aim to provide theoretical support and practical guidance for ecological monitoring and restoration in plateau mountain earthquake-affected areas. particularly the plateau–mountain earthquake disaster areas represented by the Ludian earthquake in Yunnan.
2 Materials and methods
2.1 Study area
Ludian County (26°59′–27°32′ N, 103°09′–103°40′ E) is located in northeastern Yunnan Province and is administratively part of Zhaotong City (Figure 1), covering approximately 1,484 km². The region is characterized by a complex topography, with higher elevations in the eastern and western sectors forming a frame around a relatively flat central basin. Over 80% of the area consists of mountainous terrain. The county has a low-latitude mountain monsoon climate, characterized by minimal seasonal temperature variations and distinct vertical climatic zonation. The annual mean temperature is 12.1°C, and the average annual precipitation reaches 923.5 mm, defining it as a typical plateau mountain ecosystem.
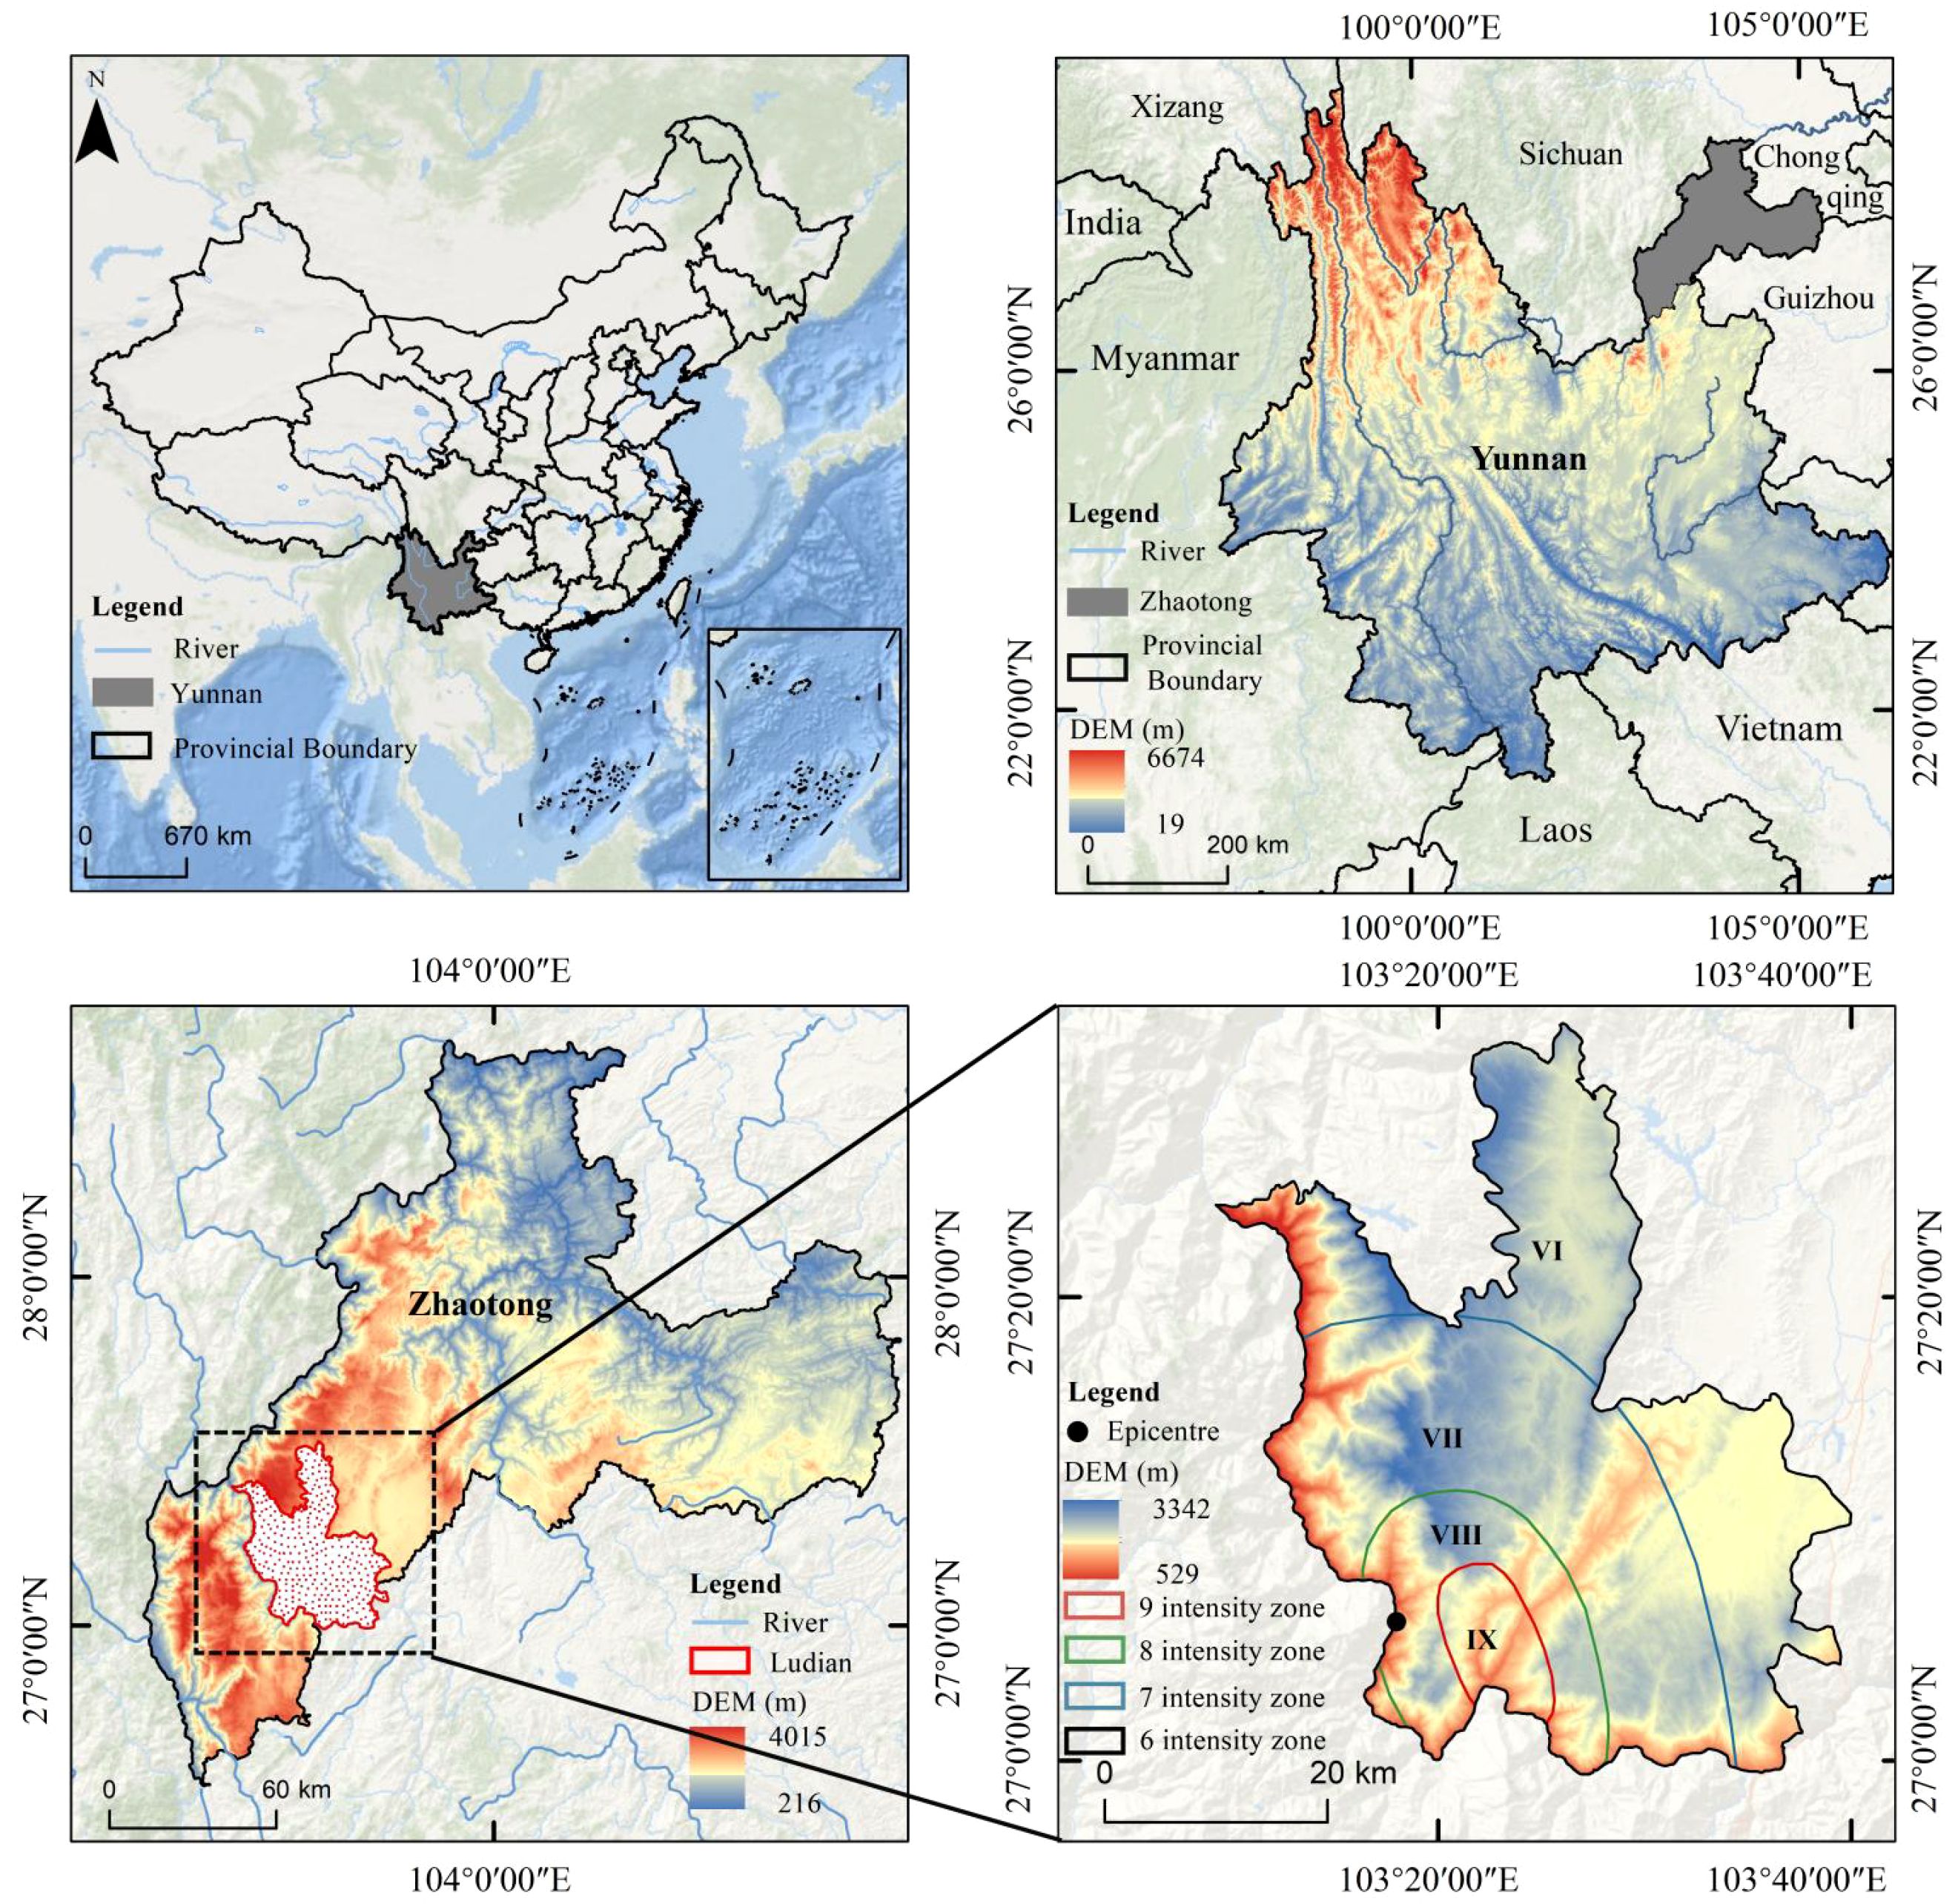
Figure 1. Location of the study area.
On August 3, 2014, an Mw 6.5 earthquake occurred in Ludian County (27.1°N, 103.3°E). The event, associated with the northeast-striking Xiaoyuhe–Zhaotong Fault system, was characterized by strike-slip faulting mechanisms. The maximum intensity reached IX on the China Seismic Intensity Scale, with the VI+ intensity zone covering approximately 10,350 km². The combined effects of steep mountainous terrain and concurrent summer monsoon rains triggered widespread secondary disasters, including catastrophic landslides, rockfalls, and debris flows, leading to severe ecosystem degradation and long-term environmental instability.
2.2 Data sources and preparation
The data used in this study were categorized into three main types:
1. Remote Sensing Data.
The imagery used in this study was obtained from the Google Earth Engine (GEE) platform (https://earthengine.google.com/). During the image selection process, strict criteria were applied to control cloud cover and ensure seasonal consistency. However, for the years 2016, 2018, and 2020, all available Landsat images over the study area were severely affected by extensive cloud contamination. After comprehensive screening, no cloud-free or low-cloud scenes meeting the quality requirements were available, and thus these years were excluded from the analysis. Consequently, six periods of Landsat 8 OLI/TIRS imagery were selected, including pre-earthquake (2013), immediate post-earthquake (2014), and recovery phases (2015, 2017, 2019, and 2021), with a spatial resolution of 30 m, to ensure data quality and the reliability of time-series analysis. For the selected years, imagery from October to December was processed systematically, including cloud masking, median compositing, study area clipping, and water body removal.
2. Administrative Boundary Data.
The vector boundary of Ludian County was obtained from the Yunnan Province Geographic Information Public Service Platform(https://yunnan.tianditu.gov.cn/index).
3. Influencing Factor Data.
① Natural Factors:
Seismic Intensity: Data sourced from the Yunnan Earthquake Agency (https://www.yndzj.gov.cn) divided the area into four intensity levels: VI, VII, VIII, and IX.
Soil Type: Classified based on the FAO-96 system from the World Soil Database (https://www.fao.org/soils-portal) at a spatial resolution of 1 km.
Topographic Data: Derived from ASTER Gdem V2 provided by the USGS (https://glovis.usgs.gov) at a spatial resolution of 30 m, from which slope and aspect data were extracted.
Meteorological Data: Daily precipitation and mean temperature data were sourced from the Resource and Environment Data Cloud Platform (https://www.resdc.cn). Using data from stations within and around the study area, Kriging interpolation generated 30 m resolution meteorological grids.
② Anthropogenic Factors:
Road Data: Sourced from the OpenStreetMap dataset (https://www.openstreetmap.org) and converted into 30 m resolution raster maps using Euclidean distance analysis in ArcGIS.
Population density data: Obtained from the WorldPop project (https://www.worldpop.org/), with a spatial resolution of 100 m.
All datasets were standardized and resampled to a uniform 30 m resolution to ensure spatial consistency. The framework diagram of this study is shown in Figure 2.
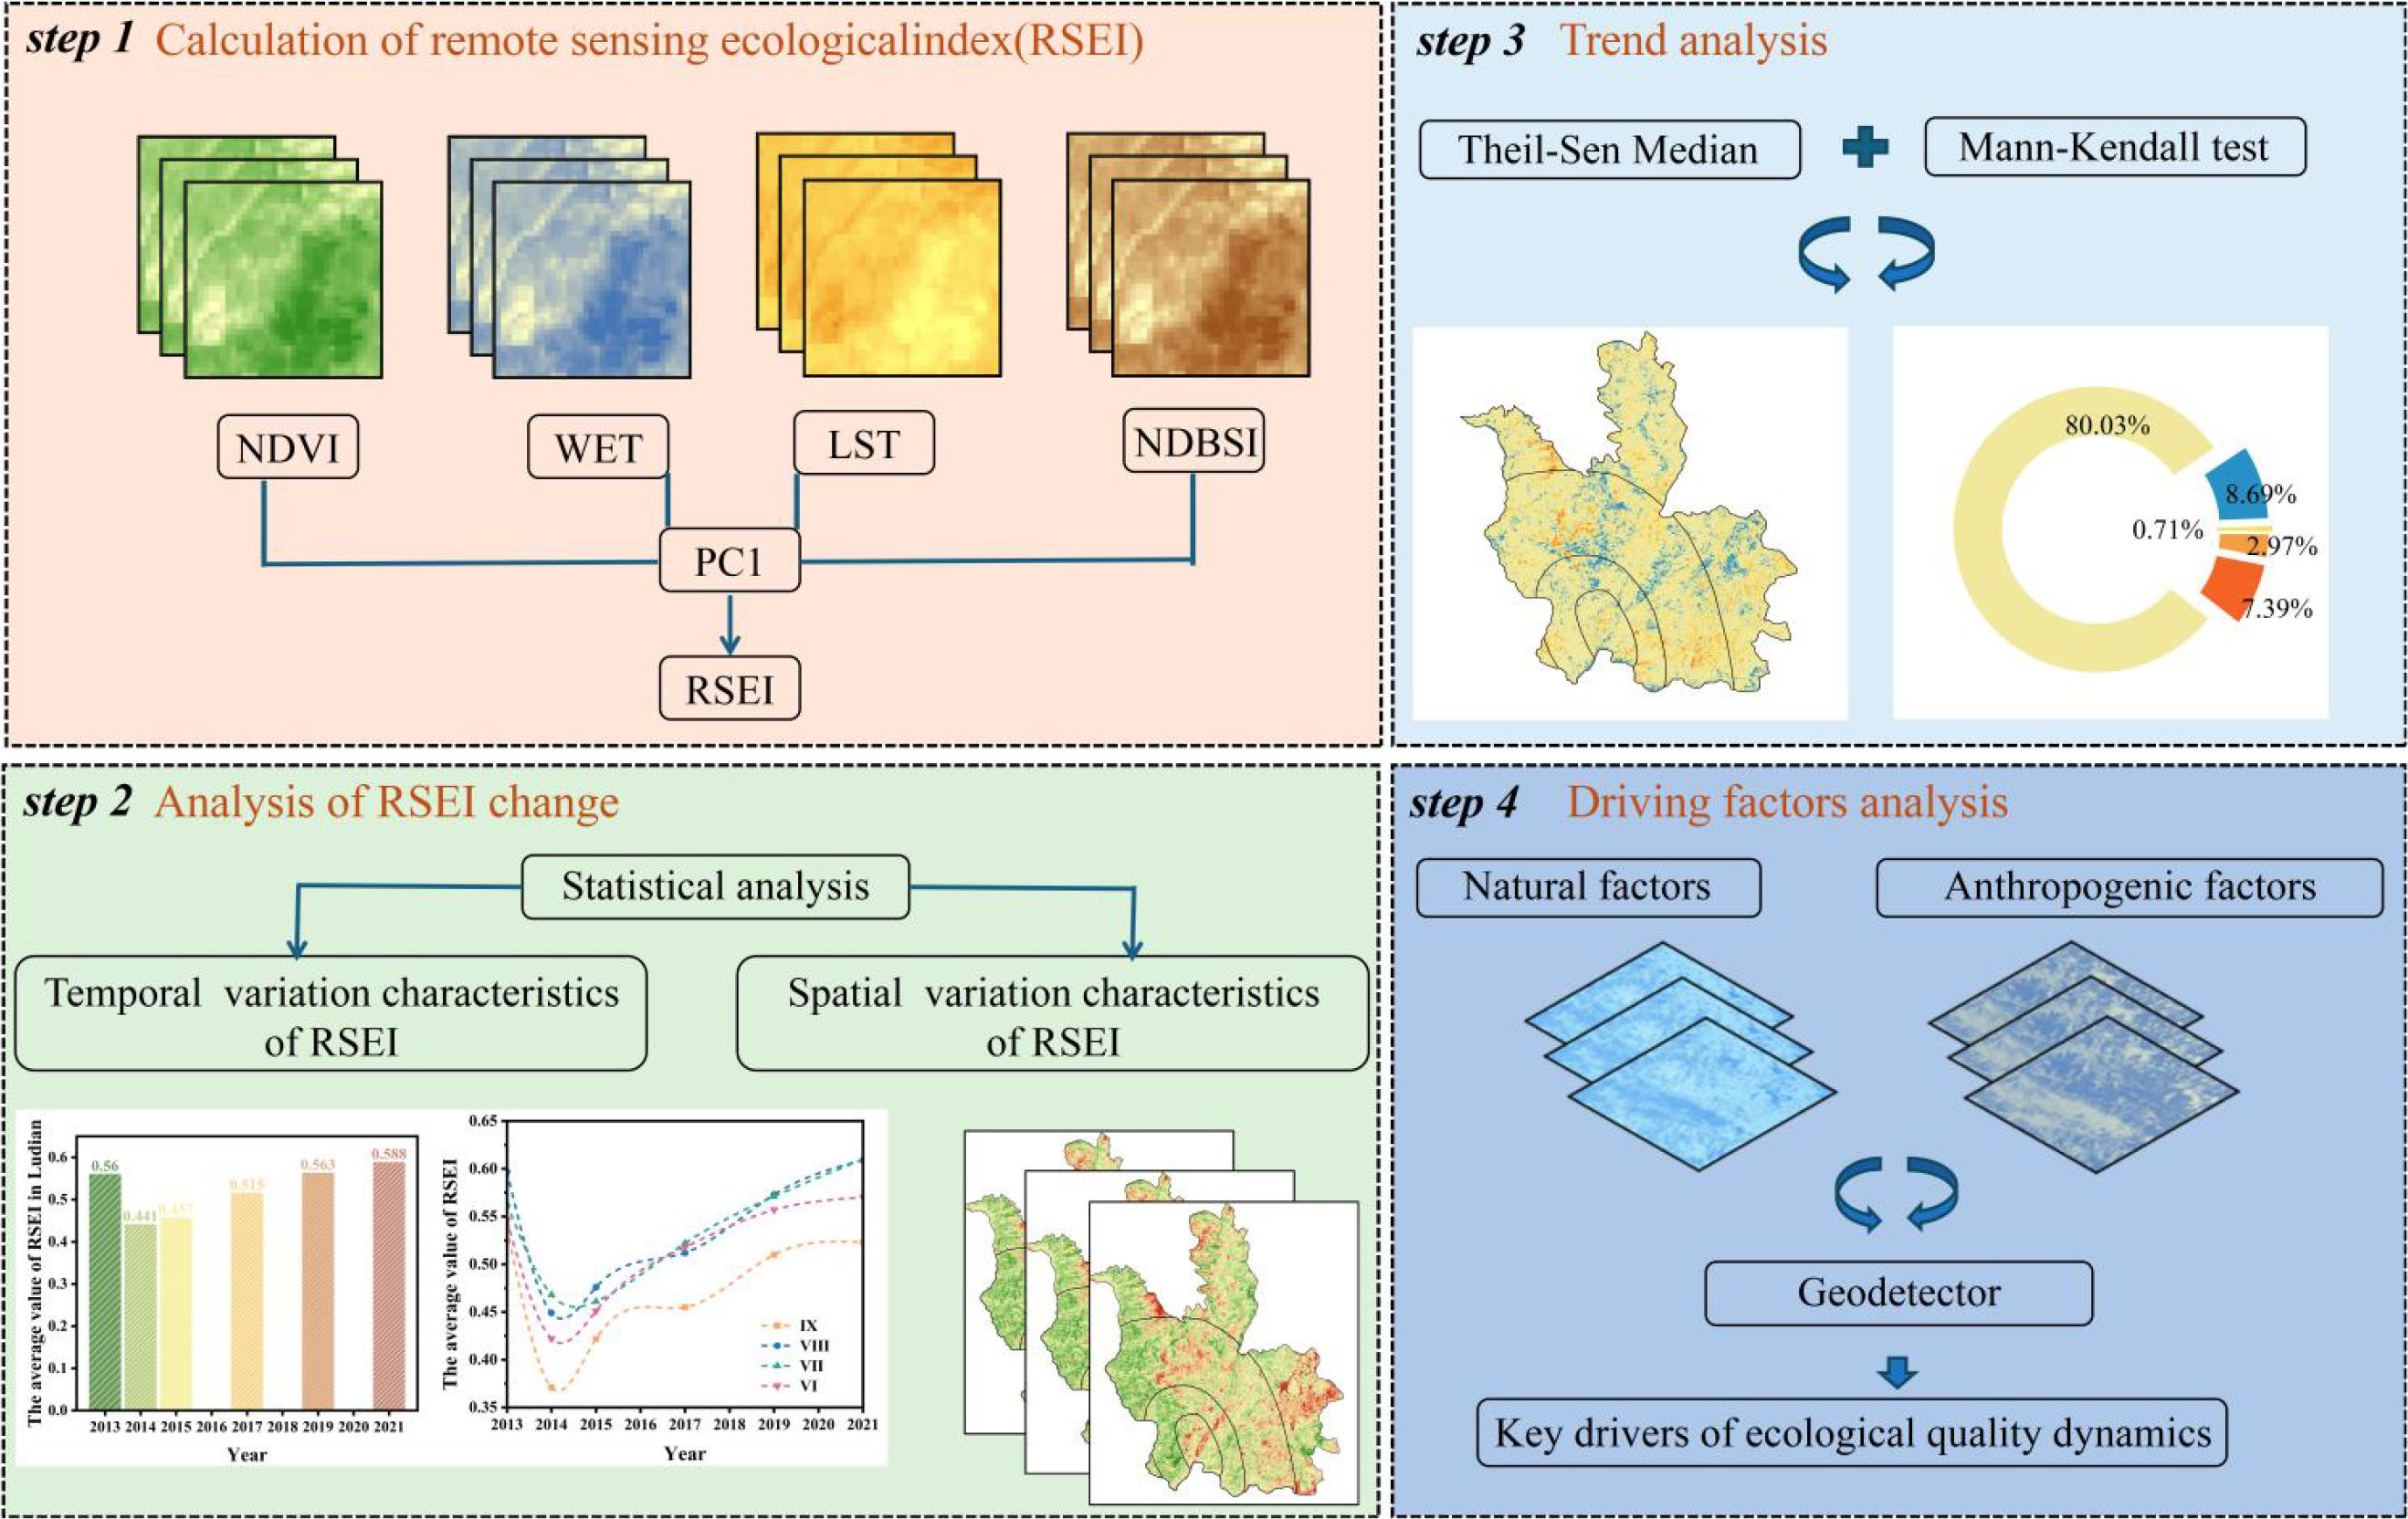
Figure 2. Framework of the study.
2.3 Research method
2.3.1 Computation of RSEI
The RSEI integrates four component indices—wetness(WET), greenness(NDVI), heat(LST), and dryness(NDBSI)—through principal component analysis to dynamically monitor regional ecological quality. The indicators were calculated as follows:
1. Wetness Index (WET).
The WET was derived using the tasseled cap transformation to capture soil and vegetation moisture.
Where: ρblue, ρgreen, ρred, ρNIR, ρSWIR1, ρSWIR2 represent the reflectance of the blue, green, red, near-infrared, shortwave infrared 1, and shortwave infrared 2 bands of Landsat 8 imagery, respectively. b1, b2, b3, b4, b5, b6 correspond to the respective bands in OLI/TIRS imagery, with values of 0.1511, 0.1973, 0.3283, 0.3407, -0.7117, and -0.4559, respectively.
(2) Greenness Index(NDVI).
The greenness index was represented by the normalized difference vegetation index (NDVI), which reflects vegetation growth and coverage.
Where: ρNIR, ρred represent the reflectance of the near-infrared and red bands of Landsat 8 imagery, respectively.
(3) Heat Index(LST).
The heat index was derived from land surface temperature (LST), indicating heat exchange and balance within the terrestrial environment.
Where: K1 and K2 are calibration parameters, and B(TS) represents the radiance of a blackbody at temperature T in the thermal infrared band.
(4) Dryness Index(NDBSI).
The dryness index was calculated as the average of the normalized difference built-up and soil index (NDBSI) and soil index (SI), representing land degradation and urbanization.
Where: SI is the Soil Index. IBI is the Built-up Index. ρgreen, ρred, ρNIR, and ρSWIR1 respectively represent the reflectance of the green, red, near-infrared, and shortwave infrared 1 bands of Landsat 8 imagery. The calculation of the four component indices is shown in Equations 1–6.
2.3.2 Construction of the RSEI model
1. Standardization of Component Indicators.
To avoid calculation errors caused by the inconsistent dimensions of the four indicators, standardization was performed before calculating the Remote Sensing Ecological Index. The calculation formula is as follows:
Where: NIi represents the standardized indicator value. Ii is the value of the corresponding indicator at the ith pixel. Imax and Imin are the maximum and minimum values of the indicator, respectively.
2. Calculation of the RSEI.
Where: WET represents wetness. NDVI represents greenness. LST represents heat. NDBSI represents dryness. The methods for standardization and RSEI calculation are detailed in Equation 7 and 8.
After calculating the RSEI results, following existing studies (Du et al., 2025), the RSEI values were normalized to the [0, 1] range. Using the equal-interval method, the ecological environment quality of the Ludian area during the pre-seismic, post-seismic, and recovery periods was classified into five levels: poor (0 ≤ RSEI< 0.2), fair (0.2 ≤ RSEI< 0.4), moderate (0.4 ≤ RSEI< 0.6), good (0.6 ≤ RSEI< 0.8), and excellent (0.8 ≤ RSEI ≤ 1.0).
2.3.3 Trend analysis
The Theil-Sen slope estimation combined with the Mann-Kendall significance test can effectively evaluate the significance of trend changes, offering strong resistance to biases caused by outliers. In this study, the Sen + Mann-Kendall significance trend test method is employed to estimate the ecological environmental quality trends in Ludian before the earthquake, after the earthquake, and during the recovery period.
Where: β represents the median slope. RSEIj and RSEIi are the RSEI values for year j and year i, respectively. β < 0 indicates a trend of ecological environmental quality degradation, while β > 0 indicates a trend of improvement in ecological environmental quality. The trend analysis method in Equation 9.
The Mann-Kendall method is used to test the significance of the trends, with the trend characteristics summarized in the Table 1.
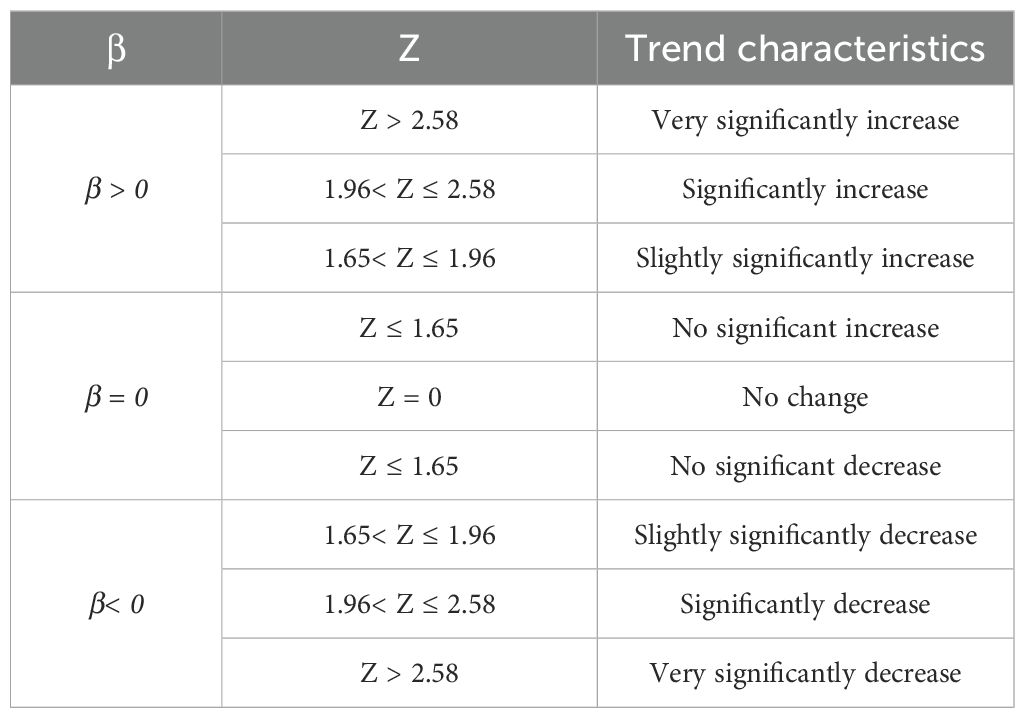
Table 1. Trend test categories.
2.3.4 Geodetector
Geodetector serves as a key tool for identifying the driving forces behind the spatial differentiation of dependent variables (Wang and Hu, 2012; Wang et al., 2010; Wang and Xu, 2017). Based on existing research (Zhou et al., 2024; Xia et al., 2025) and a comprehensive consideration of the primary factors influencing ecological environment quality as well as data availability, this study selected the following 10 factors as independent variables: Earthquake intensity, Slope, Soil type, Dem, Temperature, Aspect, Precipitation, Population Density, Distance to town, Distance to road. The RSEI values before the earthquake, after the earthquake, and during the recovery period were used as dependent variables. The factor detection and interaction detection modules were employed to explore the influencing factors of the spatial differentiation of ecological quality recovery in Ludian. The calculation formulas are as follows.
Factor detector: This detects the spatial differentiation of the dependent variable and clarifies the extent to which different driving factors explain the spatial differentiation of RSEI, measured by the q-value:
Where: h = 1,…, L represents the stratification of RSEI or different driving factors. Nh and N denote the number of pixels in each classification of the respective data and the total number of pixels, respectively. and σ² represent the variance of RSEI for pixels in each classification of the respective data and the overall variance of RSEI for all pixels in the entire region. SSW and SST indicate the sum of variances for each classification of the data and the total variance of the entire region, respectively. A higher q-value suggests that the driving factor has a greater contribution to explaining the spatial heterogeneity of RSEI. The calculation of the q-statistic is given by Equation 10.
Interaction Detection: Evaluates the explanatory power of two distinct driving factors acting simultaneously on an object regarding its spatial heterogeneity. The types of interactions are categorized as follows (Table 2).
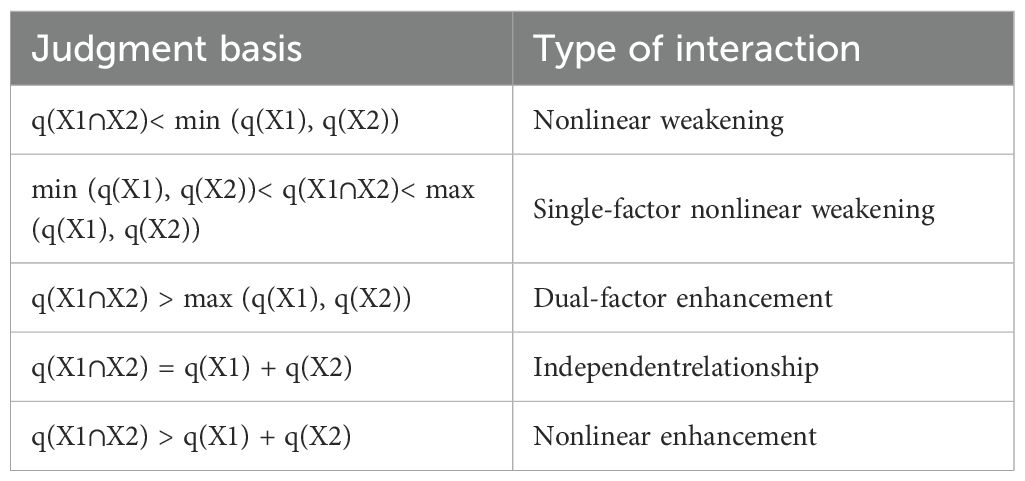
Table 2. Types of interactions.
3 Results
3.1 Applicability test of the RSEI model
Principal component analysis was performed on the four RSEI indicators for Ludian during the pre-earthquake, post-earthquake, and recovery periods. The results showed that the first principal component (PC1) contributed between 60.41% and 74.64% across all years, with an average contribution rate exceeding 67% (Table 3). PC1 effectively captured the primary characteristics of each indicator and accurately reflected the regional ecological quality.
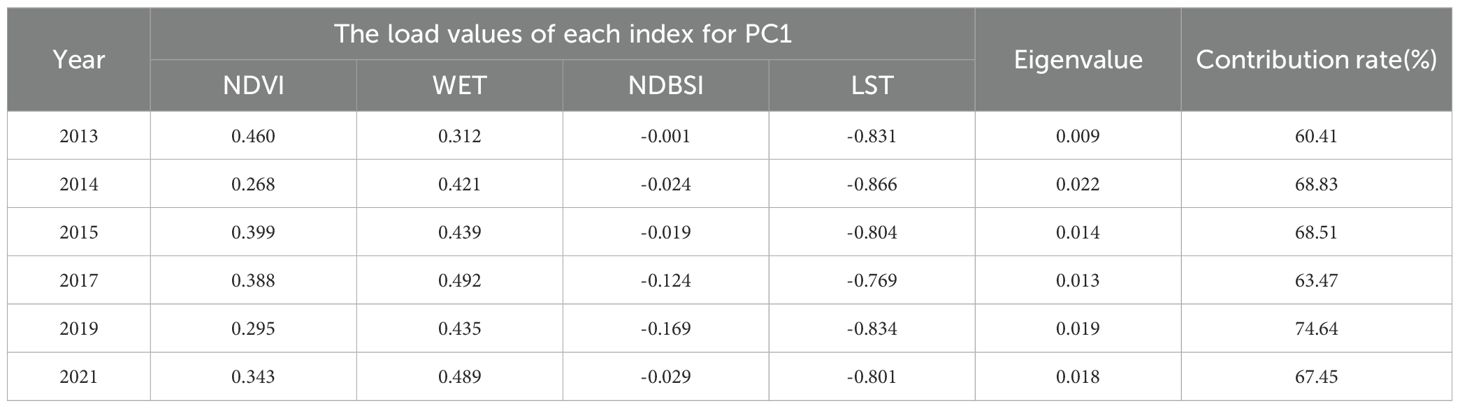
Table 3. Statistical loadings and PC1 contributions of various indicators in the study area during pre-earthquake, post-earthquake, and recovery periods.
The loadings for NDVI and WET were consistently positive on PC1, indicating their positive influence on ecological quality. Conversely, the loadings of NDBSI and LST were negative, highlighting their adverse effects. These findings validate the applicability and reliability of the RSEI model in the study area.
3.2 Temporal and spatial evolution characteristics of ecological quality
3.2.1 Time distribution characteristics
On a regional scale (Figure 3A), the Ludian Earthquake caused significant ecological damage. The mean RSEI value decreased from 0.560 before the earthquake to 0.441 afterward, a relative decline of 21.3%, indicating severe disruption to the ecosystem. The subsequent recovery process exhibited distinct phases: (1) Rapid Recovery Phase (2015–2017): The RSEI increased from 0.457 to 0.515, with an annual growth rate of 3.9%. (2) Stable Recovery Phase (2017–2019): The RSEI reached 0.563, recovering to pre-earthquake levels (0.560), with an annual growth rate of 2.3%. (3) Stable Transcendence Phase (2019–2021): The RSEI further increased to 0.588, exceeding pre-earthquake levels by 5%.
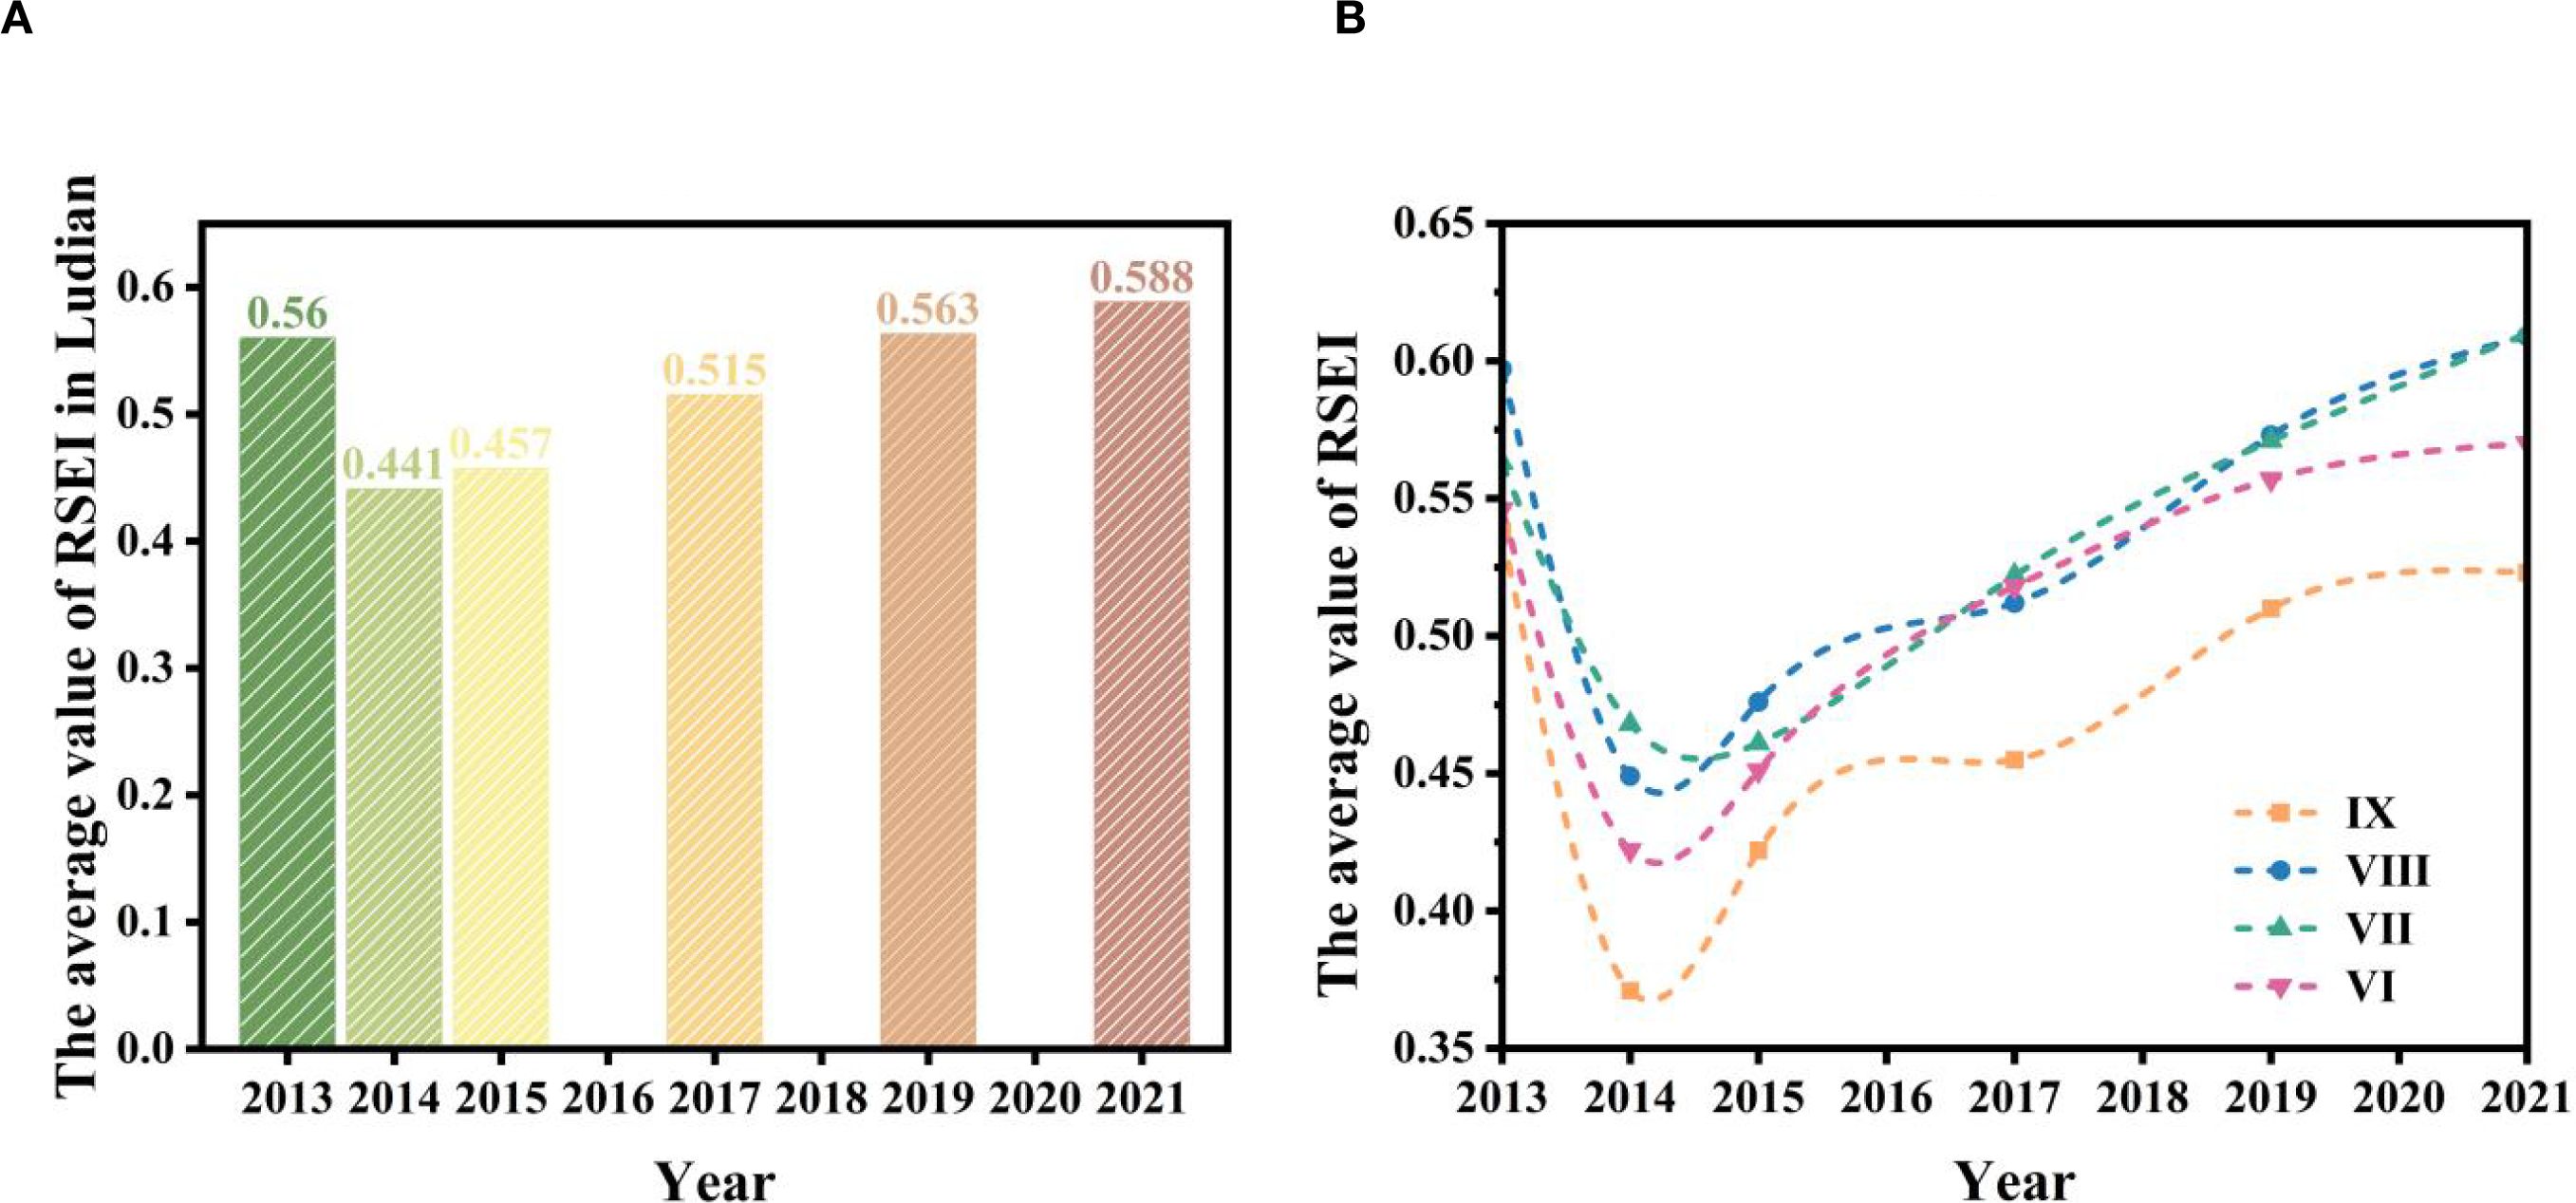
Figure 3. The average RSEI value of Ludian (A). The average RSEI values in different seismic intensity zones of Ludian (B).
In different seismic intensity zones (Figure 3B), the pre-earthquake RSEI values were relatively high across all zones (IX zone: 0.538, VIII zone: 0.597, VII zone: 0.563, VI zone: 0.546), indicating favorable ecological conditions. Post-earthquake, the RSEI values declined significantly (IX zone: 0.371, VIII zone: 0.449, VII zone: 0.468, VI zone: 0.422), with the IX zone experiencing the largest decline (31.0%) and the VII zone the smallest (16.9%), reflecting that higher-intensity zones suffered more severe ecological damage.
During the recovery period, the RSEI values generally increased, though the rate of recovery gradually slowed. By 2021, all zones except the IX zone (0.523) had exceeded their pre-earthquake levels, with values reaching 0.609 in the VIII zone, 0.610 in the VII zone, and 0.570 in the VI zone. The VIII and VII zones showed the most significant recovery, surpassing pre-earthquake levels by 8.3% and 2.0%, respectively. This indicates that after seven years of restoration, the ecological environment in most areas had not only recovered but also improved beyond its pre-earthquake state. Although the IX zone had not fully returned to its pre-earthquake level (remaining 2.8% lower), its RSEI value had rebounded by 41.0% from the post-earthquake minimum, demonstrating strong recovery potential.
3.2.2 Spatial distribution characteristics
Based on existing research (Du et al., 2025), the RSEI was normalized to the range [0, 1], and the equal interval method was used to classify the ecological environmental quality of the Ludian area from 2013 to 2021 into five grades: poor (RSEI value 0–0.2), fair (0.2–0.4), moderate (0.4–0.6), good (0.6–0.8), and excellent (0.8–1.0).
As shown in Table 4, Pre-earthquake, the region was dominated by moderate (919.7 km²) and good (605.63 km²) quality levels, with a limited area of excellent quality (15.76 km²), indicating favorable ecological conditions but restricted high-quality zones. Post-earthquake, the ecological quality deteriorated significantly, with areas of poor and fair quality increasing to 37.01 km² and 656.04 km², respectively, while moderate, good, and excellent areas declined sharply.
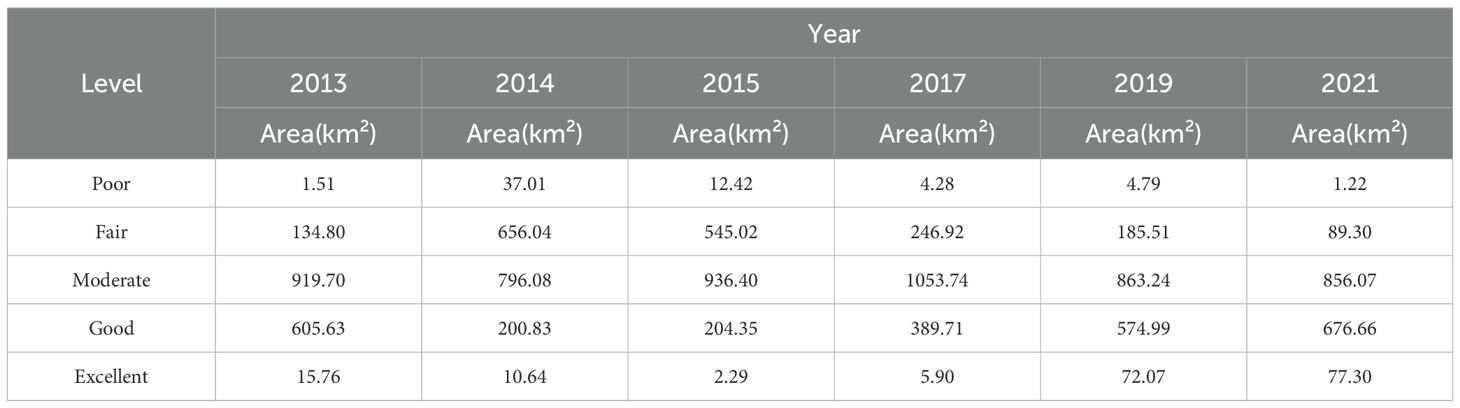
Table 4. Statistical values of ecol-environment quality level in the pre-earthquake period, post-earthquake period and recovery periods.
During the recovery period, ecological quality showed sustained improvement. By 2021, poor quality areas decreased to 1.22 km², and fair quality areas shrank to 89.3 km². Meanwhile, good and excellent quality areas increased to 676.66 km² and 77.3 km², respectively, surpassing pre-earthquake levels. These results highlight the effectiveness of restoration measures in promoting ecological quality, with the area of excellent quality increasing nearly fivefold compared to pre-earthquake conditions.
Spatially (Figure 4), the ecological environment quality of Ludian was relatively good before the earthquake, with the RSEI generally exhibiting a spatial pattern of higher values predominated in the western regions, contrasting with lower values in eastern areas. Specifically, high RSEI areas were mainly concentrated in the western parts of the VI–VIII intensity zones, while low RSEI areas were primarily distributed in the northeastern and southeastern parts of the VI zone, as well as the central-southern parts of the VII and IX zones.
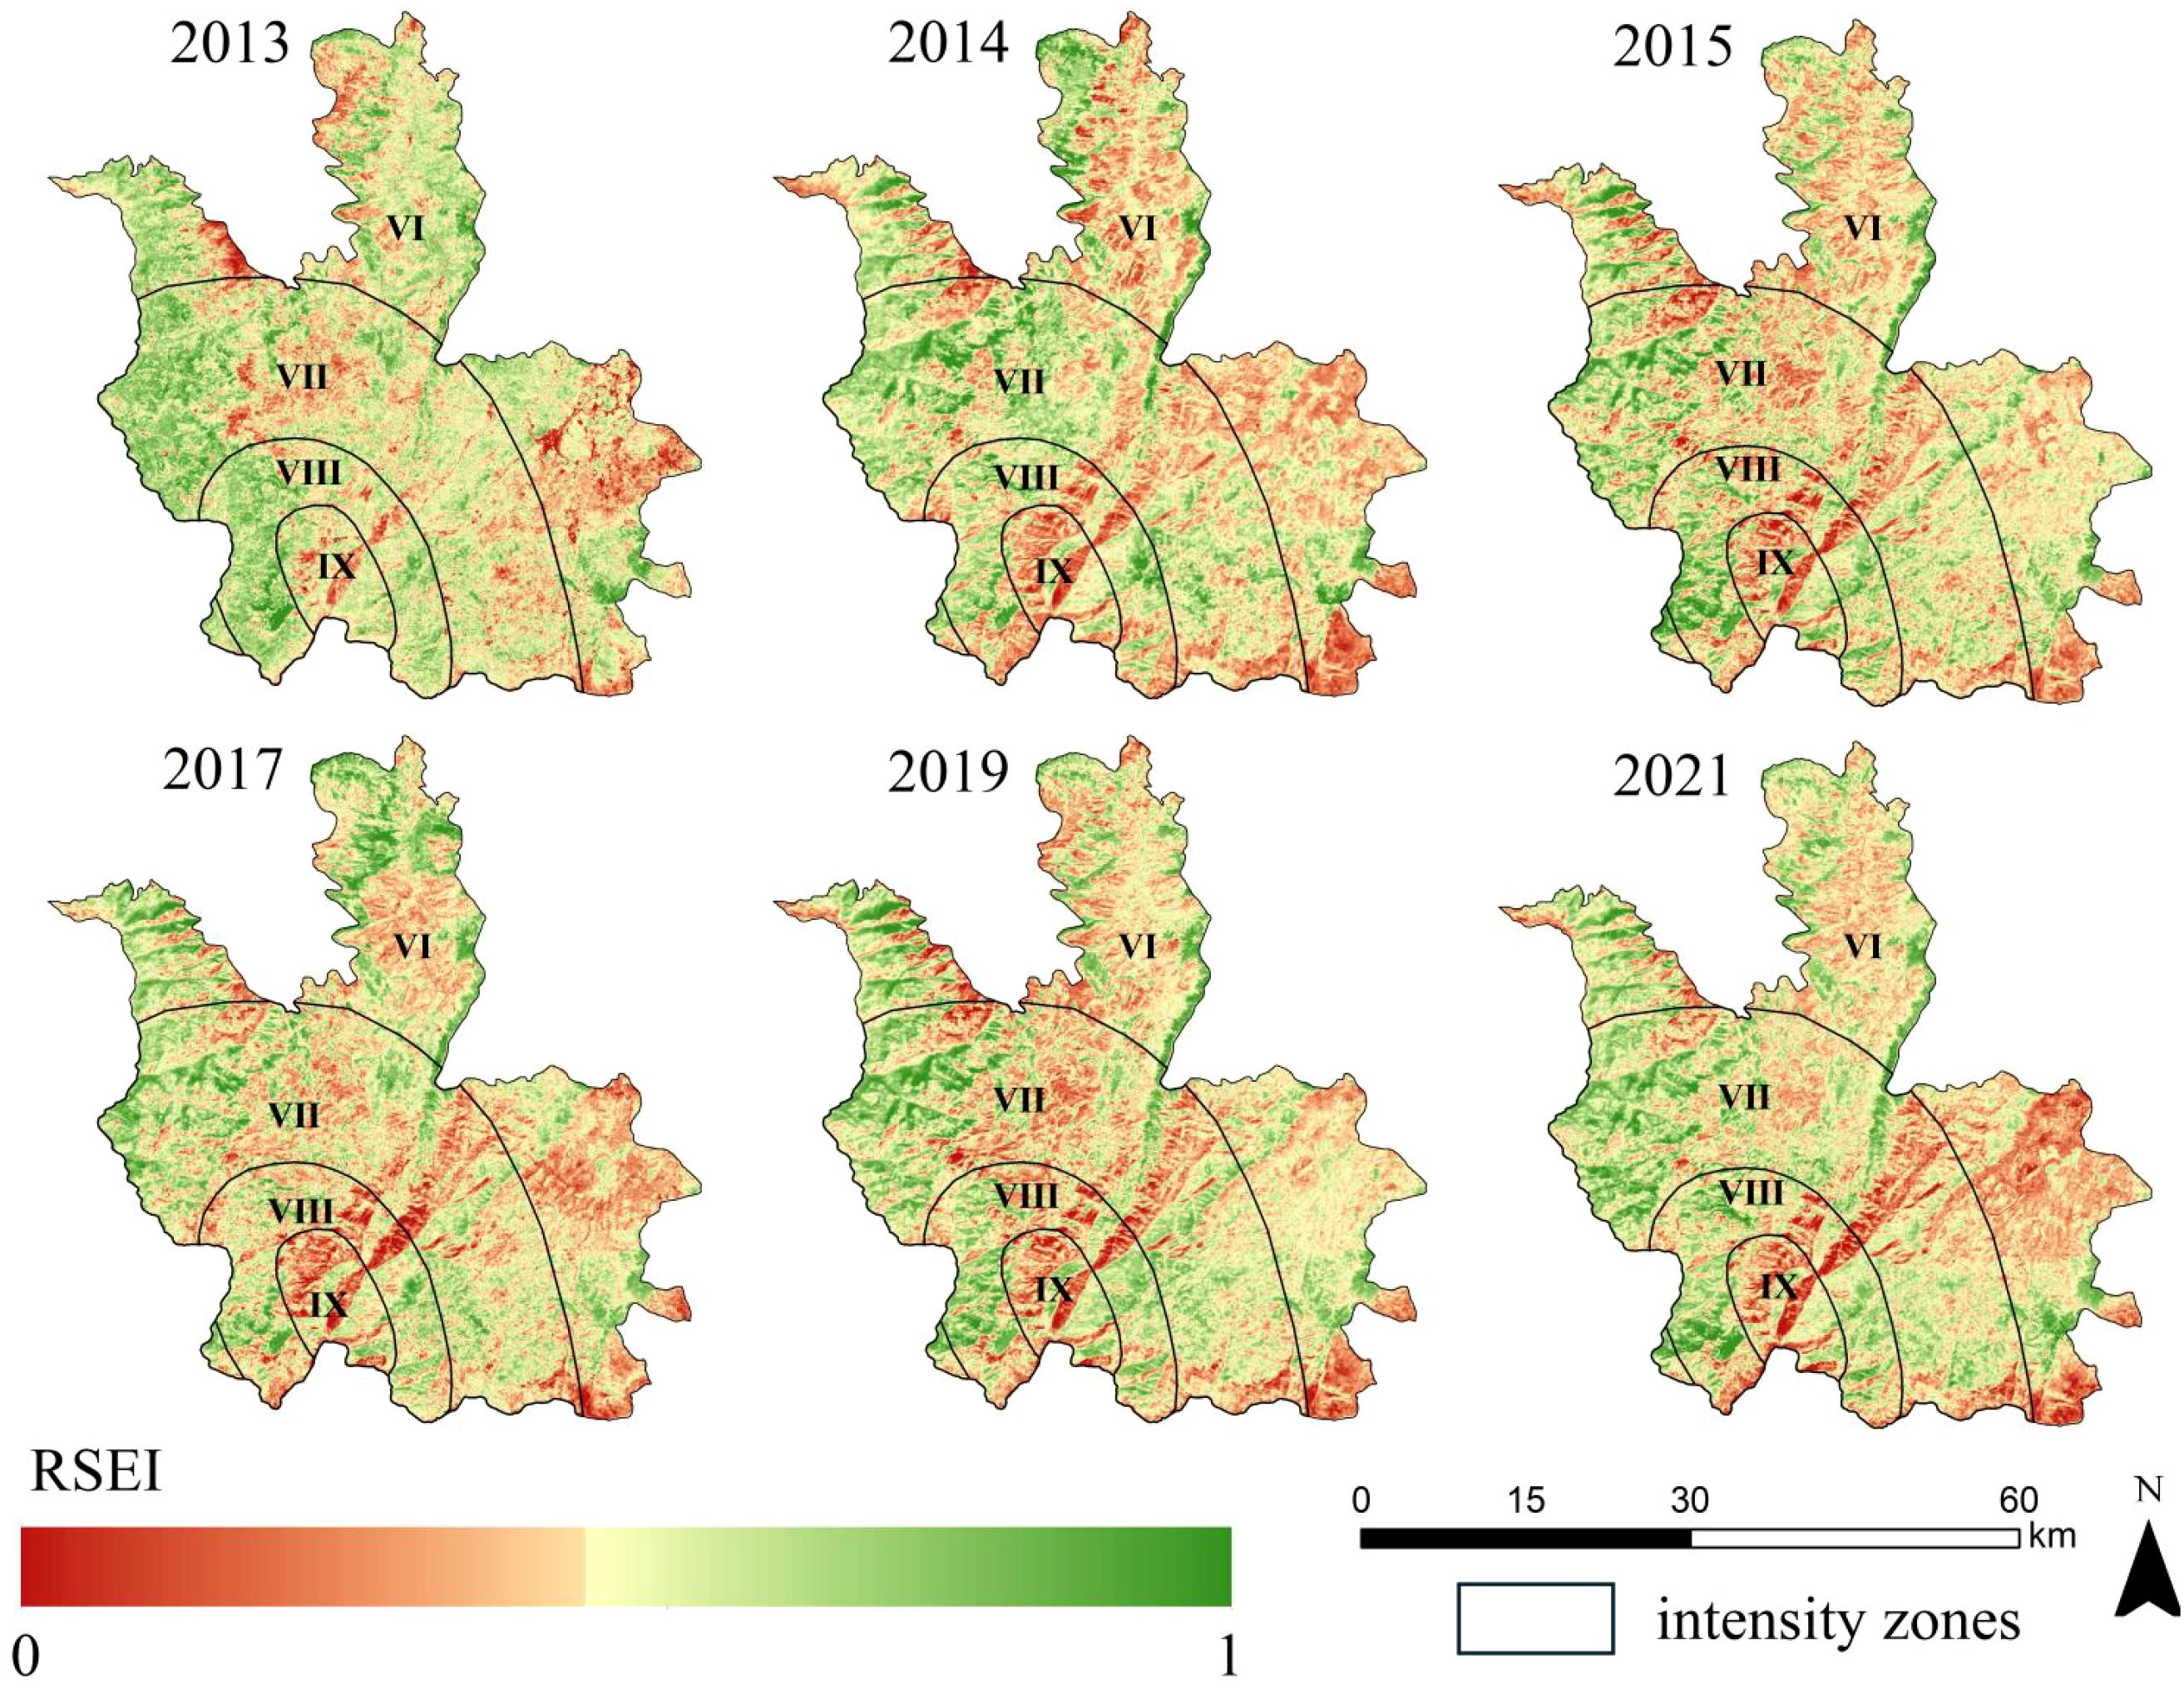
Figure 4. Spatial distribution characteristics of RSEI in Ludian during pre-earthquake, post-earthquake, and recovery periods.
After the earthquake, the ecological environment quality deteriorated sharply, particularly in the central-northern part of the IX zone and the northeastern part of the VIII zone, where RSEI values decreased significantly, indicating severe ecological damage. Meanwhile, RSEI values in the northeastern and southeastern parts of the VI zone and the southeastern part of the VII zone also showed a notable decline.
During the recovery period, the overall ecological environment quality of Ludian improved, with RSEI values gradually increasing in most areas of the VI–VIII zones, reflecting progressive ecological restoration. However, the recovery process lagged in severely damaged regions such as the central-northern part of the IX zone, where significant ecological degradation persisted. These findings suggest that while ecological restoration efforts have been effective, regional disparities remain, particularly in high-intensity zones, which still require focused attention and sustained investment to achieve comprehensive ecological recovery and sustainable development.
The ecological quality levels in different seismic intensity zones were classified (Figure 5). Before the earthquake, most zones were dominated by moderate and good quality levels. In the VII zone, the area of moderate quality reached 387.37 km², reflecting relatively good overall ecological conditions. After the earthquake, ecological quality in all intensity zones deteriorated sharply, with a notable increase in the area classified as poor quality. In the IX zone, the poor quality area increased from 0.18 km² to 7 km², while the proportions of fair and moderate quality areas also expanded. In the VIII zone, the area classified as fair quality rose from 8.63 km² to 84.67 km², with the most severe degradation observed in the high-intensity zones.
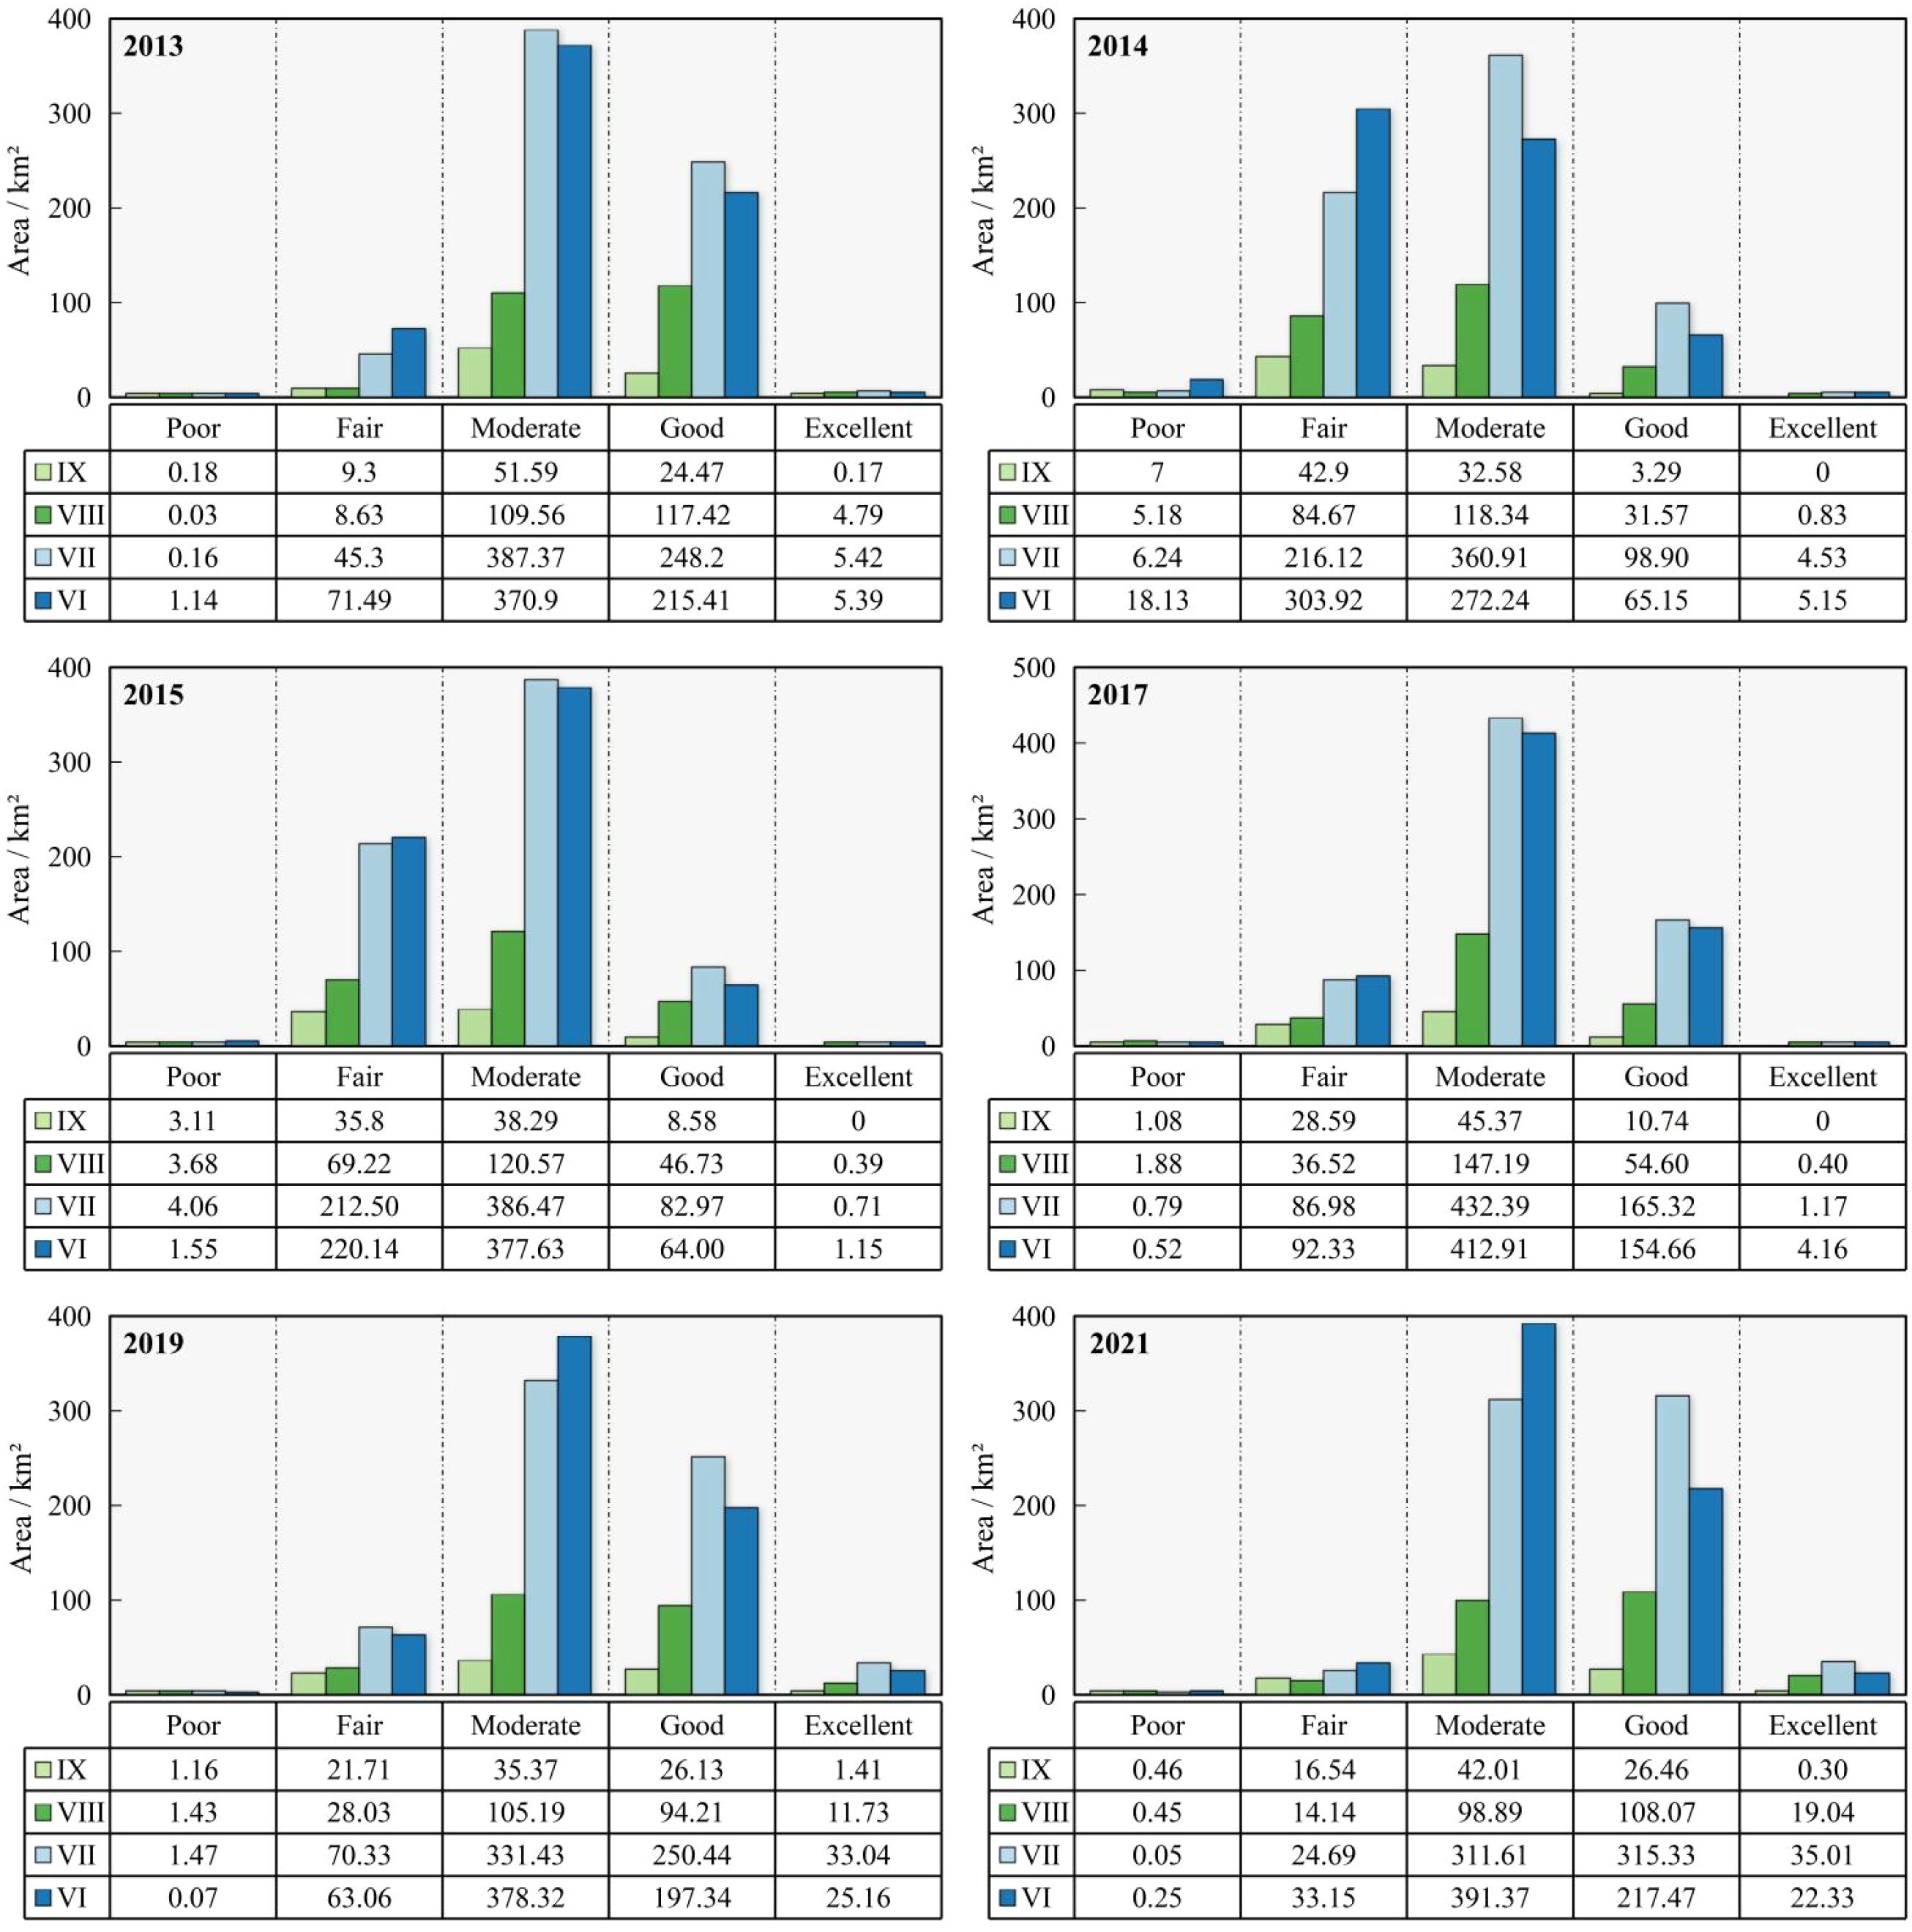
Figure 5. Statistical values of ecological environment quality grades in different seismic intensity zones during pre-earthquake, post-earthquake and recovery periods.
During the recovery period, ecological quality gradually improved. Poor quality areas steadily decreased, with the IX zone reducing to 0.46 km² by 2021 and the VI zone decreasing from 1.14 km² to 0.25 km². At the same time, areas of good and excellent quality increased significantly. In the VII zone, the good quality area grew from 82.97 km² in 2015 to 315.33 km² in 2021, while in the VIII zone, the excellent quality area expanded from 0.83 km² to 19.04 km². The recovery rates varied significantly across intensity zones. Low-intensity zones (e.g., VI zone) recovered faster, with a steady increase in the proportion of excellent quality areas, whereas high-intensity zones (e.g., IX zone) experienced slower recovery, requiring a longer restoration period.
Overall, the earthquake caused short-term ecological degradation, but long-term restoration measures effectively improved ecological quality. However, areas with higher damage levels exhibited longer recovery cycles.
3.3 Spatiotemporal trends in ecological quality variation
Using MATLAB, the Theil-Sen median trend analysis combined with the Mann-Kendall test was employed to evaluate changes in the ecological quality of Ludian before and after the earthquake. The results (Figure 6) showed that the overall ecological quality in the study area improved, with approximately 1,353 km² (91% of the total area) experiencing varying degrees of enhancement, indicating significant success in post-earthquake ecological protection and restoration efforts. Areas showing Very significantly increase and Significantly increase accounted for 0.71% and 2.97% of the total area, respectively. Areas showing Slightly significantly increase or No significant increase accounted for 7.39% and 80.03% of the total area, respectively. In contrast, about 130 km² (8.75% of the total area) experienced varying degrees of ecological degradation: Areas showing Very significantly decrease and Significantly decrease accounted for only 0.01% and 0.02% of the total area, respectively. Areas showing Slightly significantly decrease or No significant decrease accounted for 0.04% and 8.69% of the total area, respectively.
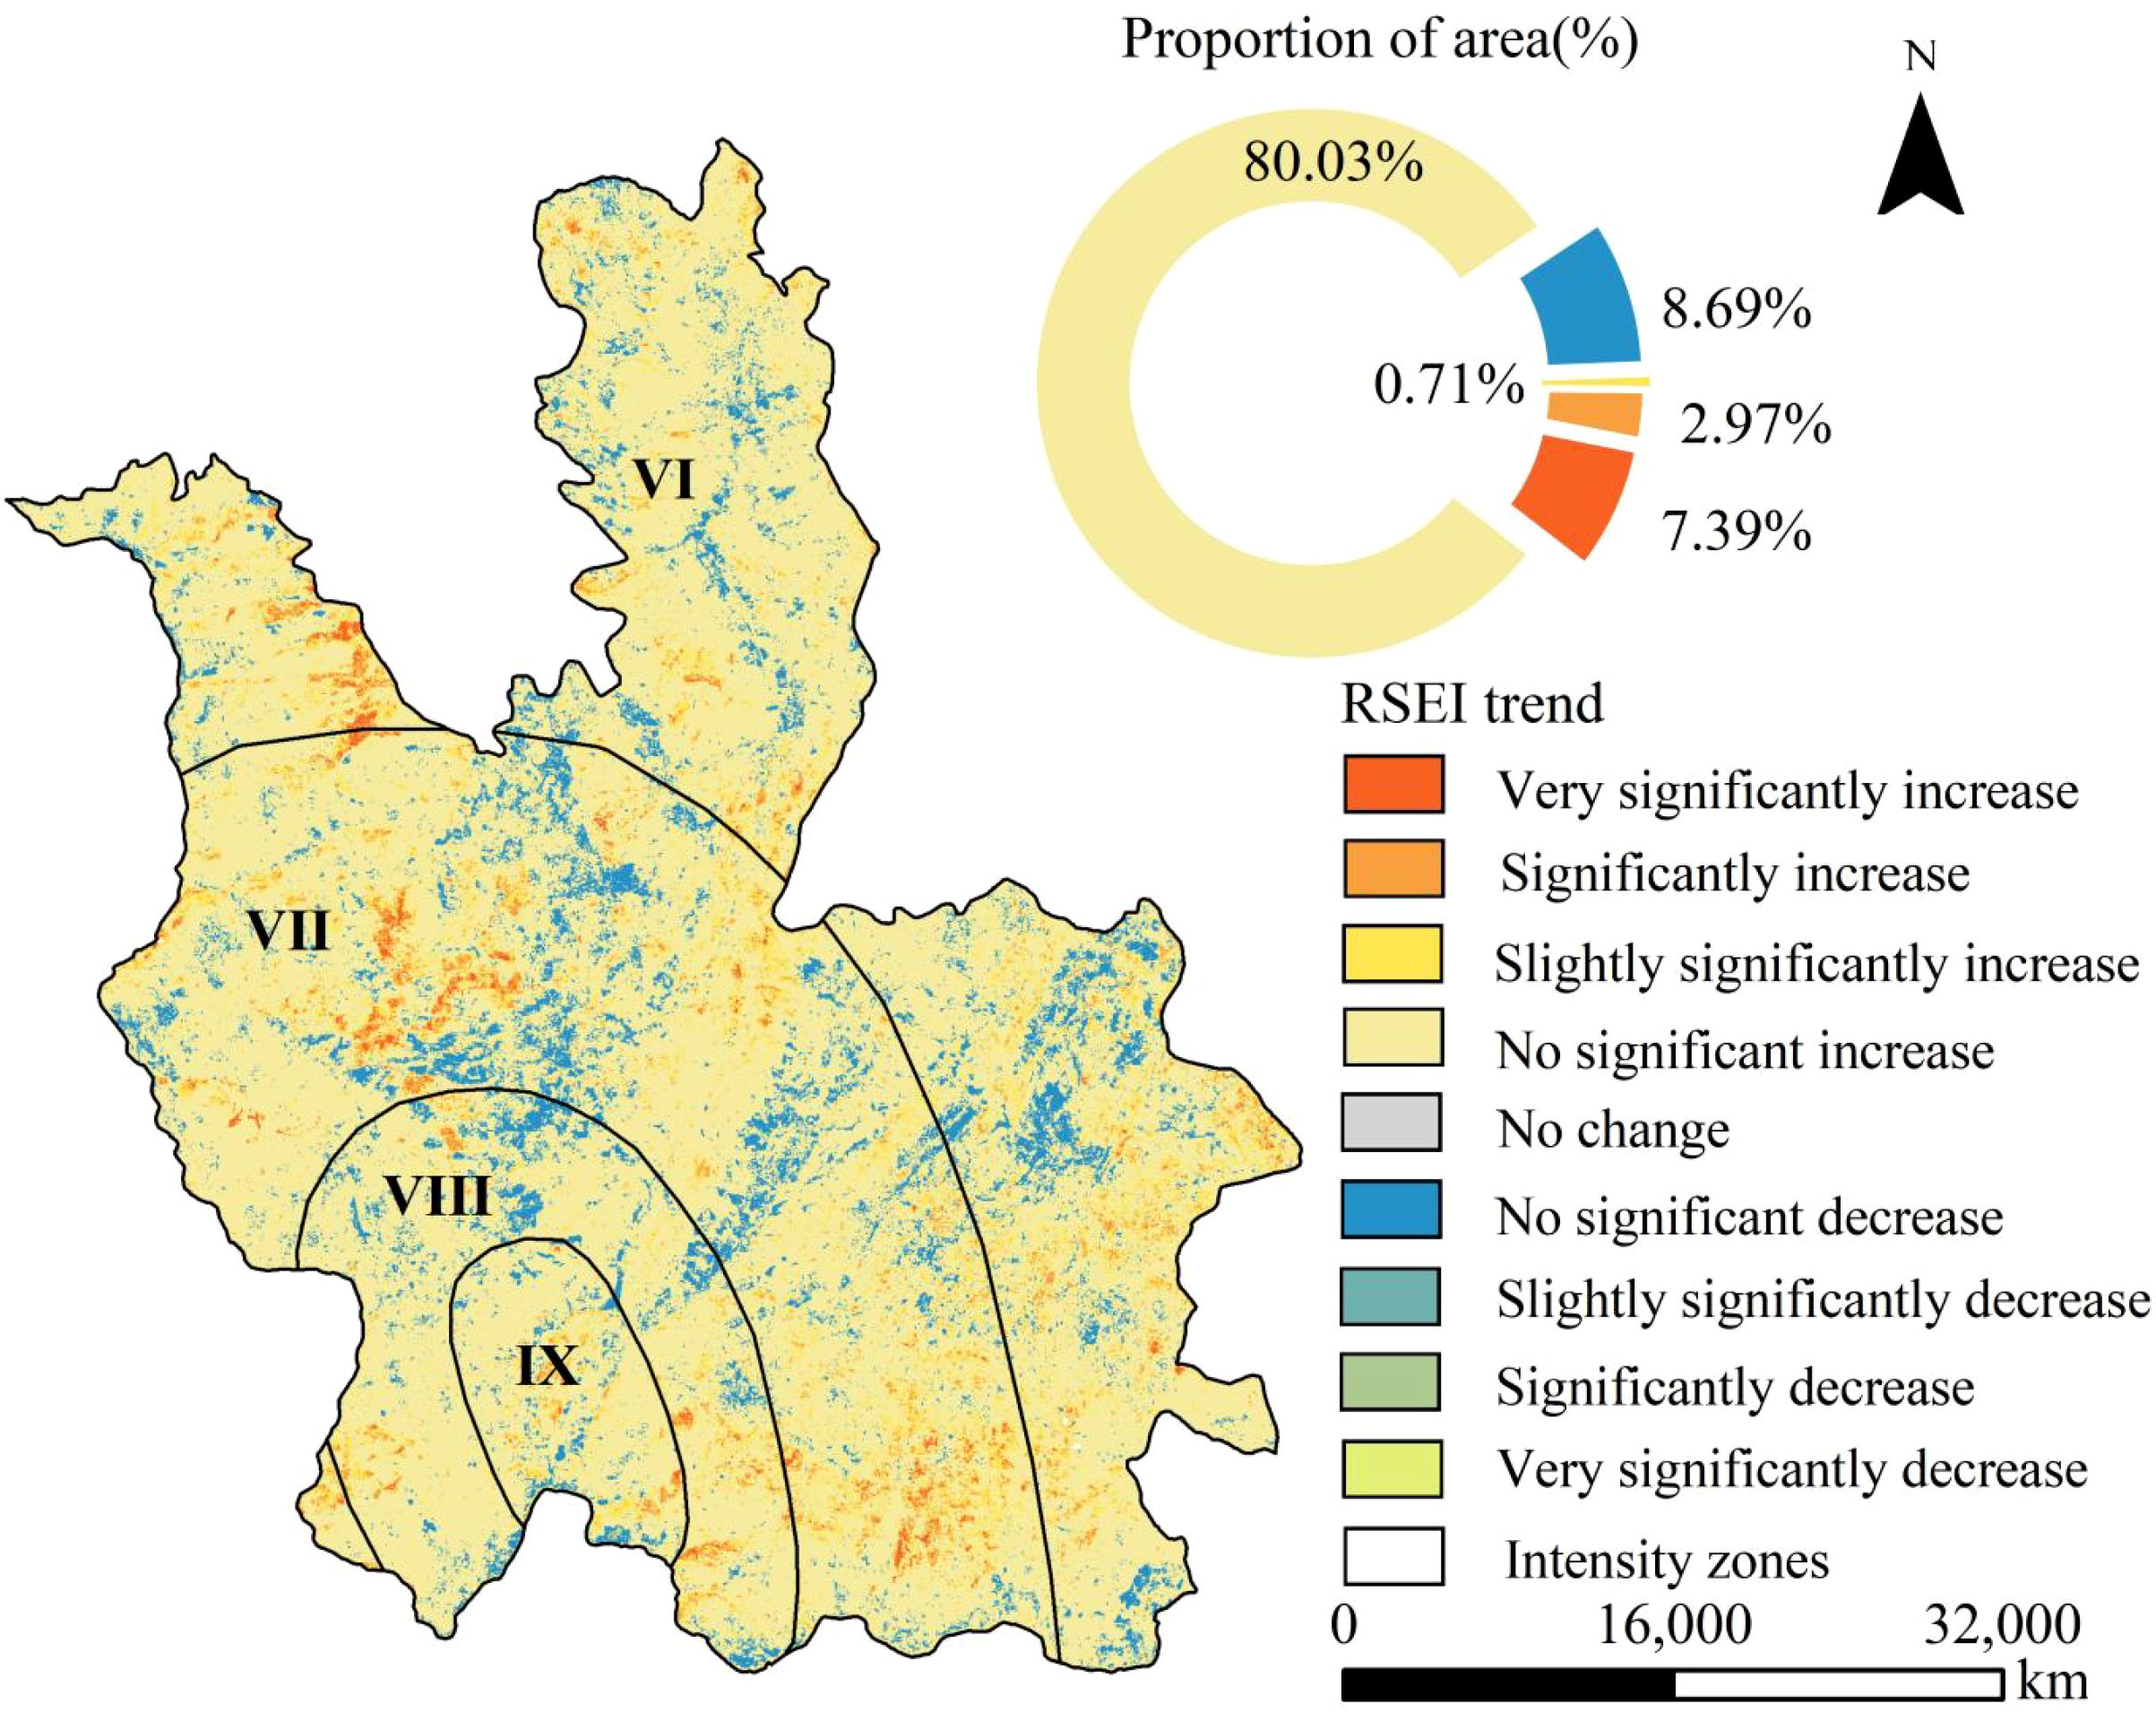
Figure 6. Trends of eco-environmental quality change.
Spatially, areas with improved ecological quality were widely distributed, with notable improvements in the northwest of the VI zone, the central and southeastern parts of the VII zone, and the VIII zone. Degraded areas were primarily concentrated in the southeastern VI zone, southern VII zone, and northern VIII zone.
3.4 Drivers detection of ecological environment quality
3.4.1 Single-factor detection analysis
Based on relevant research and the geographical characteristics of Ludian, this study explored the mechanisms by which anthropogenic and natural factors influence ecological environment quality.
The factor detection results (Table 5) showed that all variables were statistically significant at the 1% level (p< 0.01), indicating that each factor had a significant impact on the spatial differentiation of ecological quality recovery in Ludian, though with varying degrees of influence.
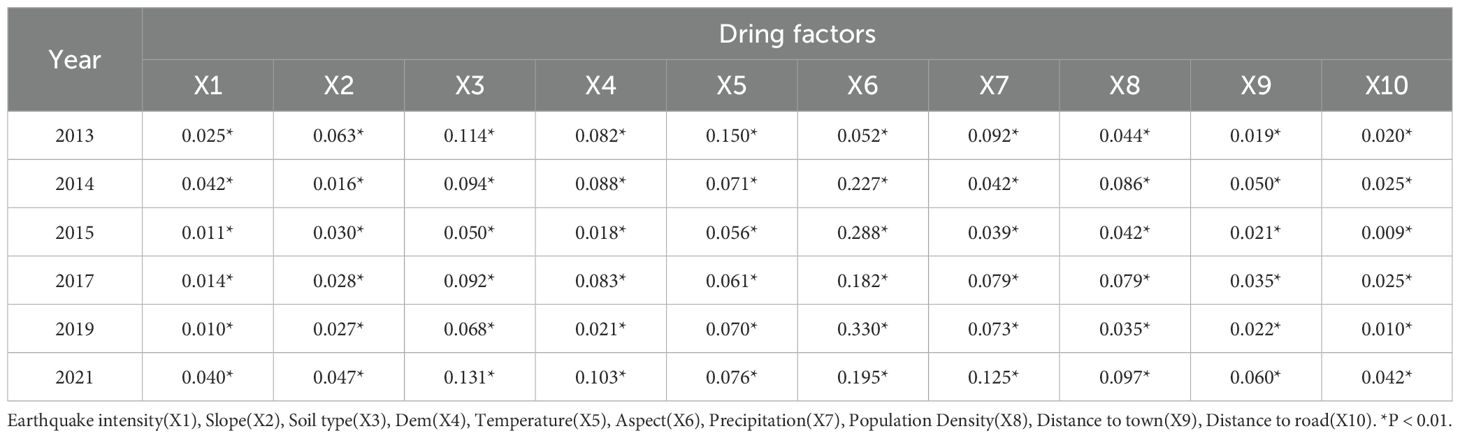
Table 5. Results of single factor detection.
Before the earthquake, spatial differentiation of ecological quality was mainly governed by natural background conditions such as temperature (q = 0.150) and soil type (q = 0.114), with the overall pattern relatively stable and balanced.
After the earthquake, seismic disturbance dramatically altered the ecological driving patterns, with aspect (q = 0.227) showing a sharp increase in explanatory power and becoming the absolute dominant factor, underscoring the role of secondary geological disasters in reshaping ecological patterns.
During the recovery period, aspect (q = 0.182–0.330) continued to exert a fundamental controlling effect. By 2021, the q-values of population density, distance to town, and distance to road all reached their highest levels throughout the study period. These results suggest that over time, the influence of human activities on the spatial differentiation of ecological quality persists and becomes increasingly significant.
3.4.2 Interaction detection analysis
The interaction detector was employed to explore the interactive relationships between different influencing factors and the spatial differentiation of RSEI. The results (Figures 7A–C) showed that the interactions among all ten factors exhibited a nonlinear enhancement pattern, indicating that the spatial differentiation of ecological environment quality in Ludian was the outcome of a coupled and reinforced effect of multiple factors.
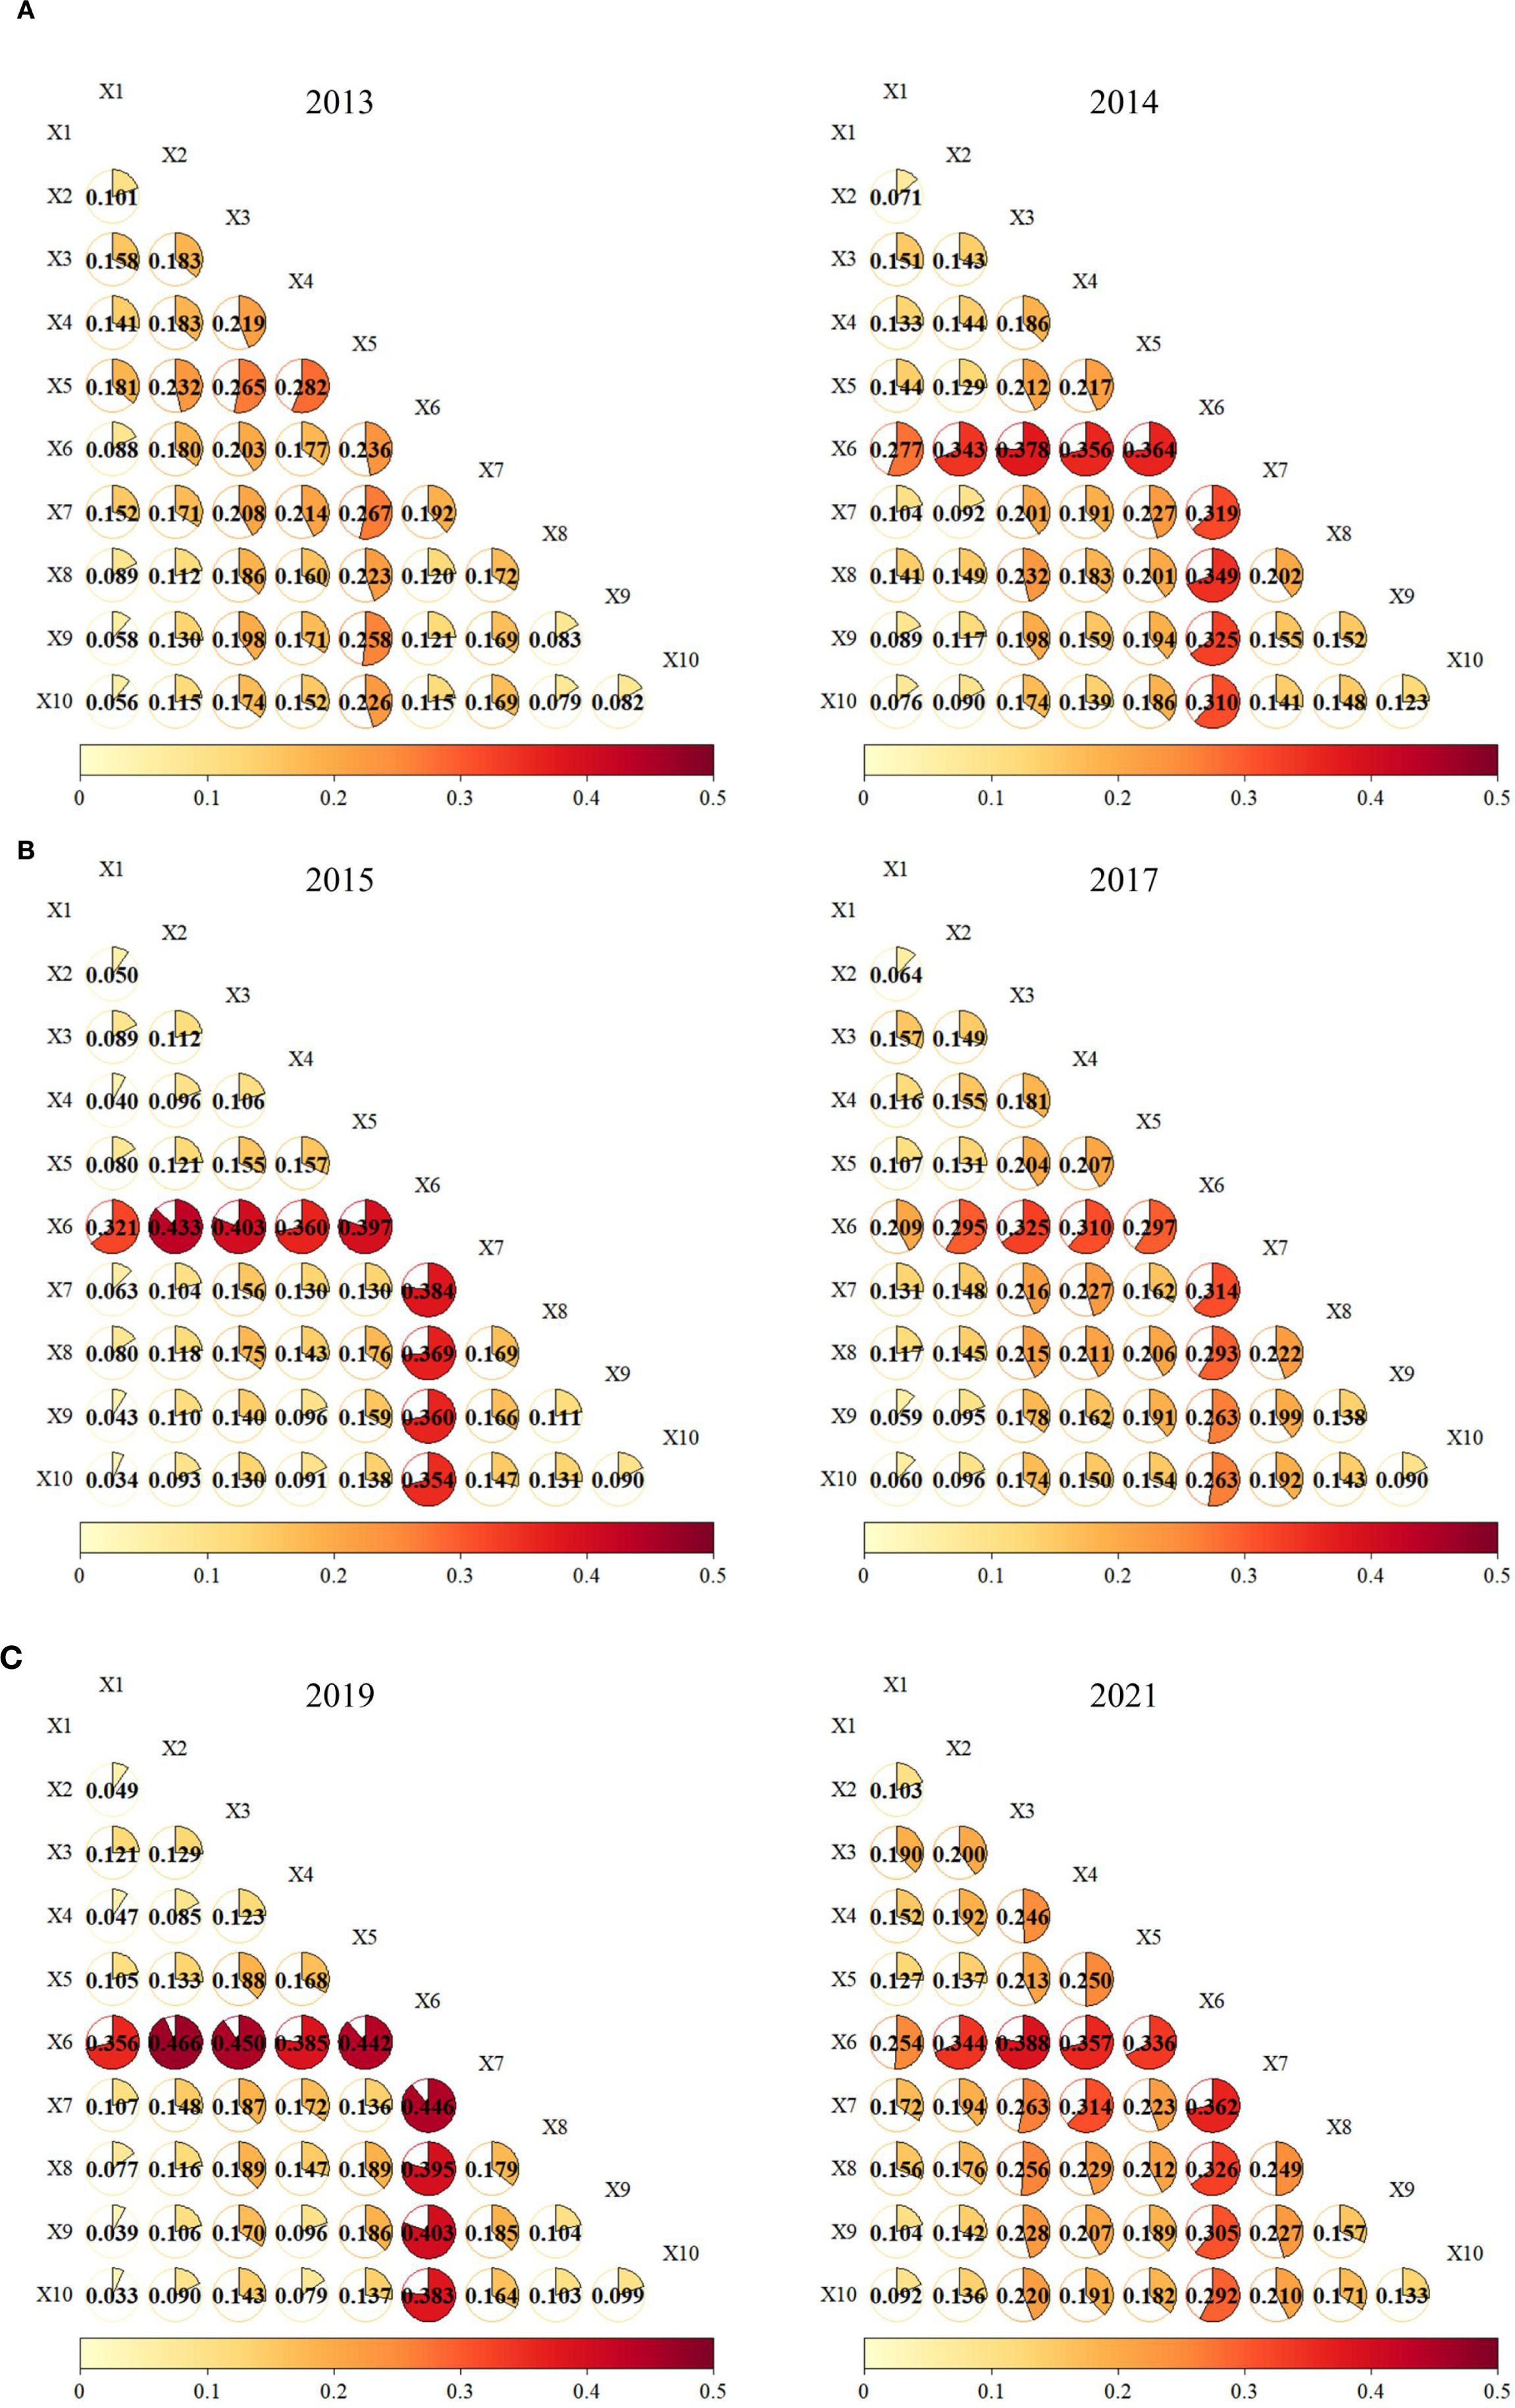
Figure 7. (A-C) Results of interaction factor detection.
Before the earthquake, ecological quality in Ludian was primarily governed by natural background factors such as temperature, and the overall strength of factor interactions was relatively low, with most q-values below 0.2. Among them, the interactions between dem and temperature (q = 0.282) and between soil type and dem (q = 0.219) were the most pronounced; meanwhile, the interactive values of human activity factors were generally below 0.1, showing only minor influence.
After the earthquake, seismic disturbance altered the surface morphology, and the interactions between aspect and slope (q = 0.343) and between aspect and soil (q = 0.378) increased sharply, with q-values rising by approximately 50–70% compared with the pre-seismic period, thereby becoming the core driving forces of ecological change.
During the recovery period, the interactive effects among topographic factors first increased and then declined. However, combinations such as aspect and slope, as well as aspect and precipitation, maintained relatively high levels of influence—for example, the interaction between aspect and slope reached a peak in 2015 (q = 0.433), and the interaction between aspect and precipitation remained high in 2019 (q = 0.446). As the recovery process advanced, the interactions of human activity factors became increasingly evident, with the interaction between population density and distance to road rising to 0.171 in 2021. This suggests that in the later stages of ecological recovery, the importance of anthropogenic disturbances became increasingly significant.
4 Discussion
In this study, we systematically investigated the dynamic evolution process and recovery mechanisms of ecological environment quality in Ludian under earthquake disturbance. The results demonstrated that the regional ecological environment exhibited a typical “destruction-recovery” dynamic pattern, confirming that post-disaster ecosystems possess certain self-recovery capacities (Wang et al., 2024b), while highlighting the driving roles of both natural and anthropogenic factors in the recovery process.
4.1 Characteristics and spatial differentiation of earthquake-induced ecological damage
The results indicated that the Ludian earthquake significantly impacted the regional ecological environment, with the average RSEI declining by 21.3% shortly after the earthquake and showing a marked spatial differentiation. Specifically, the degree of ecological damage exhibited a significant gradient across seismic intensity zones: the IX-intensity zone experienced the largest RSEI decrease (31.0%), followed by the VIII-intensity zone (24.8%) and the VII-intensity zone (16.9%). This distribution pattern aligns closely with the spatial distribution of seismic intensity, confirming a positive correlation between earthquake intensity and the extent of ecological damage (Hou et al., 2014). This conclusion is consistent with the findings of other scholars. For instance, a study by (Li et al., 2022) on the earthquake in Wen County, Gansu, revealed that the response of vegetation coverage to the earthquake intensified with increasing intensity. In the IX to VI degree zones, the reduction rates of high vegetation coverage areas during the earthquake were 9.02%, 8.31%, 6.01%, and 3.59%, respectively. Notably, the RSEI reduction in the VI-intensity zone in this study had an abnormally high value of 22.7%. This anomaly is attributed to the dominance of cropland and construction land in the area, where long-term intensive agricultural practices and urbanization have resulted in a fragile ecological baseline, leading to lower RSEI values.
From a spatial perspective (Figure 4), distinct RSEI low-value centers emerged in the northern part of the IX-intensity zone and the northeastern part of the VIII-intensity zone after the earthquake. This is due to the area’s mountainous and canyon terrain, with steep slopes, fractured rock masses, and frequent aftershocks. Coupled with the impact of seasonal rainfall, these conditions triggered large-scale secondary disasters, such as landslides and collapses (Tao et al., 2015; Yin et al., 2016). These secondary disasters not only destroyed surface vegetation but also disrupted soil structures and hydrological conditions, leading to severe ecological degradation.
4.2 Spatiotemporal dynamics of ecological recovery
From the perspective of temporal evolution, the post-earthquake ecological recovery process in Ludian exhibited distinct stage-specific differences:
(1) Rapid recovery phase (2015-2017). The RSEI showed an average annual growth rate of 3.9%. This rapid recovery was primarily attributed to the implementation of large-scale artificial restoration projects, such as afforestation and slope reinforcement. These measures significantly increased surface vegetation coverage and effectively mitigated soil erosion (Thapa et al., 2024), leading to a notable short-term improvement in RSEI values. However, the ecosystem during this phase remained in the early stages of recovery, characterized by low overall stability and resistance to disturbances, with ecological functions largely dependent on artificial interventions. The community structure was dominated by plantation forests, with pioneer herbaceous communities rapidly colonizing locally exposed areas (Goyal and Joshi, 2025), resulting in a relatively simple community composition.
(2) Stable recovery phase (2017-2019). The restoration model shifted from being primarily human-led to a combination of artificial and natural recovery. Due to the relatively slower short-term recovery rates of vegetation and soil under natural restoration conditions, the average annual growth rate of RSEI slowed to 2.3%. However, the ecosystem during this phase exhibited greater structural stability and functional sustainability (Chen et al., 2023). The focus of vegetation restoration transitioned from expanding coverage to optimizing community quality and function. In some areas, herbaceous communities gradually evolved into shrubs and trees, forming complex arbor-shrub-herb communities alongside plantation forests (Chen et al., 2023). The increase in the proportion of woody vegetation promoted the three-dimensional accumulation of biomass (both above and below ground) and improved microenvironments, thereby enhancing soil organic matter and water retention capacity (Petaja et al., 2023).
(3) Stable surpassing phase (2019-2021). The average RSEI value of the county increased to 0.588, representing a 5% improvement compared to the pre-earthquake level. This indicates that the ecosystem achieved optimization and enhancement in both structure and function. The community structure became more complex, gradually transitioning from shrub-herb communities to composite arbor-shrub-herb communities (Chen et al., 2023), leading to significant improvements in biodiversity and carbon storage, as well as enhanced soil structure and fertility. The ecosystem service functions (such as water conservation, carbon sequestration, and habitat provision) were comprehensively strengthened (Wei et al., 2023a; He et al., 2025). This “surpassing” reflects the combined effects of artificial restoration and natural succession. However, a 2.8% recovery lag persisted in the Intensity IX zone, primarily due to the complexity of the geological structure and the ongoing impact of secondary disasters such as landslides (Zi et al., 2025).
From the perspective of spatial distribution, trend analysis results showed that ecological environment quality improved in 91% of the study area, while 8.75% of degraded zones were concentrated in the southeastern part of the Intensity VI zone, the southern part of the Intensity VII zone, and the northern part of the Intensity VIII zone. This pattern was likely closely related to disturbances of the natural recovery process caused by human activities such as agricultural expansion.
4.3 Driving mechanisms of ecological quality changes
In this study, we employed Geodetector to conduct an in-depth analysis of the key driving factors underlying the spatial differentiation of ecological environment quality across different stages—pre-earthquake, post-earthquake, and recovery—in Ludian. The results revealed that the driving mechanism of ecological environment quality changes in the study area generally followed the pattern of “natural background factors dominating before the earthquake—topographic factors emerging after the earthquake—anthropogenic factors intensifying during the recovery period.” This pattern not only reflects the universal response mechanism of plateau mountain ecosystems under seismic disturbance but also highlights the regional differences of Ludian shaped by its unique natural conditions and human activity context.
(1) Pre-earthquake. The spatial differentiation of ecological environment quality was primarily determined by natural background conditions. Factor detection results indicated that temperature (q = 0.150) and soil type (q = 0.114) had the highest explanatory power, suggesting that the ecological pattern was mainly controlled by regional climate and soil properties. Favorable thermal conditions ensured stable vegetation growth, while soil texture influenced water retention and nutrient supply, jointly supporting long-term vegetation succession (Joswig et al., 2022). Although topographic factors such as slope and dem had limited explanatory power, they indirectly affected ecosystem stability by regulating the spatial distribution of water and heat (Chen, 2025).
Interaction detection further revealed that pre-earthquake ecological quality was largely governed by the interactions among natural factors. In particular, the synergistic effects between topography and climate were most prominent, such as dem with temperature (q = 0.282) and soil type with dem (q = 0.219), reflecting the long-term control of the “topography–climate–soil” coupled system on ecological patterns. This mechanism, by influencing vegetation distribution and community structure, maintained the overall stability of pre-earthquake ecological quality (Joswig et al., 2022; Guo et al., 2024). Such findings are consistent with pre-earthquake studies in Wenchuan and Chi-Chi, both of which emphasized the dominant role of natural conditions (Duan et al., 2021; Wei et al., 2023b). However, due to the weathering susceptibility of carbonate rocks in Ludian, the baseline stability of its ecosystems was relatively low, making them more vulnerable to post-earthquake disturbances.
(2) Post-earthquake. Strong seismic disturbances significantly altered the driving mechanisms of ecological patterns. The explanatory power of aspect rose sharply (q = 0.227), becoming the dominant factor. This was mainly due to earthquake-induced landslides and collapses, which made aspect a key determinant of stress distribution and landform reorganization, while directly influencing vegetation regeneration potential by altering solar radiation and moisture conditions (Zhang et al., 2015).
Interaction detection showed that the interactions of aspect with slope (q = 0.343) and aspect with soil type (q = 0.378) were 50–70% stronger than pre-earthquake, underscoring the central role of topographic factors in post-earthquake ecological restructuring. Slope and aspect jointly controlled the scale and spatial distribution of secondary disasters, whereas soil conditions and slope stability co-regulated vegetation recovery processes, thereby reshaping ecological spatial patterns. This mechanism is consistent with findings in Wenchuan and Nepal’s Gorkha earthquake areas (Zhang et al., 2015; Roback et al., 2018; Pandey et al., 2022). However, in Ludian, the combined effects of deeply incised mountain landforms and concentrated rainfall made the aspect–precipitation interaction more significant (q = 0.446 in 2019), underscoring the uniqueness of the region’s hydro-geomorphic coupling.
(3) Recovery period. The driving mechanisms exhibited a composite feature of persistent natural influences and progressively intensifying human interventions. Between 2015 and 2019, aspect maintained relatively high explanatory power (q = 0.182–0.330), with its interactions with slope and precipitation remaining significant, reflecting the fundamental role of the topography–climate system in ecological recovery. Meanwhile, the explanatory power of anthropogenic factors steadily increased: population density (q = 0.125 in 2021) and proximity to towns and roads peaked during the later recovery stage. This suggests that with post-disaster reconstruction and the resumption of agricultural activities, human activities gradually became the critical drivers of ecological pattern evolution. On the one hand, afforestation and slope stabilization projects promoted overall ecological improvement (Chen et al., 2025); on the other hand, agricultural expansion and urban–rural construction triggered localized degradation, resulting in spatial heterogeneity of the recovery process (Zhang et al., 2022). This finding is consistent with studies in Wenchuan and Jiuzhaigou, which also noted the rising importance of anthropogenic factors in later recovery stages (Duan et al., 2024; Chen et al., 2025). However, in Ludian, due to high population density and large proportions of cropland and construction land, human disturbances emerged earlier and exerted more significant impacts.
4.4 Limitations and future research
This study quantitatively assessed the dynamic changes in ecological environmental quality in Ludian under the disturbance of seismic disasters using the RSEI model and the Geodetector model. It systematically identified key driving factors and their mechanisms influencing ecological environmental quality changes, providing a scientific basis for post-disaster ecological restoration and regional sustainable development. However, due to research constraints and data availability, the study has the following limitations:
1. Data Accuracy and timeliness limitations: The remote sensing data used in the study may be affected by cloud cover and spatial resolution, potentially leading to deviations in local ecological environment quality assessments. Additionally, immediate post-earthquake ecological responses may not have been fully captured due to data acquisition cycles. Future research could incorporate remote sensing data with higher spatiotemporal resolution for dynamic monitoring.
2. Insufficient long-term ecological effect monitoring: Earthquake impacts on ecosystems are long-term and cumulative, yet this study only analyzed trends within the first decade after the disaster. Future efforts should establish long-term observation networks, integrating ground monitoring and remote sensing technologies to assess the sustained effects of ecological restoration measures and provide a scientific basis for regional sustainable development.
5 Results
1. The destructive effects of the earthquake exhibited a pronounced intensity-gradient feature. The Ludian earthquake caused a short-term decline of 21.3% in the mean RSEI, with the severity of degradation strongly correlated with seismic intensity. The high-intensity zone (IX degree) showed the largest decrease (31.0%), followed by the medium-intensity zone (24.8%), while the low-intensity zone experienced the smallest decline (16.9%).
2. The ecological recovery process displayed marked stage-specific and spatial differentiation characteristics. Temporally, post-earthquake recovery followed a three-stage trajectory of “rapid recovery–stable recovery–stable surpassing.” Spatially, most of the area (91%) experienced positive ecological succession, whereas some human activity–intensive zones (8.75%) showed a trend of degradation.
3. The driving mechanisms of ecological environment quality change exhibited significant spatiotemporal heterogeneity. Before the earthquake, ecological patterns were primarily controlled by natural background factors such as temperature and soil type. After the earthquake, strong seismic disturbances elevated aspect to the dominant factor, which, in combination with slope, soil type, and other topographic elements, played a decisive role in reshaping the ecological landscape. During the recovery period, natural factors continued to exert a fundamental influence, but anthropogenic drivers—including population density and proximity to roads and towns—gained markedly stronger explanatory power, becoming critical forces shaping the differentiated trajectories of ecological recovery.
Data availability statement
The original contributions presented in the study are included in the article/supplementary material. Further inquiries can be directed to the corresponding author.
Author contributions
XH: Data curation, Software, Supervision, Validation, Visualization, Writing – original draft. YC: Funding acquisition, Writing – review & editing. SP: Funding acquisition, Writing – review & editing. ML: Writing – review & editing. SL: Data curation, Writing – review & editing. YX: Data curation, Writing – review & editing. JL: Data curation, Software, Writing – review & editing.
Funding
The author(s) declare financial support was received for the research and/or publication of this article. This research was funded by The Key Science and Technology Project of the Ministry of Emergency Management of China (2024EMST040405), The National Natural Science Foundation of China(42261073, 41971369, 42261037), Yunnan Province Reserve Talent Program for Young and Middle-aged Academic and Technical Leaders (202305AC160083, 202205AC160014), Major Scientific and Technological Projects of Yunnan Province (202202AD080010), Yunnan Provincial Basic Research Project (202401AT070103, 202201AS070024, 202001AS070032).
Conflict of interest
The authors declare that the research was conducted in the absence of any commercial or financial relationships that could be construed as a potential conflict of interest.
Generative AI statement
The author(s) declare that Generative AI was used in the creation of this manuscript. We used ChatGPT (OpenAI) to improve the language and readability of the manuscript. All scientific content, interpretation, and conclusions are solely those of the authors.
Any alternative text (alt text) provided alongside figures in this article has been generated by Frontiers with the support of artificial intelligence and reasonable efforts have been made to ensure accuracy, including review by the authors wherever possible. If you identify any issues, please contact us.
Publisher’s note
All claims expressed in this article are solely those of the authors and do not necessarily represent those of their affiliated organizations, or those of the publisher, the editors and the reviewers. Any product that may be evaluated in this article, or claim that may be made by its manufacturer, is not guaranteed or endorsed by the publisher.
References
Cattani C., Montaldi C., Di Pietro G., and Zullo F. (2023). Effects of urban planning on ecosystem services: the umbria region seismic crater. Sustainability 15, 7674. doi: 10.3390/su15097674
Chen M., Tang C., Yang Y., and Xiong J. (2025). Quantifying spatio-temporal changes in the ecological environment quality and their implications for surface mass movement after a high-magnitude earthquake. Glob. Ecol. Conserv. 58, e03454. doi: 10.1016/j.gecco.2025.e03454
Chen S., Hua J., Liu W., Yang S., Wang X., and Ji W. (2023). Effects of Artificial Restoration and Natural Recovery on Plant Communities and Soil Properties across Different Temporal Gradients after Landslides. Forests 14, 1974. doi: 10.3390/f14101974
Chen Y., Nakatsugawa M., and Ohashi H. (2021). Research of impacts of the 2018 hokkaido eastern iburi earthquake on sediment transport in the atsuma river basin using the SWAT model. Water 13, 356. doi: 10.3390/w13030356
Chen Z. (2025). Effect of topographic factors on ecological environment quality in the red soil region of southern China: A case from changting county. Sustainability 17, 1501. doi: 10.3390/su17041501
Chou W.-C., Lin W.-T., and Lin C.-Y. (2009). Vegetation recovery patterns assessment at landslides caused by catastrophic earthquake: A case study in central Taiwan. Environ. Monit. Assess. 152, 245–257. doi: 10.1007/s10661-008-0312-8
Du Z., Ji X., Liu J., Zhao W., He Z., Jiang J., et al. (2025). Ecological health assessment of Tibetan alpine grasslands in Gannan using remote sensed ecological indicators. Geo-Spat. Inf. Sci. 28, 246–264. doi: 10.1080/10095020.2024.2311862
Duan Y., Di B., Ustin S. L., Xu C., Xie Q., Wu S., et al. (2021). Changes in ecosystem services in a montane landscape impacted by major earthquakes: A case study in Wenchuan earthquake-affected area, China. Ecol. Indic. 126, 107683. doi: 10.1016/j.ecolind.2021.107683
Duan Y., Pei X., Luo J., Zhang X., and Luo L. (2024). Disentangling the spatiotemporal dynamics, drivers, and recovery of NPP in co-seismic landslides: A case study of the 2017 jiuzhaigou earthquake, China. Forests 15, 1381. doi: 10.3390/f15081381
Goyal D. and Joshi V. (2025). Vegetation pattern during early succession in landslides of garhwal himalayas: correlation between plant species and soil characteristics. Land. Degrad. Dev. 36, 2702–2718. doi: 10.1002/ldr.5525
Guo L., Zhang F., Chan N. W., Shi J., Tan M. L., Kung H. T., et al. (2024). Interactions of climate, topography, and soil factors can enhance the effect of a single factor on spring phenology in the arid/semi-arid grasslands of China. J. Clean. Prod. 473, 13. doi: 10.1016/j.jclepro.2024.143556
Hamada N., Koga H., Katsuya K., Ishida K., Ito H., and Kawagoshi Y. (2024). Insight into groundwater quality change before and after the 2016 Kumamoto earthquake. Sci. Total Environ. 957, 177783–177783. doi: 10.1016/j.scitotenv.2024.177783
He W., Di B., Wu S., Li J., Zeng W., Zeng Y., et al. (2025). Long-term effects of post-earthquake landslides on vegetation ecosystem net carbon. Ecol. Indic. 171, 113170. doi: 10.1016/j.ecolind.2025.113170
Hirayama H., Tomita M., and Hara K. (2020). Quantitative monitoring of changes in forest habitat connectivity following the great eastern Japan earthquake and tsunami. Landscape. Ecol. 35, 1519–1530. doi: 10.1007/s10980-020-01034-4
Hou P., Wang Q., Yang Y., Jiang W., Yang B., Chen Q., et al. (2014). Spatio-temporal features of vegetation restoration and variation after the Wenchuan earthquake with satellite images. J. Appl. Remote Sens. 8, 083651-083651. doi: 10.1117/1.Jrs.8.083651
Hu J., Li B., Tang L., and Tang C. (2007). Study on characteristics and formation factor of geological hazards in Ludian county of Yunnan province. J. Geological Hazards Environ. Preservation 18, 15–19. doi: 10.3969/j.issn.1006-4362.2007.04.004
Jakovljevic D. and Lozanov-Crvenkovic Z. (2015). Water quality changes after Kraljevo earthquake in 2010. Nat. Hazards. 79, 2033–2053. doi: 10.1007/s11069-015-1943-z
Joswig J. S., Wirth C., and Mahecha M. D. (2022). Climatic and soil factors explain the two-dimensional spectrum of global plant trait variation. Nat. Ecol. Evol. 6, 36–50. doi: 10.1038/s41559-021-01616-8
Kang D., Yin C., Zhu D., and Zou S. (2021). Altitude and landslide scale regulated the assembly of grassland communities on landslides during the recovery process after the magnitude 8.0 Wenchuan earthquake, China. Ecol. Eng. 172, 106413. doi: 10.1016/j.ecoleng.2021.106413
Korup O., Densmore A. L., and Schlunegger F. (2010). The role of landslides in mountain range evolution. Geomorphology 120, 77–90. doi: 10.1016/j.geomorph.2009.09.017
Li Q., Dang G., Yu T., Zhang L., and Chen W. (2025). Spatial-temporal variation and driving forces analysis of ecological environment quality in arid counties based on GEE:A case study of Alxa Left Banner. Arid Zone Res. 42, 360–371. doi: 10.13866/j.azr.2025.02.15
Li X., He Z., and Liang Y. (2022). Quantitative analysis of ecological environment response to earthquake in Wenxian County, Gansu Province, China. Technol. Sci. Technol. Ed. 49, 623–632. doi: 10.3969/j.issn.1671-9727.2022.05.12
Liu Y., Lin Y., Liu W., Zhou J., and Wang J. (2024). Remote sensing perspective in exploring the spatiotemporal variation characteristics and post-disaster recovery of ecological environment quality, a case study of the 2010 Ms7.1 Yushu earthquake. Geomat. Nat. Haz. Risk. 15, 2314578. doi: 10.1080/19475705.2024.2314578
Liu Y., Lin Y., Wang F., Xu N., and Zhou J. (2023). Post-earthquake recovery and its driving forces of ecological environment quality using remote sensing and GIScience, a case study of 2015 Ms8.1 Nepal earthquake. Geomat. Nat. Haz. Risk. 14, 2279496. doi: 10.1080/19475705.2023.2279496
Luo X., Li X., Liu W., Wang M., and Liu C. (2023). Comprehensive evaluation of natural landscapes before and after earthquake based on GST-FAHP-GIS analytical method: A case study of Jiuzhaigou Nature Reserve, China. Ecol. Indic. 154, 110850. doi: 10.1016/j.ecolind.2023.110850
Maerki L., Lupker M., France-Lanord C., Lave J., Gallen S., Gajurel A. P., et al. (2021). An unshakable carbon budget for the Himalaya. Nat. Geosci. 14, 745–74+. doi: 10.1038/s41561-021-00815-z
Marc O., Hovius N., Meunier P., Uchida T., and Hayashi S. (2015). Transient changes of landslide rates after earthquakes. Geology 43, 883–886. doi: 10.1130/g36961.1
Nakata Y., Hayamizu M., and Ishiyama N. (2023). Assessing primary vegetation recovery from earthquake-induced landslide scars: A real-time kinematic unmanned aerial vehicle approach. Ecol. Eng. 193, 107019. doi: 10.1016/j.ecoleng.2023.107019
Ouyang Z., Xu W., Wang X., Wang W., Dong R., Zheng H., et al. (2008). Impact assessment of Wenchuan Earthquake on ecosystems. Acta Ecol. Sin. 28, 5801–5809. doi: 10.3321/j.issn:1000-0933.2008.12.003
Pan H., Li J., and Zhang Q. (2021). Study on restoration of ecological environment quality in earthquake area based on RSEI: A case study of wenchuan county. Environ. Yangtze Basin. 30, 745–757. doi: 10.11870/cjlyzyyhj202103021
Pandey H. P., Gnyawali K., Dahal K., Pokhrel N. P., and Maraseni T. N. (2022). Vegetation loss and recovery analysis from the 2015 Gorkha earthquake (7.8 Mw) triggered landslides. Land Use Policy 119, 106185. doi: 10.1016/j.landusepol.2022.106185
Petaja G., Bārdule A., Zalmanis J., Lazdiņa D., Daugaviete M., Skranda I., et al. (2023). Changes in organic carbon stock in soil and whole tree biomass in afforested areas in Latvia. Plants 12, 2264. doi: 10.3390/plants12122264
Roback K., Clark M. K., West A. J., Zekkos D., Li G., Gallen S. F., et al. (2018). The size, distribution, and mobility of landslides caused by the 2015 Mw7.8 Gorkha earthquake, Nepal. Geomorphology 301, 121–138. doi: 10.1016/j.geomorph.2017.01.030
Saito H., Uchiyama S., and Teshirogi K. (2022). Rapid vegetation recovery at landslide scars detected by multitemporal high-resolution satellite imagery at Aso volcano, Japan. Geomorphology 398, 107989. doi: 10.1016/j.geomorph.2021.107989
Tanya H., Kirschbaum D., Gorum T., van Westen C. J., Tang C., and Lombardo L. (2021). A closer look at factors governing landslide recovery time in post-seismic periods. Geomorphology 391, 107912. doi: 10.1016/j.geomorph.2021.107912
Tao Y., Hu K., Tian Y., Ge Y., and Chen X. (2015). Distribution and characteristics of secondary mountain hazards triggered by ludian earthquake in yunnan. J. Earth Sci. Environ. 37, 84–93. doi: 10.3969/j.issn.1672-6561.2015.04.013
Thapa P. S., Daimaru H., and Yanai S. (2024). Analyzing vegetation recovery and erosion status after a large Landslide at Mt. Hakusan, Central Japan. Ecol. Eng. 198, 107144. doi: 10.1016/j.ecoleng.2023.107144
Tian X., Yang L., Wu X., Wu J., Guo Y., Guo Y., et al. (2023). Landscape fragmentation and spatial autocorrelation of a typical watershed in the wenchuan earthquake-affected area-A case study in the longxi river basin. Forests 14, 2349. doi: 10.3390/f14122349
Wang X., Fan X., Fang C., Dai L., Zhang W., Zheng H., et al. (2024b). Long-term landslide evolution and restoration after the wenchuan earthquake revealed by time-series remote sensing images. Geophys. Res. Lett. 51, e2023GL106422. doi: 10.1029/2023gl106422
Wang J.-F. and Hu Y. (2012). Environmental health risk detection with GeogDetector. Environ. Modell. Software 33, 114–115. doi: 10.1016/j.envsoft.2012.01.015
Wang J.-F., Li X.-H., Christakos G., Liao Y.-L., Zhang T., Gu X., et al. (2010). Geographical detectors-based health risk assessment and its application in the neural tube defects study of the heshun region, China. Int. J. Geogr. Inf. Sci. 24, 107–127. doi: 10.1080/13658810802443457
Wang T., Ma Y., Long C., Tan C., and Wu S. (2008). Analysis of seismic fault activity and secondary geological disasters in the wenchuan earthquake, sichuan. Geol. Bull. China 27, 1913–1922. doi: CNKI:SUN:ZQYD.0.2008-11-025
Wang J. and Xu C. (2017). Geodetector: principle and prospect. Acta Ecol. Sin. 72, 116–134. doi: 10.11821/dlxb201701010
Wang Y., Yang Y., Yan X., Tang P., and Zhang J. (2016). Characteristics and causes of super-huge secondary geological hazards induced by M6.5 ludian earthquake in yunnan. J. Catastrophology 31, 83–86. doi: 10.3969/j.issn.1000-811X.2016.01.017
Wang R., Yu H., Wang H., Jin Q., Ma Y., and Liu M. (2024a). Spatio-temporal variation and influencing factors of ecol-environment quality in Jiuzhaigou County, Sichuan, China under seismic disturbance. Chin. J. Appl. Ecol. 35, 2035–2043. doi: 10.13287/j.1001-9332.202408.027
Wei Y., Du Y., Wang Y., Wang M., and Huang Y. (2023b). Progress and prospects of the natural restoration of damaged vegetation after the earthquake. J. Geosci. Environ. Prot. 11, 46–56. doi: 10.4236/gep.2023.112004
Wei F., Xiang M., Deng L., Wang Y., Li W., Yang S., et al. (2023a). Spatiotemporal distribution characteristics and their driving forces of ecological service value in transitional geospace: A case study in the upper reaches of the minjiang river, China. Sustainability 15, 14559. doi: 10.3390/su151914559
Xia J., Zhang G., Ma S., and Pan Y. (2025). Spatial heterogeneity of driving factors in multi-vegetation indices RSEI based on the XGBoost-SHAP model: A case study of the jinsha river basin, yunnan. Land 14, 925. doi: 10.3390/land14050925
Xu H. (2013). A remote sensing urban ecological index and its application. Arid Zone Res. 33, 7853–7862. doi: 10.5846/stxb201208301223
Xu H., Wang Y., Guan H., Shi T., and Hu X. (2019). Detecting ecological changes with a remote sensing based ecological index (RSEI) produced time series and change vector analysis. Remote Sen. 11, 2345. doi: 10.3390/rs11202345
Yang Y., Fan X., Wang X., Lv L., Zou C., and Feng Z. (2023). Net primary productivity changes associated with landslides induced by the 2008 Wenchuan Earthquake. Land. Degrad. Dev. 34, 1035–1050. doi: 10.1002/ldr.4514
Yin Y., Peng S., Lin Z., Li D., Li T., Zhu Y., et al. (2025). Spatiotemporal changes and multi-scale driving mechanism analysis of nitrogen andPhosphorus export in yunnan province from 2000 to 2020. Chin. J. Environ. 46, 2793–2804. doi: 10.13227/j.hjkx.202405011
Yin Z., Xu Y., Chen H., Sa L., and Jiang X. (2016). The development and distribution characteristics of geohazards induced by august 3,2014 ludian earthquake and comparison with jinggu and yingjiang earthquakes. Acta Ecol. Sin. 90, 1086–1097. doi: 10.3969/j.issn.0001-5717.2016.06.003
Yuan B., Fu L., Zou Y., Zhang S., Chen X., Li F., et al. (2021). Spatiotemporal change detection of ecological quality and the associated affecting factors in Dongting Lake Basin, based on RSEI. J. Cleaner Prod. 302, 126995. doi: 10.1016/j.jclepro.2021.126995
Yunus A. P., Fan X., Tang X., Jie D., Xu Q., and Huang R. (2020). Decadal vegetation succession from MODIS reveals the spatio-temporal evolution of post-seismic landsliding after the 2008 Wenchuan earthquake. Remote Sens. Environ. 236, 111476. doi: 10.1016/j.rse.2019.111476
Zhang H., Chi T., Fan J., Hu K., and Peng L. (2015). Spatial analysis of wenchuan earthquake-damaged vegetation in the mountainous basins and its applications. Remote Sen. 7, 5785–5804. doi: 10.3390/rs70505785
Zhang Y., Jiang X., Lei Y., and Gao S. (2022). The contributions of natural and anthropogenic factors to NDVI variations on the Loess Plateau in China during 2000–2020. Ecol. Indic. 143, 109342. doi: 10.1016/j.ecolind.2022.109342
Zhang J., Zhang Y., Dannenberg M. P., Guo Q., Atkins J. W., Li W., et al. (2025). Eco-hydrological recovery following large vegetation disturbances from a mega earthquake on the eastern Tibetan plateau. J. Hydrol. 651, 132595. doi: 10.1016/j.jhydrol.2024.132595
Zhou M., Li Z., Gao M., Zhu W., Zhang S., Ma J., et al. (2024). Revealing the eco-environmental quality of the yellow river basin: trends and drivers. Remote Sen. 16, 2018. doi: 10.3390/rs16112018
Keywords: plateau mountain ecosystems, seismic ecological effects, recovery trajectory, driving mechanism, Ludian earthquake
Citation: Huang X, Cao Y, Peng S, Luo M, Li S, Xu Y and Liu J (2025) Restoration dynamics and driving mechanisms of plateau mountain ecosystems under seismic disturbance: a case study of the Ludian M6.5 earthquake. Front. Ecol. Evol. 13:1670293. doi: 10.3389/fevo.2025.1670293
Received: 21 July 2025; Accepted: 09 September 2025;
Published: 26 September 2025.
Edited by:
Miguel Ferrer, Spanish National Research Council (CSIC), SpainReviewed by:
Jiehao Zhang, Chinese Academy of Sciences (CAS), ChinaChenyuan Wang, Chinese Academy of Sciences (CAS), China
Copyright © 2025 Huang, Cao, Peng, Luo, Li, Xu and Liu. This is an open-access article distributed under the terms of the Creative Commons Attribution License (CC BY). The use, distribution or reproduction in other forums is permitted, provided the original author(s) and the copyright owner(s) are credited and that the original publication in this journal is cited, in accordance with accepted academic practice. No use, distribution or reproduction is permitted which does not comply with these terms.
*Correspondence: Jing Liu, amluZ2xpdXhoQGdtYWlsLmNvbQ==