 Xiujuan Zhang
 Jiangang Wang1
 Quanlin Ma
- 1Gansu Open University, Lanzhou, China
- 2Gansu Academy of Forestry, Lanzhou, China
Water use efficiency (WUE) is an important indicator to characterize the carbon and water cycle of ecosystems. Using the Google Earth Engine platform, MODIS data were used to calculate WUE. Trend analysis, R/S analysis, partial correlation analysis, PLS-SEM, and other methods were used to analyze the spatiotemporal dynamics of WUE in Gansu province from 2001 to 2020, and to explore the impact of environmental factors on WUE. The results show that: (1) The annual average WUE in Gansu from 2001 to 2020 was 1.71 gCm−2mm−1, and the WUE showed an upward trend. (2) WUE is high in the southeast and low in the northwest, and the WUE in 77.5% of regions is in a state of continuous and stable change. (3) In 76.5% of the regions in Gansu, WUE was positively correlated with lagged SPEI, and the areas with a lag of 6 to 12 months accounted for 47.36%. (4) The total effect of vegetation factors is positive. The impact of climate on WUE through vegetation is 0.685 in Gansu. This study is of great significance for gaining a deeper understanding of the response mechanism of regional water cycle to climate change under the dual background of vegetation restoration and environment in Gansu, and for accurate assessment and optimization of regional water resources management.
1 Introduction
The water-carbon cycle is an important link in terrestrial ecosystems (Miguez-Macho and Fan, 2021). Water use efficiency (WUE) is a key feature of ecosystem function and a bridge to water-carbon coupling (He et al., 2018). The definition of WUE is different at different scales. WUE at the leaf and individual scales is mainly controlled by the opening and closing of stomata. From the perspective of plant ecology, the water use characteristics of different species can be used to solve the problem of low agricultural water use efficiency (Yu et al., 2006). At the ecosystem level, WUE is the ratio of carbon gain to water loss expressed as evapotranspiration. It is usually defined as the ratio of dry matter produced by an ecosystem to its evaporation (Han et al., 2023). This indicator essentially reflects the relationship between vegetation photosynthesis and plant water loss, and can also reflect the ability of the ecosystem to use water to convert nutrients into biomass (Tian et al., 2010).
Early studies on WUE of small-scale ecosystems usually adopted field measurements, that is, using certain vegetation individuals in the study area to represent the WUE of the entire study area, but this method is relatively costly (Curtis et al., 2005). In recent years, the development of eddy covariance and thermal diffusion technologies has provided new ideas for detecting WUE (Curtis et al., 2005). The flux tower observation data has high accuracy but is limited by its quantity and distribution characteristics (Heinsch et al., 2006). WUE at regional scale can be estimated using traditional ecological process models or remote sensing estimates. Traditional ecosystem models include VIP (Mo et al., 2009), DLEM (Tian et al., 2011), IBIS (Vanloocke et al., 2012) and so on. Models evolved from traditional ecological models can simulate WUE on a larger scale, but the resolution is relatively coarse. High-resolution remote sensing data has good spatiotemporal continuity and can provide key information on long-term changes in the water cycle. It has been widely used to study regional vegetation-climate interactions (Li et al., 2019).
At present, scholars have used remote sensing technology products to analyze the spatiotemporal evolution patterns and influencing factors of terrestrial water use efficiency (Zhu et al., 2015). In the context of global climate change, extreme weather, socio-economic development and intensified human activities will have a profound impact on the carbon-water cycle of terrestrial ecosystems (Zhang et al., 2012). In terms of space, WUE is comprehensively affected by terrain factors, vegetation factors, climate factors, and soil factors (Zhu et al., 2015). The dominant factors affecting the spatial distribution of WUE vary in different regions or regions with different vegetation types. For example, there are great differences between humid and arid regions (Zhao et al., 2021); there are great differences in the response of WUE to different vegetation types during drought (Wolf et al., 2013). In-depth exploration of the temporal and spatial evolution differences of WUE and its relationship with environmental factors is of great significance for clarifying the response mechanism of ecosystem water cycle to global climate change, accurately evaluating and optimizing regional water resources management (Delucia et al., 2007).
Gansu is an important energy base and mineral resource province in China, and is also an important water conservation area in the upper reaches of the Yellow River and the Yangtze River (Song et al., 2012). The region spans several different climatic zones and is a region in the country with complex terrain area, fragile ecology and sensitive climate. This region spans multiple climate zones in the country with fragile ecology and sensitive climate, and has complex terrain. Water resources are relatively scarce, unevenly distributed in time and space, and the fragile ecological environment and shortage of water resources lead to frequent drought events. The region has problems such as unstable water conservation function in river source areas, overexploitation of groundwater in some areas, and degradation of ecosystem service functions in some ecological functional areas. The Gansu Provincial Land and Spatial Planning (2021-2035) points out that it is necessary to improve the ecological restoration capability of five key areas, including Hexi Qilian Mountain Inland River Ecological Restoration Area (HX), Central Yellow River Ecological Restoration Area (CR), Longdong-Longzhong Loess Plateau Ecological Restoration Area (LD), Ecological Restoration Area of the Upper Yellow River in Gannan Plateau (GN), and Qinba Mountains Area Upper Yangtze River Ecological Restoration Area (QB). The main factors affecting WUE in different ecological restoration areas may be different. The difference in WUE in different ecological restoration areas is also an issue worthy of attention in regional ecological restoration and governance. However, there are few studies on WUE in different ecological restoration areas in Gansu, and the characteristics and changing trends of WUE in different restoration areas at the regional scale are still unclear. Therefore, studying the spatiotemporal changes of WUE in Gansu and different ecological restoration areas and its relationship with various environmental factors can provide a theoretical basis for better regional economy development and ecological environment restoration.
The objectives of this study are: (1) Clarify the distribution pattern and variation characteristics of WUE in Gansu and each restoration area; (2) Determine the spatial pattern of the lagged effect of drought on WUE. (3) Quantify the direct and indirect effects of environmental variables on WUE. This study will help formulate sustainable water resources management and optimize environmental protection measures in Gansu and the restoration areas, and will be of great significance for promoting green development in Gansu and the restoration areas.
2 Materials and methods
2.1 Study area description
Gansu (92°13′-108°46′E, 32°11′-42°57′N) is located in northwest China (Figure 1). The ancient Silk Road and the New Eurasian Continental Bridge run through the entire region, with a total area of 42.58 km2. The terrain slopes from southwest to northeast, with a length of 1,659 km from east to west and a width of 530 km from north to south. The region is located at the intersection of China’s three major natural regions and three major plateaus. It is adjacent to the Badain Jaran Deaert, the Tengger Deaert, and the Kumtag Desert. It is a typical transition zone between the temperate monsoon climate and the continental climate, and most areas have a temperate arid and semi-arid climate. The natural conditions in the territory are complex, the vegetation types are diverse. From south to north, there are obvious latitudinal and vertical zonal distribution. The average annual temperature is 0-15 °C. The annual precipitation is relatively small, less than 400 mm, and decreases from southeast to northwest.
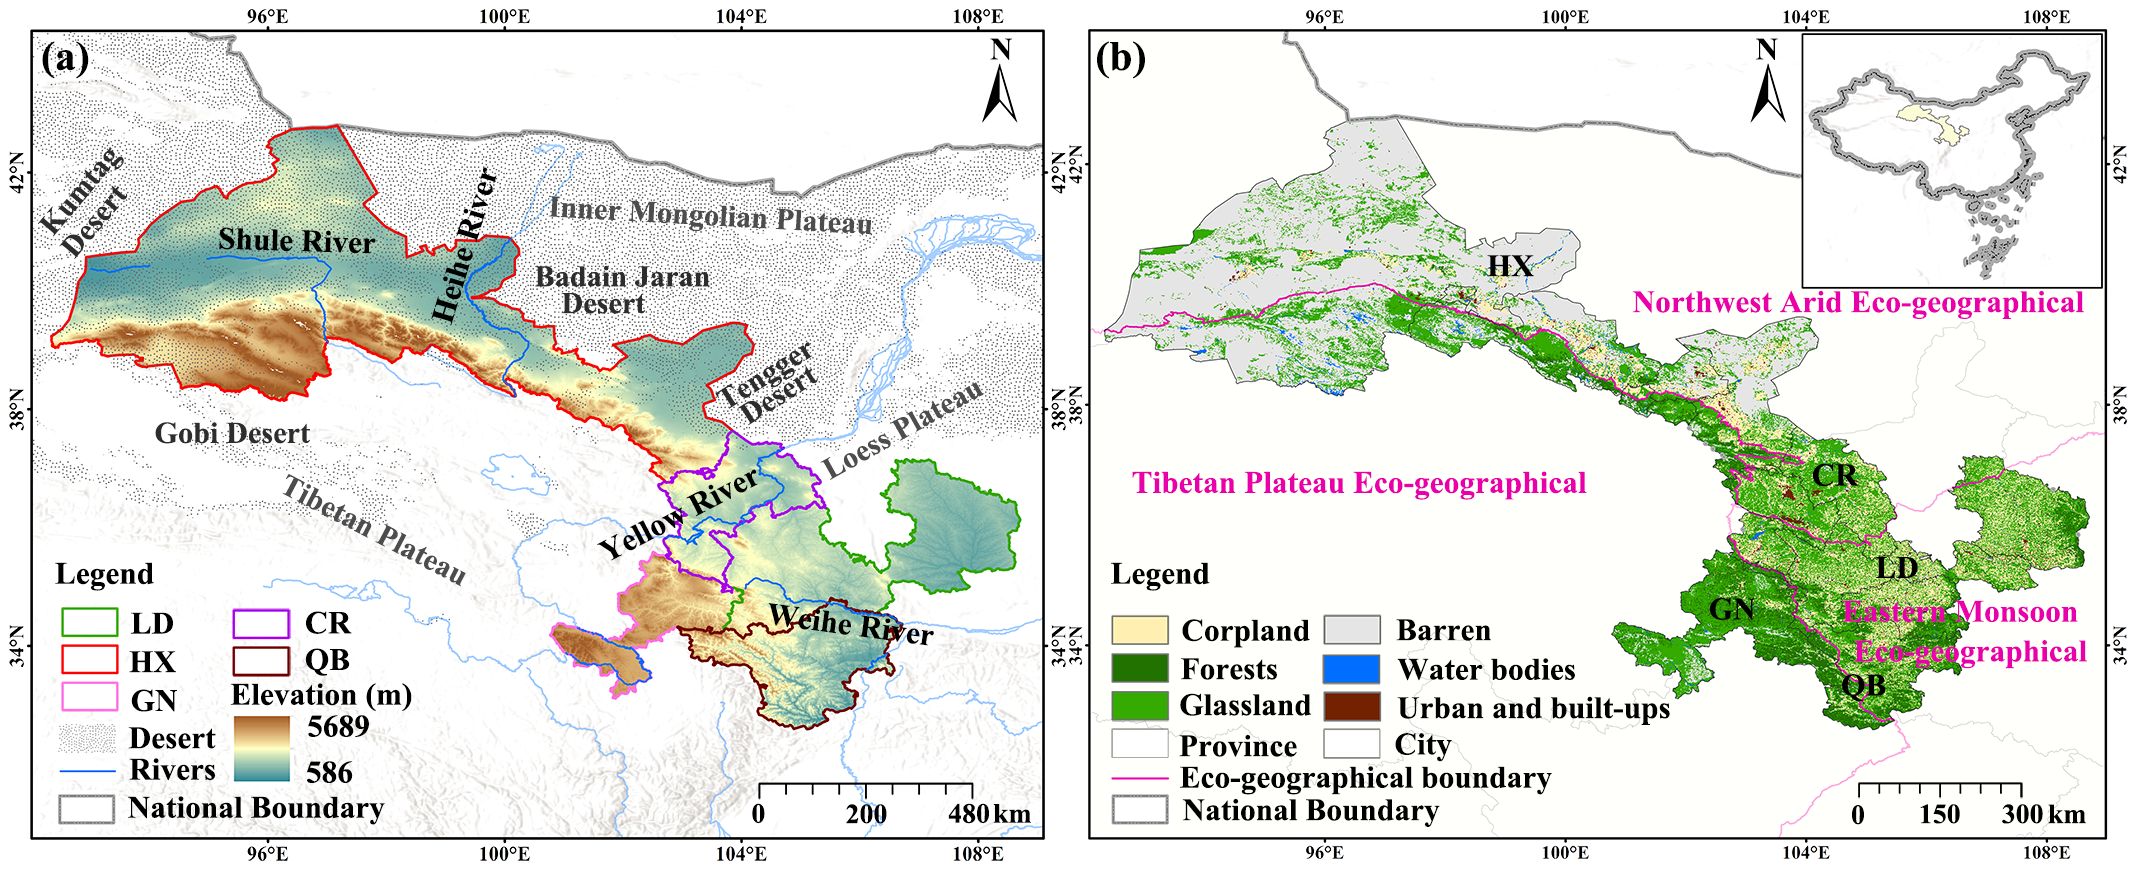
Figure 1. Study area location: (a) Elevation (m). (b) Major natural regions (marked in red) and the spatial pattern of land cover types.
2.2 Data source
Data sources and abbreviation are shown in Table 1.
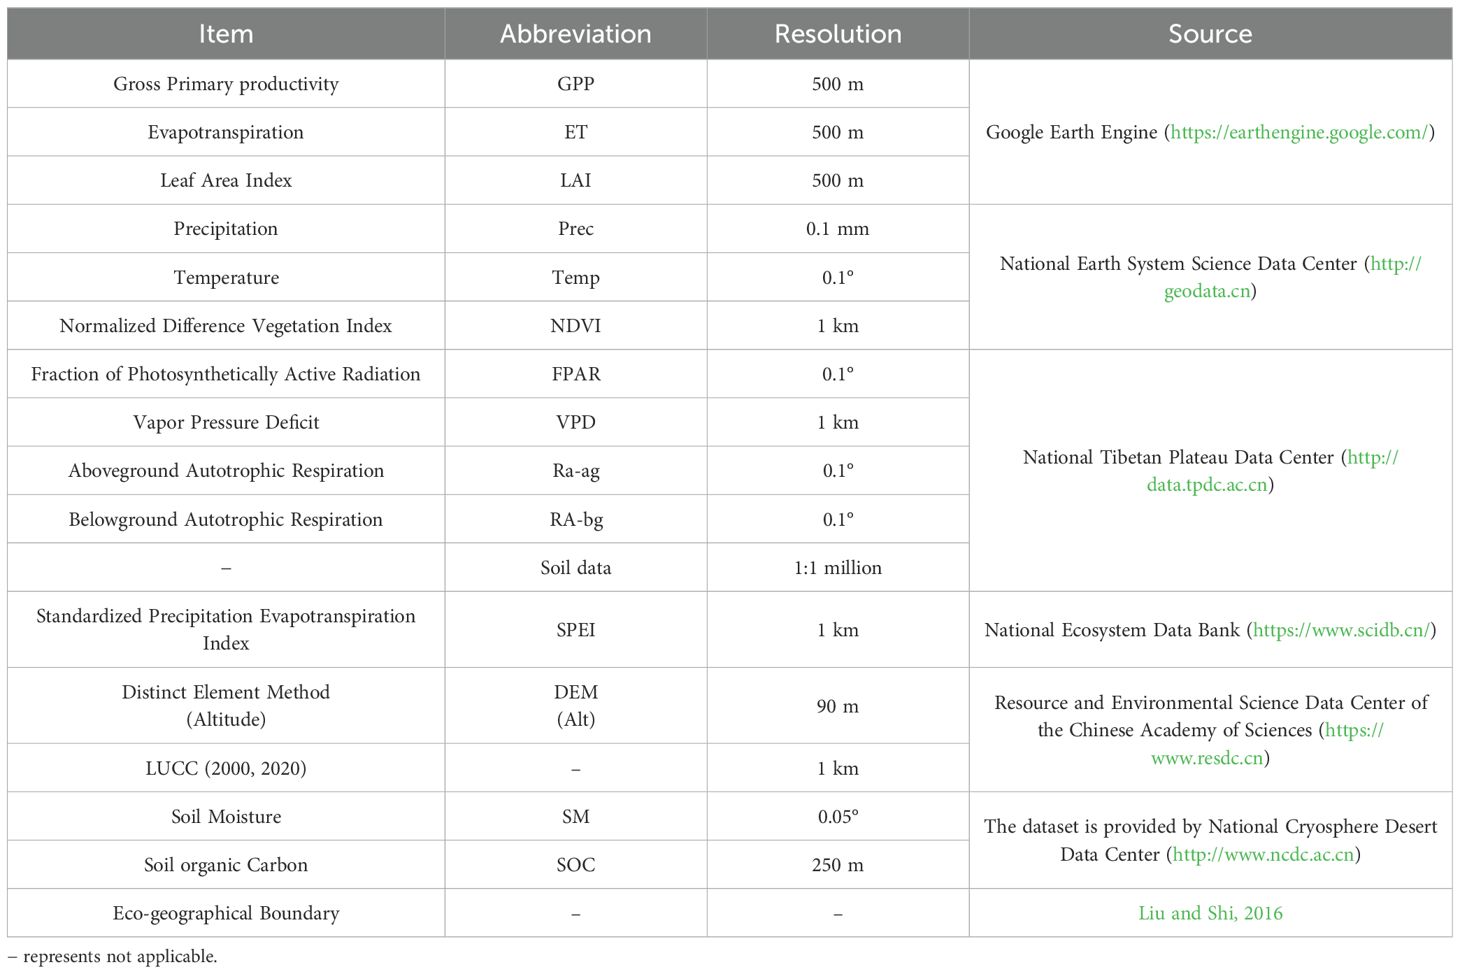
Table 1. Data sources and abbreviation.
2.3 Methods
2.3.1 The calculation formula for WUE
The formula is as Equation 1 (Wang et al., 2021):
where WUE (gCm−2mm−1) is water use efficiency; GPP (g Cm−2) is the gross primary productivity of vegetation is in; ET (mm) is the evapotranspiration of vegetation.
2.3.2 Trend analysis
The change trend is obtained by using the linear fitting function obtained by the least square method. Significance testing using F test (p<0.05) (Stow et al., 2010). The formula is as Equations 2, 3:
where i is the year; n it is the total number of years; Vi is the variable of the i-th year.
where U indicates the error sum of squares and Q means the regression sum of squares.
2.3.3 Correlation analysis
The Person correlation coefficient was used to represent the correlation between WUE and environmental factors, and a significance test was performed at the 0.05 level. The formula is as Equation 4 (Liu et al., 2015):
where PX,Y is the Person correlation coefficient, Xi is WUE; Yi is the environmental factor.
2.3.4 Hurst index
The Hurst index (H) can quantitatively describe the long-term dependence of time series information. In this study, the Hurst exponential range (R/S) analysis method was used, to predict the future trend of WUE in Gansu (Zhu et al., 2012).
2.3.5 Cross-wavelet analysis
Wavelet analysis is a method for analyzing changes in the signal spectrum. Cross wavelet transform (XWT) is a computational method that combines wavelet transform with cross spectrum. It is used to study the correlation between two time series in the time-frequency domain and can obtain the phase relationship and correlation strength of the signals (Grinsted et al., 2004).
For time series {X(i)} and {Y(i)}, where i=1, 2,…, n. The formula for XWT is shown as Equation 5:
where α refers to the time lag; τ is a time translation parameter; CX(α,τ) is the wavelet transform coefficient of the sequence {X(i)}; C*Y(α,τ) represents the complex conjugate of the wavelet transform coefficient of the sequence {Y(i)}. The larger its value is, the more significant the correlation between the high energy regions shared by the two time series is.
Wavelet coherence transform (WTC) can measure the covariance strength of the local correlation between two time series Xn and Yn in the time-frequency space. Its characteristic is that even if the low-energy regions in the cross-wavelet energy spectrum of two time series correspond to each other, they will show obvious correlation in the wavelet coherence spectrum. The formula for WTC is shown as Equations 6, 7:
where S is a smoother.
where, Sscale is the smoothness of the wavelet scale; Stime is the smoothness of the time scale. The range of wavelet coherence value is 0~1, which is the local correlation coefficient of time-frequency space. The larger the value, the stronger the correlation.
2.3.6 Time lag effect
Pearson correlation coefficient (R) was used to investigate the magnitude and time scale of the lagged effect of SPEI on WUE. R ranges from −1 to 1, representing negative to positive correlation (Zhao et al., 2020). In each lag time interval (0≤ i ≤ 12), the partial correlation coefficients (R0, R1, R2, …, R12) between WUE and the monthly SPEI (SPEIi) were first calculated. Then, the maximum correlation coefficient is taken as Ri, which is considered as the optimal correlation, and the number associated with month (i) is considered as the optimal lag.
The formula is as Equations 8, 9:
where Ri is the Pearson partial correlation index lagged i months; The value of is 0 to 12 (0 means no lag effect, 1 to 12 means lag of 1 to 12 months); WUE represents the monthly WUE time series; SPEIi is the monthly SPEI value; Rmax-lag is the maximum value of Ri.
2.3.7 Partial least squares structural equation model geographical detector
Partial least square structural equation modeling (PLS-SEM) is a multivariate statistical model that integrates factor analysis, regression analysis, and path analysis. Unlike covariance-based structural equation modeling (CB-SEM), PLS-SEM relies on principal component analysis and is well suited for small sample sizes, non-normal data, and formative and reflective measurement models (Hair et al., 2019). The model includes two basic components: measurement model and structural model, which solves the complex relationship between latent variables. The formula is as Equation 10 (Vinzi et al., 2009):
where ξj is endogenous latent variable; ξi is an exogenous latent variable; βji represents the path coefficient between the i-th exogenous latent variable and the j-th endogenous latent variable; ζj is the random error term of the relationship in the model.
The linear equation for the relationship between latent variables and measured variables in the measurement model can be expressed as Equation 11:
where xjk is the variable to be measured; ξjis a latent variable; λjk represents the factor loading of the j-th measured variable corresponding to the k-th principal component; ζj is the measurement error term.
3 Results
3.1 Changes in the distribution if WUE
3.1.1 Temporal and spatial changes of WUE
The WUE in Gansu has shown a slight upward trend over the years, with an average value of 1.71 gCm−2mm−1. Among them, 2008 (1.501 gCm−2mm−1) and 2015 (1.122 gCm−2mm−1) were the years with the highest and lowest values, respectively (Figure 2a). The areas with the highest WUE values were mainly between 0.5 and 1 (29.6%) (Figure 2a). From a spatial perspective, the southeast was high and the northwest was low (Figure 2a).
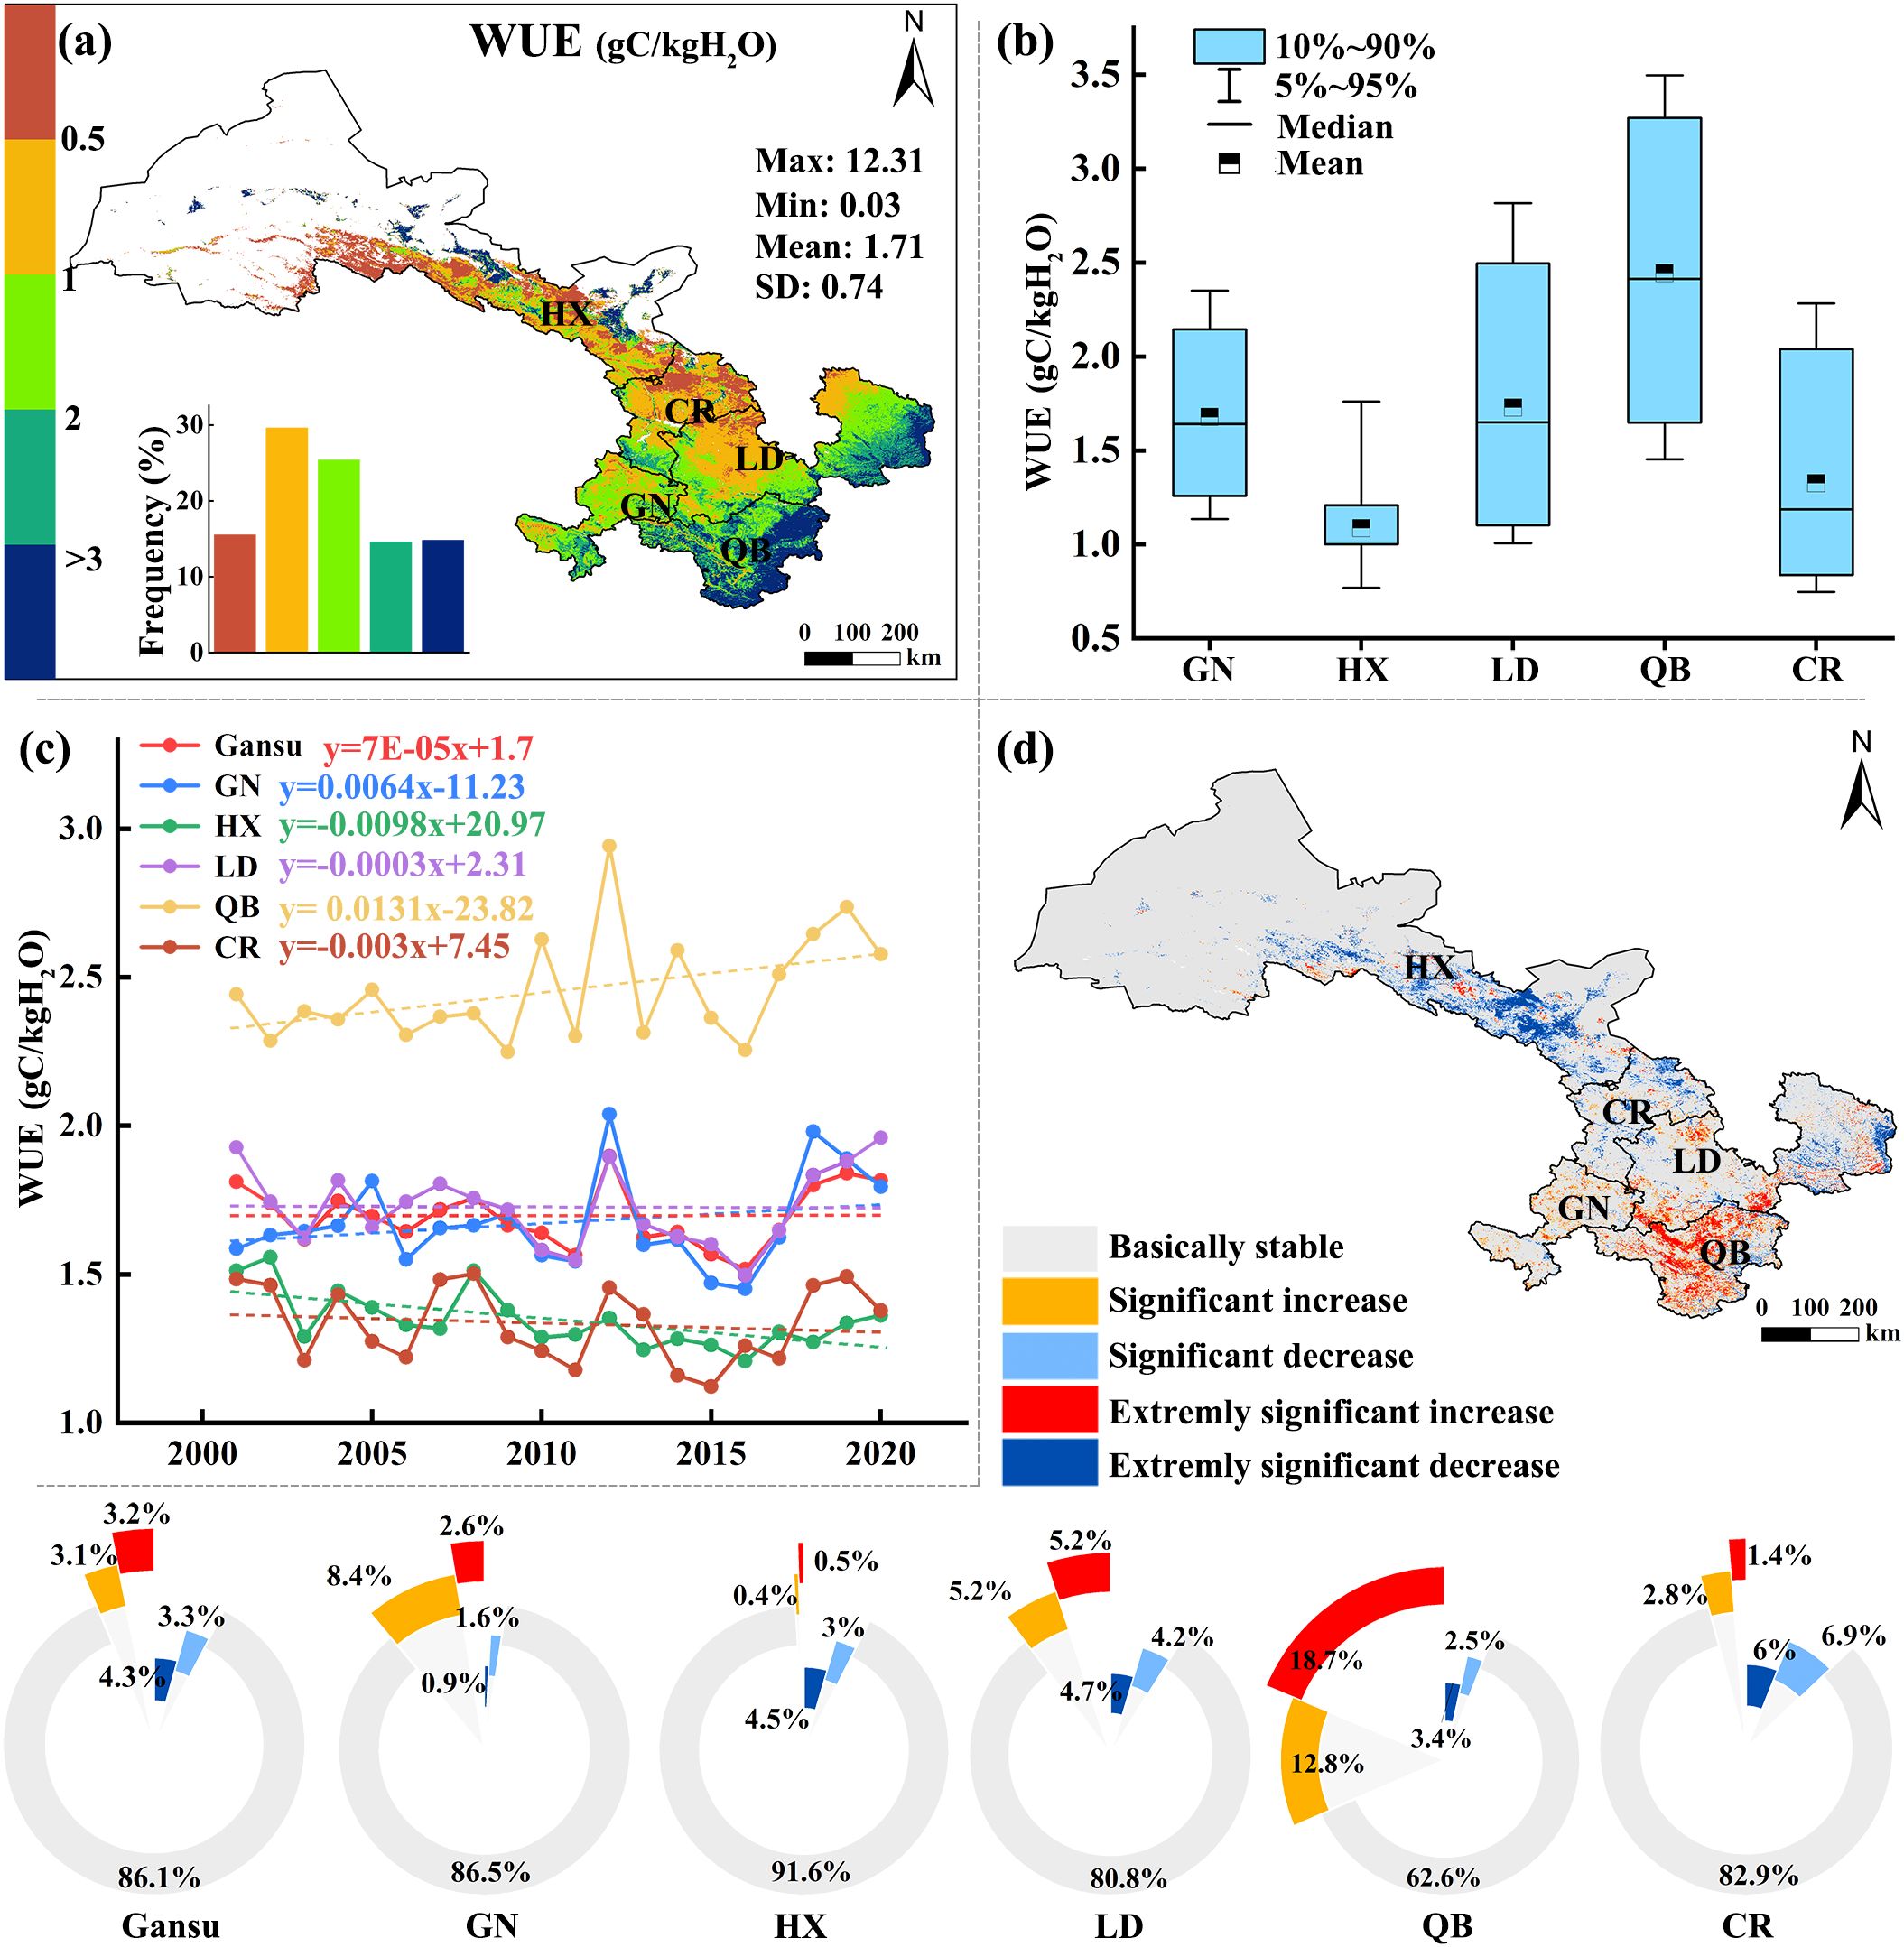
Figure 2. Spatiotemporal distribution and trend of WUE in Gansu from 2001 to 2020. (a) Spatial distribution; (b) the distribution patterns of average WUE; (c) average annual dynamic; (d) spatial trend (p< 0.05 denotes significant difference, p< 0.01 denotes extremely significant difference).
Among the restoration areas, WUE was higher in QB (2.45 gCm−2mm−1), followed by LD (1.73 gCm−2mm−1), GN (1.67 gCm−2mm−1), HX (1.35 gCm−2mm−1) and CR (1.33 gCm−2mm−1) (Figure 2b). Among the restoration areas, the WUE in GN (0.0064) and QB (0.0131) areas showed a slight upward trend, while other restoration areas showed a downward trend (Figure 2c).
Over the past 20 years, about 86.1% of Gansu has maintained a relatively stable WUE, with the increases and decreases being equal (Figure 2d). Among them, about 3.1% of the areas showed a significant upward trend in WUE, and about 3.2% of the areas showed a very significant increase. These significant trends occurred mainly in the southern region, especially in the QB region. Among the restoration areas, 31.5% of the QB region showed an upward trend, while the areas with a downward trend were mainly distributed in the eastern part of the region. WUE decreased in 7.6% of Gansu, scattered in HX, LD and CR regions. The decline in WUE in CR region was more significant, accounting for 12.9% of the area.
3.1.2 Future trend changes in WUE
The WUE in Gansu mainly showed negative sustainable characteristics (77.4%) and was widely distributed from 2001 to 2022 (Figure 3a). The regions with positive sustainability characteristics accounted for 22.6%, of which the regions with strong (H≥0.65) sustainability characteristics accounted for 0.8%. The Hurst index of the five restoration areas mainly showed the characteristics of weak anti-sustainability. Among them, the GN region had the highest proportion of positive sustainable characteristics (25.9%), and the QB region had the highest proportion of strong anti-sustainability characteristics (19.6%).
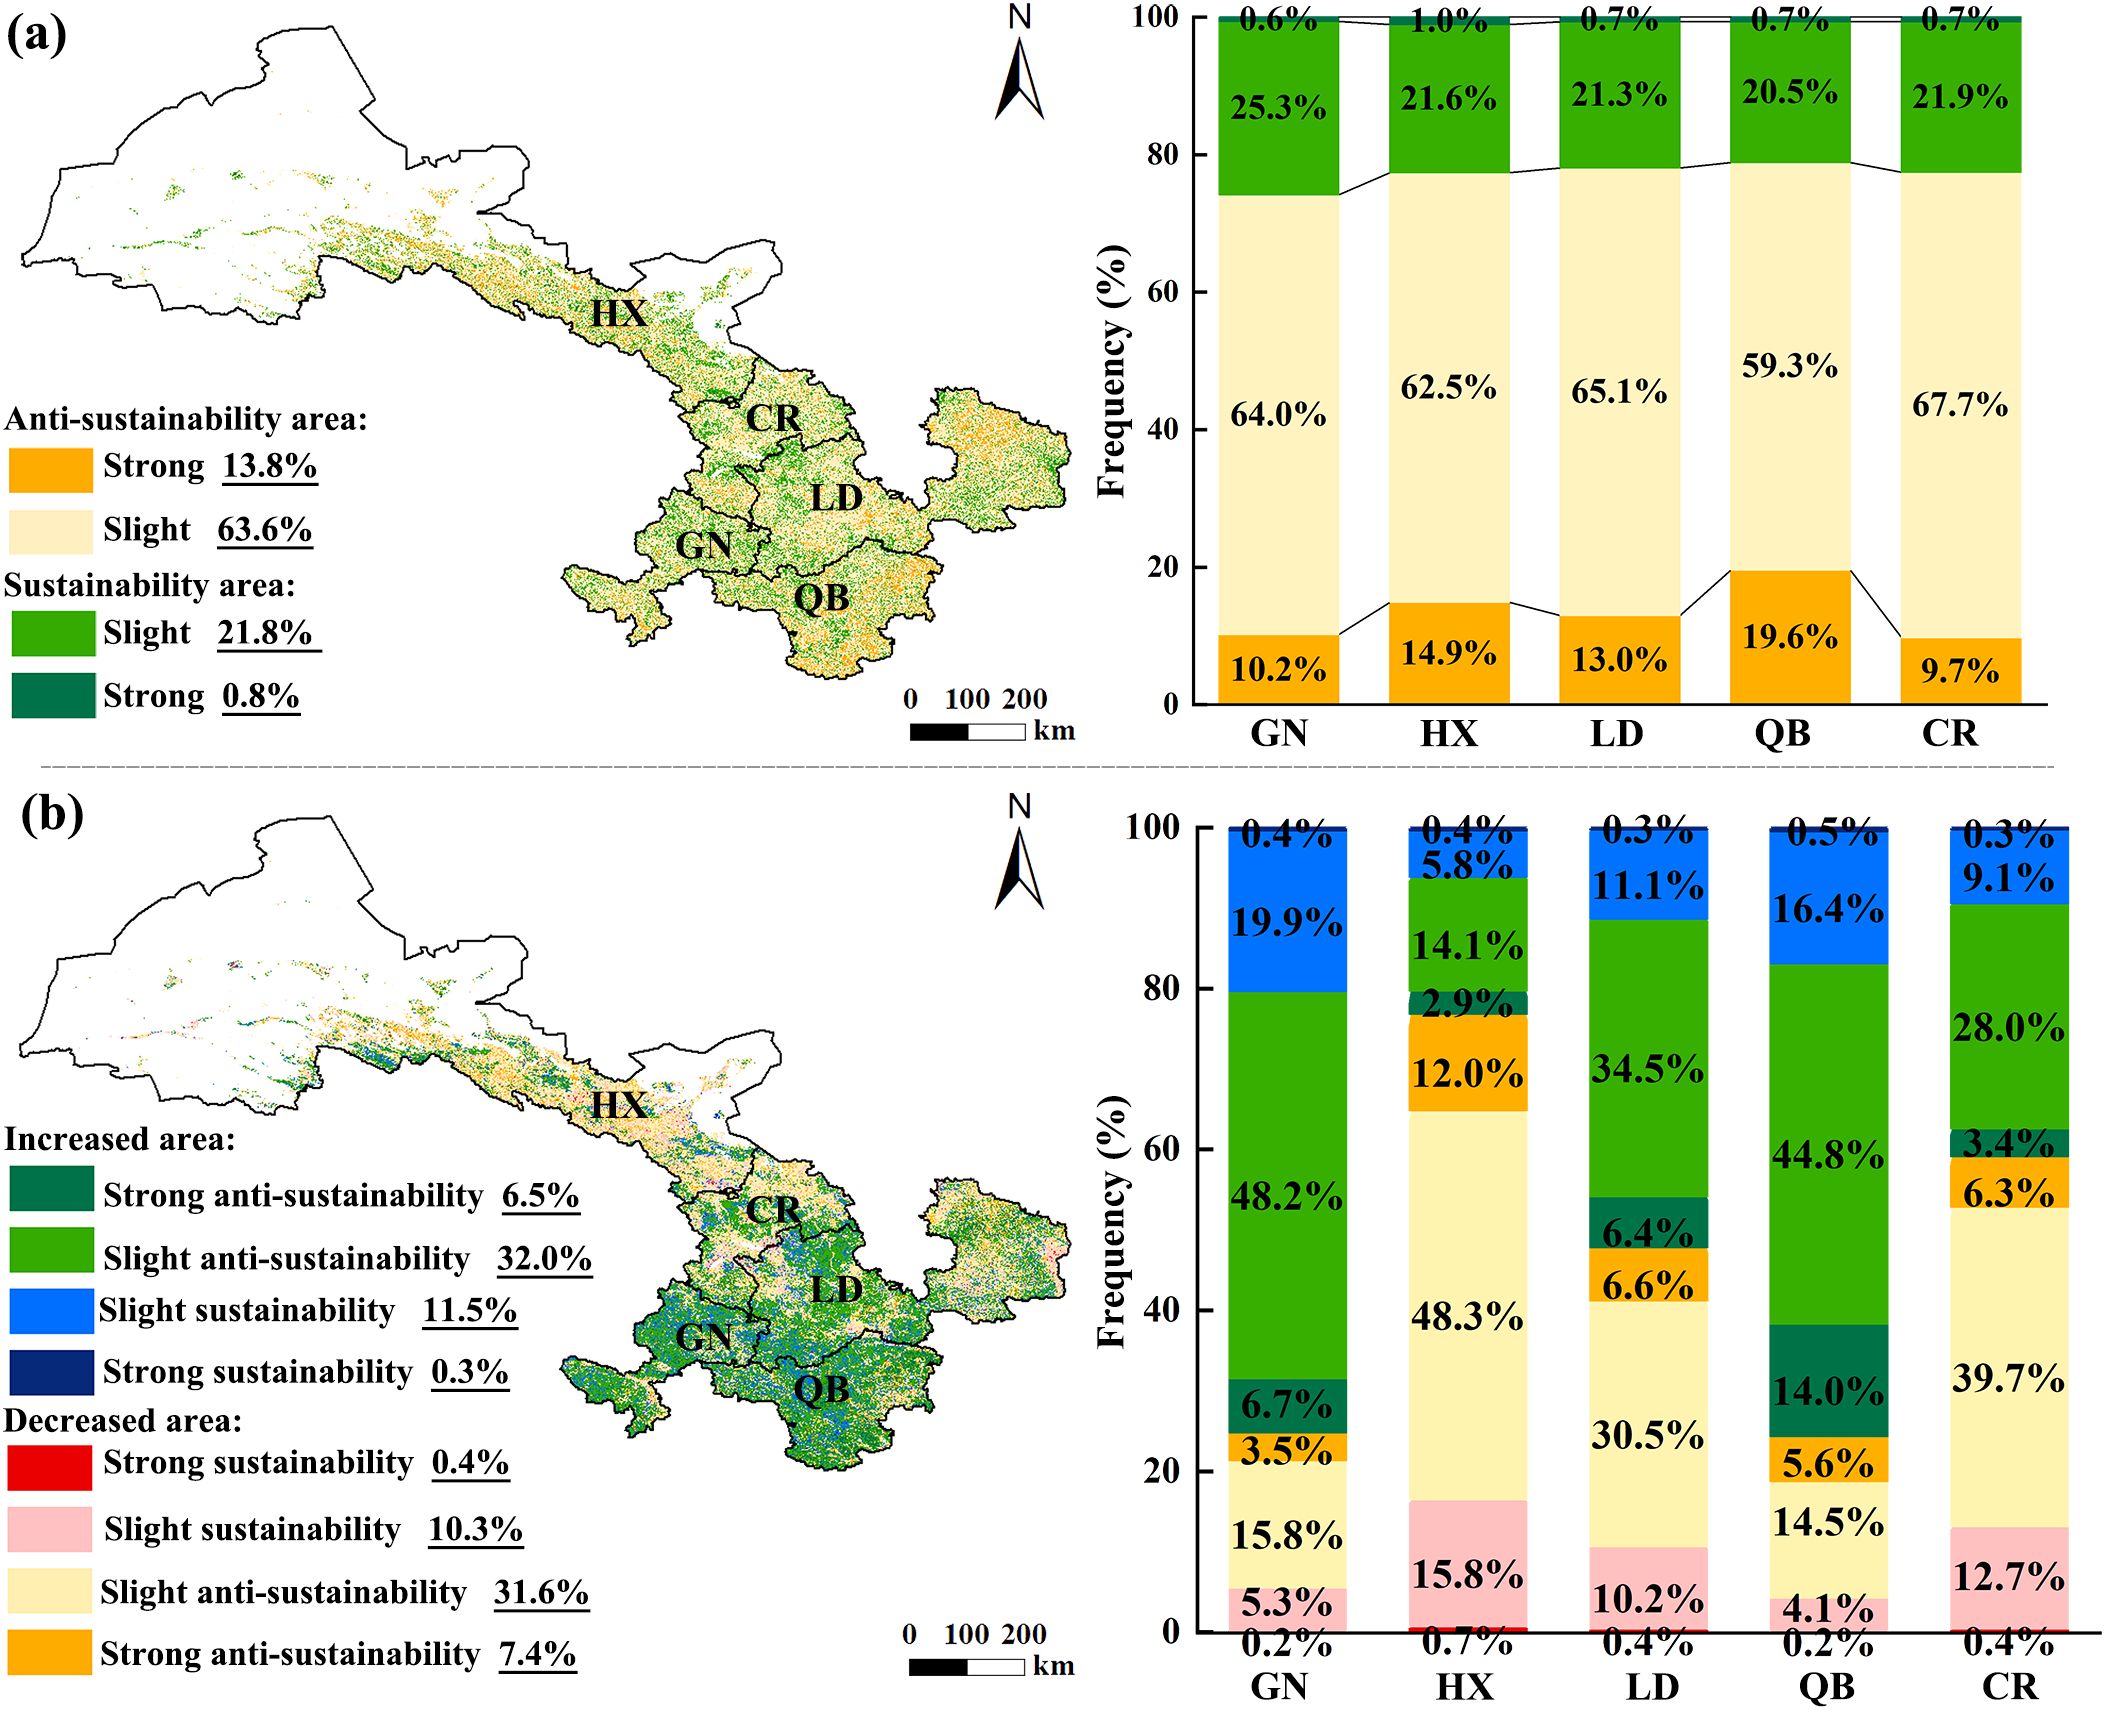
Figure 3. The Hurst index of WUE (a), the future dynamic trend in WUE (b).
The WUE in Gansu was in a state of continuous and stable change (77.5%), of which 39% of the area degrading and 38.5% of the area improving (Figure 3b). The five restoration areas are mainly in a state of anti-sustainability stable state. Among them, GN (48.2%), LD (34.5%) and QB (44.8%) were mainly slightly anti-sustainability increase, while HX (48.3%) and CR (39.7%) were mainly slightly anti-sustainability decrease.
3.2 Influencing factors of spatial variation of WUE
A partial positive correlation (PPC) between Prec and WUE was observed in 61.68% of the study areas (Figure 4a). The areas with partial correlation coefficient (PCC)> 0.6 accounted for 3.49%, mainly distributed in GN area, and scattered in the QB area and the western part of LD area. About 76.68% of the study area showed a partial negative correlation between Temp and WUE (Figure 4b). About 20.98% of the study area showed PPC between VPD and WUE, mainly distributed in the HX (39.97%) and the CR (24.31%) (Figure 4c). In 98.11% of the GN, VPD was negatively correlated with WUE.
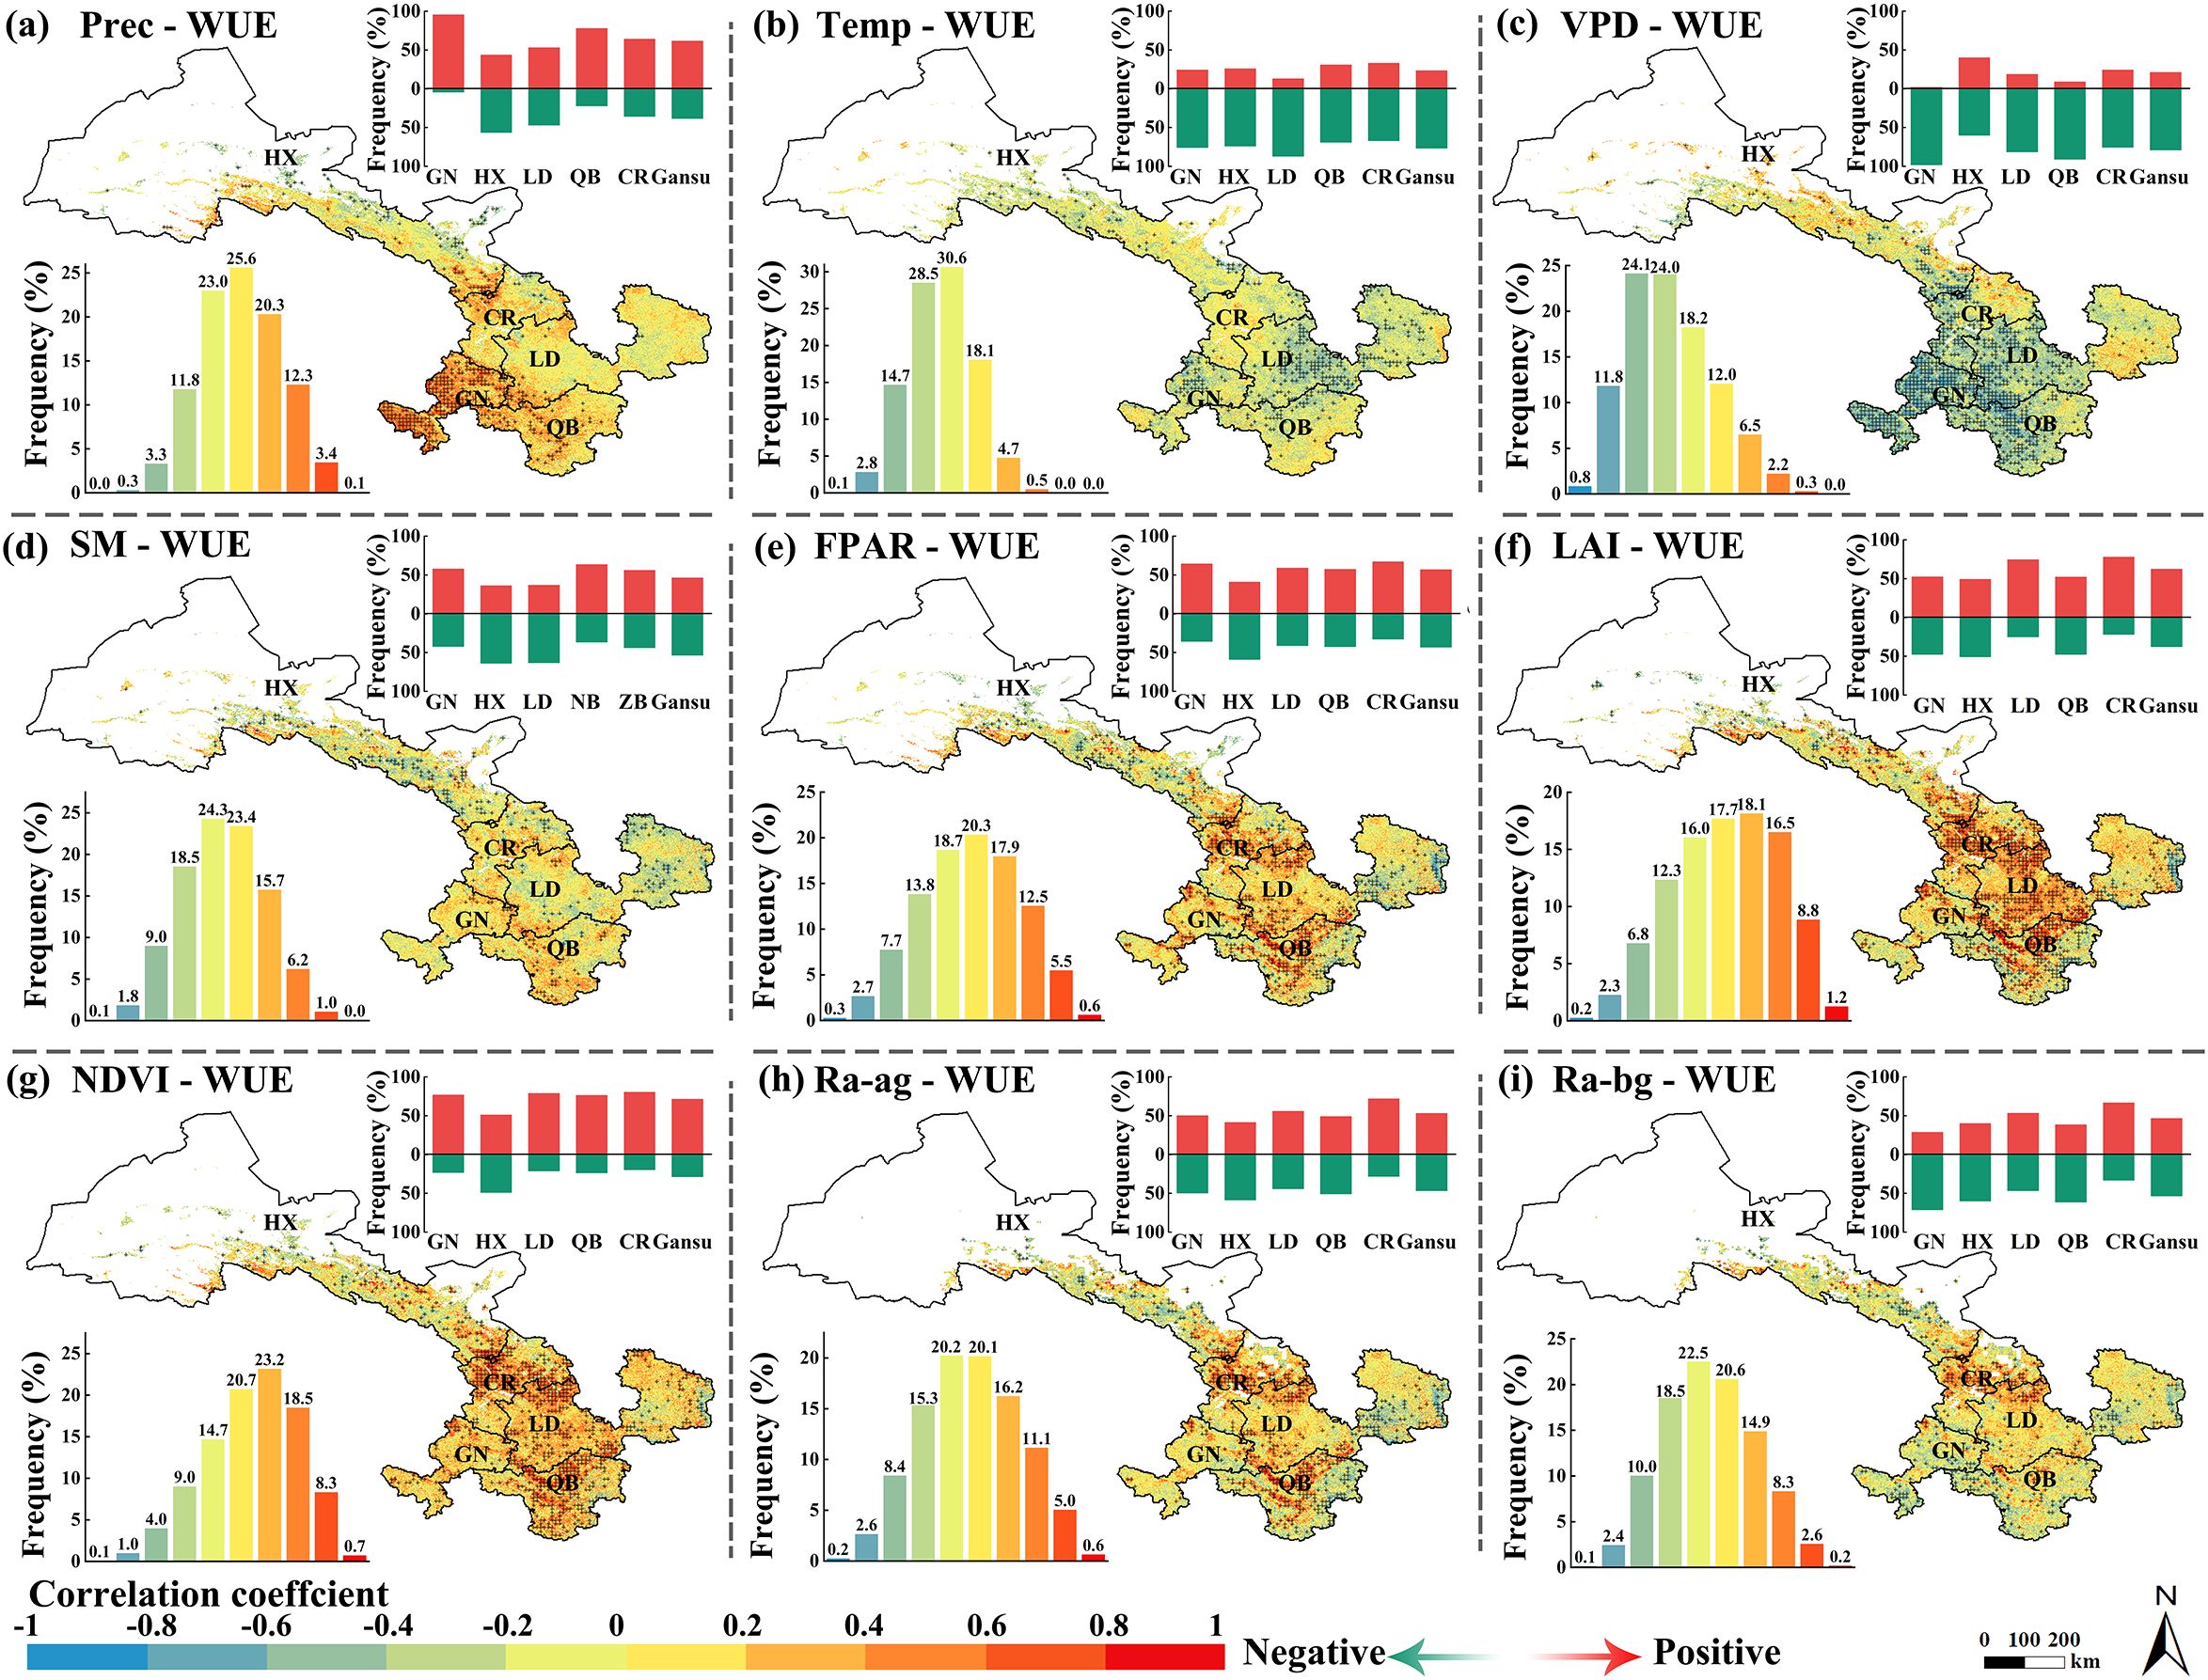
Figure 4. Effects of factors on WUE: the partial correlations of (a) Prec, (b) Temp, (c) VPD, (d) SM, (e) FPAR, (f) LAI, (g) NDVI, (h) Ra-ag, (i) Ra-bg with WUE.
PPC between Prec and SM was observed in 46.37% of the study areas (Figure 4d). 1.08% of the regions showed PCC > 0.6, and approximately 21.92% of the regions had PCC between 0.2 and 0.6. Among the restoration areas, more than 50% of QB (63.38%), GN (57.71%) and CR (56.07%) showed PCC (Figure 4d).
About 46.14% of the study area had PPC between FPAR and WUE, distributed in various restoration areas. About 67.14% of CR showed a negative correlation between FPAR and WUE (Figure 4e). PPC between LAI and WUE was observed in 62.36% of the study areas (Figure 4f). 10.08% of the regions showed PCC > 0.6, mainly distributed in QB, CR and LD. PCC between NDVI and WUE was observed in about 71.33% of Gansu (Figure 4g). Among the restoration areas, 48.96% of the areas in HX showed negative correlation (Figure 4g). PPC between Ra-ag and WUE was found in about 53.18% of the study area (Figure 4g), mainly distributed in CR (71.83%), LD (55.79%), and GN (50.23%) (Figure 4h). Ra-ag was negatively correlated with WUE in 46.82% of Gansu and 558.69% of Hexi. PPC between Ra-bg and WUE was found in about 46.46% of Gansu (Figure 4i). Among the restoration areas, 66.66% of the CR showed positive correlation, while 71.32% of the GN showed negative correlation.
The cross wavelet transform and coherent wavelet transform were performed on the monthly SPEI and WUE in Gansu to further analyze the common characteristics between the SPEI and WUE correlation index cycles (Figures 5a, b). The high energy area of the wavelet power spectrum of WUE and SPEI had significant resonance period of 9–15 months in 10–40 months and 125–210 months, and the phase changes were disordered, and the relationship between the two was unstable. As can be seen from the figure that the low energy area of the wavelet coherent power spectrum of SPEI and WUE had significant resonance periods of 4–5 months, 3–5 months, and 3–5 months in 10–22 months, 47–50 months, and 171–176 months, and the phase changes were disordered, and the relationship between the two was unstable. There was a significant resonance period of 0–3 months from 71–86 months, the average phase angle was close to vertical upward, and SPEI lagged significantly behind WUE. There was a significant resonance period of 4–6 months in months 110-118, with the average phase angle close to vertical downward and WUE lagging significantly behind SPEI. There was a significant resonance period of 4–5 months in months 150-160, and the average phase angle was close to changing from right to left, showing a negative phase change. There was a significant resonance period of 6–7 months from months 197 to 200, and the average phase angles were nearly from left to right, showing a positive phase change.
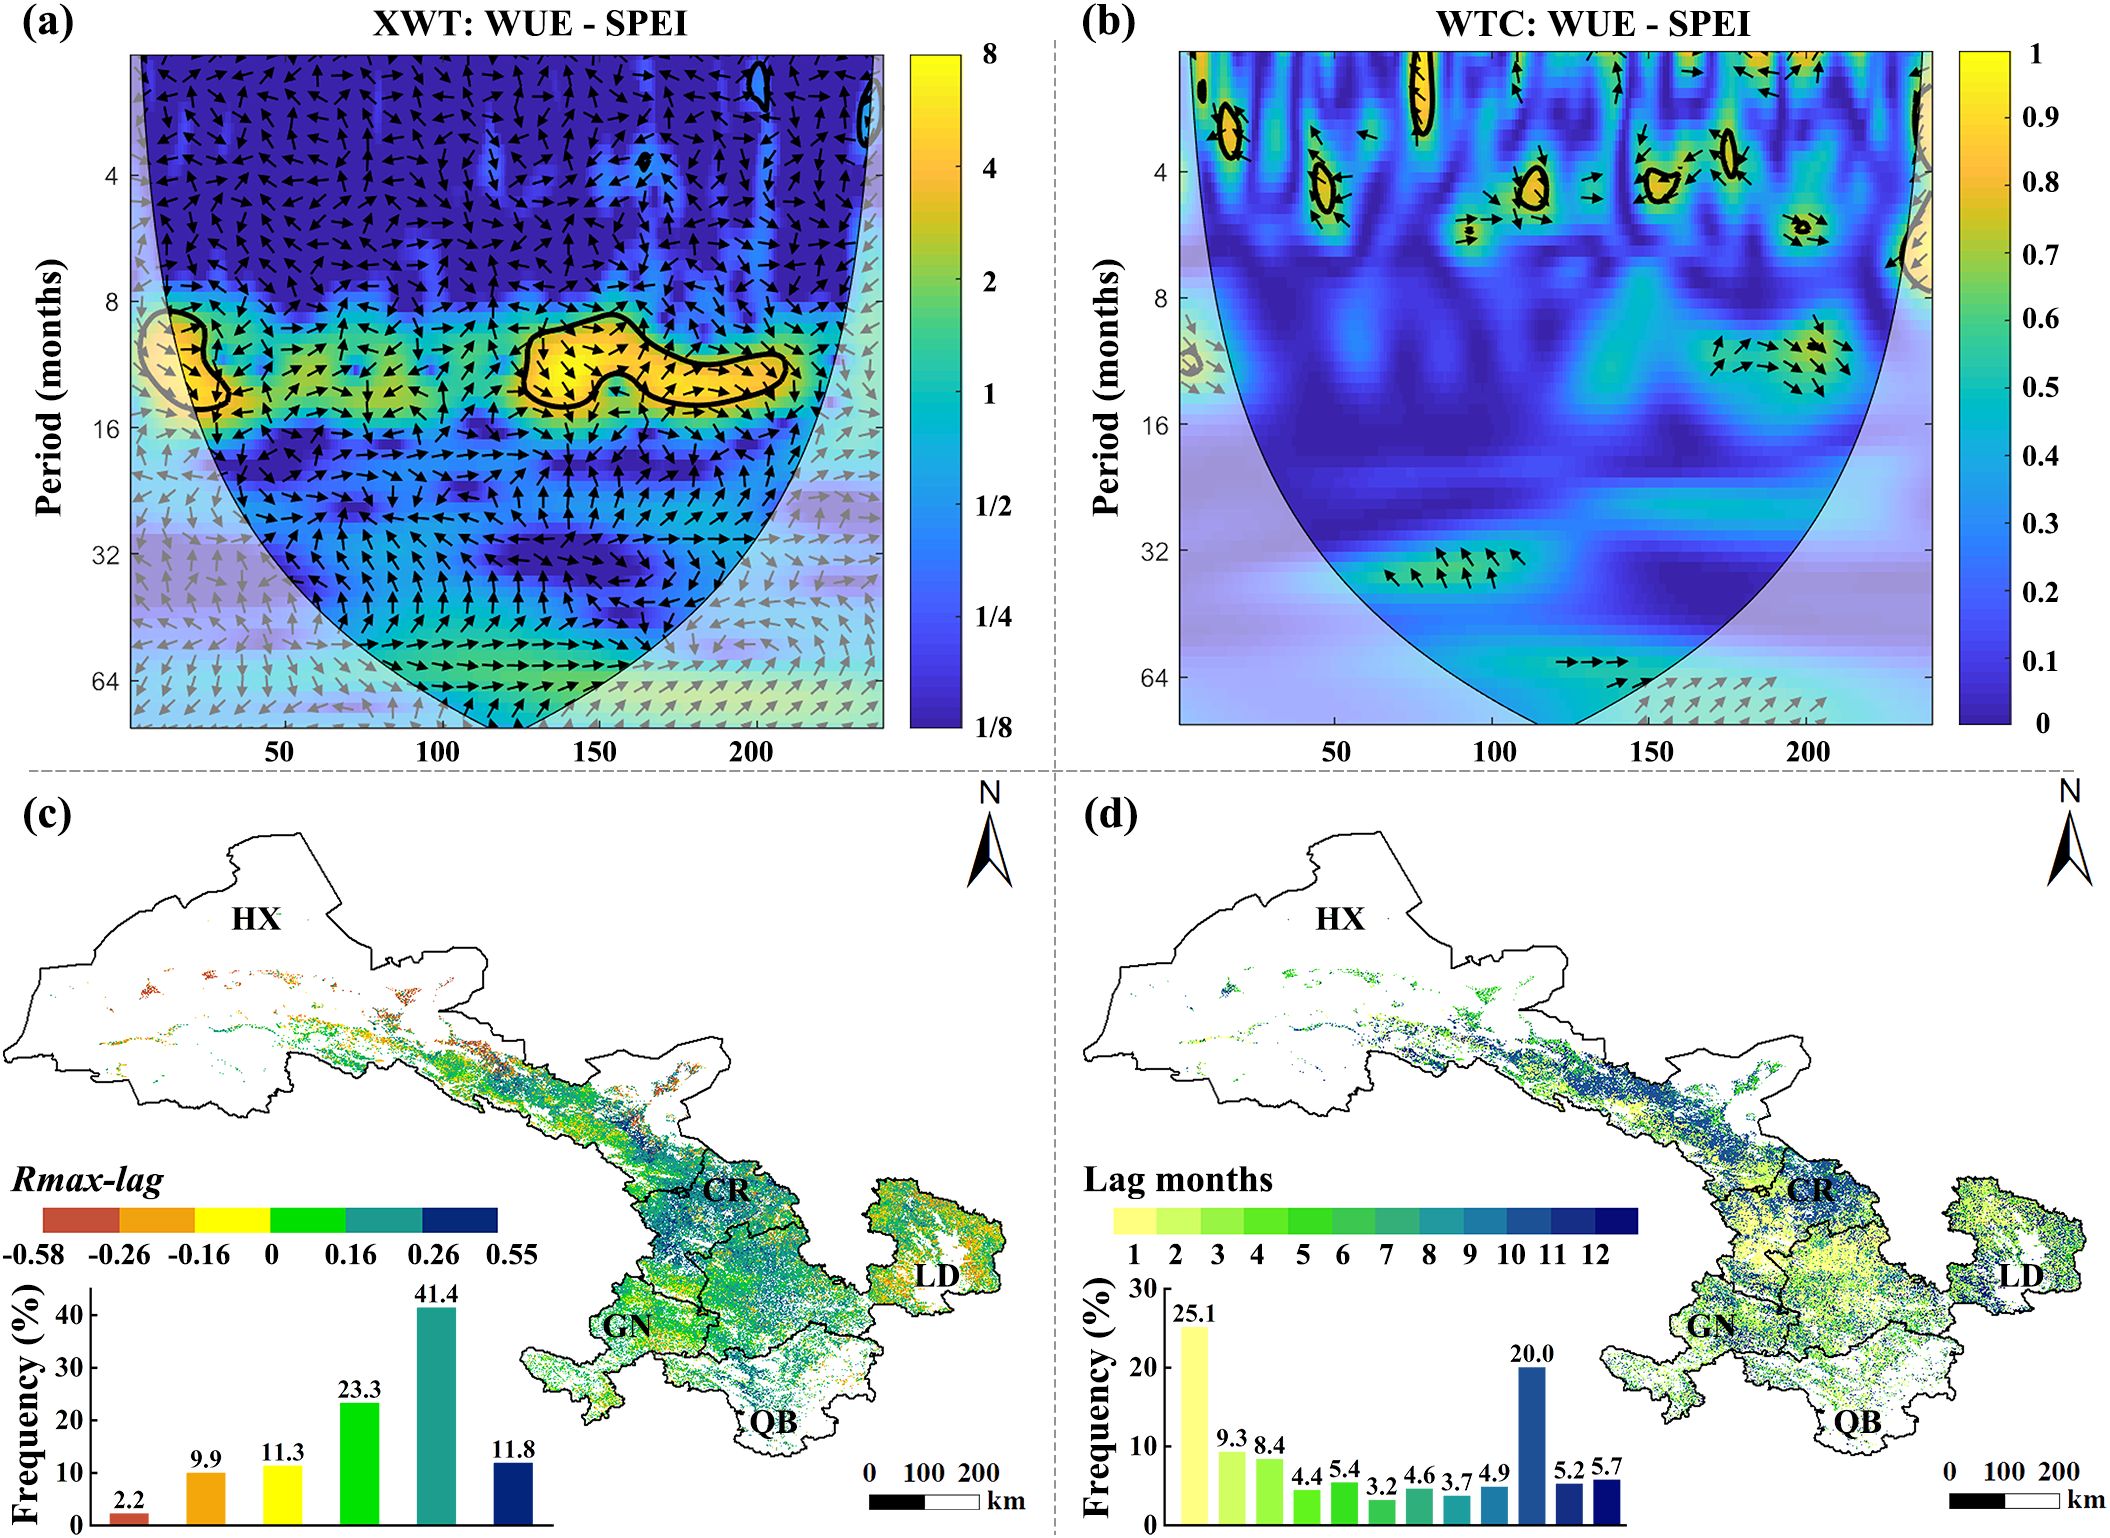
Figure 5. Cross wavelet transform (a) and coherent wavelet transform (b) of monthly SPEI and WUE; Spatial patterns of the lagged effect time scale (c), Rmax-lag and lag months of drought on WUE (d).
The hysteresis effect of drought significantly affected the water cycle process in Gansu, and then affected the WUE in Gansu. The lag effect of drought on WUE and the number of lag months were obtained through partial correlation analysis between WUE and SPEI lagged by 1 month. In 76.5% of Gansu, WUE was positively correlated with lagged SPEI (Figure 5c). The number of lagged months within one month accounts for 25.12% of the total area, mainly distributed in the western and central areas of LD and the southwestern part of HX. The regions with a lag of 6 to 12 months accounted for 47.36%, indicating that the impact of SPEI on WUE had a long lag (Figure 5d). Among them, the regions lagging behind by 10 months accounted for 20%, mainly distributed in the northeast of the CR region and the central part of the HX region.
WUE was higher in low altitude and high slope areas (Figure 6a). When the altitude was below 1000 m, WUE showed a “single peak” pattern with increasing slope, and WUE was higher around 5°-20°. In the range of 1000 m-4000 m above sea level, the greater the slope, the higher the WUE value, and the highest value appears at around 1600 m and around 35°. When the altitude was higher than 4000 m, WUE was in the low value area regardless of the slope. Basically, it showed that at low Longitude, the higher the Latitudes, the lower the WUE (Figure 6b). At low Latitudes, the lower the Longitude the lower the WUE.
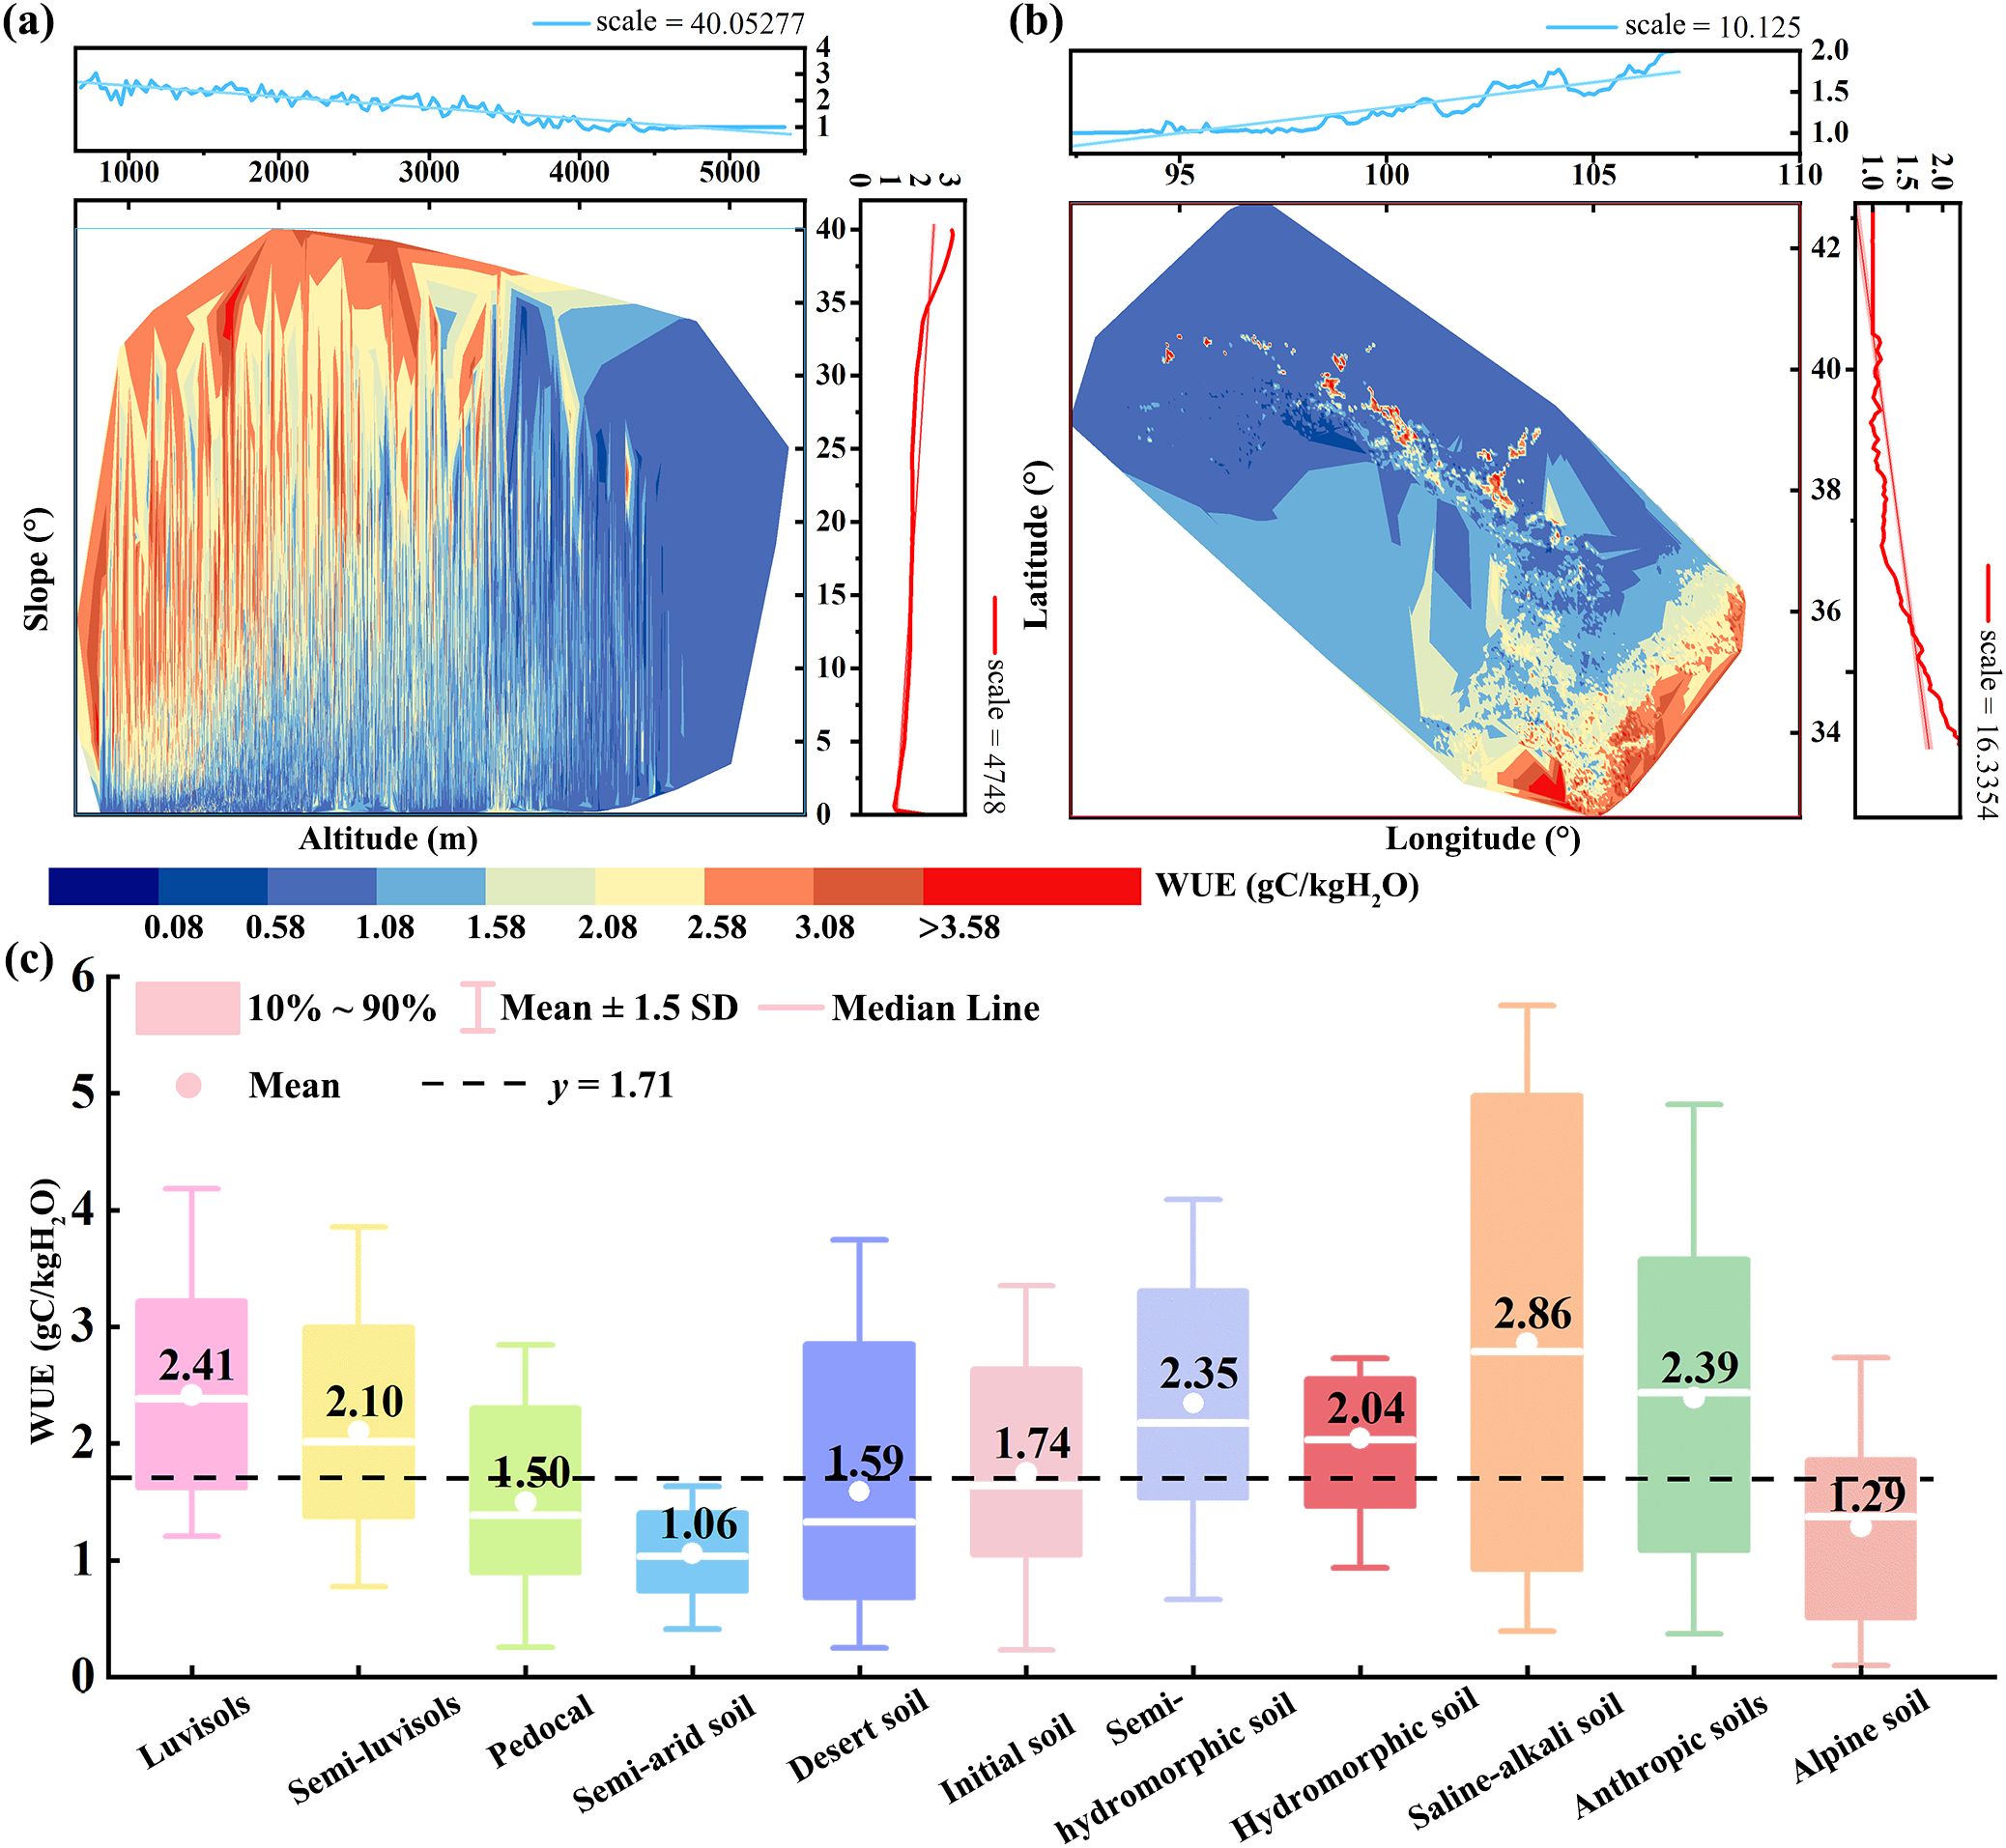
Figure 6. Relationships of slope and altitude (a), latitude and longitude (b) with average annual WUE; (c) WUE of different soil types.
There were significant differences in WUE among different soil types (Figure 6c). The multi-year average value of WUE was 1.71 gCkg−1, among which Desert soil (1.59 gCkg−1), Pedocal (1.50 gCkg−1), Semi-arid soil (1.06 gCkg−1) and Alpine soil (1.29 gCkg−1) were lower than the average value (Figure 6c).
3.3 Direct and indirect effects of driving of driving factors on WUE
The PLS-SEM method was used to further analyze the impact of different types of factors on the spatial distribution of WUE (Shao et al., 2024). The factors are classified and integrated into climate latent variables, terrain latent variables, soil latent variables and vegetation latent variables. Based on certain assumptions, a conceptual model was established: terrain, vegetation, climate, and soil directly the spatial pattern of WUE; terrain indirectly affects the spatial pattern of WUE through climate and soil; climate indirectly affects the spatial pattern of WUE through vegetation, and vegetation indirectly affects the spatial pattern of WUE through soil (Figure 7).
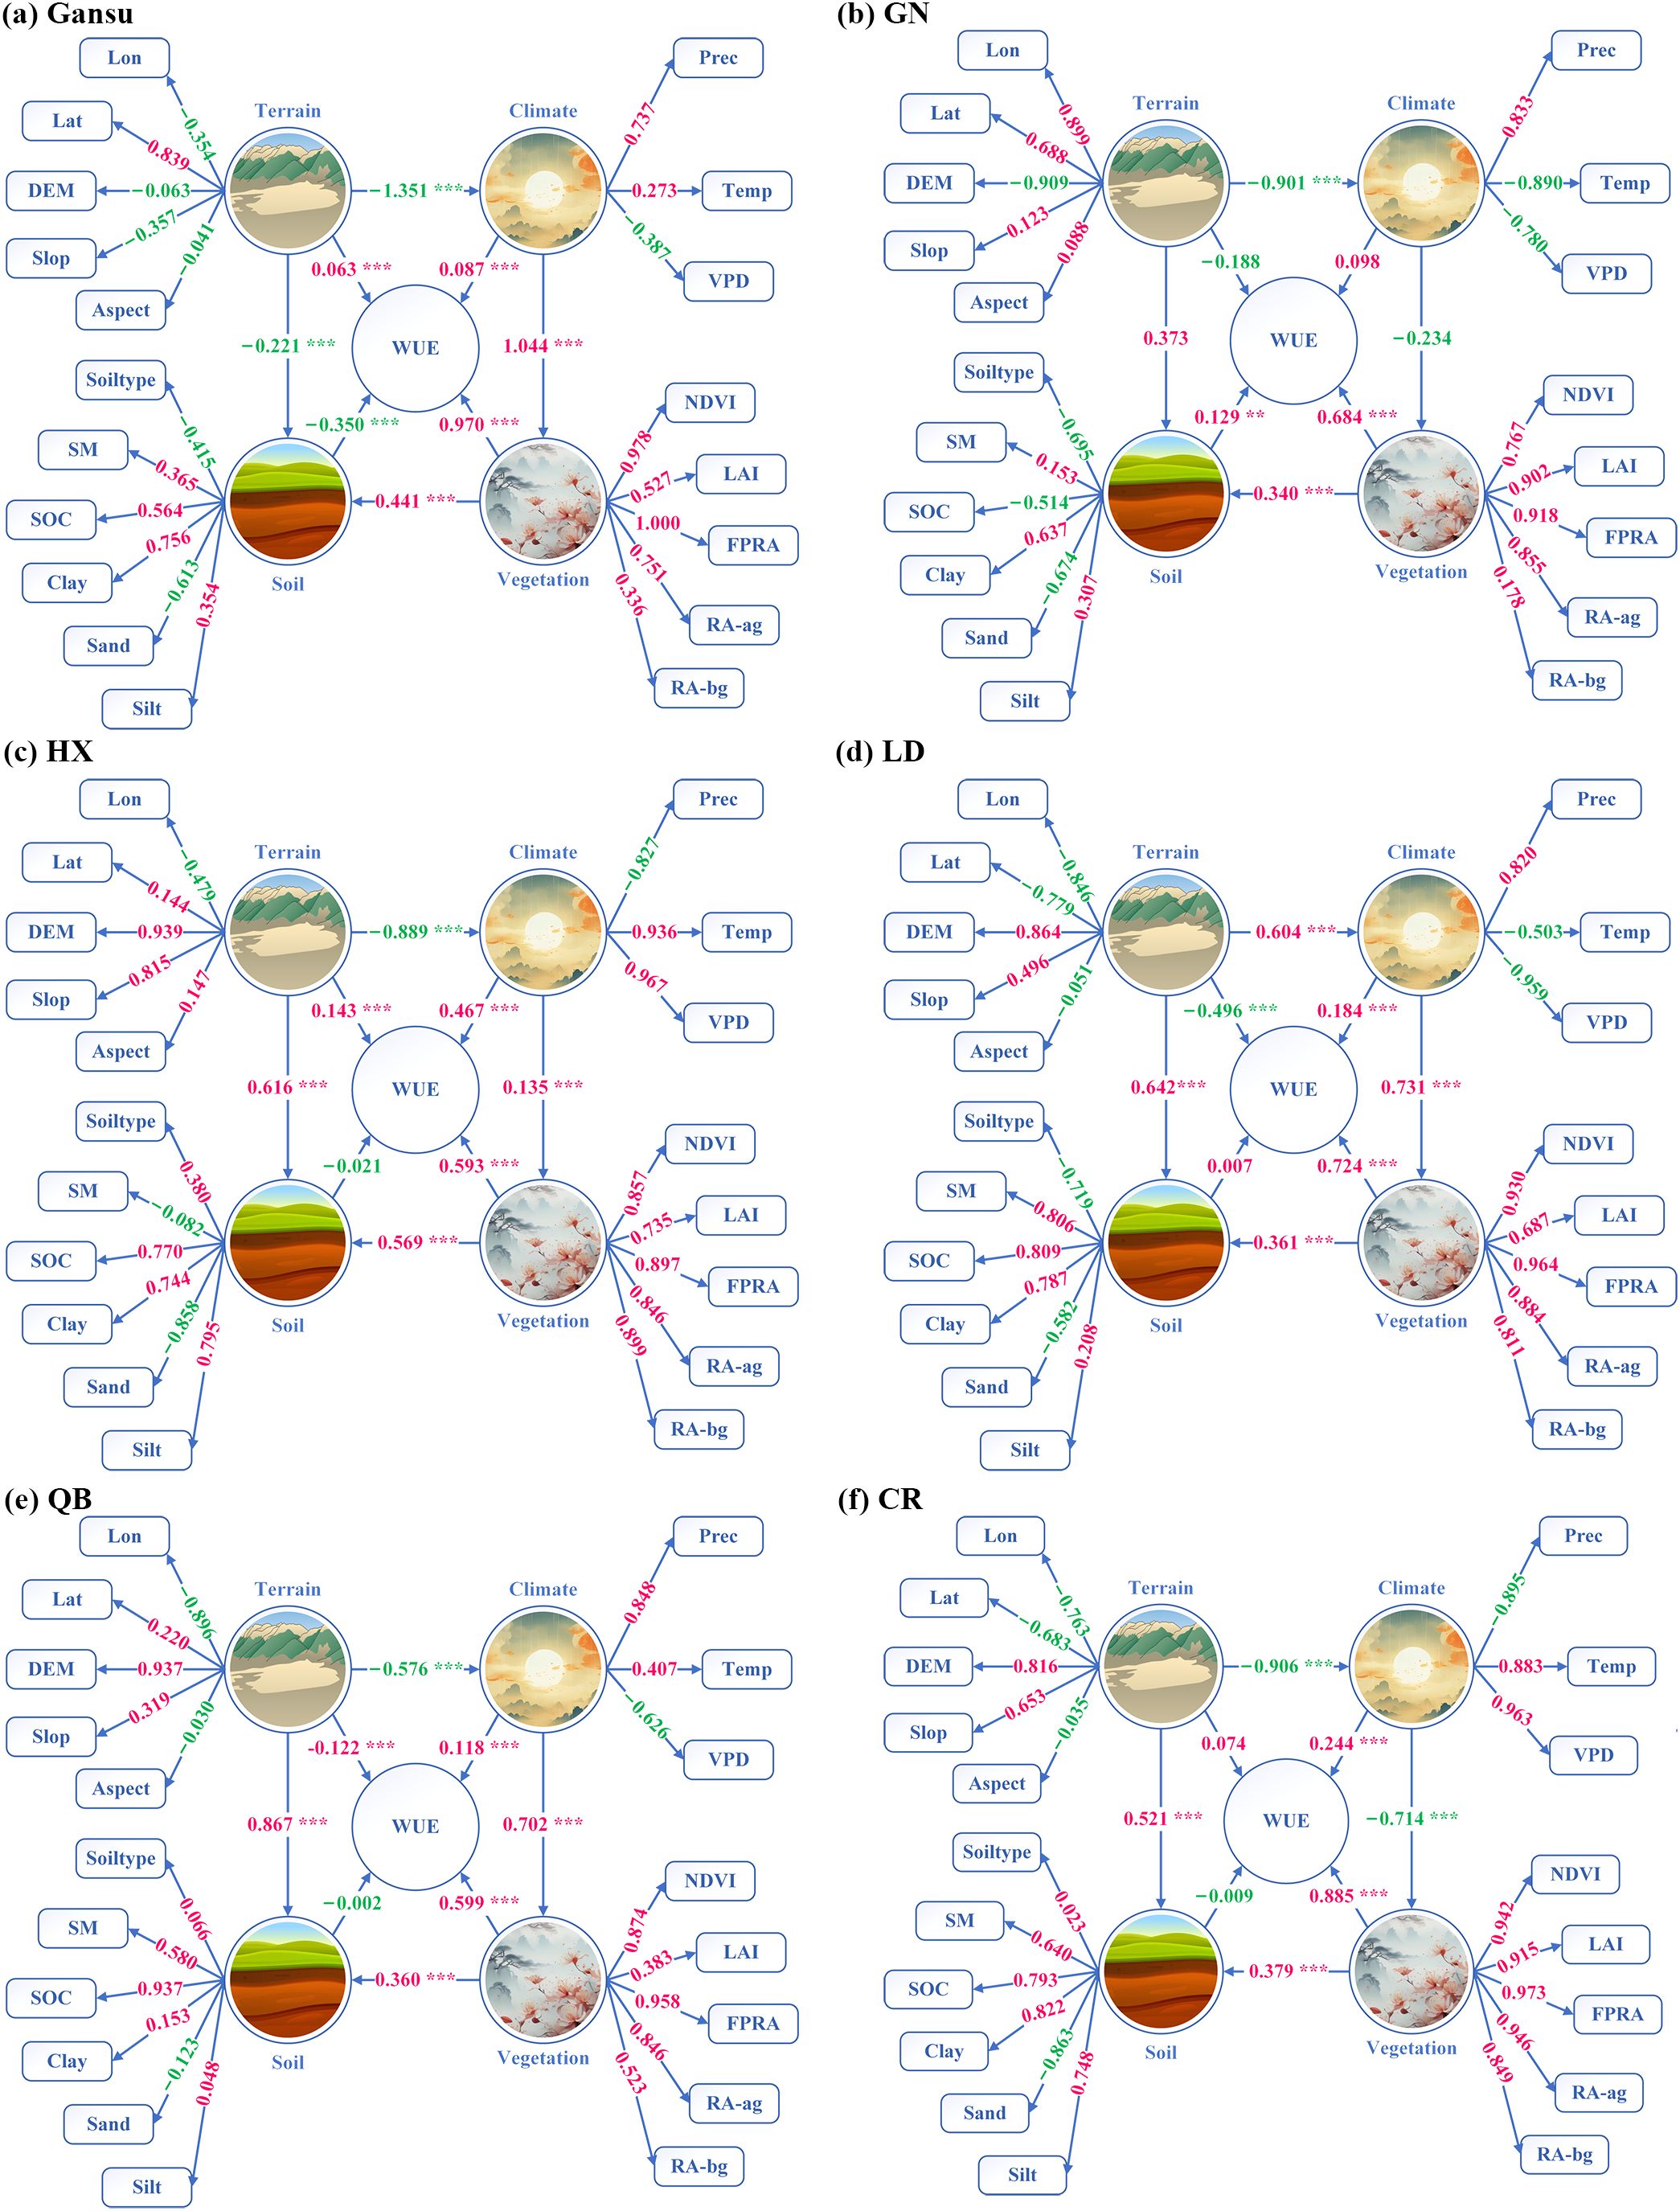
Figure 7. The causal relationship between potential variables and WUE in Gansu and its restoration areas [** denotes significant difference (p<0.05); *** denotes extremely significant difference (p<0.001)]. (a) Gansu (b) GN (c) HX (d) LD (e) QB (f) CR.
The path coefficients of the model illustrate the direct and indirect effects of latent variables on vegetation change, indicating that latent variables such as terrain, climate, soil, and vegetation all significantly affect the spatial pattern of WUE (Figure 7). In Gansu and its restoration areas, there is a direct positive response between climate and vegetation. Soil had a direct positive effect on LD, while other restoration areas and Gansu had direct negative effect. Terrain had a direct negative effect on LD, while other areas and Gansu had direct positive effects (Figure 7).
In Gansu, the effect of terrain on WUE through climate and vegetation was −0.576, and the effect of terrain on vegetation through climate was −0.641 (Figure 8a). The impact of climate on WUE through vegetation is 0.685, and the effect of climate on soil through vegetation is 0.323. The effect of climate on WUE through vegetation in GN was −0.160, and the effect of terrain on WUE through climate and vegetation was 0.144 (Figure 8b). The effect of terrain on WUE through climate in HX was −0.415, and the effect of terrain on vegetation through climate was −0.12 (Figure 8c). The effect of climate on WUE through vegetation in LD was 0.529, the effect of terrain on WUE through climate and vegetation is 0.32, and the effect of terrain on vegetation through climate is 0.441 (Figure 8d). The effect of climate on WUE through vegetation in QB was 0.42, and the effect of terrain on vegetation through climate was −0.404 (Figure 8e). The effect of climate on water use efficiency through vegetation in CR was −0.631, the effect of terrain on vegetation through climate was 0.647, and the effect of terrain on WUE through climate and vegetation was 0.572 (Figure 8f).
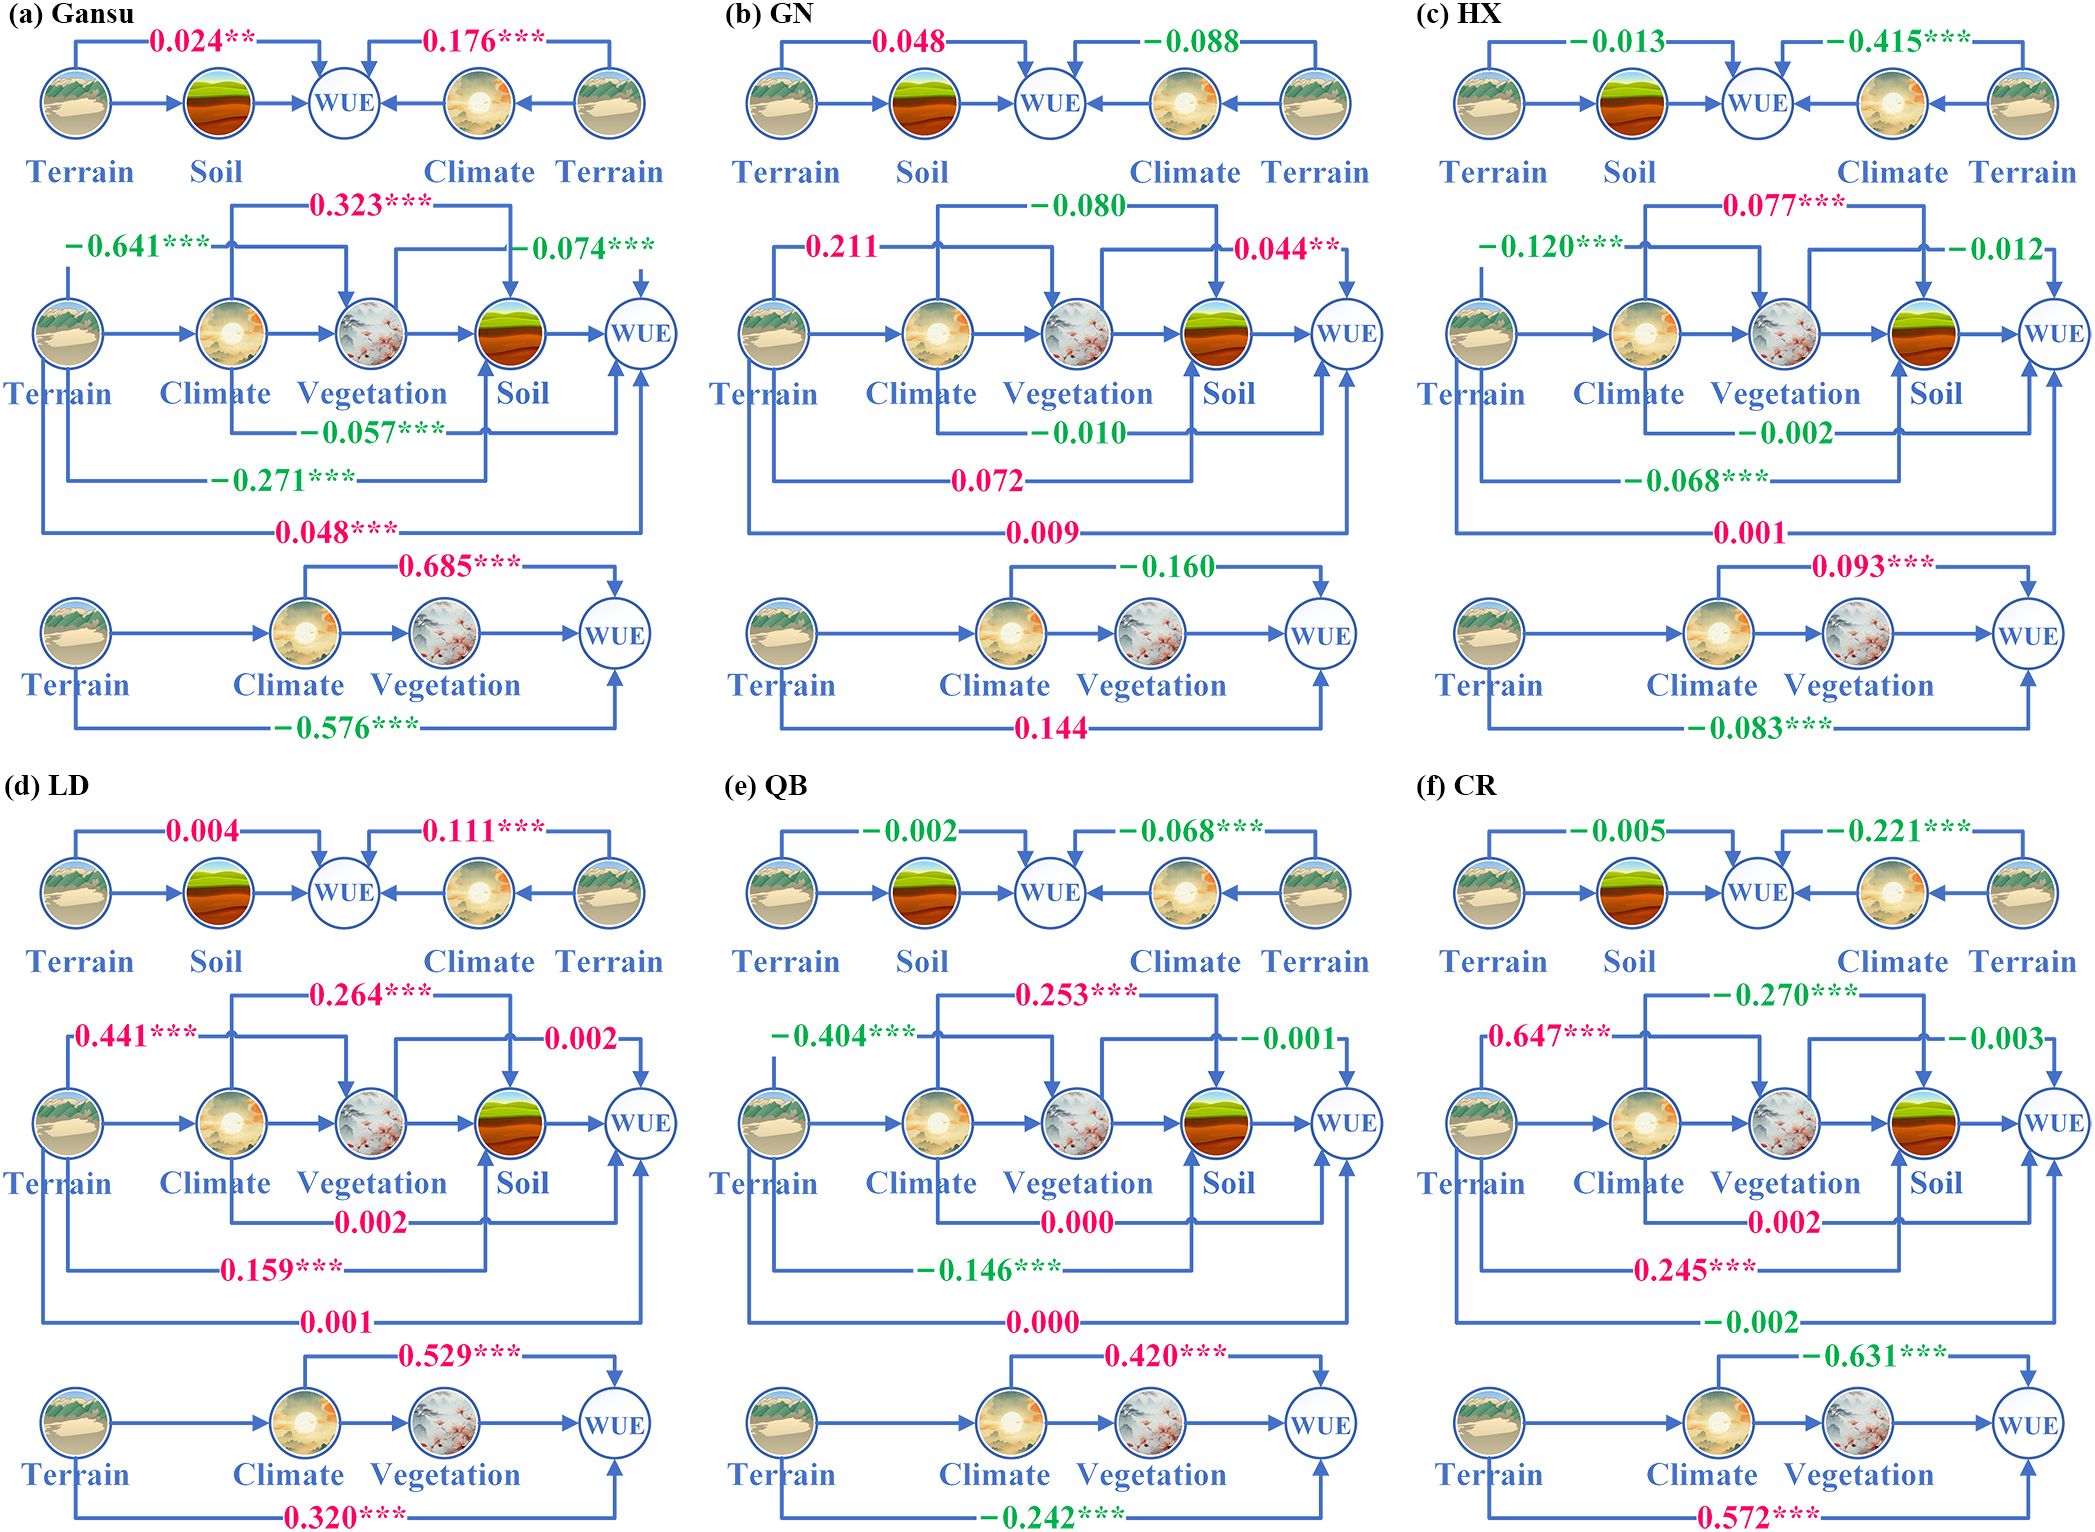
Figure 8. Indirect effects of potential variables on WUE in Gansu and its restoration areas [** denotes significant difference (p<0.05); *** denotes extremely significant difference (p<0.001)]. (a) Gansu (b) GN (c) HX (d) LD (e) QB (f) CR.
The results in Figure 9 highlight that topographic factor had a negative impact on the spatial pattern of WUE in Gansu (−0.521), HX (−0.366), LD (−0.060), QB (−0.434) and GN (−0.074), while CR (0.418) had an overall positive impact. Soil factors had a negative impact on the spatial pattern of WUE in Gansu (−0.175), Gannan (−0.009), HX (−0.021), QB (−0.002) and CR (−0.009), while LD (0.007) had an overall positive impact. Climate factor had a positive impact on the spatial pattern of WUE in Gansu (0.418), HX (0.558), LD (0.715) and QB (0.538), while GN (−0.073) and CR (−0.385) had a negative overall effect. The overall response of vegetation factors in each region was positive (Figure 9).
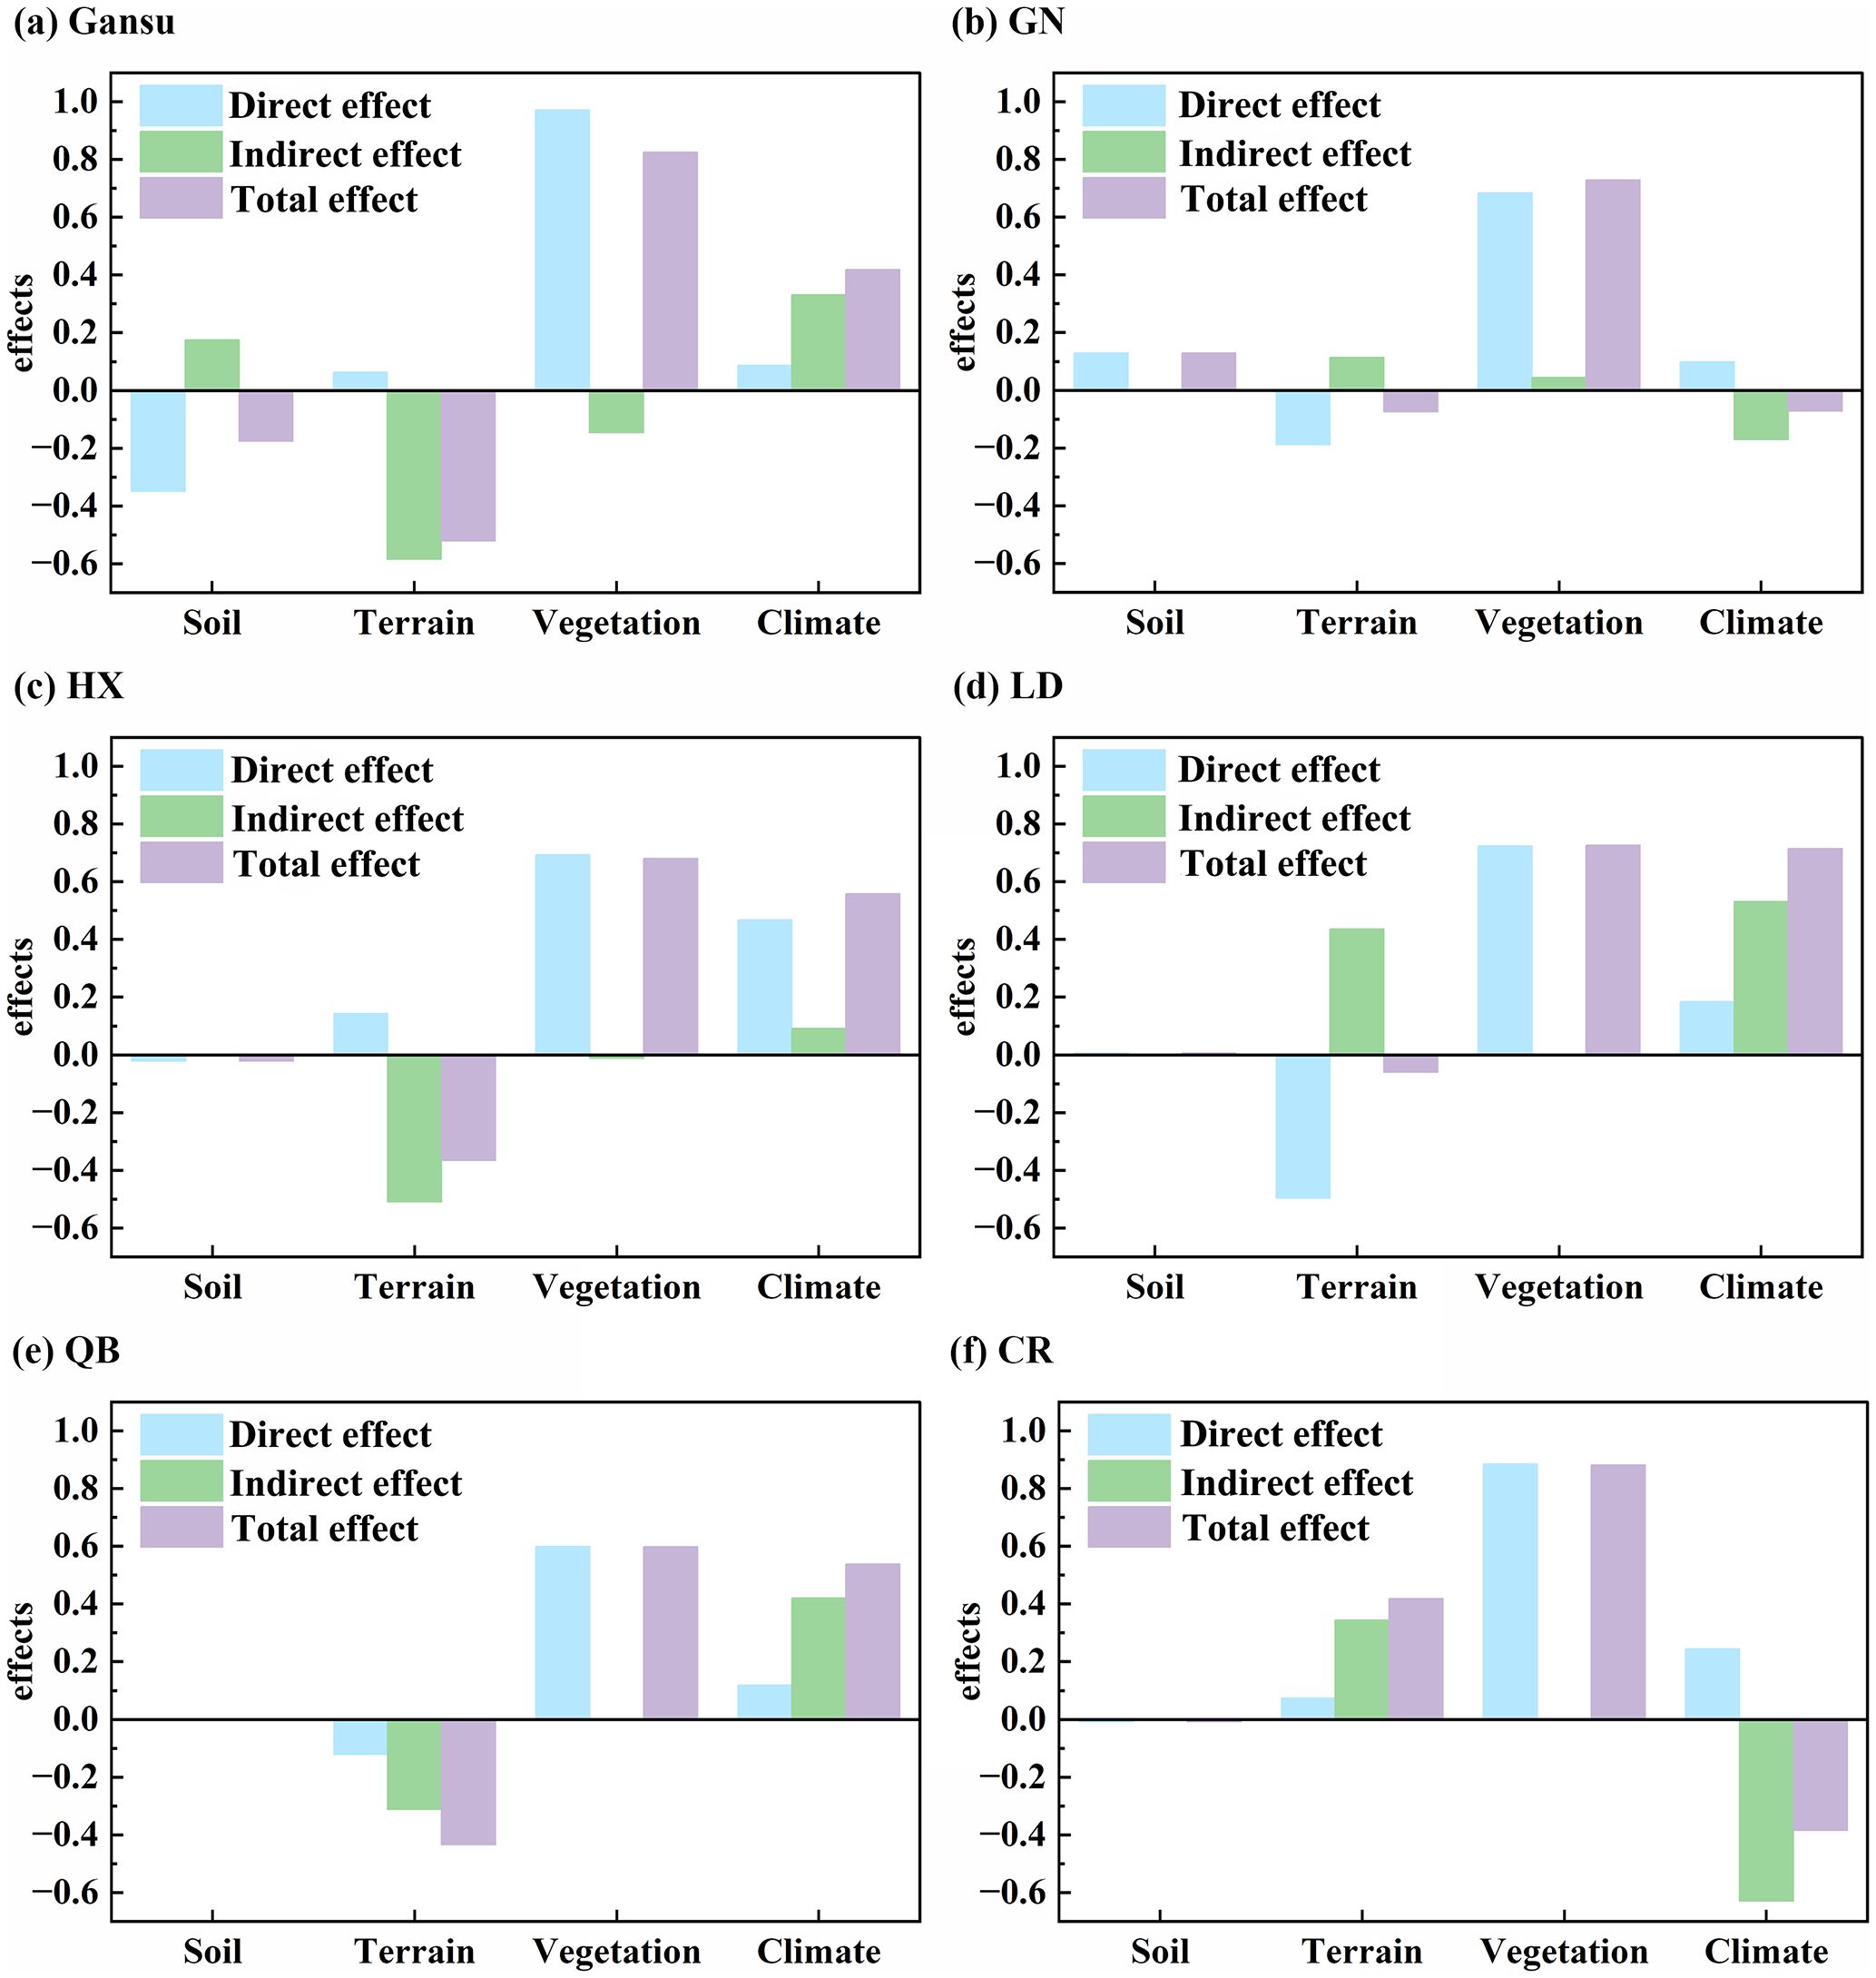
Figure 9. The direct, indirect and total effects of potential variables on WUE in Gansu and its restoration areas. (a) Gansu (b) GN (c) HX (d) LD (e) QB (f) CR.
4 Discussion
4.1 Temporal and spatial variation characteristics of WUE in Gansu and its restoration area
The multi-year average WUE in Gansu is 1.71 gCm−-2mm−1. Gansu has a complex and diverse terrain, with high terrain in the southwest and low terrain in the northeast (Figures 2a, b). The regional hydrothermal characteristics are affected by the terrain and terrain. The southeast is humid, the central part is dry, and the northwest is extremely dry. The temperature and precipitation are unevenly distributed, the hydrothermal combination is significantly different, and the distribution of water resources is extremely unbalanced. These lead to regional differences in vegetation. Spatially, WUE decreases gradually from southeast to northwest, showing a positive distribution along the precipitation ladder (Figure 10a).
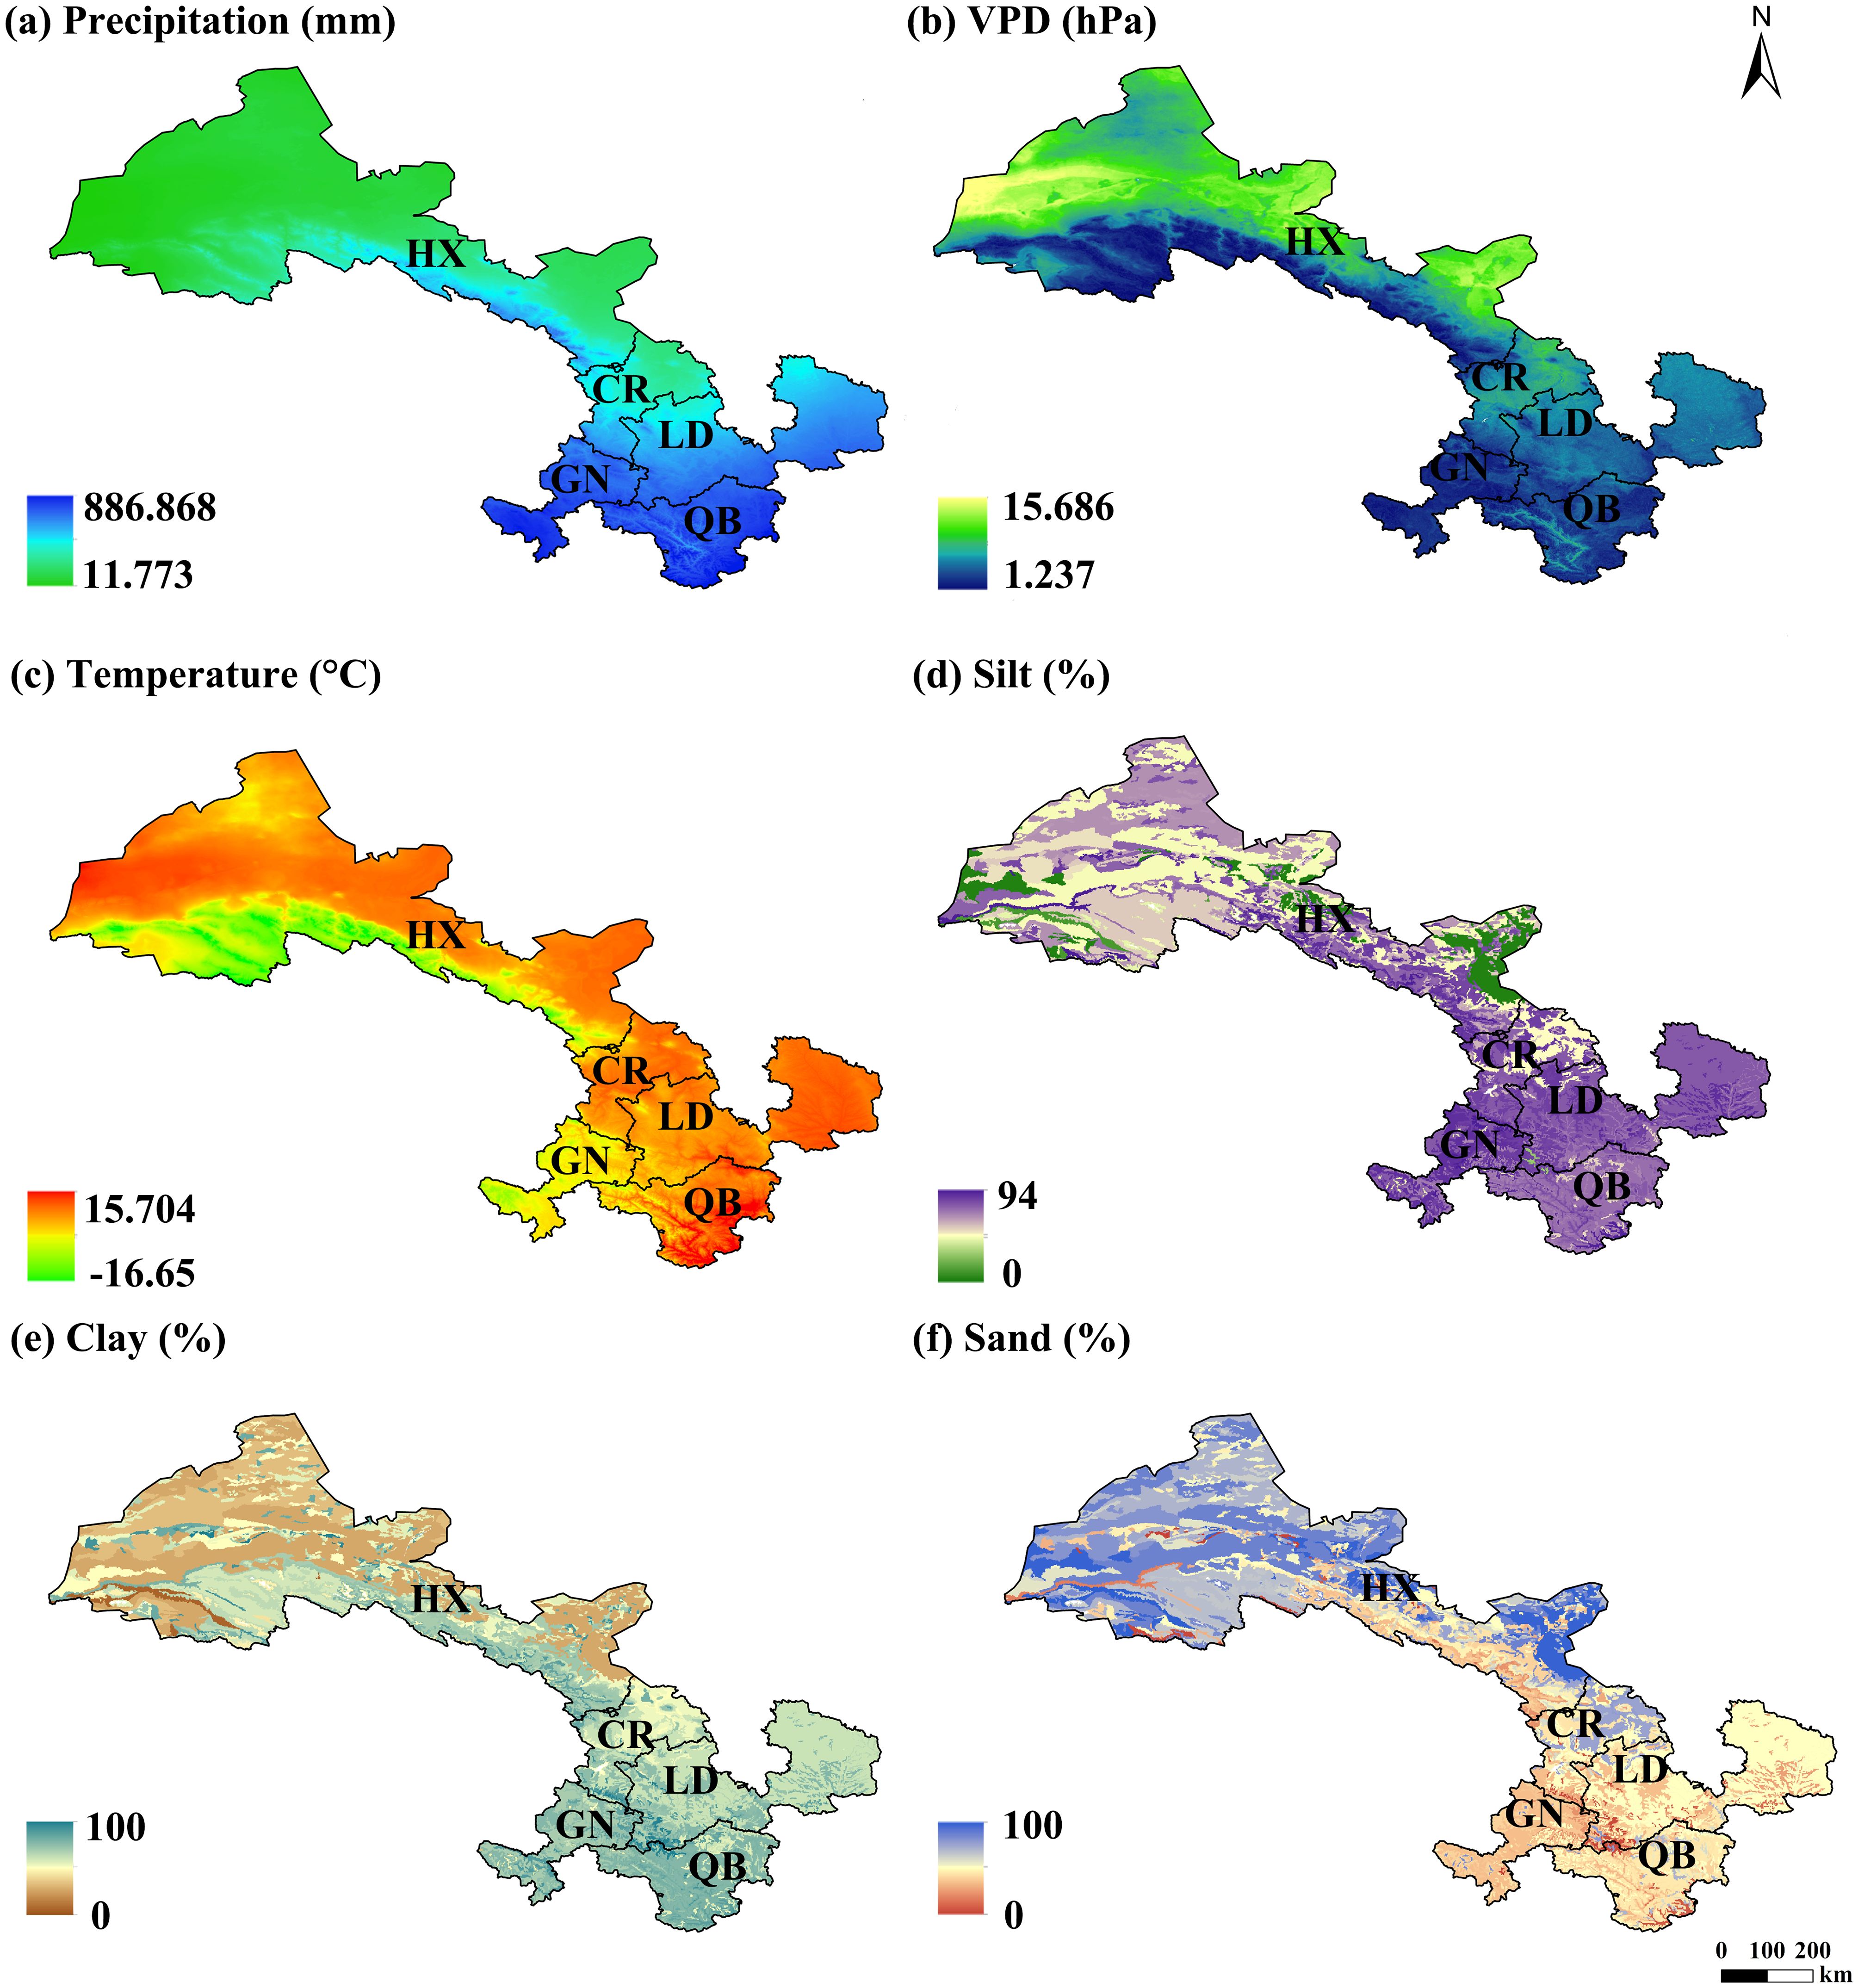
Figure 10. The annual average (a) precipitation, (b) VPD, (c) temperature, (d) slit, (e) clay, and (f) sand in Gansu.
The vegetation water use efficiency in different ecological restoration areas showed different changing characteristics, which was closely related to the vegetation conditions in the region. The WUE of different vegetation types was different, showing forest > cropland > grassland (Liu et al., 2024). Changes in vegetation cover can regulate rainfall interception, alter surface temperature, surface roughness and surface albedo, and directly affect the evapotranspiration process (Xie et al., 2015). The southeastern part of HX has a relatively high vegetation coverage (He et al., 2014). The northwest region belongs to the arid and semi-arid climate zone with sparse vegetation, large evapotranspiration, and low precipitation (Jiang et al., 2015). Therefore, a spatial pattern of WUE decreasing from southeast to northwest was formed in HX. The grass leaves are close to the ground and the canopy height is low, which may promote soil heat absorption, thereby increasing evaporation and accelerating the growth of ET (Jin et al., 2023). On the other hand, the shallow roots of grasslands consume soil water from the root system for evaporation (Schenk, 2008). GN ecological restoration area has a large area of alpine grasslands, wetlands, forests, and other ecosystems. The comprehensive vegetation coverage of Gannan grassland reaches 97%, and the regional grasslands are characterized by concentrated and continuous grasslands and high-quality forage grass (Wang, 2009). The region has implemented the second round of the national project of returning farmland to forests since 2014. From 1990 to 2020, the vegetation coverage rate of the area improved by 91.26% (Zhang et al., 2025). Therefore, the proportion of areas with WUE decline in this region was the lowest among all restoration areas in Gansu (Figure 2d). Forests usually have denser tree canopies and more complex root systems, which can effectively block more solar radiation, make better use of the soil, absorb water from deeper soil layers to alleviate water shortages, and promote plant growth and WUE of the ecosystem (Hu et al., 2008; Niu et al., 2011). The vegetation QB ecological restoration is mainly forest and forest grassland, which is related to the water conservation of the upper reaches of the Bailong River, Jialing River, Baishui River, and Xihan River (Li et al., 2003). Its WUE value is the highest among all restoration areas in Gansu. This study showed that the area with an increasing trend of WUE accounts for 31.5%, of which the area with extremely significant increase accounts for 18.7%. The total proportion of 1.87% of the land type to forest (Figures 11a, b). From the perspective of future development trends, the WUE trend of 44.8% in the region is mainly moderate and continuous improvement (Figures 4c, d). Therefore, the region needs to further strengthen the protection of natural forests.
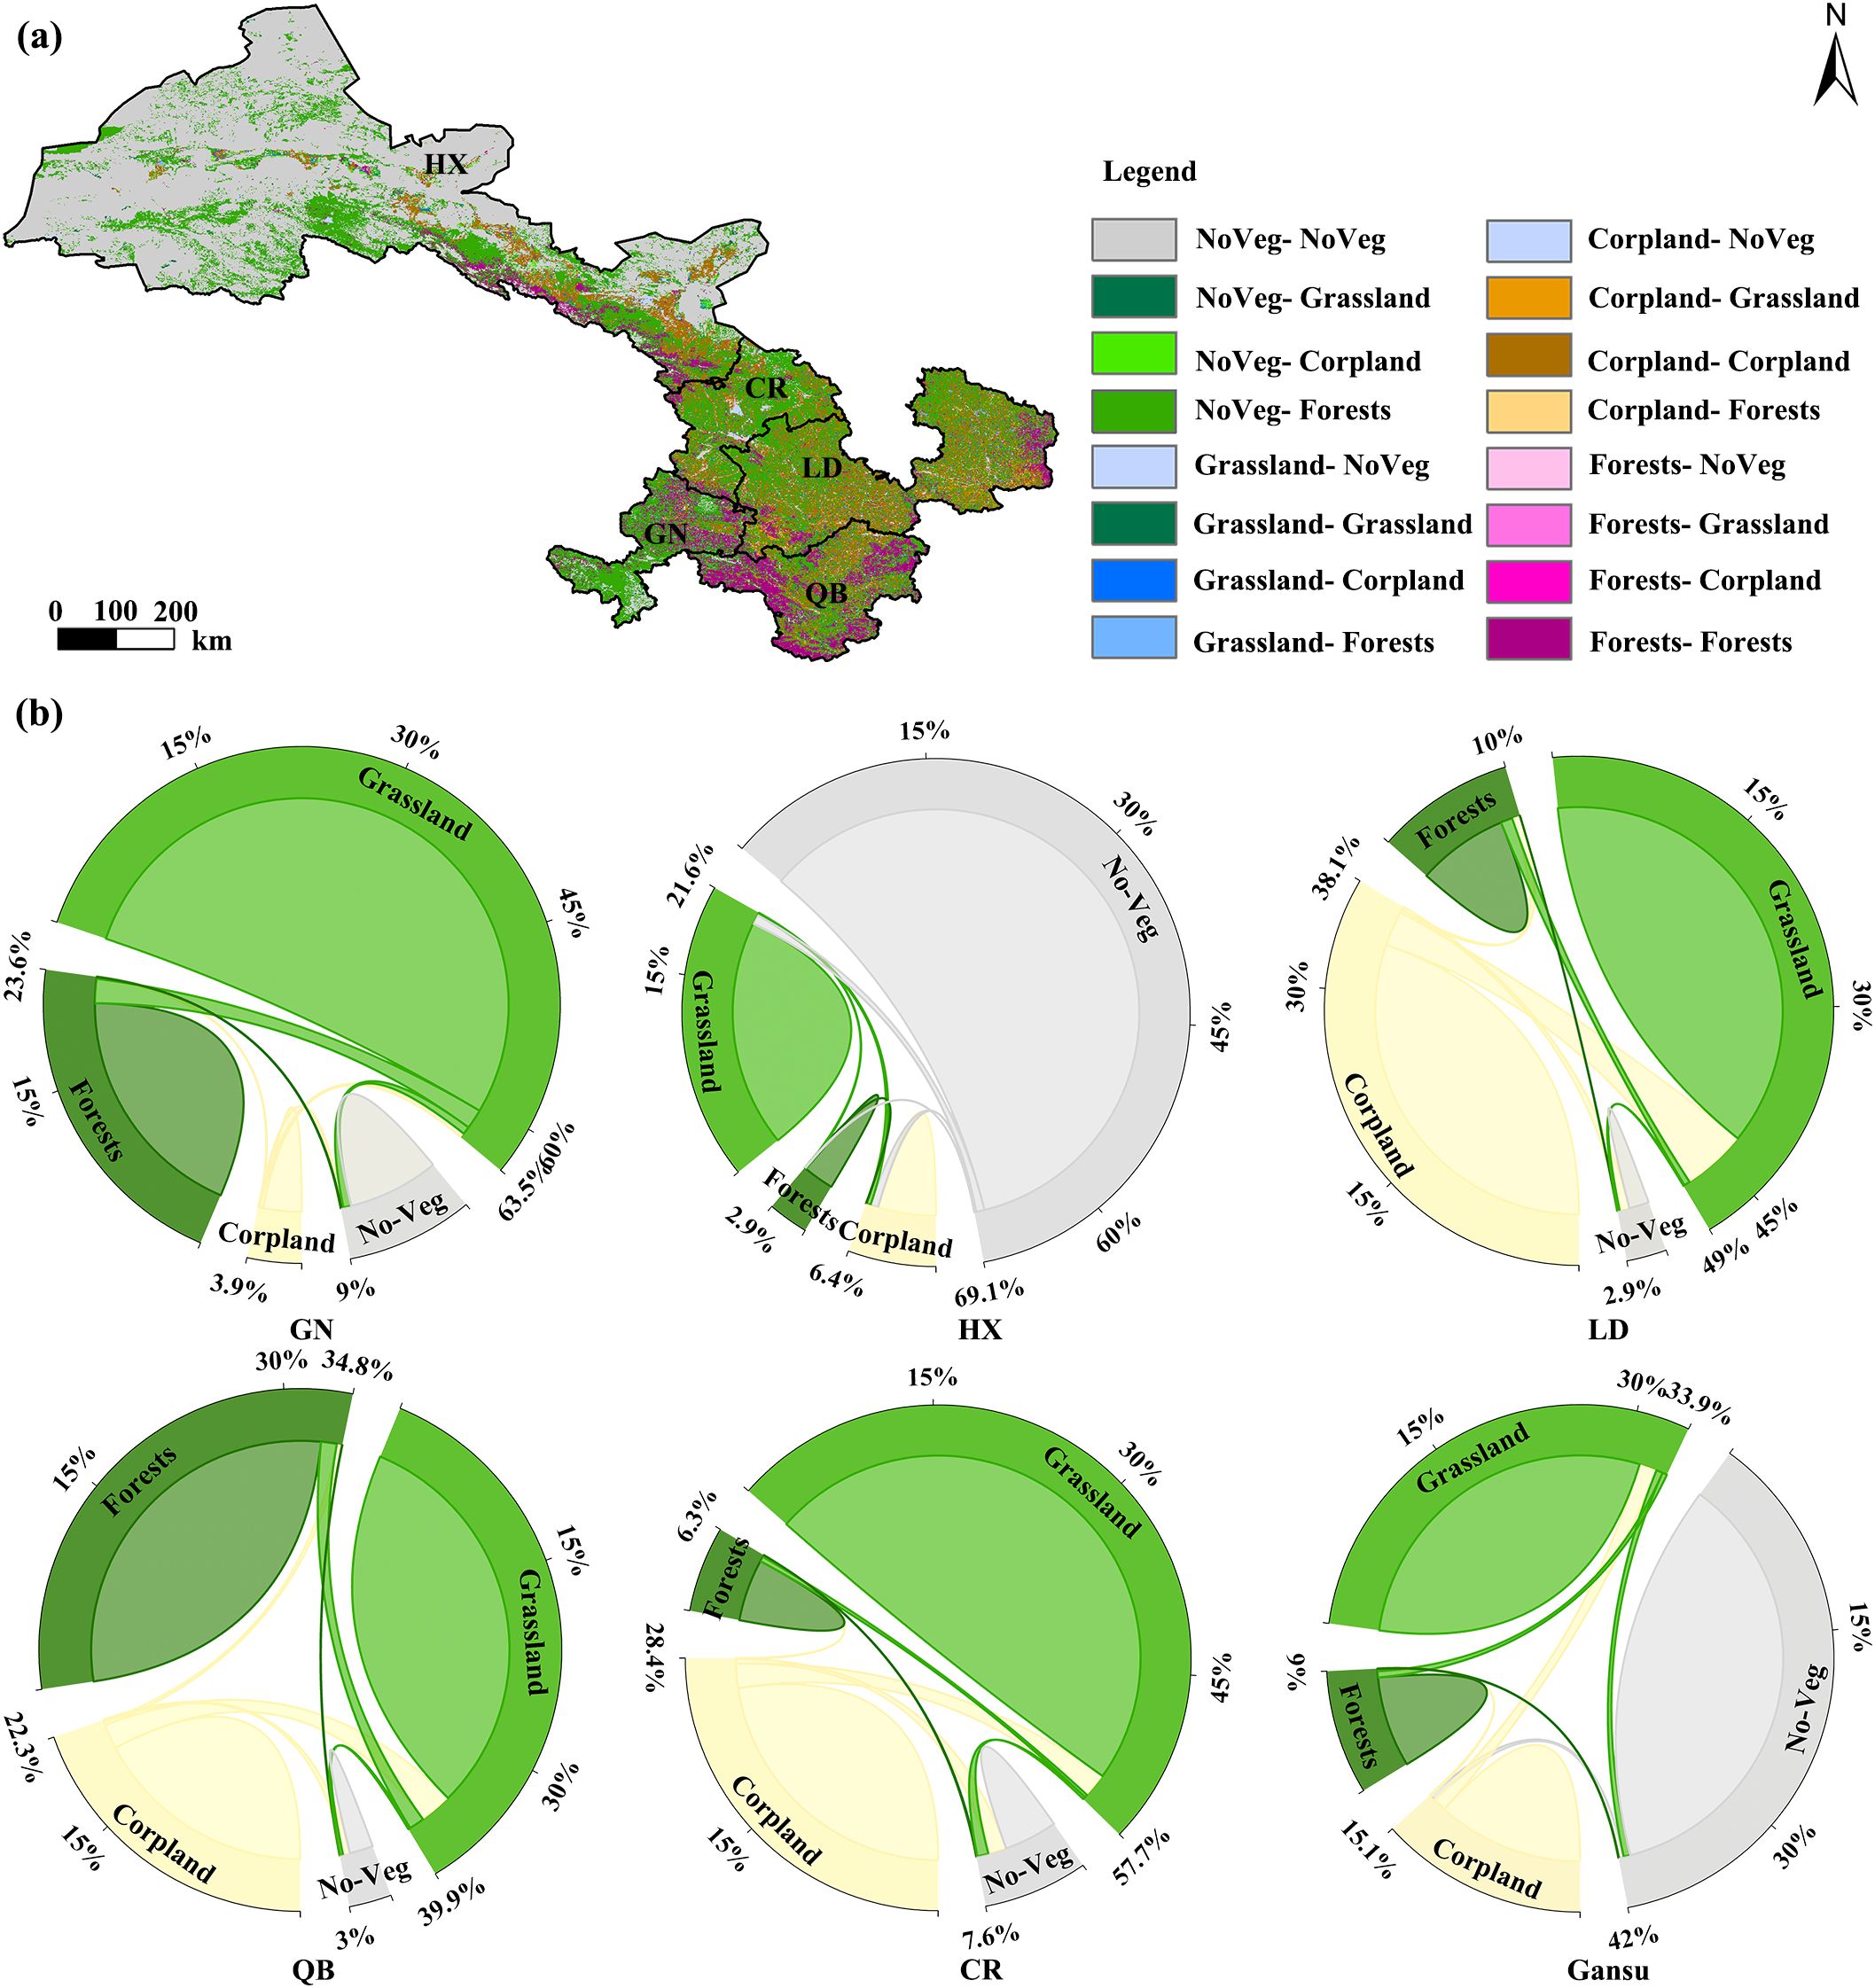
Figure 11. (a) the spatial distribution of cover transformation (2000-2020); (b) the spatial matrix shift.
Changes in vegetation WUE are affected by changes in land use types. Conversion between forest and other land cover types leads to greater changes in WUE. From 2001 to 2020, 0.17% of the total land use type in HX region were converted to forest land and 0.19% were converted to non-forest land (Figures 11a, b). During the land type conversion process in GN, WUE increased by 3.4% and decreased by 3.22%. This study shows that the GN has the highest proportion of regions showing positive sustainable characteristics (25.9%), and the area with increasing WUE accounts for 11% (Figures 2d, 3a). The WUE value of the CR ecological restoration is the lowest among all restoration areas in Gansu (Figure 2c). In 2000, the ecological security assessment status of most areas in the CR region was poor, and a small part was in a fair state (Zhang et al., 2007). The WUE, which accounts for 12.9% of the regional area, showed a downward trend, which may be related to the urbanization process. Some areas in the region are industrial and mining cities, facing huge population pressure (Zhang et al., 2007). Vegetation to non-vegetation land accounted for 2.78% (Figures 11a, b). Urban construction such as ground hardening and urban expansion hinders precipitation infiltration, leading to a decrease in vegetation WUE. Therefore, it is an important task of ecological restoration in the CR region to implement mine geological environment restoration and to mining area ecology restoration in response to the land vegetation resources destroyed by historical mines. Studies have shown that the energy conservation and consumption reduction in the LD region needs to be improved, and soil erosion, soil erosion and land productivity have declined (Tang et al., 2020). The total proportion of 1.8% of the land type to forest (Figures 11a, b). This study also showed that the WUE in the region increased by 10.4% (Figure 2d). Studies have shown that the energy conservation and consumption reduction in the region needs to be improved, and soil erosion, soil erosion and land productivity have declined (Tang et al., 2020).
Vegetation restoration plays an important role in improving fragile ecological environment and controlling soil erosion (Zhang et al., 2023). This area is a typical resource-scarce and water-scarce region (Zheng et al., 2019). Under the dual effects of the natural environment and human activities (logging, grazing, large-scale reclamation and wasteland), the ecosystem in the region is very fragile, and the rate of vegetation degradation and land desertification is accelerating (Zhang et al., 2017). The WUE in the HX region was relatively low (Figure 2). With the implementation of ecological and environmental protection policies and the improvement of people’s environmental protection awareness, the ecological water demand of vegetation in the region showed a significant increasing trend from 2000 to 2020, increasing by 0.70×1–08 m3 per year (Wang et al., 2024). Therefore, a spatial pattern of WUE decreasing from southeast to northwest was formed in the region (Figure 2a). From the perspective of future WUE sustainability, the area that continues to decrease has reached 64.1% (Figure 3b). Therefore, strengthening the management of degraded grasslands, promoting land desertification control and desertification prevention are important tasks for ecological restoration in HX. The regional comprehensive ecological security index was 0.7752. The ecological restoration projects are progressing steadily, the ecological benefits are gradually showing, and forest coverage and wetland areas increasing (Tang et al., 2020). The total proportion of 1.8% of the land type to forest (Figures 11a, b). The WUE value is second only to the Qinba area in Gansu among all restoration areas (Figure 2b). This study also showed that the WUE in the region increased by 10.4% (Figure 2d). Therefore, carrying out comprehensive control of soil erosion in key watersheds and improving the soil and water conservation capacity of cultivated land remain the key tasks of ecological restoration in LD.
4.2 Environmental factors and mechanisms of WUE
WUE in Gansu is affected by environmental factors such as climate, terrain, soil, and vegetation, and shows diversity due to the interaction between environmental factors (Figure 7). In the restoration areas of Gansu, the effects of vegetation factors on WUE varied, but the total effect was greater than 60% (Figure 9). The overall effect of vegetation on Gansu and each restoration area is a positive response (Figure 7) (Jin et al., 2023). In arid ecosystems, the impact of vegetation changes on WUE is more obvious. Plants can better adapt to the environment by adjusting water absorption rate, transpiration, etc., thereby affecting WUE (Xie et al., 2015; Jin et al., 2023).
Climate factors can affect both photosynthesis and transpiration of plants, and their effects on WUE is more complex (Zhang et al., 2012). This study shows that the direct impact on WUE in Gansu is 0.418, and the positive impact of climate on WUE through vegetation is 0.685 (Figure 8a). WUE in Gansu and all restoration areas was negatively correlated with temperature (Figure 7). The increase in ambient temperature can accelerate the diffusion rate of water molecules in plants, thereby promoting the water absorption capacity of the roots and the transportation of water in the trunk, which has a significant impact on the transpiration process of plants (Chang, 2024). Rising temperatures in cold regions lead to increased plant transpiration, but no corresponding increase in plant photosynthesis, resulting in a decrease in WUE (Figures 10b, c). Precipitation plays an important role in increasing ET. The relative humidity of the atmosphere directly affects the water vapor pressure difference between the inside and outside of the leaves, which in turn determines the transpiration rate to a certain extent. However, at different temperatures, the same relative humidity corresponds to different water vapor pressure values. Increased precipitation leads insufficient water vapor pressure atmospheric water demand, which in turn affects plant photosynthesis and transpiration (Chang, 2024). Meng et al. (2025) used partial correlation and ridge regression analysis to quantitatively analyze the contribution of climate factors to satellite near-infrared light changes and pointed out that VPD enhanced carbon assimilation in the high-latitude pan-Arctic region. This study showed that VPD was negatively correlated with WUE in Gansu and each restoration area, and the explanatory power of VPD in HX was higher than that in other restoration areas (Figure 7). Rainfall affects the plant photosynthetic rate, transpiration, and stomatal conductance. Reduced rainfall will significantly reduce leaf area and biomass, reduce chlorophyll content, and limit net photosynthetic rate and carboxylation efficiency (Yang et al., 2014). The responses of photosynthesis and water-related parameters to rainfall mainly depend on the severity of drought (Yan et al., 2000). Extreme climate events such as drought have a lagged effect on WUE (Zhang et al., 2024). This study shows that WUE in 76.5% of Gansu regions had a positive correlation with lagged SPEI, and 47.36% of regions lagged by 6–12 months, indicating that Gansu is affected by the SPEI with a longer period of time (Figures 5c, d). Among them, the SPEI lag period of WUE in the central region of HX is longer than that in the southwest region (Figures 5c, d).
In this study, climate had a positive impact of 0.323 on soil through vegetation (Figure 8a). As temperature and light increase, vegetation transpiration in the region will increase and evaporation of soil moisture will intensify. However, large-scale vegetation growth requires more water, and precipitation cannot replenish soil moisture loss in time, which may lead to a decrease in regional WUE (Ma et al., 2022). The climate of Gansu has obvious dry and continental characteristics. The reduction in precipitation not only significantly reduced soil moisture content, but also weakened the replenishment of soil moisture by effective precipitation after seasonal drought (Guo, 2024). Lower soil moisture content can limit tree trunk sap flow. In order to reduce water consumption, vegetation usually opens stomata earlier, reducing trunk sap flow to adapt to long-term drought and short-term seasonal drought (Guo, 2024). Among the restoration areas, SM was positive correlated with WUE in GN, QB and CR (Figure 4d). The effects of the sand and clay ratios on WUE are relatively complex and is mainly determined by the physical properties of the soil and the ability of plants to absorb water and nutrients. The permeability of the silt is weak. The QB, GN and HX regions have higher silt (Figure 10d). Clay soils can better retain water and nutrients, improving WUE. QB and GN regions have higher clay (Figure 10e). Sand has high porosity and good drainage, which is conducive to root expansion, but in arid areas, its water and nutrient retention capacity is weak, which may reduce WUE. HX has higher sand (Figure 10f). However, excessive clay content can reduce soil permeability, restrict root development, and affect plant growth (Baiamonte et al., 2020) (Figure 10e). In management practices, plant WUE can be optimized by adjusting soil structure and improving soil conditions (Liu, 2024). These findings highlight the complex role of environmental factors in controlling WUE and the diversity of responses of different ecosystems to these factors. The effects of topographic features on WUE were significantly different in Gansu and among the restoration areas (Figure 9). Both GN and CR showed positive impact, which were related to the slope, altitude, longitude and latitude (Figure 6). The topographic characteristics of Gansu area can have a negative effect of 0.641 on vegetation through climatic characteristics (Figure 8a).
5 Conclusion
The study area showed an average WUE of 1.71 gCm−2mm−1 from 2001 to 2020. In about 6.3% of Gansu, WUE showed an upward trend. Spatially, the southeast is high and the northwest is low. In 77.5% of the regions, WUE was in a state of continuous and stable change.
In 76.5% of Gansu regions, WUE was positively correlated with the lagged SPEI, and the regions with a lag of 6–12 months accounted for 47.36%, indicating that they were affected by the SPEI for a longer period.
The total effect of vegetation factors in Gansu and each restoration area was positive, and the effect of climate on WUE through vegetation was 0.685. The total effect of climate factors in GN (−0.073) and CR (−0.385) was negative.
This study deeply explored the spatiotemporal changes in WUE in different ecological restoration areas and its relationship with various environmental factors, which is of great significance for accurately evaluating and optimizing regional water resources management.
Data availability statement
The original contributions presented in the study are included in the article/supplementary material. Further inquiries can be directed to the corresponding author.
Author contributions
XZ: Conceptualization, Data curation, Formal analysis, Funding acquisition, Investigation, Methodology, Project administration, Resources, Software, Supervision, Validation, Visualization, Writing – original draft, Writing – review & editing. JW: Writing – review & editing, Software, Visualization. YZ: Writing – review & editing, Software, Visualization. QM: Funding acquisition, Methodology, Writing – review & editing. XW: Methodology, Writing – original draft, Writing – review & editing.
Funding
The author(s) declare financial support was received for the research and/or publication of this article. This research was co-funded by Gansu Open University Doctoral Research Fund Project (2025-CR-01), the National Key R&D Program of China (2024YFD2201100), Key Research and Development Special Project on Ecological Civilization Construction in Gansu Province (24YFFA040).
Conflict of interest
The authors declare that the research was conducted in the absence of any commercial or financial relationships that could be construed as a potential conflict of interest.
Generative AI statement
The author(s) declare that no Generative AI was used in the creation of this manuscript.
Any alternative text (alt text) provided alongside figures in this article has been generated by Frontiers with the support of artificial intelligence and reasonable efforts have been made to ensure accuracy, including review by the authors wherever possible. If you identify any issues, please contact us.
Publisher’s note
All claims expressed in this article are solely those of the authors and do not necessarily represent those of their affiliated organizations, or those of the publisher, the editors and the reviewers. Any product that may be evaluated in this article, or claim that may be made by its manufacturer, is not guaranteed or endorsed by the publisher.
References
Baiamonte G., Minacapilli M., and Crescimanno G. (2020). Effects of biochar on irrigation management and water use efficiency for three different crops in a desert sandy soil. Sustainability-basel. 12, 7678. doi: 10.3390/su12187678
Chang L. (2024). Characteristics of Soil Moisture Limitation and Non-limitation on Transpiration in Three Afforestation Tree Species in the Loess Hilly Region (Yangling: Northwest Agriculture & Forestry University). doi: 10.27409/d.cnki.gxbnu.2024.000824
Curtis P. S., Vogel C. S., Gough C. M., Schmid H. P., Su H.-B., and Bovard B. D. (2005). Respiratory carbon losses and the carbon-use of a northern hardwood forest 1999-2003. New Phytol. 167, 437–455. doi: 10.1111/j.1469-8137.2005.01438.x
Delucia E. H., Drake J. E., Thomas R. B., and Gonzalez-Meler M. (2007). Forest carbon use efficiency: is respiration a constant fraction of gross primary production? Global Change Biol. 13, 1157–1167. doi: 10.1111/j.1365-2486.2007.01365.x
Grinsted A., Moore J. C., and Jevrejeva S. (2004). Application of the cross wavelet transform and wavelet coherence to geophysical time series. Nonlinear Process Geophys. 11, 561–566. doi: 10.5194/npg-11-561-2004
Guo H. N. (2024). Effects of rainfall exclusion on transpiration, photosynthesis and chlorophyll fluorescence of black locust in the sub-humid region (Yangling: Northwest Agriculture & Forestry University). doi: 10.27409/d.cnki.gxbnu.2024.000244
Hair J. F., Risher J. J., Sarstedt M., and Ringle C. M. (2019). When to use and how to report the results of PLS-SEM. Eur. Bus. Rev. 31, 2–24. doi: 10.1108/EBR-11-2018-0203
Han T., Feng Q., Yu T., Liu W., Ma J., Zhao C., et al. (2023). Contrasting response of water use efficiency to soil moisture availability: from leaf to ecosystem in an arid oasis. Ecol. Indic. 147, 109964. doi: 10.1016/j.ecolind.2023.109964
He Y. F., Hua L. M., and Di L. (2014). Comparative analysis on the reflection effect of the vegetation on the Earth’s surface by different vegetation indices: a case in Hexi Corridor. Chin. Agric. Sci. Bull. 30, 45–50. doi: CNKI:SUN:ZNTB.0.2014-19-009
He Y., Piao S. L., Li X. Y., Chen A. P., and Qin D. H. (2018). Global patterns of vegetation carbon use efficiency and their climate drivers deduced from MODIS satellite data and process-based models. Agr. For. Meteorol. 256-257, 150–158. doi: 10.1016/j.agrformet.2018.03.009
Heinsch F. A., Zhao M. S., Running S. W., Kimball J. S., Nemani R. R., Davis K. J., et al. (2006). Evaluation of remote sensing based terrestrial productivity from MODIS using regional tower eddy flux network observations. IEEE Trans. Geosci. Remote Sens. 44, 1908–1925. doi: 10.1111/j.1365-2486.2007.01365.x
Hu Z. M., Yu G. R., Fu Y. L., Sun X. M., Li Y. N., Shi P. L., et al. (2008). Effects of vegetation control on ecosystem water use efficiency within and among four grassland ecosystems in China. Glob. Chang. Biol. 14 (7), 1609–1619. 10.1111/j.1365-2486.2008.01582.x
Jiang Y. Y., Ma P. L., and Han T. (2015). Spatial-temporal dynamic changes of vegetation cover in Hexi of Gansu province based on MODIS data. Ninth Int. Symposium Multispectral Image. 9815, 981518-981518-5. doi: 10.1117/12.2204780
Jin Z., You Q. L., Zuo Z. Y., Li M. C., Sun G. D., Pepin N., et al. (2023). Weakening amplification of grassland greening to transpiration fraction of evapotranspiration over the Tibetan Plateau during 2001-2020. Agr. For. Meteorol. 341, 109611. doi: 10.1016/J.AGRFORMET.2023.109661
Li B., Huang F., Qin L. J., Qi H., and Sun N. (2019). Spatio-temporal variations of carbon use efficiency in natural terrestrial ecosystems and the relationship with climatic factors in the Songnen Plain, China. Remote Sens-basel. 11, 2513. doi: 10.3390/rs11212513
Li Y. H., Zhang X. Y., and Cui Z. J. (2003). Coupling of debris flow period, climate period and tectonic period in the mountainous area of Longnan. Res. Soil Water Conserv. 02, 96–100. doi: CNKI:SUN:STBY.0.2003-02-029
Liu X. Y. (2024). Spatiotemporal variations and driving mechanisms of water use efficiency in typical ecosystems of the Mongolian Plateau (Hohhot: Inner Mongolia Normal University). doi: 10.27230/d.cnki.gnmsu.2024.000006
Liu C. and Shi R. X. (2016). The boundary data set of four eco-geographical regions in China ‘s comprehensive natural geographical divisions (Global Change Science Research Data Publishing System). doi: 10.3974/geodb.2016.04.21.V1
Liu Y. Y., van Dijk A. I. J. M., de Jeu R. A. M., Canadell J. G., McCabe M. F., Evans J. P., et al. (2015). Recent reversal in loss of global terrestrial biomass. Nat. Clim. Change 5, 470–474. doi: 10.1038/nclimate2581
Liu S. H., Xue L. Q., Xiao Y., Yang M. J., Liu Y. H., Han Q., et al. (2024). Dynamic process of ecosystem water use efficiency and response to drought in the Yellow River Basin. China. Sci. Total Environ. 934, 173339. doi: 10.1016/j.scitotenv.2024.173339
Ma R. X., Wang D. C., Cui X. M., Yao X. J., Li S. S., Wang H. S., et al. (2022). Distribution and driving force of water use efficiency under vegetation restoration on the loess plateau. Remote Sens-basel. 14, 4513. doi: 10.3390/RS14184513
Meng C. F., Zhou H., Liu X. C., Zheng J., Wang J., Zeng Q. W., et al. (2025). Distinguishing the main climatic drivers of terrestrial vegetation carbon dynamics in pan-Arctic ecosystems. Ecol. Inform. 90, 103267. doi: 10.1016/j.ecoinf.2025.103267
Miguez-Macho G. and Fan Y. (2021). Spatiotemporal origin of soil water taken up by vegetation. Nature 598, 624–628. doi: 10.1038/s41586-021-03958-6
Mo X. G., Liu S. X., Lin Z. H., and Guo R. P. (2009). Regional crop yield, water consumption and water use efficiency and their responses to climate change in the North China Plain. Agr. Ecosyst. Environ. 134, 67–78. doi: 10.1016/j.agee.2009.05.017
Niu S. L., Xing X. R., Zhang Z., Xia J. Y., Zhou X. H., Song B., et al. (2011). Water-use efficiency in response to climate change: from leaf to ecosystem in a temperate steppe. Global Change Biol. 17, 1073–1082. doi: 10.1111/j.1365-2486.2010.02280.x
Schenk H. J. (2008). Soil depth, plant rooting strategies and species’ niches. New Phytol. 178, 223–225. doi: 10.1111/j.1469-8137.2008.02427.x
Shao W. Y., Guan Q. Y., Liu H. Q., Sun W. W., and Sun Y. F. (2024). Temporal and spatial dynamics of carbon and water use efficiency on the Qinghai-Tibet plateau and their ecosystem responses. J. Clean. Prod. 475, 143581. doi: 10.1016/j.jclepro.2024.143581
Song X., Yan C. Z., Xie J. L., and Li S. (2012). Assessment of changes in the area of the water conservation forest in the Qilian Mountains of China’s Gansu province, and the effects on water conservation. Environ. Earth Sci. 66, 2441–2448. doi: 10.1007/s12665-011-1468-z
Stow D., Daeschner S., Hope A., Douglas D., Petersen A., Myneni R., et al. (2010). Variability of the seasonally integrated normalized difference vegetation index across the North slope of Alaska in the 1990s. Int. J. Remote Sen. 24, 1111–1117. doi: 10.1080/0143116021000020144
Tang A. Q., Wang P., and Pang Y. (2020). Evaluation of ecosystem health status and ecological safety barrier construction in the Loess Plateau area of Longdong-Longzhong. Environ. Ecol. 2, 35–42. doi: CNKI:SUN:HJSX.0.2020-01-006
Tian H. Q., Chen G. S., Liu M. L., Zhang C., Sun G., Lu C. Q., et al. (2010). Model estimates of net primary productivity, evapotranspiration, and water use efficiency in the terrestrial ecosystems of the southern United States during 1895-2007. For. Ecol. Manage. 259, 1311–1327. doi: 10.1016/j.foreco.2009.10.009
Tian H. Q., Lu C. Q., Chen G. S., Xu X. F., Liu M. L., Ren W., et al. (2011). Climate and land use controls over terrestrial water use efficiency in monsoon Asia. Ecohydrol. 4, 322–340. doi: 10.1002/eco.216
Vanloocke A., Twine T. E., Zeri M., and Bernacchi C. J. (2012). A regional comparison of water use efficiency for miscanthus, switchgrass and maize. Agr. Forest. Meteorol. 164, 82–95. doi: 10.1016/j.agrformet.2012.05.016
Vinzi V. E., Trinchera L., and Amato S. (2009). “PLS path modeling: from foundations to recent developments and open issues for model assessment and improvement,” in Handbook of Partial Least Squares (Springer Berlin Heidelberg, Berlin, Heidelberg), 47–82.
Wang W. H. (2009). Ecological problems faced by the “kidney of the Yellow River” in Gannan Maqu and its countermeasures. Sci. Soil Water Conserv. 30, 33–35. doi: 10.14123/j.cnki.swcc.2009.09.017
Wang H. B., Li X., Xiao J. F., and Ma M. G. (2021). Evapotranspiration components and water use efficiency from desert to alpine ecosystems in drylands. Agric. For. Meteorol. 298–299, 108283. doi: 10.1016/j.agrformet.2020.108283
Wang T. H., Wang X. F., Yang Y. P., Li Z. S., and Che T. (2024). Estimation of vegetation ecological water demand in Hexi region. J. Northwest Normal Uni. (Nat. Sci.) 60, 12–25. doi: 10.16783/j.cnki.nwnuz.2024.04.002
Wolf S., Eugste R. W., Ammann C., Häni M., Zielis S., Hiller R., et al. (2013). Contrasting response of grassland versus forest carbon and water fluxes to spring drought in Switzerland. Environ. Re.s Lett. 8, 1345–1346. doi: 10.1088/1748-9326/8/3/035007
Xie X. H., Liang S. L., Yao Y. J., Jia K., Meng S. S., and Li J. (2015). Detection and attribution of changes in hydrological cycle over the Three-North region of China: Climate change versus afforestation effect. Agr. For. Meteorol. 203, 74–87. doi: 10.1016/j.agrformet.2015.01.003
Yan S. G., Wan C. G., Sosebee R. E., Wester D. B., Fish E. B., and Zartman R. E. (2000). Responses of photosynthesis and water relations to rainfall in the desert shrub creosote bush (Larrea tridentata) as influenced by municipal biosolids. J. Arid Environ. 46, 397–412. doi: 10.1006/jare.2000.0682
Yang Q. Y., Zhao W. Z., Liu. B., and Liu H. (2014). Physiological responses of Haloxylon ammodendron to rainfall pulses in temperate desert regions, Northwestern China. Trees-Structure Funct. 28, 709–722. doi: 10.1007/s00468-014-0983-4
Yu G. R., Fu Y. L., Sun X. M., Wen X. F., and Zhang L. M. (2006). Recent progress and future directions of China FLUX. Sci. China Earth Sci. 49, 1–23. doi: 10.1007/s11430-006-8001-3
Zhang Z., Jiang H., Liu J. X., Zhou G. M., and Zhang X. Y. (2012). Assessment on water use efficiency under climate change and heterogeneous carbon dioxide in China terrestrial ecosystems. Proc. Environ. Sci. 13, 2031–2044. doi: 10.1016/j.proenv.2012.01.194
Zhang B., Jin F. J., and Hu D. Y. (2007). Assessment of ecological security in middle part of Gansu Province. J. Na. Disasters 05, 9–15. doi: CNKI:SUN:ZRZH.0.2007-05-003
Zhang C. X., Wang X. M., Dong Z. B., and Hua T. (2017). Aeolian process of the dried-up riverbeds of the Hexi Corridor, China: A wind tunnel experiment. Environ. Monit. Assess. 189, 2–11. 10.1007/s10661-017-6132-y
Zhang Q. P., Lu H. E., Zhao D. C., and Zhuo M. L. C. (2025). Relationship between temporal and spatial changes of vegetation coverage and topographic factors in the Upper Yellow River in Gannan. Arid Zone Res. 42, 523–533. doi: 10.13866/j.azr.2025.03.12
Zhang T., Quan W. J., Tian J. Y., Li J. Z., and Feng P. (2024). Spatial and temporal variations of ecosystem water use efficiency and its response to soil moisture drought in a water-limited watershed of northern China. J. Environ. Manage. 355, 120251. doi: 10.1016/J.JENVMAN.2024.120251
Zhang X. J., Wang D. N., Ma K. X., Sun D., Yang F. L., and Lin H. L. (2023). Spatiotemporal evolution of soil water erosion in Ningxia grassland based on the RUSLE-TLSD model. Environ. Res. 1, 116744–116744. doi: 10.1016/J.ENVRES.2023.116744
Zhao J. X., Feng H. Z., Xu T. R., Xiao J. F., Guerrieri R., Liu S. M., et al. (2021). Physiological and environment control on ecosystem water use efficiency in response to drought across the Northern Hemisphere. Sci. Total Environ. 758, 143599. doi: 10.1016/j.scitotenv.2020.143599
Zhao A. Z., Yu Q. Y., Feng L. L., Zhang A. B., and Pei T. (2020). Evaluating the cumulative and time-lag effects of drought on grassland vegetation: a case study in the Chinese Loess Plateau. J. Environ. Manage. 261, 110214. doi: 10.1016/j.jenvman.2020.110214
Zheng H., Lin H., Zhou W., Bao H., Zhu X., Jin Z., et al. (2019). Revegetation has increased ecosystem water-use efficiency during 2000–2014 in the Chinese Loess Plateau: Evidence from satellite data. Ecol. Indic. 102, 507–518. 10.1016/j.ecolind.2019.02.049
Zhu W. B., Jia S. F., Lü A. F., and Yan T. T. (2012). Analyzing and modeling the coverage of vegetation in the Qaidam Basin of China: The role of spatial autocorrelation. J. Geogr. Sci. 22, 346–358. doi: 10.1007/s11442-012-0931-4
Keywords: water use efficiency, GIS, environmental factors, hysteresis effect, Gansu
Citation: Zhang X, Wang J, Zhou Y, Ma Q and Wang X (2025) Spatiotemporal change of water use efficiency on different ecological restoration areas of Gansu, China. Front. Ecol. Evol. 13:1672495. doi: 10.3389/fevo.2025.1672495
Received: 11 August 2025; Accepted: 14 October 2025;
Published: 31 October 2025.
Edited by:
Manoj Kumar, Indian Council of Forestry Research and Education (ICFRE), IndiaReviewed by:
Hao Zhou, Chinese Academy of Sciences (CAS), ChinaJie Li, Gansu Agricultural University, China
Copyright © 2025 Zhang, Wang, Zhou, Ma and Wang. This is an open-access article distributed under the terms of the Creative Commons Attribution License (CC BY). The use, distribution or reproduction in other forums is permitted, provided the original author(s) and the copyright owner(s) are credited and that the original publication in this journal is cited, in accordance with accepted academic practice. No use, distribution or reproduction is permitted which does not comply with these terms.
*Correspondence: Xinyou Wang, d2FuZ3hpbnlAZ3NvdS5lZHUuY24=