 Weidong Guo1,2,3*
- 1School of Economics and Management, Luoyang Institute of Science and Technology, Luoyang, Henan, China
- 2Business School, Henan University of Science and Technology, Luoyang, Henan, China
- 3Henan Key Laboratory of Green Building Materials Manufacturing and Intelligent Equipment, Luoyang, Henan, China
The birthplace of the Chinese country is the Yellow River Basin, which is related to ecological security and economic development. Studying the Yellow River Basin’s carbon emissions problems can support sustainable development, ecological preservation, and high-quality development. It can also give a scientific foundation for regional green and low-carbon transformation. Based on the data characteristics of carbon emissions in nine provinces in the Yellow River Basin, this paper selects a new unbiased, non-homogeneous grey prediction model (UNGM(1,1)) to analyze and predict whether the nine provinces in the Yellow River Basin will be able to reach the carbon peak by 2030. Through research, it was found that three of the nine provinces in the Yellow River Basin will peak in carbon emissions by 2030, namely Qinghai, Henan, and Sichuan. It will be unattainable for the remaining six provinces—Gansu, Ningxia, Inner Mongolia, Shanxi, Shaanxi, and Shandong—to reach the carbon peak by 2030. The findings of this study offer valuable reference for analyzing carbon emissions in the Yellow River Basin, formulating differentiated emission reduction policies, optimizing resource allocation, and precise implementation of dual carbon goals.
1 Introduction
Global climate change has grown to be one of the most serious issues confronting the globe today as temperatures increase, glaciers melt, sea levels rise, and extreme weather events become increasingly common. These problems will pose challenges to human survival in the foreseeable future (Wang and Zhang, 2022; Kaufman and Broadman, 2023). The Intergovernmental Panel on Climate Change (IPCC) study indicates that due to the Industrial Revolution, human-caused greenhouse gas emissions have been the main cause of climate change worldwide, with CO2 emissions accounting for the bulk of emissions of greenhouse gas emissions (Oreggioni et al., 2021; Wang et al., 2022a; Kabir et al., 2023). Therefore, accurately predicting and controlling CO2 emissions has become a core task for nations everywhere to confront climate change.
The ecological environment of the Yellow River Basin is an important economic corridor and barrier for ecological security in China, and its stability and sustainable growth have a significant influence on the overall development of the nation (Jiang et al., 2021). In 2019, the government of China proposed to carry out the Yellow River Basin’s ecological protection and higher-quality development plan and elevated it to a major regional strategy in China (Zhang et al., 2023). Reducing emissions and conserving energy are essential components of high-quality development (Wang et al., 2022b). In 2020, China announced the goal of peaking carbon emissions before 2030 and achieving carbon neutrality before 2060 (Zhao, 2022). The Yellow River Basin’s carbon peak process is directly related to the achievement of the national dual carbon goals. On a scientific level, the region spans three major climate zones, with upstream areas (Qinghai, Sichuan, Gansu) primarily serving as carbon sinks and exhibiting prominent ecological fragility; Midstream (Ningxia, Inner Mongolia, Shaanxi, Shanxi): coal resources are concentrated and carbon emission intensity is high; Downstream (Henan, Shandong): Industrial emissions are intensive, facing challenges of carbon sequestration and emission reduction synergy. The gradient comparison between upstream carbon sinks and midstream carbon emissions provides a typical sample for studying the coupling of ecological economic systems. At the policy level, as a key area of the national dual carbon strategy, its coal production capacity accounts for 70% of the country’s total. However, the potential of wind and solar resources is enormous, and the success or failure of energy transformation directly affects the national carbon peak process. In 2023, the Yellow River Protection Law will incorporate the synergy of pollution reduction and carbon reduction into the legislative framework, making the region a core pilot area for testing the path of China’s path to modernization. Focusing on the Yellow River Basin is not only a key breakthrough in resolving the contradiction between ecological protection and high-quality development, but also a strategic pivot for implementing national climate commitments. The Yellow River Basin has only achieved steady progress in reducing emissions in response to national policies. However, energy consumption and emissions of carbon dioxide have seen a significant surge in recent years, along with the rapid rise of the regional economy, posing significant challenges to the Yellow River Basin’s natural environment and global climate change (Chen et al., 2022). Therefore, analysis of the Yellow River Basin’s carbon emissions features and evolution patterns, in particular, is essential for planning scientific and reasonable emission reduction strategies and promoting the basin’s sustainable development.
The grey system theory has unique advantages for processing the non-linearity and limited sample size of the carbon emissions data from the Yellow River Basin. The grey prediction model is part of the grey system theory, which is mainly used to handle prediction problems involving small samples, as well as incomplete and uncertain data. Grey prediction models have been used extensively since Deng’s 1982 proposal of the grey system theory in domains including economy, environment, and energy (Deng, 1982). In the field of economics, Zhang et al. proposed a novel multivariate grey prediction model that incorporates spatial proximity effects to study the future economic output of Jiangsu Province, China, from 2021 to 2025 (Zhang et al., 2023). Chen et al. proposed an improved grey wave prediction method to predict the monthly nickel and aluminum prices. Through comparison of the results, the enhanced grey wave prediction technique was discovered to be more accurate (Chen et al., 2016). In terms of the environment, Zhou et al. proposed an enhanced seasonal grey model for forecasting air quality in China’s Yangtze River Delta area by combining seasonal elements with the NGBM (1,1) model (Zhou et al., 2020). Shaheen et al. used the traditional GM(1,1) model to predict the indicators of environmental degradation in Pakistan (Shaheen et al., 2025). Wang et al. predicted the annual ecological water consumption of 30 provinces in China according to the background of dual carbon, and found that the combination of the adjacent cumulative grey multivariate convolution model and average weakening buffer operator had better prediction performance (Wang et al., 2024). Wang et al. predicted energy consumption in 13 provinces across seven distinct regions of China using a new grey multivariate AGMC (1, N) model (Wang et al., 2022). Considering the imbalanced development of energy prices, energy consumption, and economic growth, Li et al. employed a dynamic grey model to conduct a predictive analysis of coal prices and use in China (Li et al., 2022).
Meanwhile, the grey prediction model has also obtained remarkable research achievements in various fields, such as industry, agriculture, transportation, medical treatment, and risk management (Hsu, 2003; Li and Luo, 2024; Xu et al., 2024; Ceylan, 2019; Karimi and Yahyazade, 2022).
Carbon emissions, as a critical factor contributing to global climate change, continue to attract close attention from academia and policymakers. Recently, because of the high level of global attention to climate change issues, research on carbon emissions has been increasingly deepened, spanning multiple disciplines such as economics, energy, and environment. In the multidimensional cross-disciplinary research on carbon emissions intensity and low-carbon economic transformation and development, from the standpoint of carbon emissions efficiency, Sun and Huang discovered a substantial link between carbon emissions intensity and efficiency. To precisely forecast carbon emissions intensity, they developed a predictive model based on component analysis and a probability model (Sun and Huang, 2022). On this basis, Luo et al. further pointed out that massive data analysis and artificial intelligence may help advance the creation of a low-carbon economy (Luo et al., 2024). It is worth noting that Yang et al. found through empirical research that the development of regional digitization can significantly lessen the carbon emissions intensity (Yang et al., 2022). In the investigation of carbon emissions from energy, many scholars have explored the regional disparities of carbon emissions in China and the relationship between economic development and energy transition. Hou et al. carried out a thorough examination of the equity and disparity of energy carbon emissions in 282 prefecture-level cities in China. The findings indicated that despite the overall decline in the level of carbon emissions inequality in China, the imbalance of carbon emissions in the western area remains a prominent phenomenon (Hou et al., 2024). In contrast, Amin et al. discovered throughout their investigation into the energy shift in China and the effect of natural resources on carbon emissions that urbanization and the increase in actual income levels exacerbate environmental degradation, while the growth of renewable energy can effectively decrease carbon emissions. This finding indicates that urbanization and income growth contribute to economic development, but they may also exert negative effects on the environment. However, the expansion of renewable energy provides a potential solution for achieving carbon emissions reduction (Amin et al., 2024). In addition, Zhang et al. believed the primary sources of carbon dioxide emissions are still oil, coal, and nuclear power (Zhang et al., 2024). With the deepening research on carbon emissions, a rising number of academics are paying attention to the prediction of carbon emissions. By using various models and methods, such as machine learning algorithms, statistical models, system dynamics models, and dynamic scenario simulation models (Ye et al., 2024; Karakurt and Aydin, 2023; Wang et al., 2024; Huo et al., 2021). These studies aim to disclose the trends and contributing elements of upcoming carbon emissions in order to provide the scientific basis for policy-making and environmental management. It is worth noting that among various methods for forecasting carbon emissions, the grey prediction model has gradually become a focus of attention for scholars due to its advantages in handling small amounts of data and uncertainty issues. For example, Yang et al. predicted the intensity of carbon emissions in western China using the GM (1,1) model, and the study showed that the intensity of carbon emissions in this region has been declining annually (Yang et al., 2024). Ye proposed a better dynamic time-delay discrete grey prediction model for forecasting carbon emissions in China. The prediction performance of the model was superior to that of machine learning, statistical prediction models, and classic grey prediction models, according to the results (Ye et al., 2022). Ding and Zhang proposed a novel information grey model for predicting carbon emissions across 30 Chinese regions. Research has found that this model exhibits smaller fluctuations and better stability in predictions for 30 provinces and has advantages compared to other models (Ding and Zhang, 2023). Gu used a damping fractional-order grey model for carbon emissions forecasting and concluded that the disparities in carbon emissions among different regions in China are projected to show a decreasing trend (Gu, 2024). Cai and Wu proposed a new grey model for accumulating information priority to conduct a prediction study on the carbon emissions of the BRICS countries. They found that the carbon emissions of Russia, Brazil, and South Africa have been relatively stable over the long term, while those of China and India have shown a slow upward trend (Cai and Wu, 2024). Jiang et al. used the new discrete grey Bernoulli seasonal model to predict the monthly carbon emissions in the United States. Their research found that this model had high prediction accuracy (Jiang et al., 2025).
Despite the fact that the grey prediction model has demonstrated much promise for use with respect to forecasting carbon emissions, it still faces some problems. Firstly, traditional models such as GM(1,1) often have limited prediction accuracy when dealing with data with significant nonlinear and non-homogeneous characteristics. Secondly, in the context of complex datasets involving multiple variables, existing models often struggle to account for the intricate dependencies among these variables, thereby undermining the predictive performance and overall accuracy of the results. In addition, the limitations of the model in parameter optimization also limit its ability to adapt to complex and dynamic data environments. In order to address these limitations and improve prediction performance, the present study employs the UNGM(1,1). This model aims to achieve more accurate predictions of nonlinear, non-homogeneous, and multivariate data by optimizing algorithms and considering new mechanisms for variable interactions. Scientific studies on carbon emissions in the Yellow River Basin can give policymakers a strong foundation for decision-making by employing the UNGM(1,1) model. Figure 1 shows the research area of this paper.
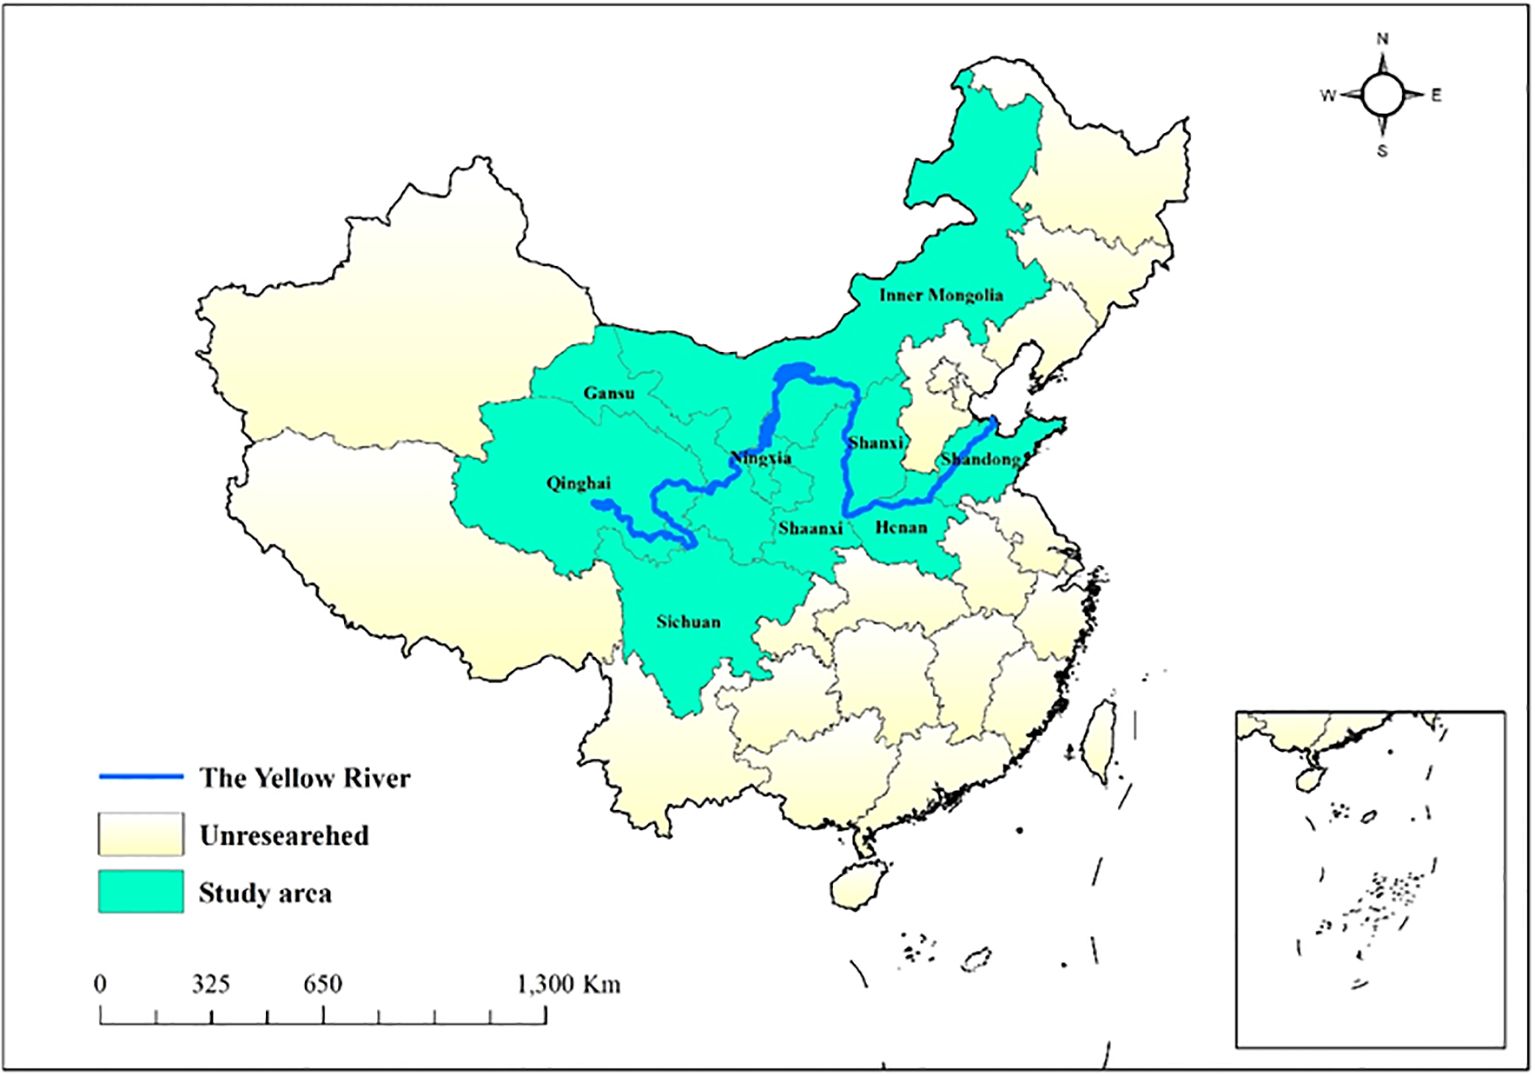
Figure 1. The geographical locations of the nine provinces in the Yellow River Basin in China.
2 Methodology
2.1 The UNGM(1,1) model
Based on the features of the data and model, this study employs a new unbiased grey prediction model. The background value is reconstructed based on the integral median theorem, which in turn gives a new unbiased parameter estimation method. This approach addresses the background value deviation caused by trapezoidal formula approximation in traditional grey models. By employing a linear combination, it unifies parameter estimation with equation solving, thereby eliminating the ‘parameter jump’ defect inherent in conventional modeling approaches. The abbreviation of the model is . The following paper introduces the modeling process in detail.
Step 1. is the original sequence of this model. Among then, .
After r-order accumulation, we get . is obtained by the following formula. Equation 1 is as follows.
Step 2. The whitening equation of the model with Equation 2.
Among them, are parameters. Over the , we can set Equations 3–5.
Step 3. The estimated parameter value can be derived by the least squares method using the following Equations 6 and 7:
Where
Step 4. Solving differential equations. We set . At this point, the time response of the model can be derived as Equation 8:
The calculated Equations 9 and 10 is:
Where
Step 5. This study employs average absolute percentage error (MAPE) to evaluate the accuracy of the model fitting. A smaller MAPE value indicates higher fitting accuracy. Equations 11 and 12 is as follows.
2.2 Validation of the model
To confirm if the model is accurate in predicting carbon emissions, this section focuses on the carbon emissions in Shandong and Henan provinces as the research subjects. The new model’s efficacy is assessed by comparing the fitting and carbon dioxide emission projection data from four different models. The models involved in the comparison are the discrete grey model [DGM(1,1)], the fractional grey model [FGM(1,1)], and the composite accumulative grey model [CGM(1,1)]. The data comes from the CEADs (https://www.ceads.net.cn/), and the data is as of 2021.
Case 1. Carbon dioxide emissions in Shandong Province.
In this section, the fitting comparison data is the carbon emissions data of Shandong Province, China, from 2012 to 2017, and the forecast comparison data is the carbon emissions data from 2018 to 2021. Firstly, four models are trained using data from 2012 to 2017. This yields a dataset for the period from 2012 to 2017, referred to as the fitting data. Meanwhile, data from 2018 to 2021 are obtained and designated as the forecasting dataset. Subsequently, by comparing the fitted and predicted data with the original data, we can determine the errors in both the fitting and prediction stages, as presented in Table 1. Furthermore, to improve the clarity of the comparison among the four models, the data presented in Table 1 are also illustrated in Figure 2 of the paper.
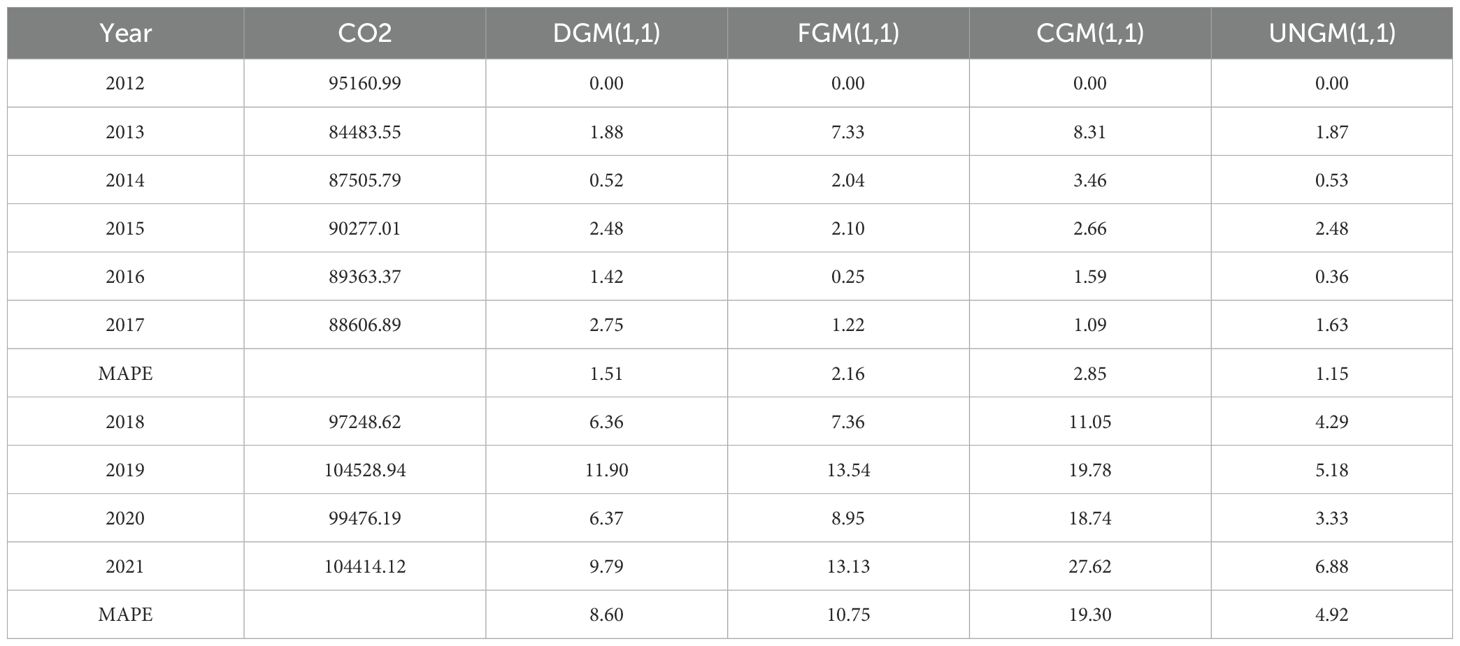
Table 1. Comparison of MAE and MAPE between UNGM (1,1) and three other models.
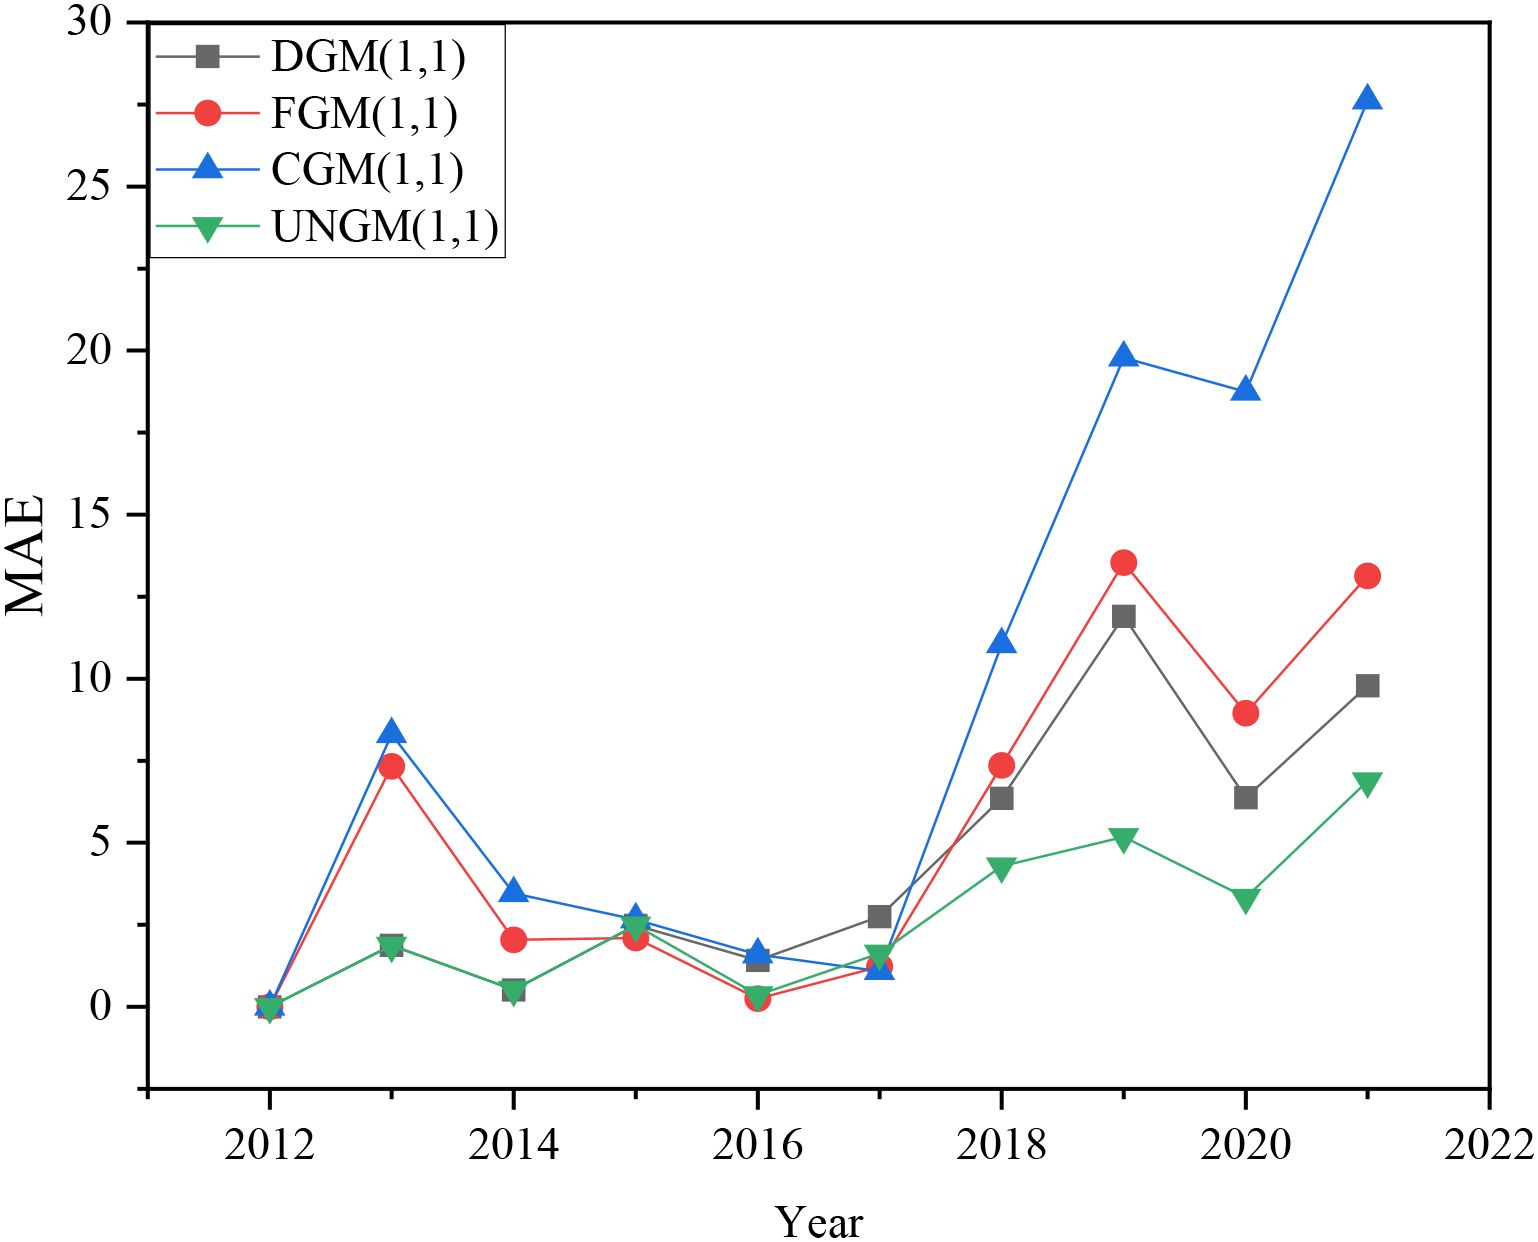
Figure 2. MAE of four models for predicting carbon emissions in Shandong Province.
As shown in Table 1, the MAPE values for the four models during the fitting stage are 1.51, 2.16, 2.85, and 1.15, respectively. In the prediction phase, the corresponding MAPE values are 8.60, 10.75, 19.30, and 4.92, respectively. Comparative analysis reveals that the fourth model demonstrates the lowest MAPE for the prediction and fitting phases. According to Figure 2, we can also notice that the MAE curve appears flatter compared to the other three models, and the overall MAE value is lower.
Case 2. Carbon dioxide emissions in Henan Province.
In this section, we utilize the carbon emissions data from Henan Province, China, spanning from 2012 to 2017, as the fitting comparison data, while the carbon emissions data from 2018 to 2021 serve as the forecasting dataset. Initially, four models are trained using the data from 2012 to 2017. This process produces a set of fitted values for the same period and generates predicted values for the years from 2018 to 2021. Subsequently, the fitted and forecasted values are compared with the original observations to evaluate the errors associated with the phases of fitting and prediction. The results are presented in Table 2. Additionally, to enhance the visibility of the comparison among the four models, the data from Table 2 is also displayed in Figure 3 of the paper.
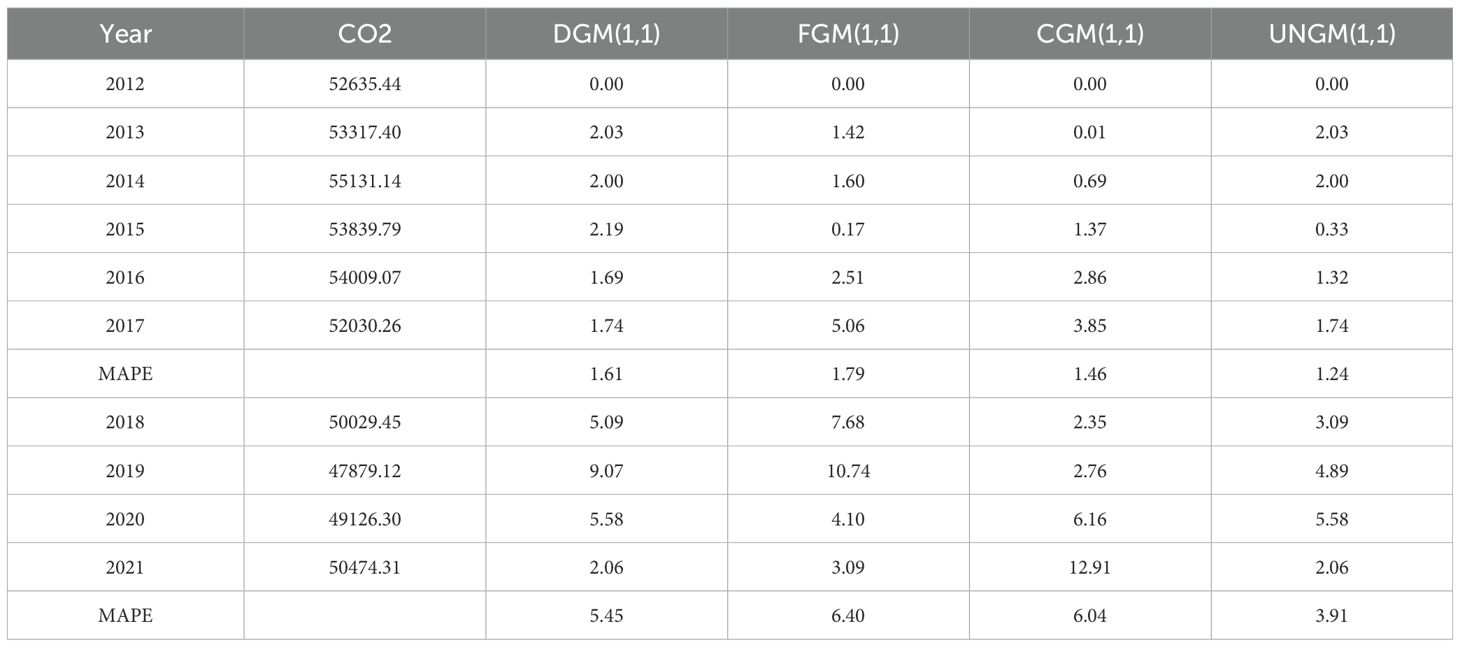
Table 2. Comparison of MAE and MAPE between UNGM (1,1) and three other models.
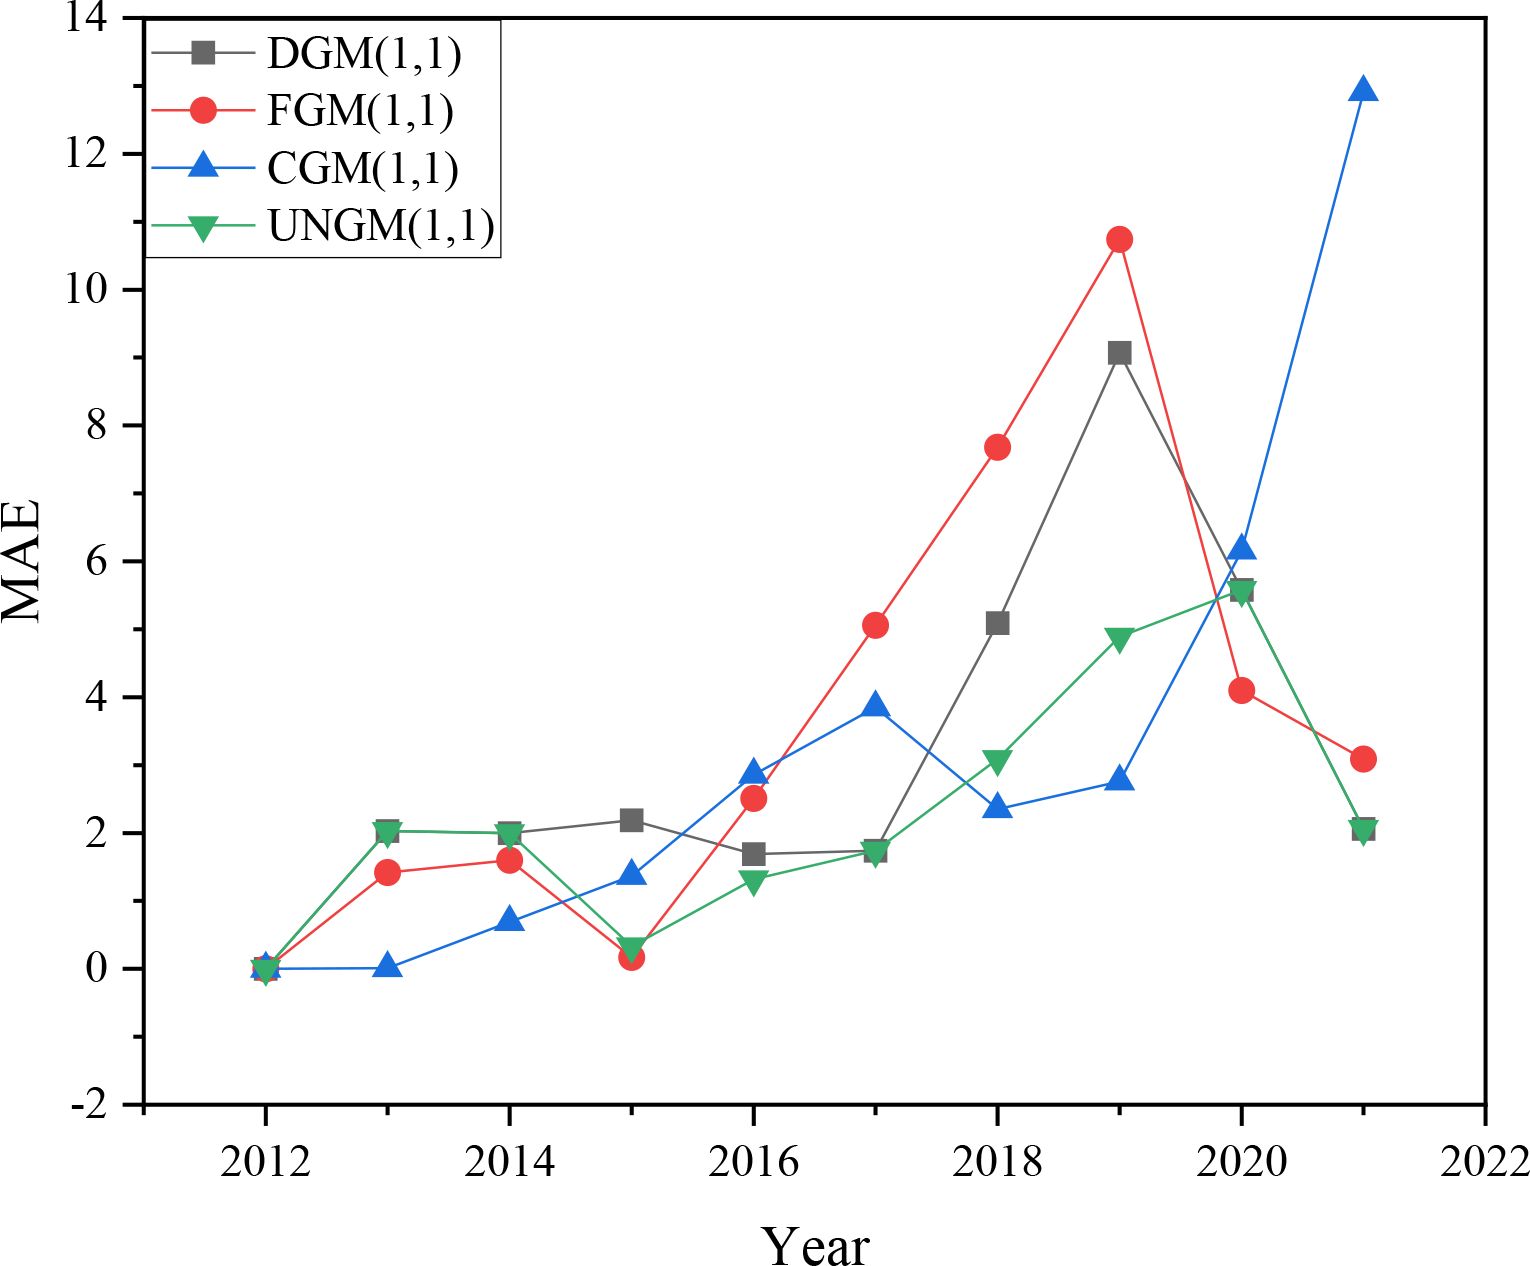
Figure 3. MAE of four models for predicting carbon emissions in Henan Province.
Table 2 shows that throughout the fitting phase, the MAPE values of , , , and are 1.61, 1.79, 1.46, and 1.24, respectively; The four models had respective MAPE values of 5.45, 6.40, 6.04, and 3.91 at the prediction stage. By comparison, it can be concluded that the MAPE value of is the smallest in the prediction and fitting stages. In Figure 3, we can also see that the MAE curve of is flatter compared to the other three, and the overall MAE value is smaller.
Through the case analysis of carbon emissions data from Shandong and Henan provinces in China above, we can know that the MAPE value of is the least in both the prediction and fitting phases. In both Figures 2, 3, the MAE of is also the smoothest, and the MAE value is generally smaller. Therefore, we can consider that the model has better predictive performance and demonstrates better stability, making it suitable for addressing the research objectives of this study.
3 Results
The superiority of the grey model in this article has been verified through the above data analysis, which can meet the research needs of carbon emissions in the Yellow River Basin of China. In this section, we will use this unbiased grey prediction model to predict the carbon emissions from 2022 to 2030 based on the carbon emissions data of 9 provinces in the Yellow River Basin from 2012 to 2021. The data comes from https://www.ipe.org.cn/index.html, and the data is as of 2021.
3.1 Analysis of forecast results of carbon dioxide emissions in Qinghai Province
As seen in Figure 4 and Table 3, the carbon emissions in Qinghai Province peaked in 2016, and in the following years, the carbon emissions increased and decreased. However, a significant fluctuation occurred in 2021, marked by a carbon emissions growth rate of 24%, which was also the second peak of carbon emissions in Qinghai Province that year. According to the forecast data, the data after 2021 is relatively stable, showing a slow downward trend. Carbon dioxide emissions are projected to decline to 53.049 million tons by the year 2030. Therefore, Qinghai is expected to reach a carbon peak by 2030. This is due to the abundant clean energy and optimized industrial structure adjustment in Qinghai Province. Qinghai Province is located in a high-altitude arid area and has abundant solar and wind energy. Meanwhile, Qinghai Province actively encourages the optimization of industrial structure, vigorously develops the clean energy industry, and reduces the proportion of industries with substantial emissions and energy consumption. Enhancing energy efficiency and lowering carbon emissions are our goals through industrial upgrading and technical innovation.
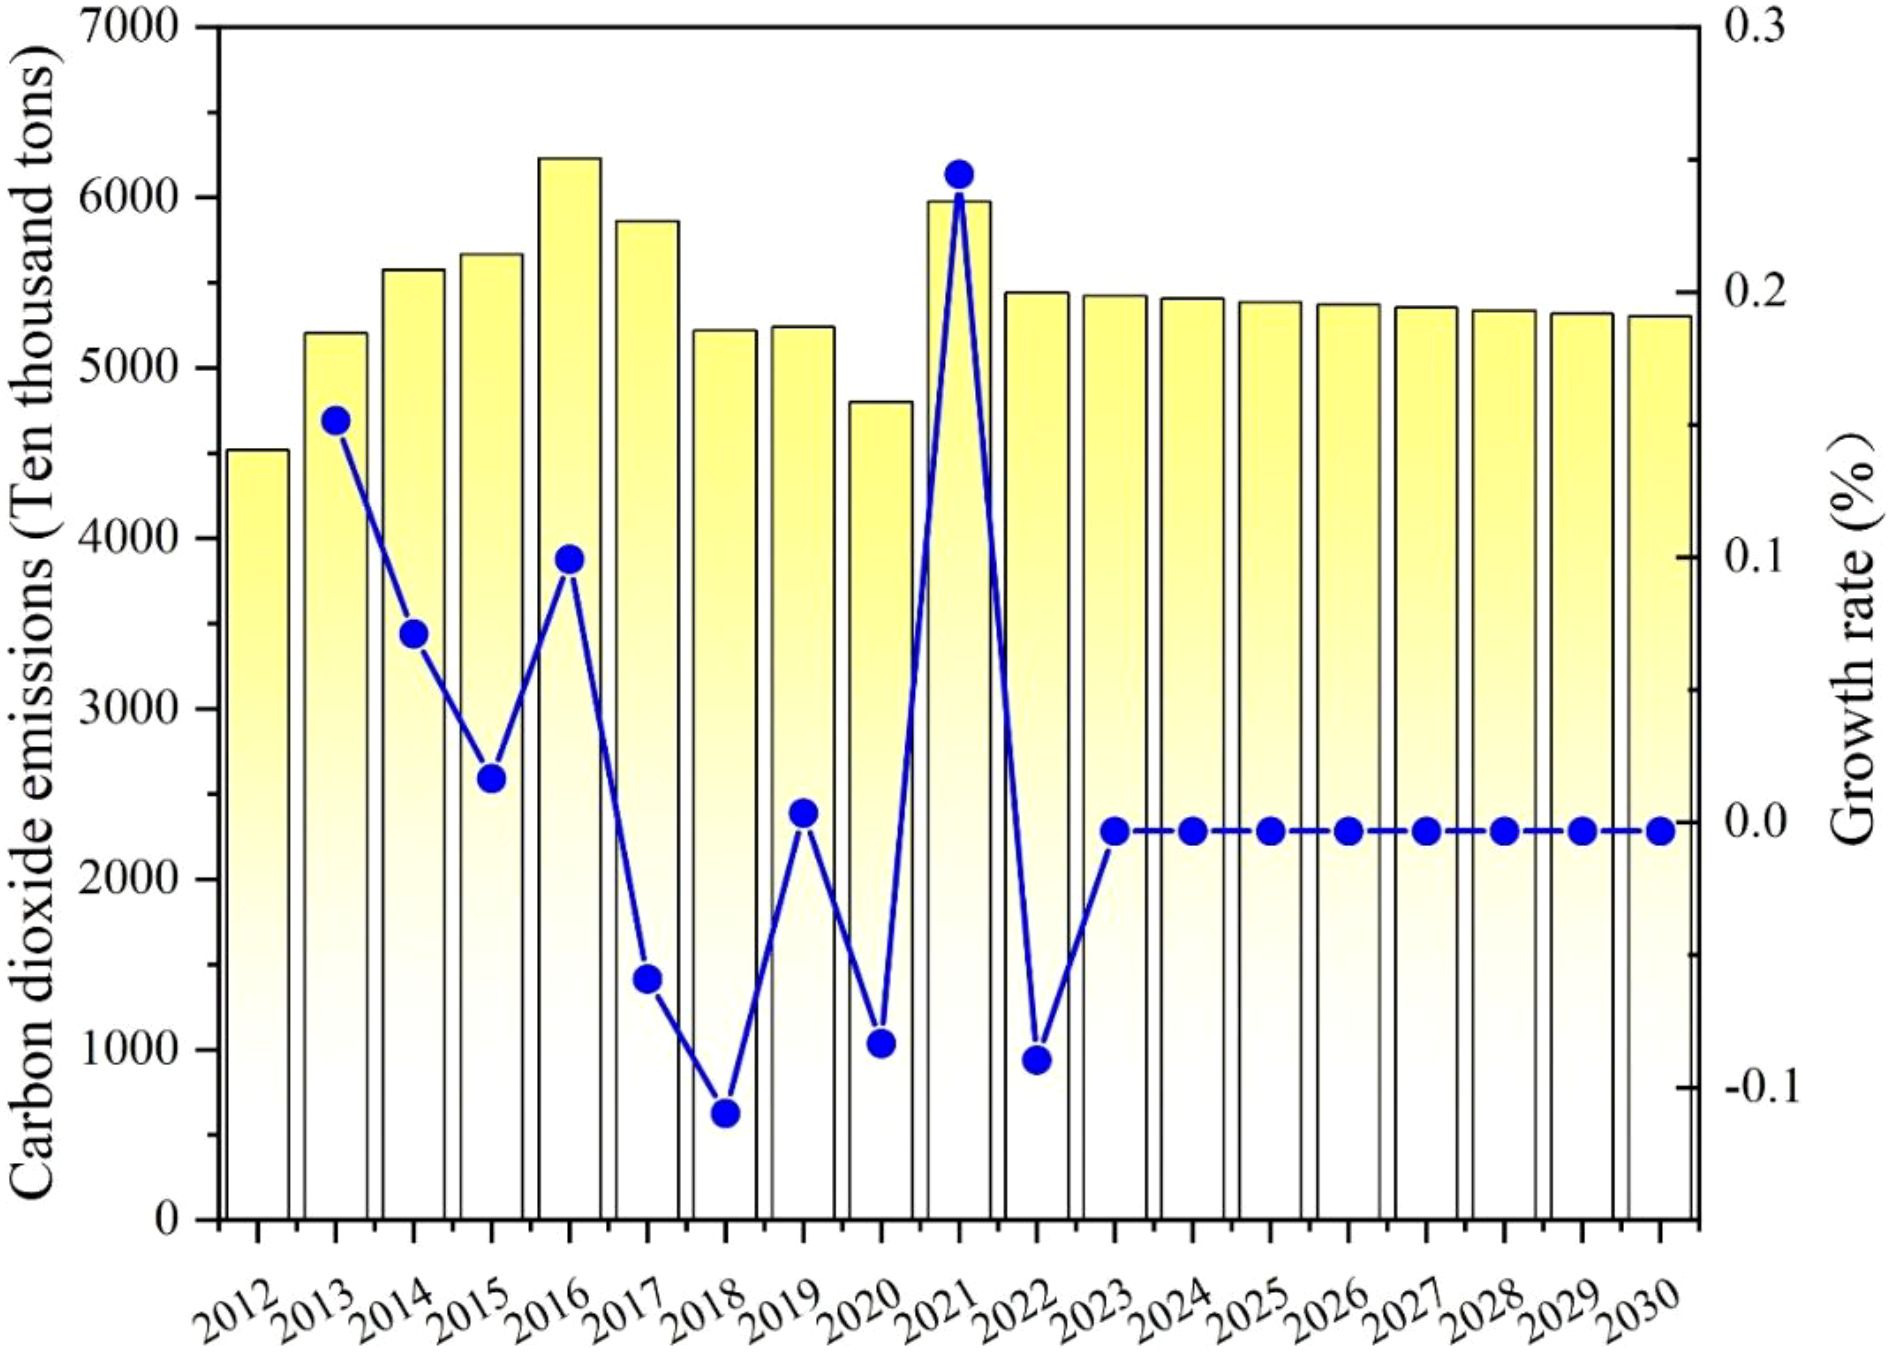
Figure 4. Carbon emissions and the growth rate of Qinghai Province from 2012 to 2030.
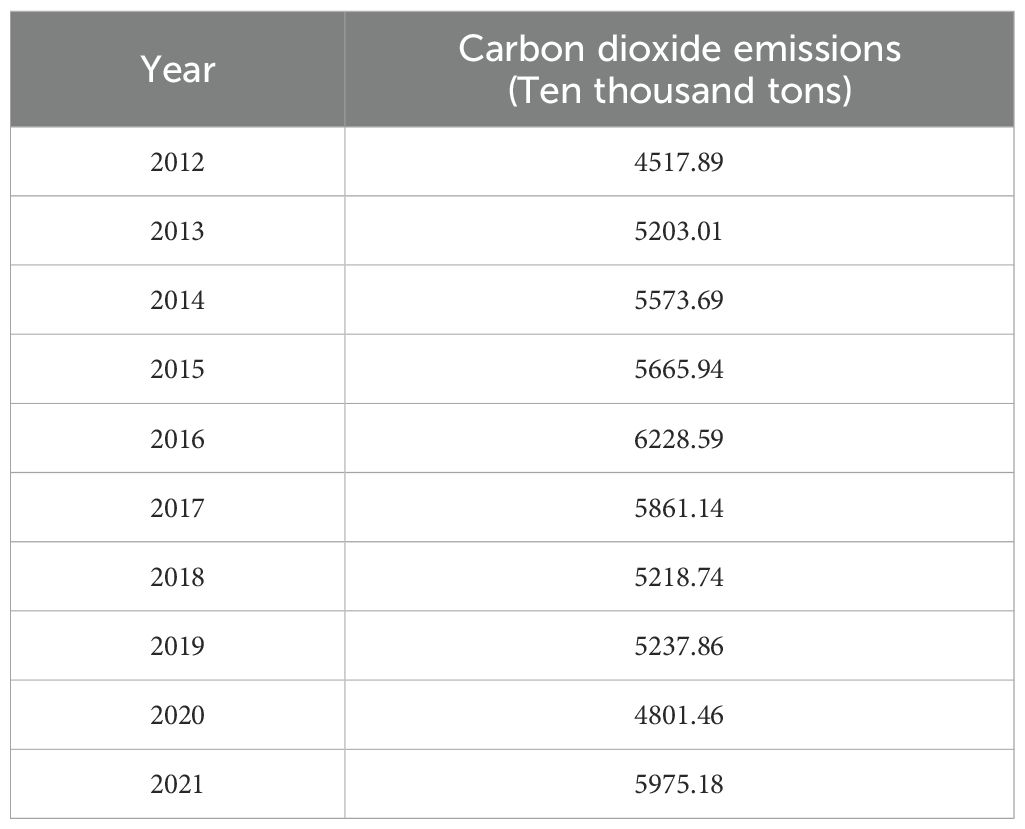
Table 3. Carbon emissions of Qinghai Province from 2012 to 2021.
3.2 Analysis of forecast results of carbon dioxide emissions in Sichuan Province
As seen in Figure 5 and Table 4, Sichuan Province has achieved certain results in reducing emissions of carbon dioxide. In 2013, carbon dioxide emissions reached their peak for the first time, reaching 321.2667 million tons, with a growth rate of 2.25%. Since then, carbon emissions have been declining annually. This suggests that Sichuan Province may have taken measures such as increasing the use of renewable energy, improving energy efficiency, or implementing stricter environmental policies to reduce carbon emissions after 2013. However, carbon emissions in Sichuan Province experienced increases in 2019 and 2021, with growth rates of 5.05% and 4.50%, respectively. However, forecast data shows that from 2021 onwards, except for a possible positive growth in 2025, it is expected that the carbon dioxide emissions in Sichuan Province will continue to decline. By 2030, it is expected that emissions will decrease to approximately 206.5292 million tons, indicating that Sichuan Province is scheduled to exceed the national carbon peak goal in advance. This is due to the abundant renewable energy resources in Sichuan Province. Among all provinces in China, Sichuan possesses some of the most substantial hydropower resources. With the upper reaches of the Yangtze River and numerous tributaries, hydropower has significantly reduced the usage of fossil fuels as a source of clean energy. Furthermore, Sichuan Province has worked to modify its industrial structure in recent years, implementing energy-saving and carbon reduction measures, promoting green transformation of transportation, strengthening policy support, and enhancing ecosystem carbon sinks. The goal of the carbon peak is expected to be reached by 2030.
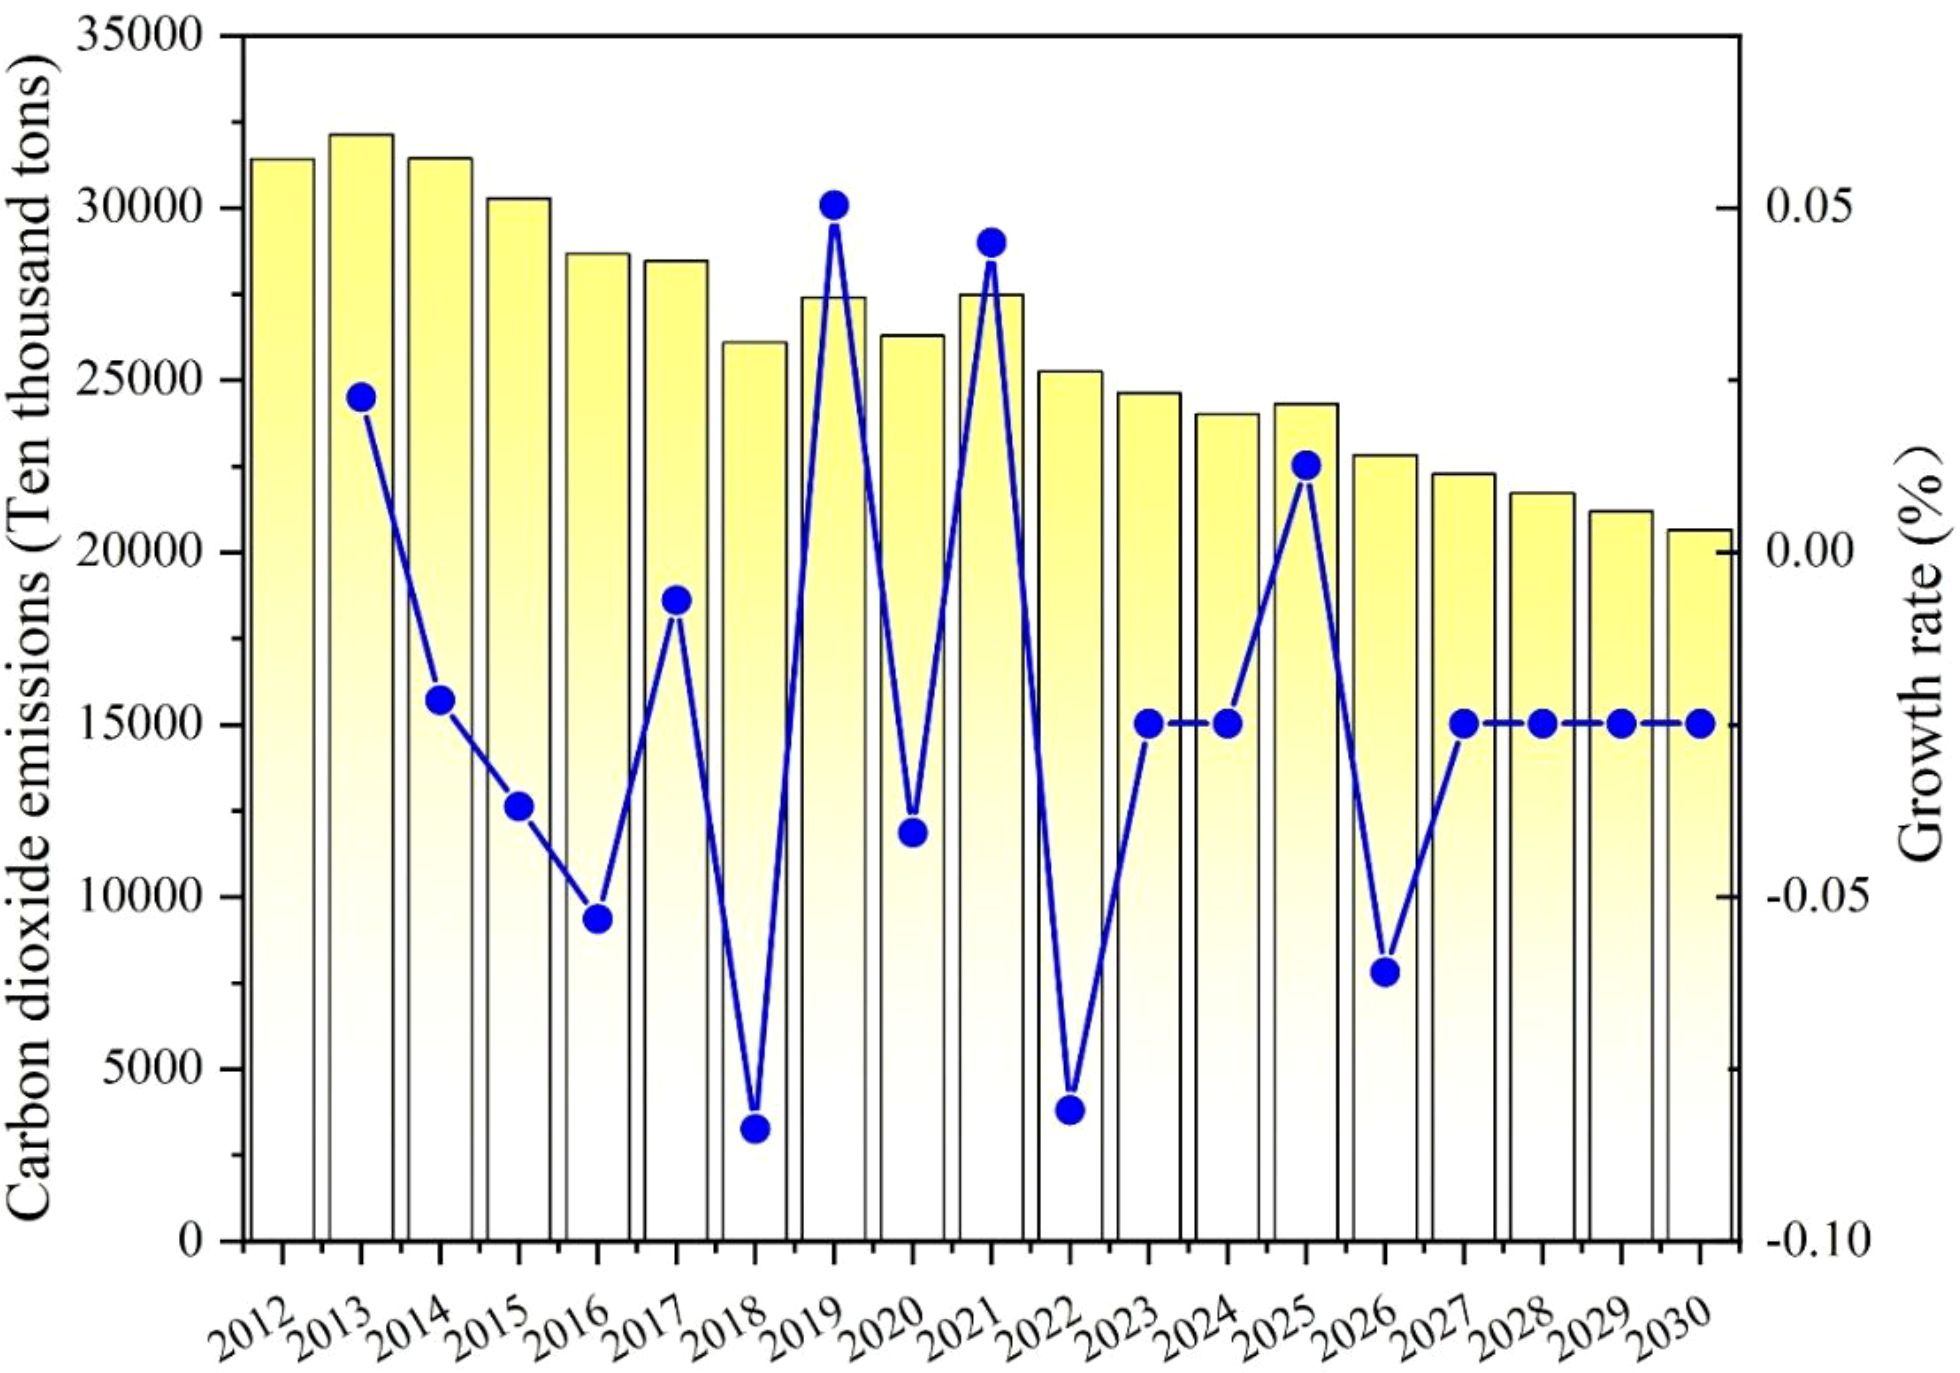
Figure 5. Carbon emissions and the growth rate of Sichuan Province from 2012 to 2030.

Table 4. Carbon emissions of Sichuan Province from 2012 to 2021.
3.3 Analysis of forecast results of carbon dioxide emissions in Gansu Province
As shown in Table 5 and Figure 6, the overall emissions of carbon dioxide in Gansu Province exhibited a fluctuating rise from 2012 to 2021. After 2014, carbon emissions decreased slightly but rose again in 2018, followed by a significant increase in 2021, reaching 184.128 million tons with a growth rate of 8.95%. The significant increase may be attributed to the gradual control of the global pandemic in 2021. In an effort to stimulate economic recovery, the government may have increased infrastructure investment, while high energy-consuming projects may be postponed during the pandemic, leading to a concentrated release of production capacity in 2021 and a surge in emissions. Consequently, Gansu Province’s carbon dioxide emissions also rise. Forecast data indicates that carbon dioxide emissions are expected to increase year by year, reaching 1998.653 million tons by 2030, indicating significant pressure to reduce emissions. Although the growth rate is slow and steady, the sustained increase in emissions means that achieving the carbon peak target by 2030 will be challenging. As an underdeveloped region, economic growth remains the top priority in Gansu Province, which may conflict with emission reduction targets. In order to improve people’s living standards and promote regional development, Gansu Province needs to continue promoting industrialization and urbanization processes, which are frequently accompanied by significant emissions of carbon dioxide and energy. It is difficult to completely break free from dependence on fossil fuels like coal in the short term. In the future, Gansu Province should strictly implement emission reduction goals and environmental protection measures to ensure the sustainable growth and green transformation of high-energy-consuming industries. It is necessary to further promote technological innovation, increase the share of renewable energy sources such as solar and wind power, reduce dependence on coal, and make concerted efforts to achieve carbon peaking targets.
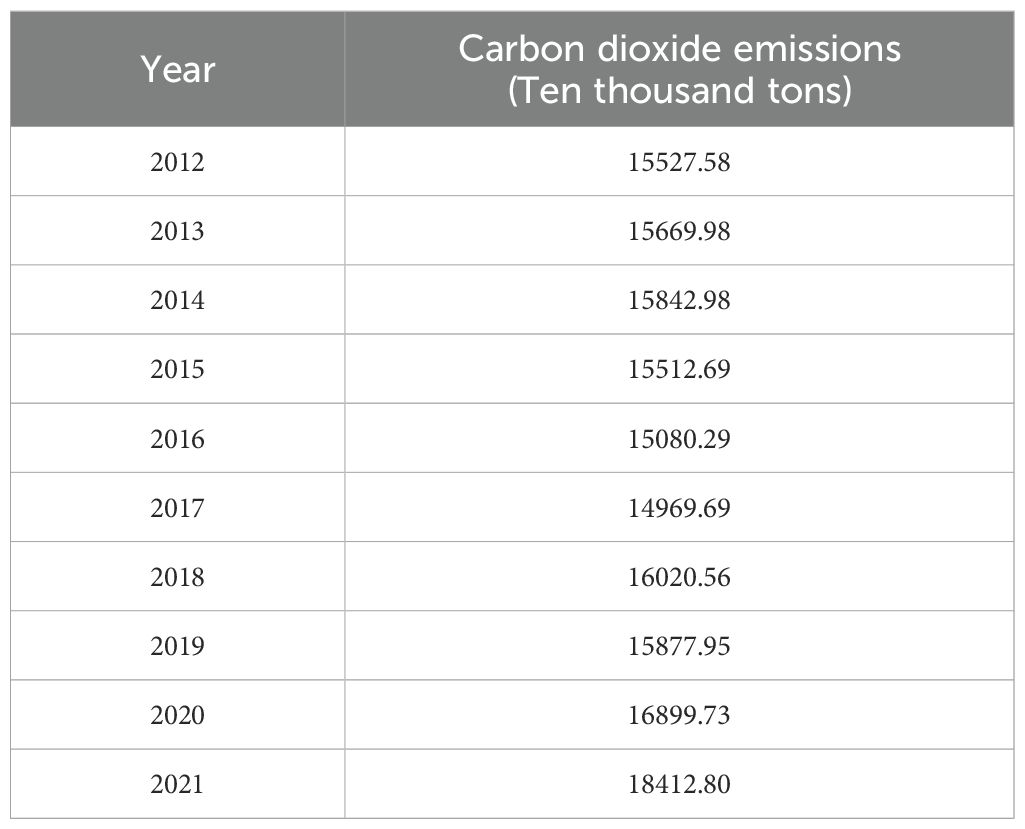
Table 5. Carbon emissions of Gansu Province from 2012 to 2021.
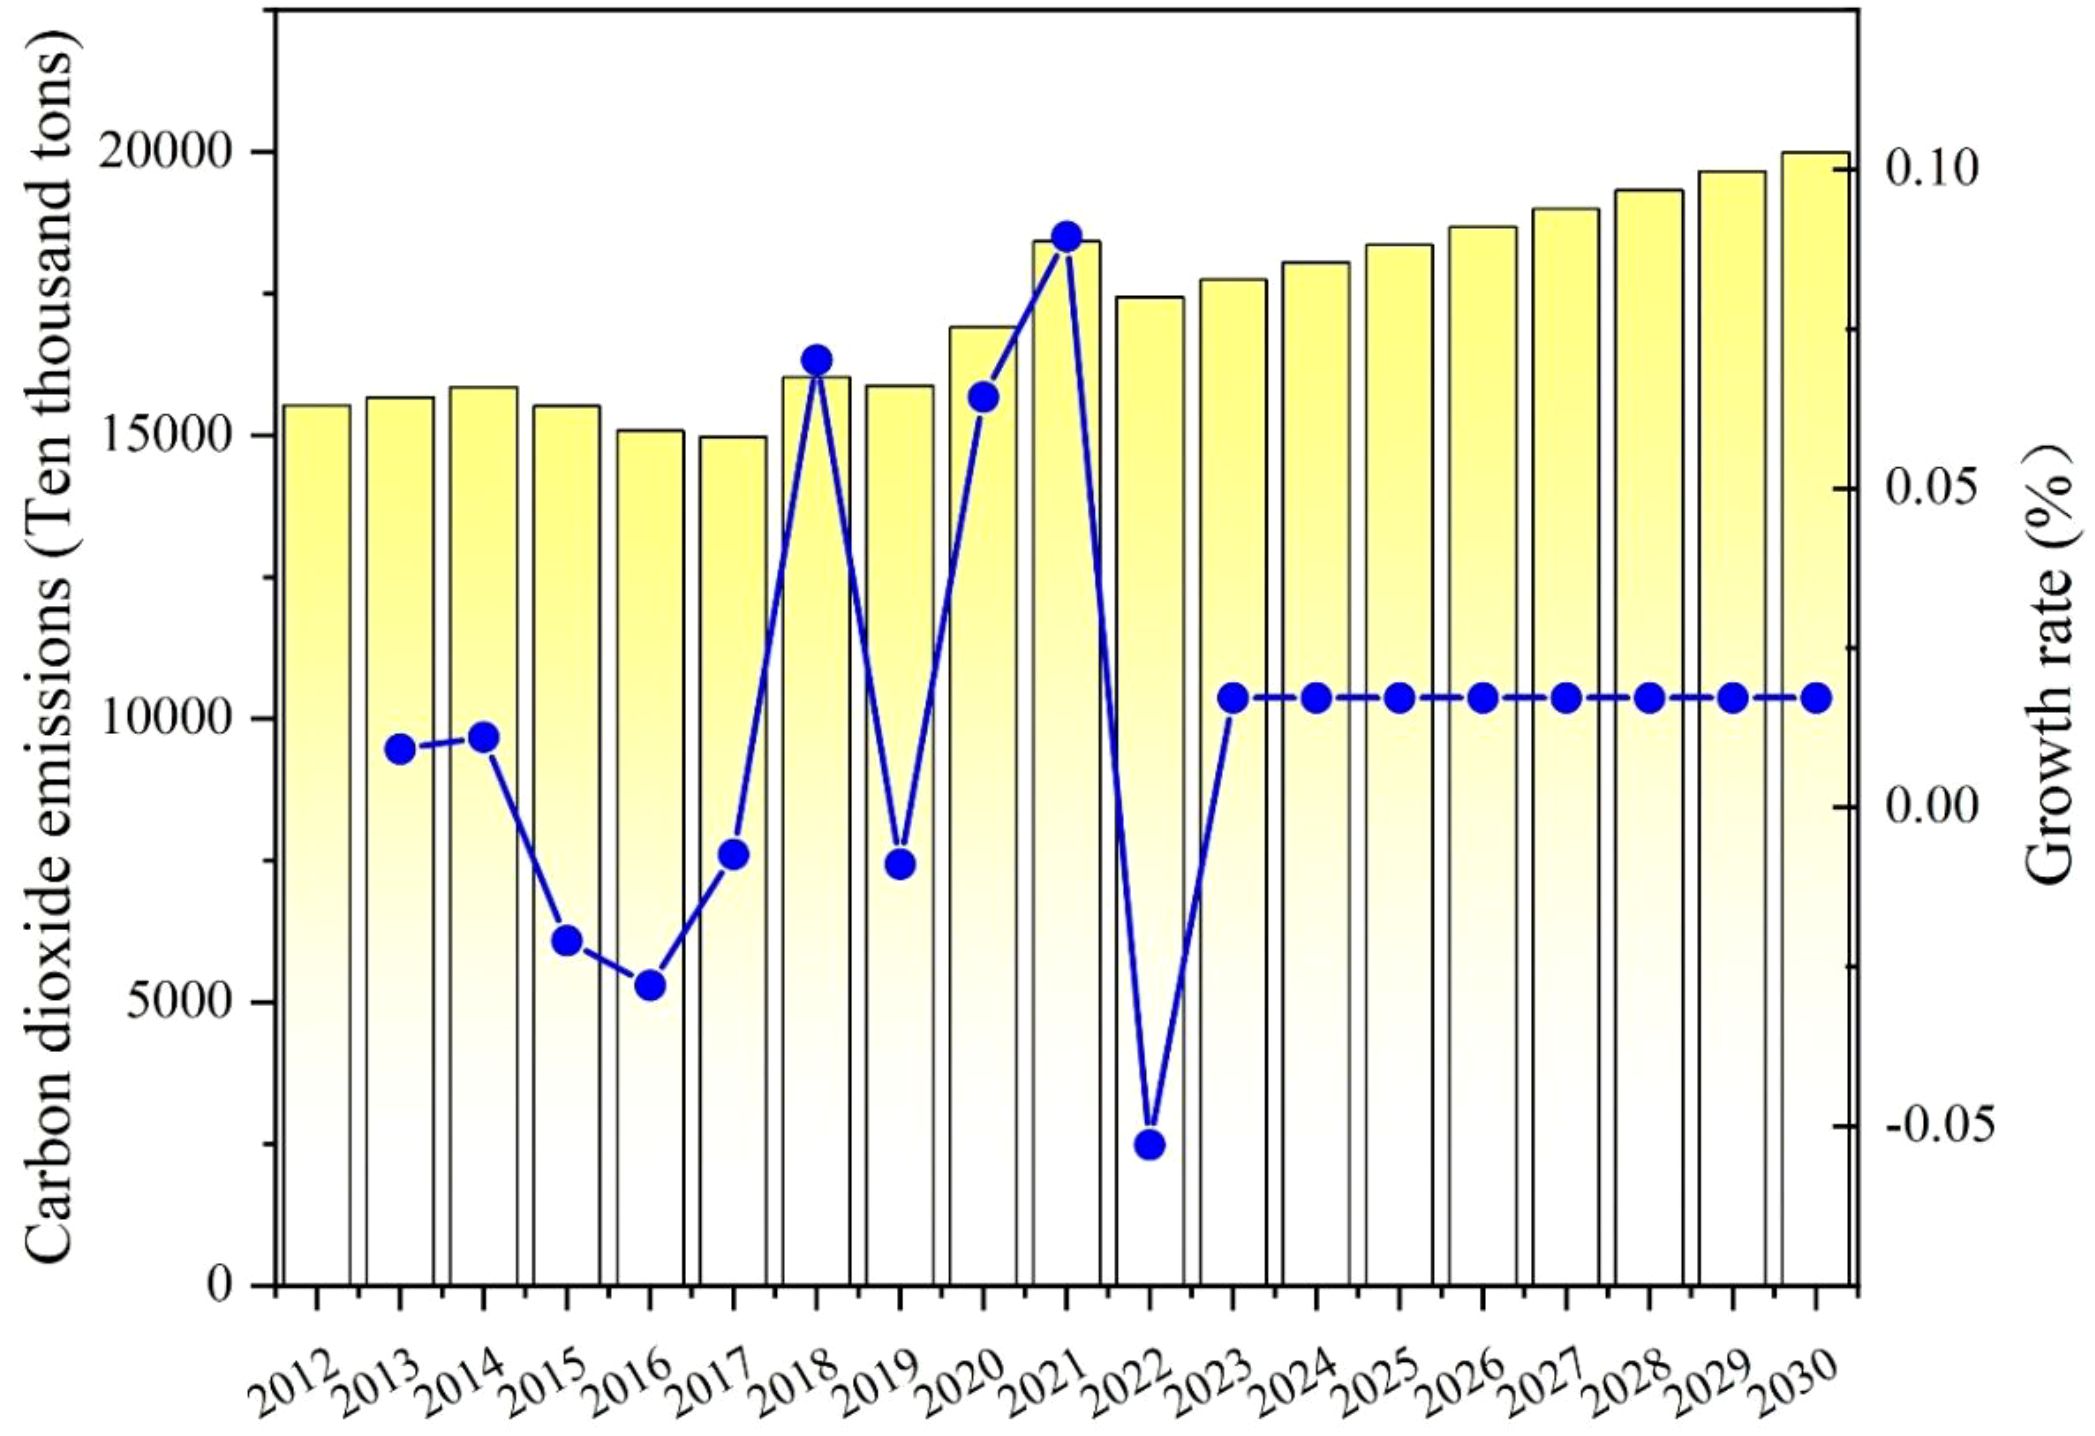
Figure 6. Carbon emissions and the growth rate of Gansu Province from 2012 to 2030.
3.4 Analysis of forecast results of carbon dioxide emissions in Ningxia Province
According to Table 6 and Figure 7, the total amount of carbon dioxide released by Ningxia increased between 2012 and 2021. However, in 2016, the decline was not significant, with a growth rate of only -2.37%. In the following years, carbon emissions rebounded and continued to increase. According to forecasts for 2022 and beyond, even if the growth rate of carbon dioxide emissions stabilizes, the large baseline suggests that total carbon dioxide emissions will reach approximately 265.542 million tons by 2030. The continuation of current trends suggests that Ningxia is unlikely to achieve peak carbon emissions before 2030. The reason may be that Ningxia is located in the northwest inland and belongs to an underdeveloped area. Under the Western Development Policy, large-scale infrastructure construction may short-term raise carbon emissions. Despite the abundance of renewable energy sources like wind and solar, the transition to clean energy may be slow and difficult to effectively replace traditional fossil fuels. This may be due to insufficient technology, funding, or policy implementation. Ningxia serves as a crucial coal-producing area in China, with coal being a substantial part of its energy framework. Carbon dioxide emissions are increased when coal is used as the main energy source. In the future, Ningxia should promote green and sustainable development through industrial upgrading and technological innovation. Although the construction industry is a pillar industry, it is required to enhance the industrial structure and promote low-energy consumption development. Increase investment and development of renewable energy, while gradually reducing reliance on traditional energy sources such as coal.
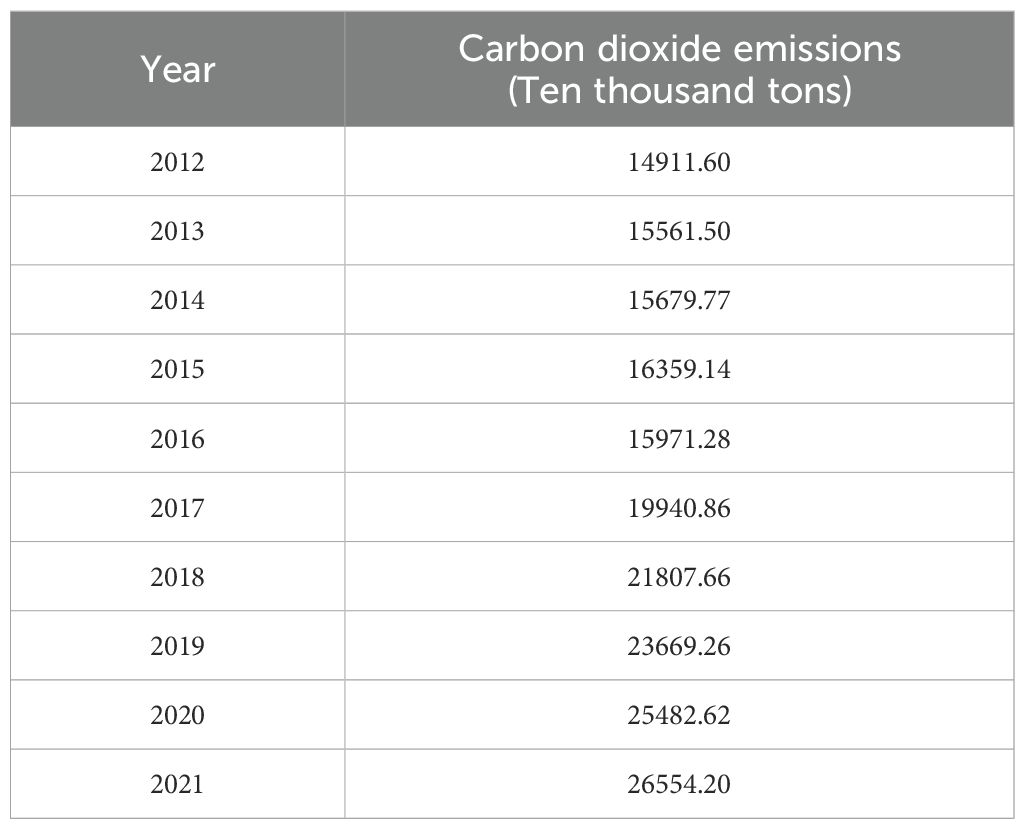
Table 6. Carbon emissions of Ningxia Province from 2012 to 2021.
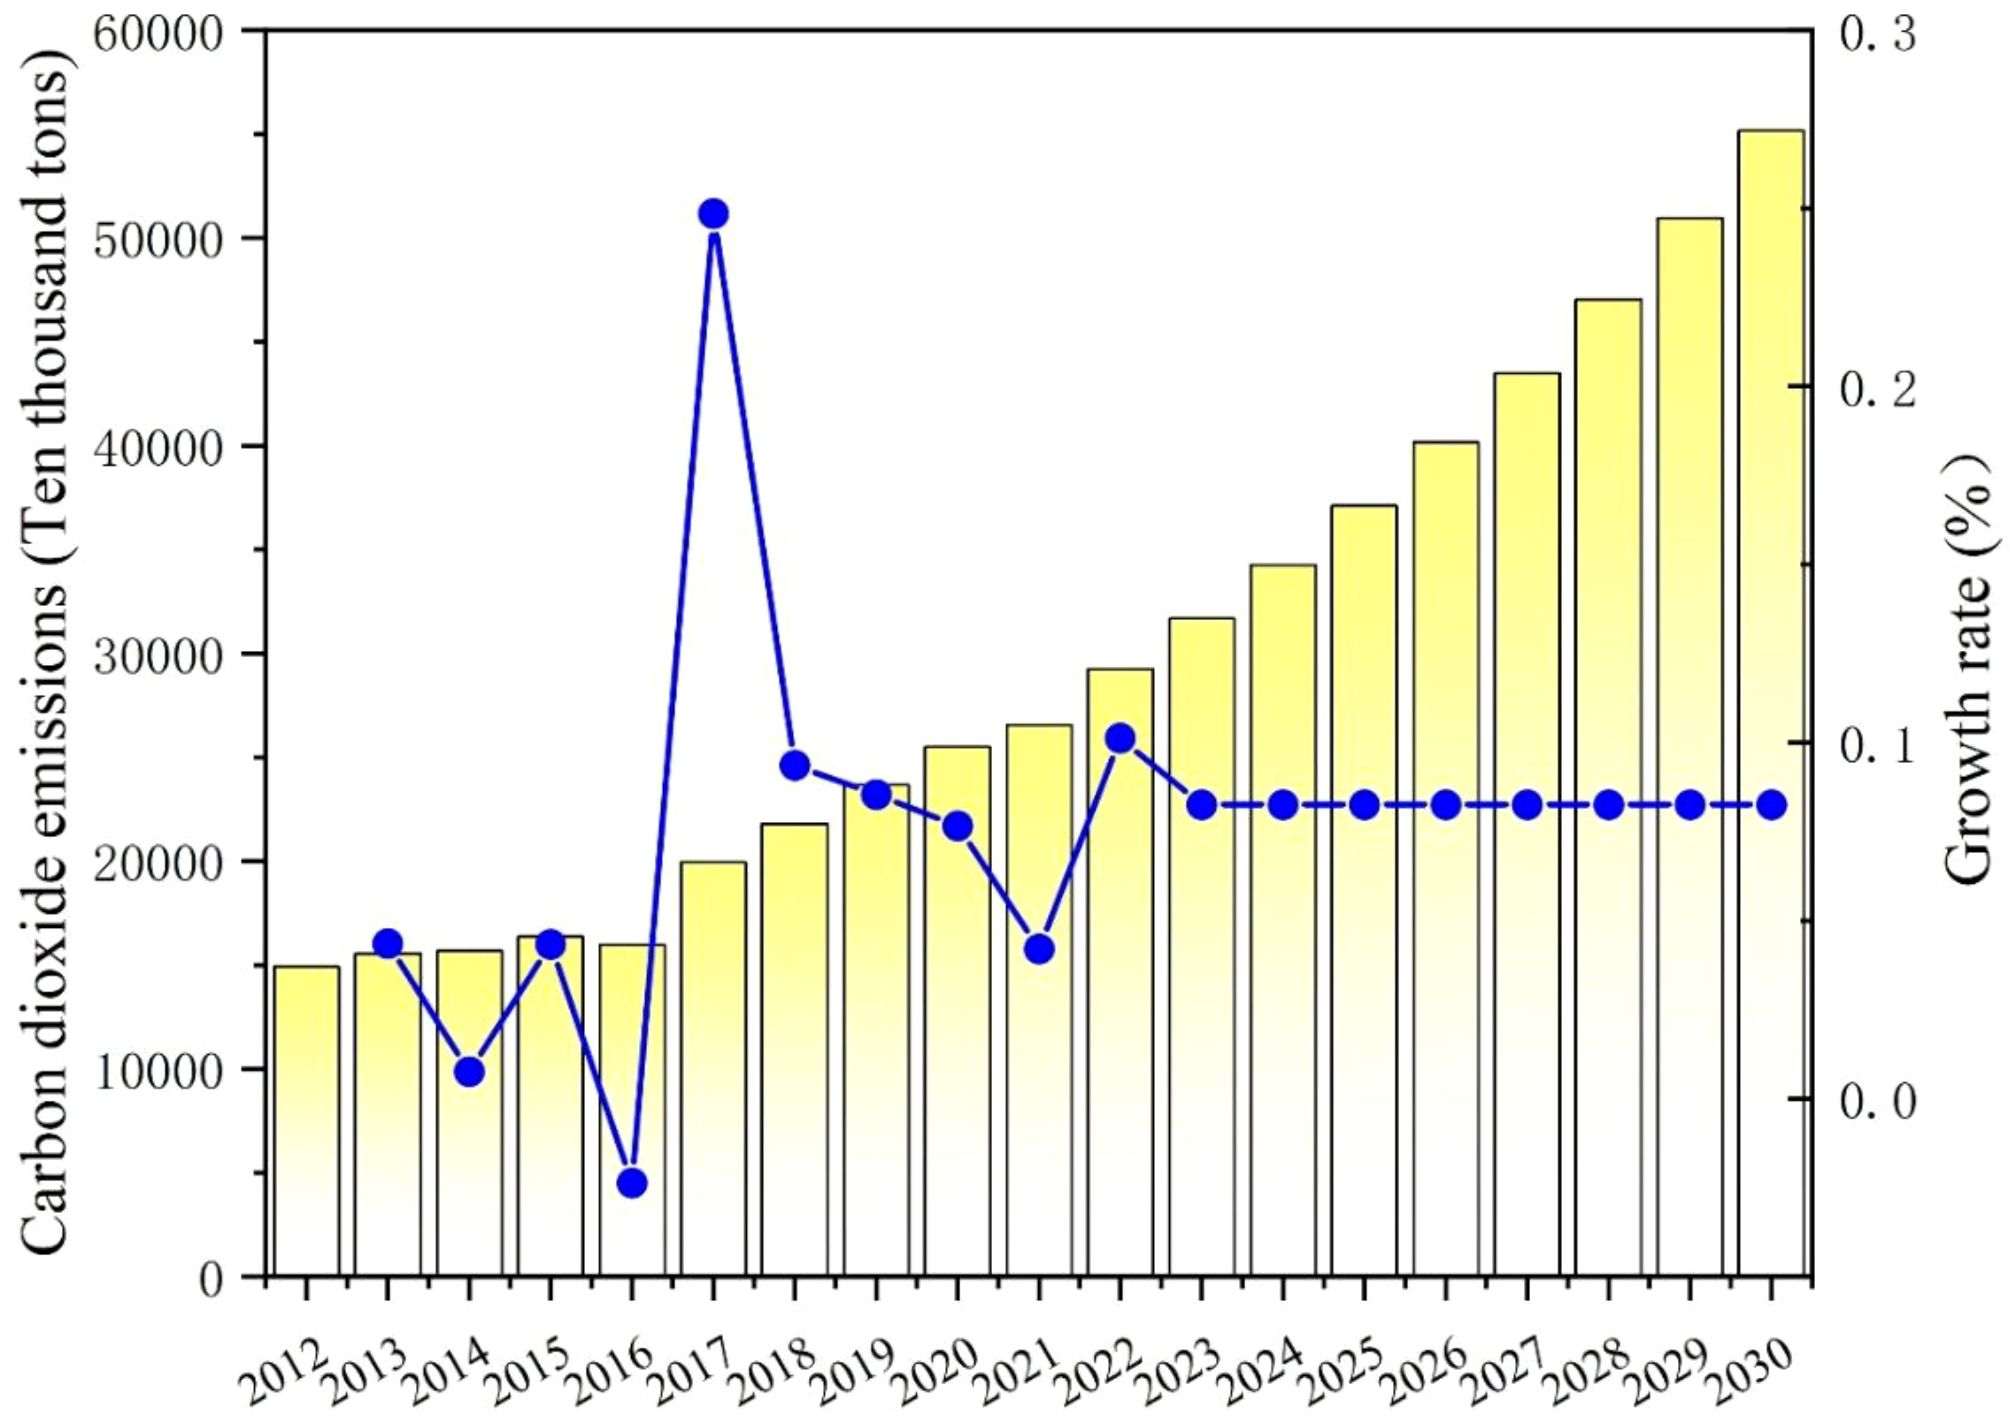
Figure 7. Carbon emissions and the growth rate of Ningxia Province from 2012 to 2030.
3.5 Analysis of forecast results of carbon dioxide emissions in Inner Mongolia Province
According to Table 7 and Figure 8, the total amount of carbon dioxide emissions in Inner Mongolia increased between 2012 and 2021. After 2012, the rate of increase in emissions initially increased, and then in 2018, the growth rate decreased. According to forecast data, the emissions of carbon dioxide in Inner Mongolia are anticipated to increase year by year from 2022. It is expected that by 2030, the overall carbon dioxide emissions will reach approximately 1571.5033 million tons. Although the growth rate has declined and stabilized after 2022, overall emissions of carbon are expected to continue to increase due to the large base. Even if the growth rate remains at a low or steady level, achieving the goal of peaking carbon emissions still faces significant challenges as long as positive growth is maintained. As a major energy province, Inner Mongolia’s carbon emissions have been consistently high, and the lack of cooperation between economic growth and the environment is particularly prominent. The development of heavy industry and energy-intensive industries has caused carbon dioxide emissions to rise. Coal dominates energy consumption in Inner Mongolia. Carbon dioxide emissions in Inner Mongolia will keep rising if the industrial structure and coal’s energy market share are not changed. Consequently, for Inner Mongolia to attain a carbon peak before 2030, it must reform its industrial structure and actively advance sustainable energy to supplant coal use.
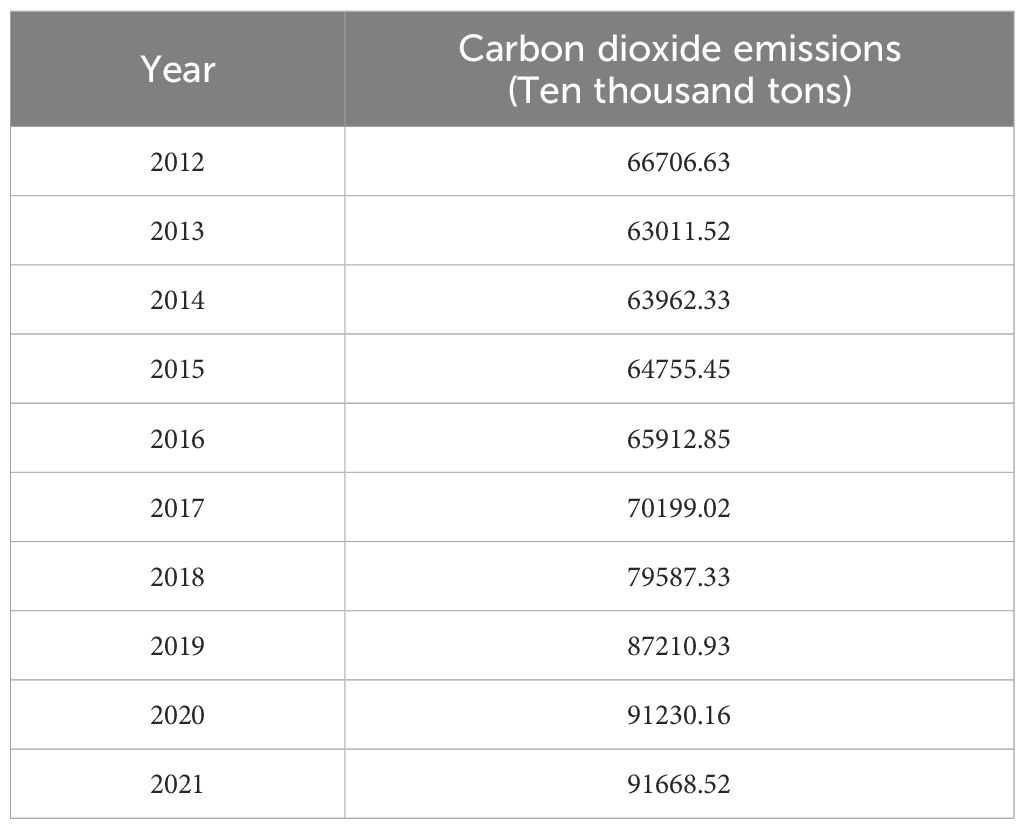
Table 7. Carbon emissions of Inner Mongolia Province from 2012 to 2021.
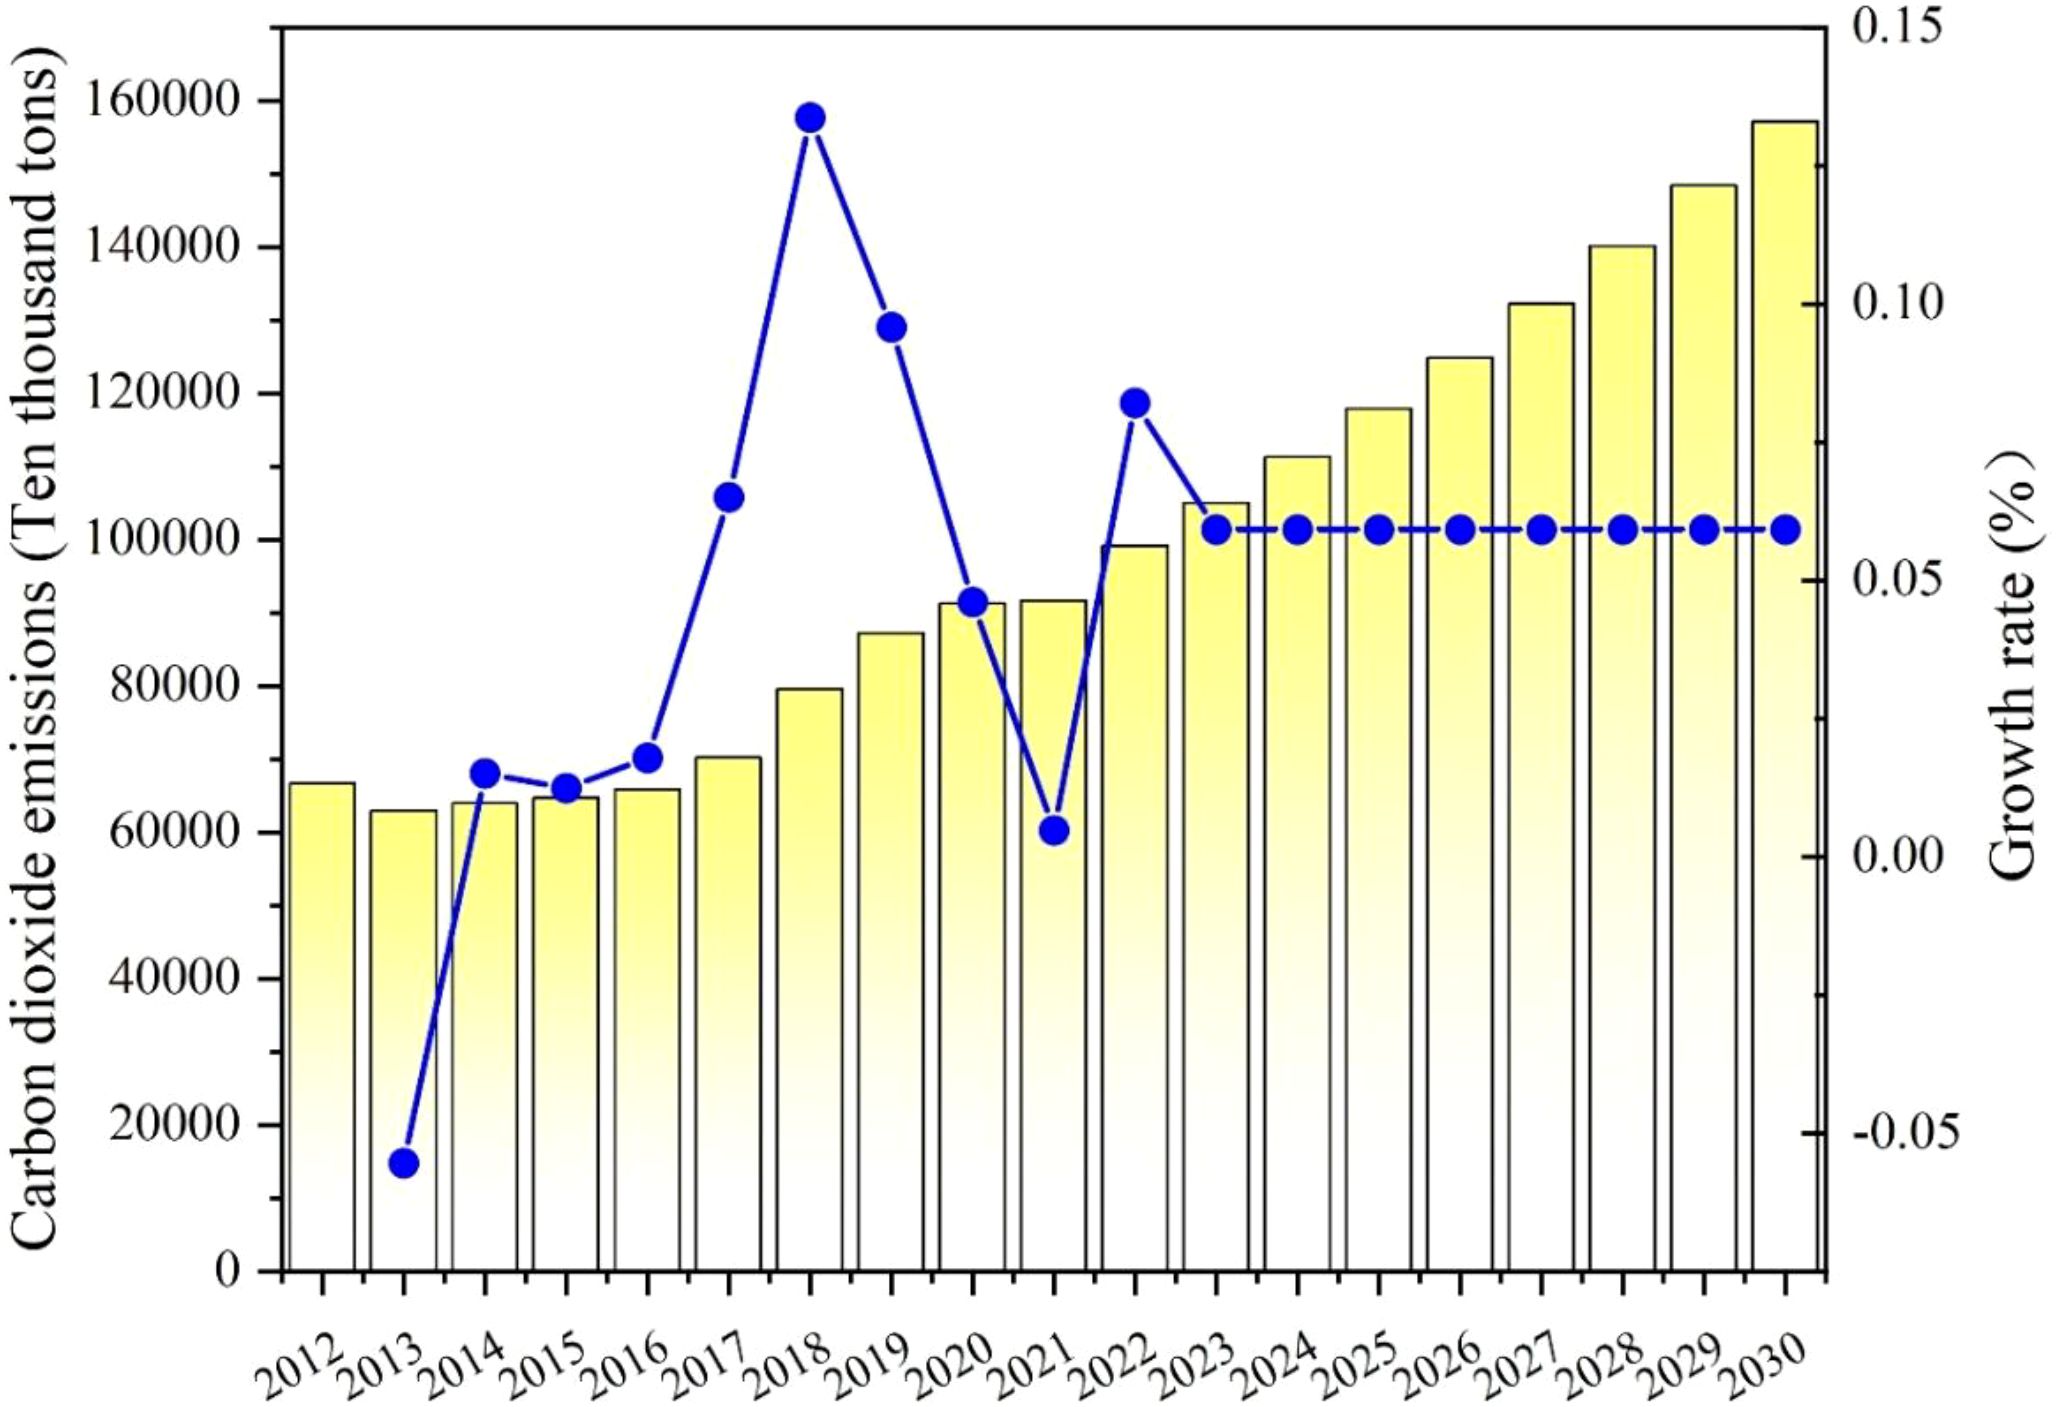
Figure 8. Carbon emissions and the growth rate of Inner Mongolia Province from 2012 to 2030.
3.6 Analysis of forecast results of carbon dioxide emissions in Shanxi Province
According to Table 8 and Figure 9, the overall carbon dioxide emissions in Shanxi exhibited a trend of initial decline followed by an increase during the period from 2012 to 2021. During this period, the growth rate of emissions fluctuated significantly, reaching a peak of 7.17% in 2017. In the following years, despite the implementation of emission reduction measures, carbon dioxide emissions continued to rise due to factors including economic growth and increased energy demand, reaching a historical high of 579.4686 million tons in 2021. This suggests that carbon dioxide emissions are still increasing in spite of emission reduction measures due to economic growth and increased energy demand. The predicted data shows that the emissions of carbon dioxide in Shanxi are expected to increase year by year from 2022. Although the growth rate may stabilize, emissions of carbon dioxide are expected to reach about 707.1103 million tons by 2030. This indicates that Shanxi faces significant pressure to reduce emissions, and there will likely be significant challenges in reaching the carbon peak target before 2030. The reason is that Shanxi is a province that produces a lot of coal, and coal-based energy is accountable for more than 76% of all industrial carbon emissions, which dominates all carbon emissions. Additionally, a comparatively large percentage of Shanxi’s secondary industry—particularly heavy industry—contributes to concentrated energy use and elevated carbon emissions. Therefore, in order to reach a carbon peak before 2030, Shanxi has to encourage the transformation of industries towards green and low-carbon and improve the energy structure’s adjustment. Meanwhile, actively promote low-carbon energy alternatives such as new energy vehicles and natural gas, reduce the use of traditional fuel vehicles, boost innovative technology study and development, and enhance coal’s clean use.
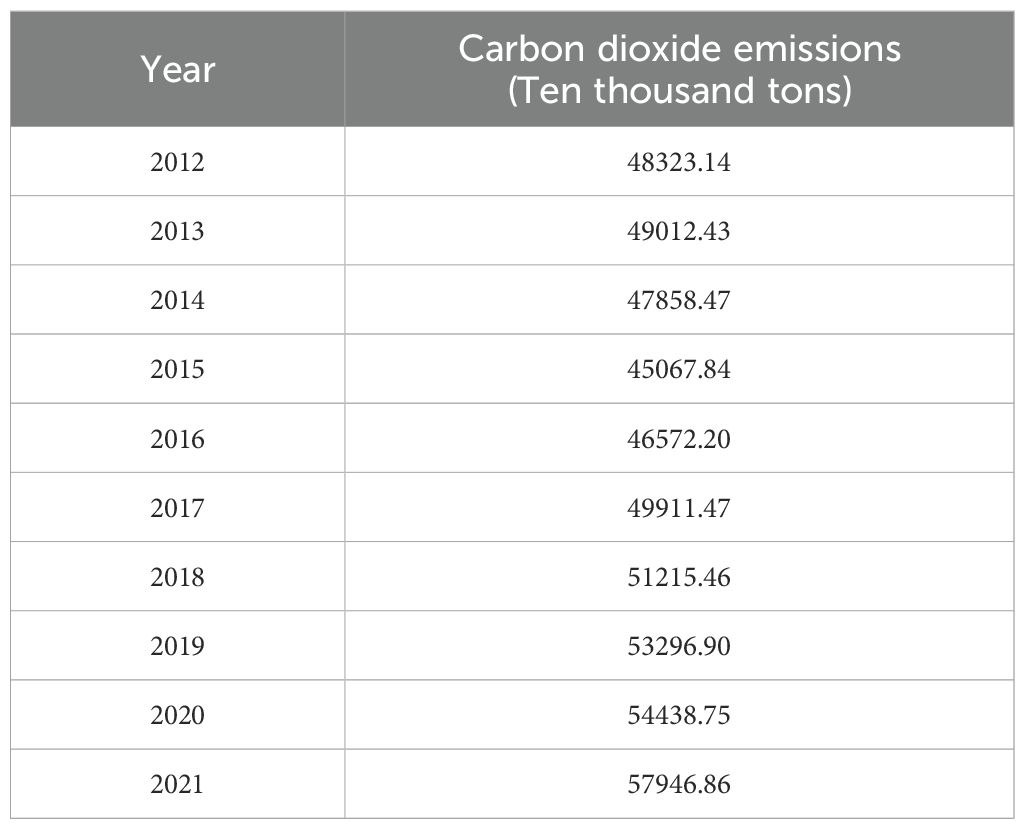
Table 8. Carbon emissions of Shanxi Province from 2012 to 2021.
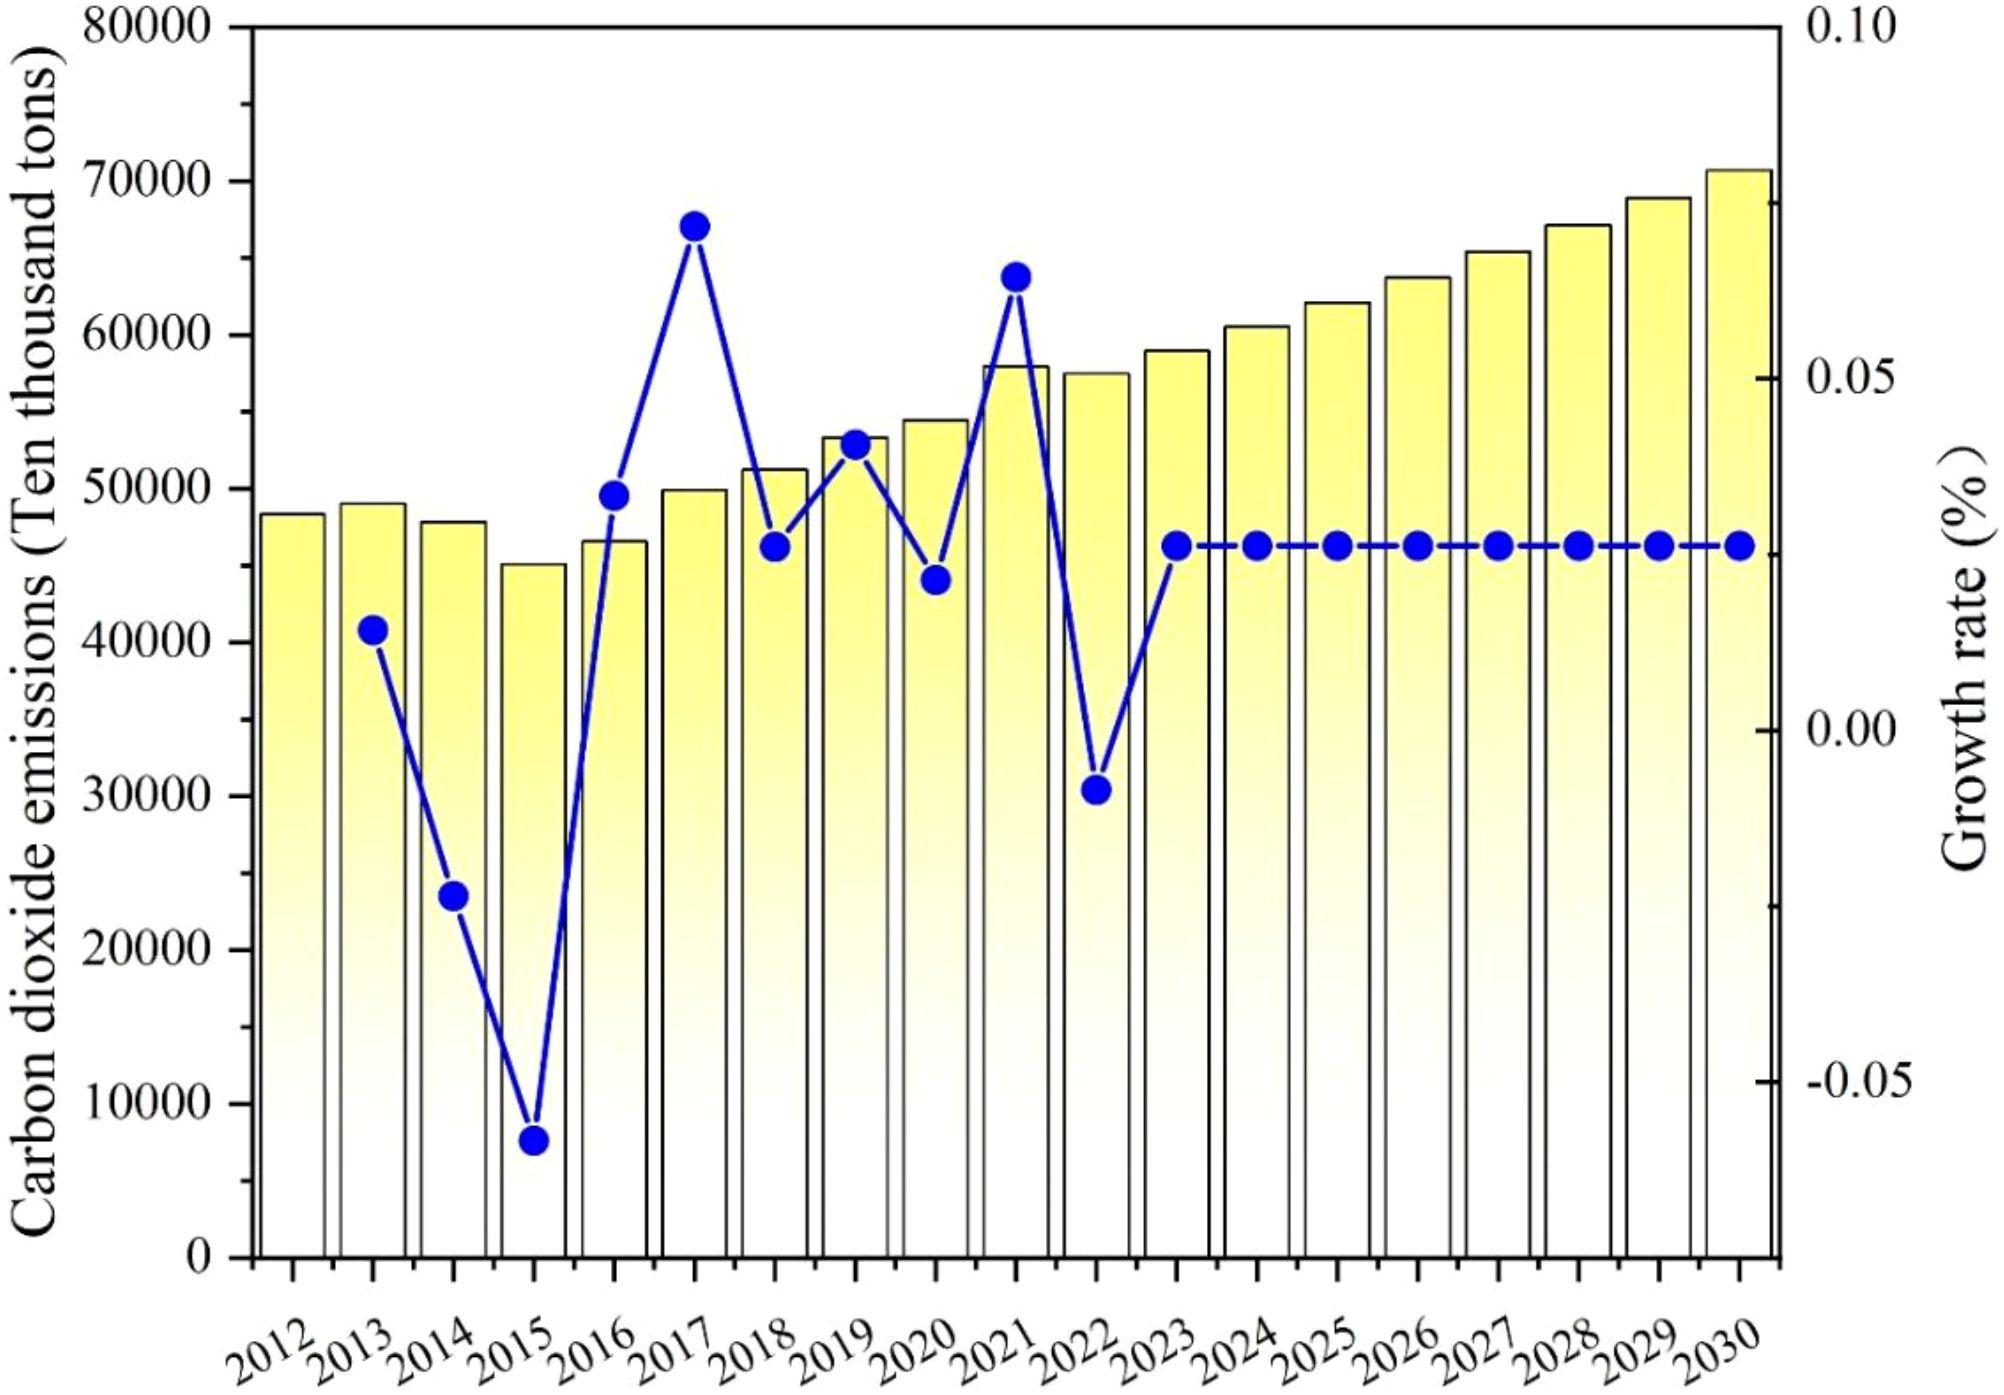
Figure 9. Carbon emissions and the growth rate of Shanxi Province from 2012 to 2030.
3.7 Analysis of forecast results of carbon dioxide emissions in Shaanxi Province
According to Table 9 and Figure 10, the overall carbon dioxide emissions in Shaanxi Province exhibited a fluctuating trend between 2012 and 2021. Emissions increased prior to 2014, followed by a marked decline. However, emissions have risen again since 2017 and reached a peak of 339842500 tons in 2021, with a growth rate of 6.44%. This growth may be related to economic recovery, industrial production recovery, and increased energy demand. The predicted data shows that the emissions of carbon dioxide in Shaanxi are expected to increase year by year from 2022. Although the growth rate may gradually stabilize, emissions are projected to reach 377.57603 tons by 2030. These projections indicate that Shaanxi faces significant challenges in achieving its 2030 carbon peak target. The reason is that significant carbon emissions coincide with economic expansion, and Shaanxi still promotes economic growth through high carbon emissions. Shaanxi is one of the largest energy-consuming provinces in China, characterized by a concentration of traditional industries with high energy demand and significant carbon emissions, such as coal and chemical industries. During the period of economic recovery, the growth of industrial production and the rise in energy demand further contributed to the increase in carbon emissions. Resulting in neglecting environmental protection and goals for reducing emissions. In the future, Shaanxi should utilize its own advantages to develop renewable energy, improve technology in high energy-consuming industries, and reduce energy consumption per unit product. At the same time, Shaanxi should implement a green ecological strategy to boost the tertiary industry’s development and service economy.

Table 9. Carbon emissions of Shaanxi Province from 2012 to 2021.
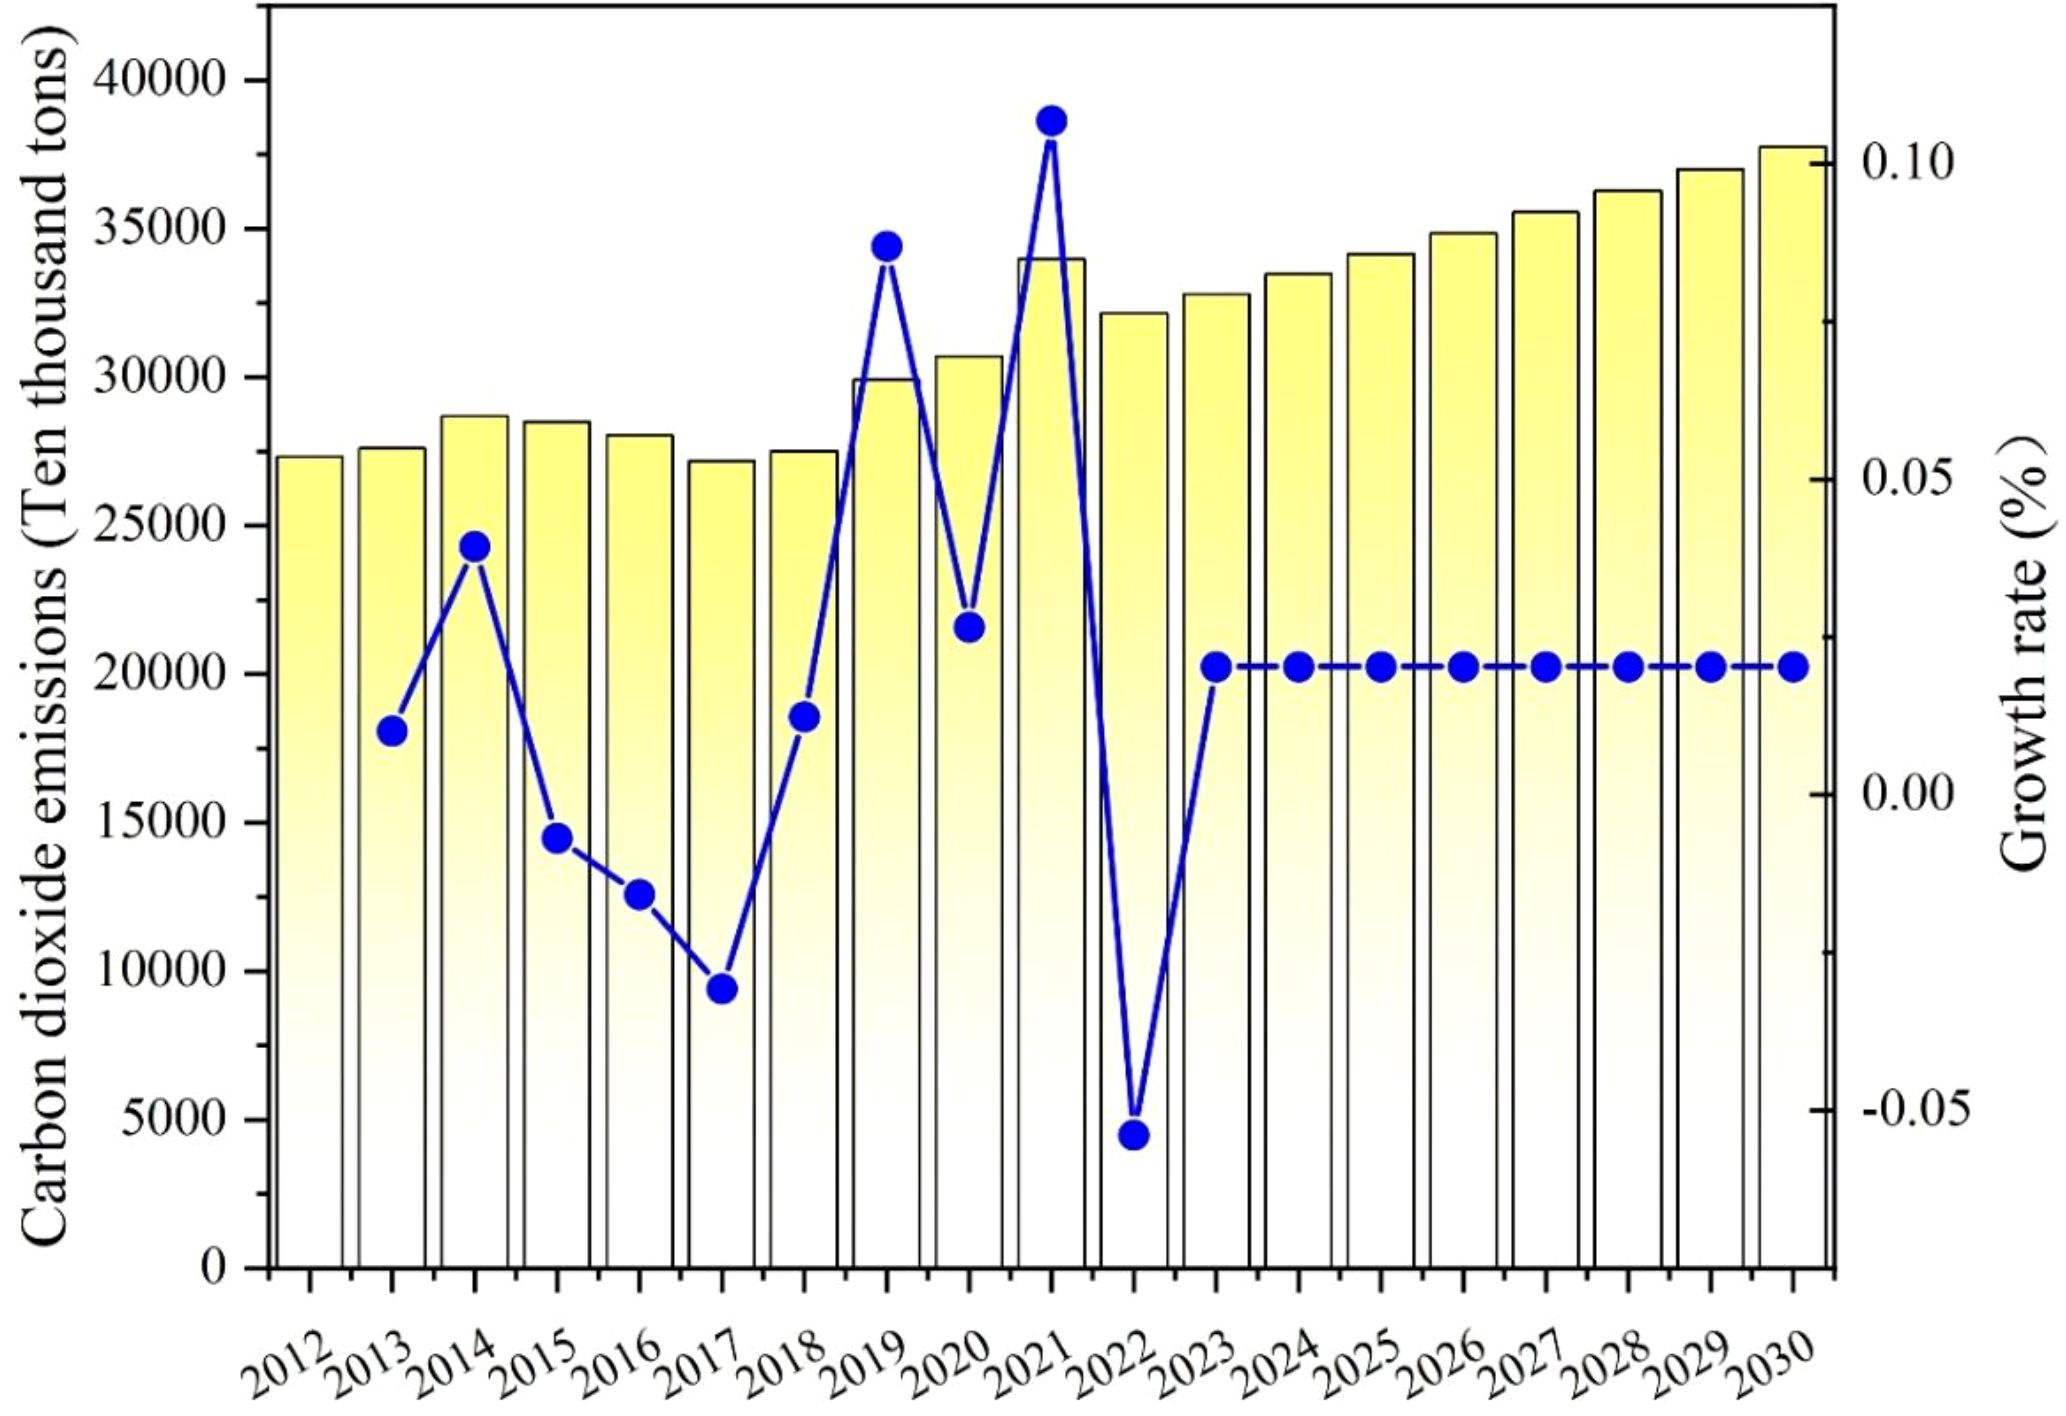
Figure 10. Carbon emissions and the growth rate of Shaanxi Province from 2012 to 2030.
3.8 Analysis of forecast results of carbon dioxide emissions in Henan Province
According to Table 10 and Figure 11, the overall emissions of carbon dioxide in Henan Province have shown a fluctuating downward trend. In 2014, carbon emissions reached their peak for the first time at 551311400 tons, with a 3.40% growth rate. In the following years, the overall emissions showed a slow downward trend. Since 2020, emissions have increased and reached a secondary peak of 504.7431 million tons in 2021. Despite fluctuations, emissions have shown an overall downward trend from 2014 to 2021, with a decrease of 8.45%. During this period, the industrial structure of Henan Province gradually shifted towards low energy consumption and high added value, reducing dependence on traditional high-energy-consuming industries. Vigorously develop the service industry and high-tech industries and reduce industrial emissions. Forecast data shows that carbon emissions will slowly decrease from 2022 and are anticipated to decrease to 427.834 million tons by 2030. This indicates that Henan Province has achieved significant results in controlling carbon dioxide emissions and is expected to achieve the goal of a carbon peak by 2030. This is due to the Henan government’s adoption of multiple policy measures to control carbon dioxide emissions. Strengthen the development of low-carbon and environmentally friendly industrial demonstration parks, and promote green, low-carbon, zero-carbon, and negative-carbon demonstration technologies. Incorporate carbon emissions quotas into clean production audits and establish a sound carbon emissions management system. Meanwhile, Henan Province is expanding forest coverage, widely using eco-friendly building materials, and promoting new energy vehicles. These measures greatly reduce carbon dioxide emissions, making significant contributions to the worldwide response to climate change in addition to aiding in the achievement of carbon peak objectives.
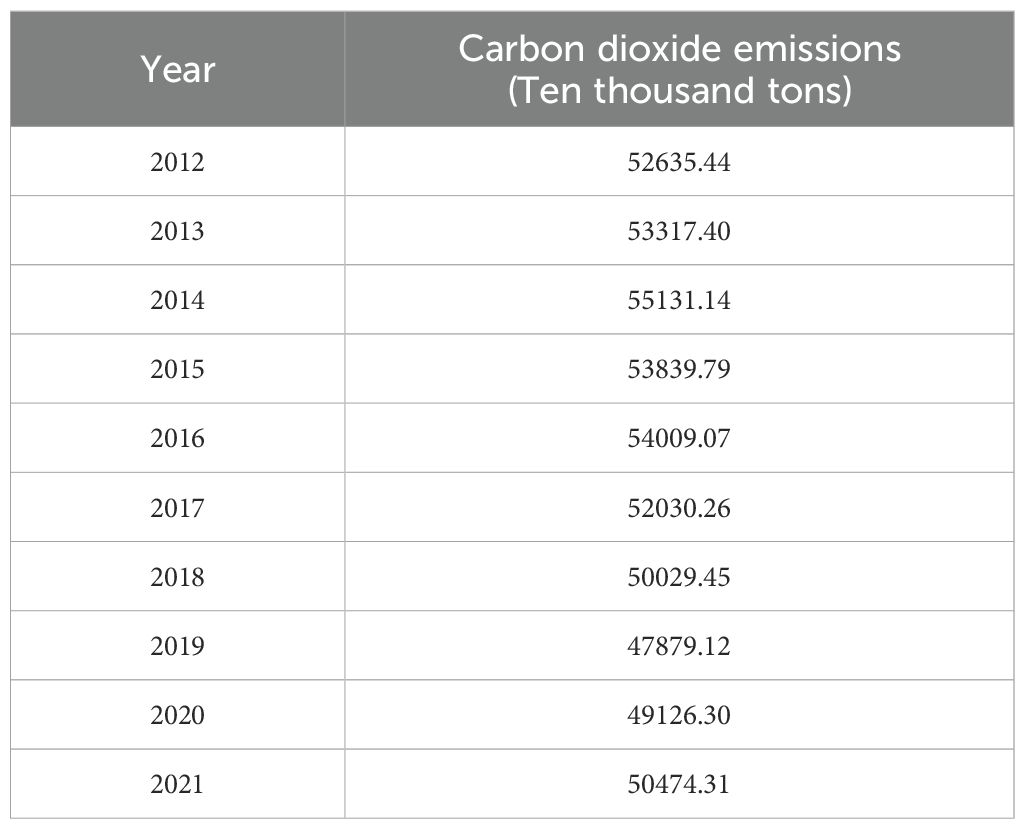
Table 10. Carbon emissions of Henan Province from 2012 to 2021.
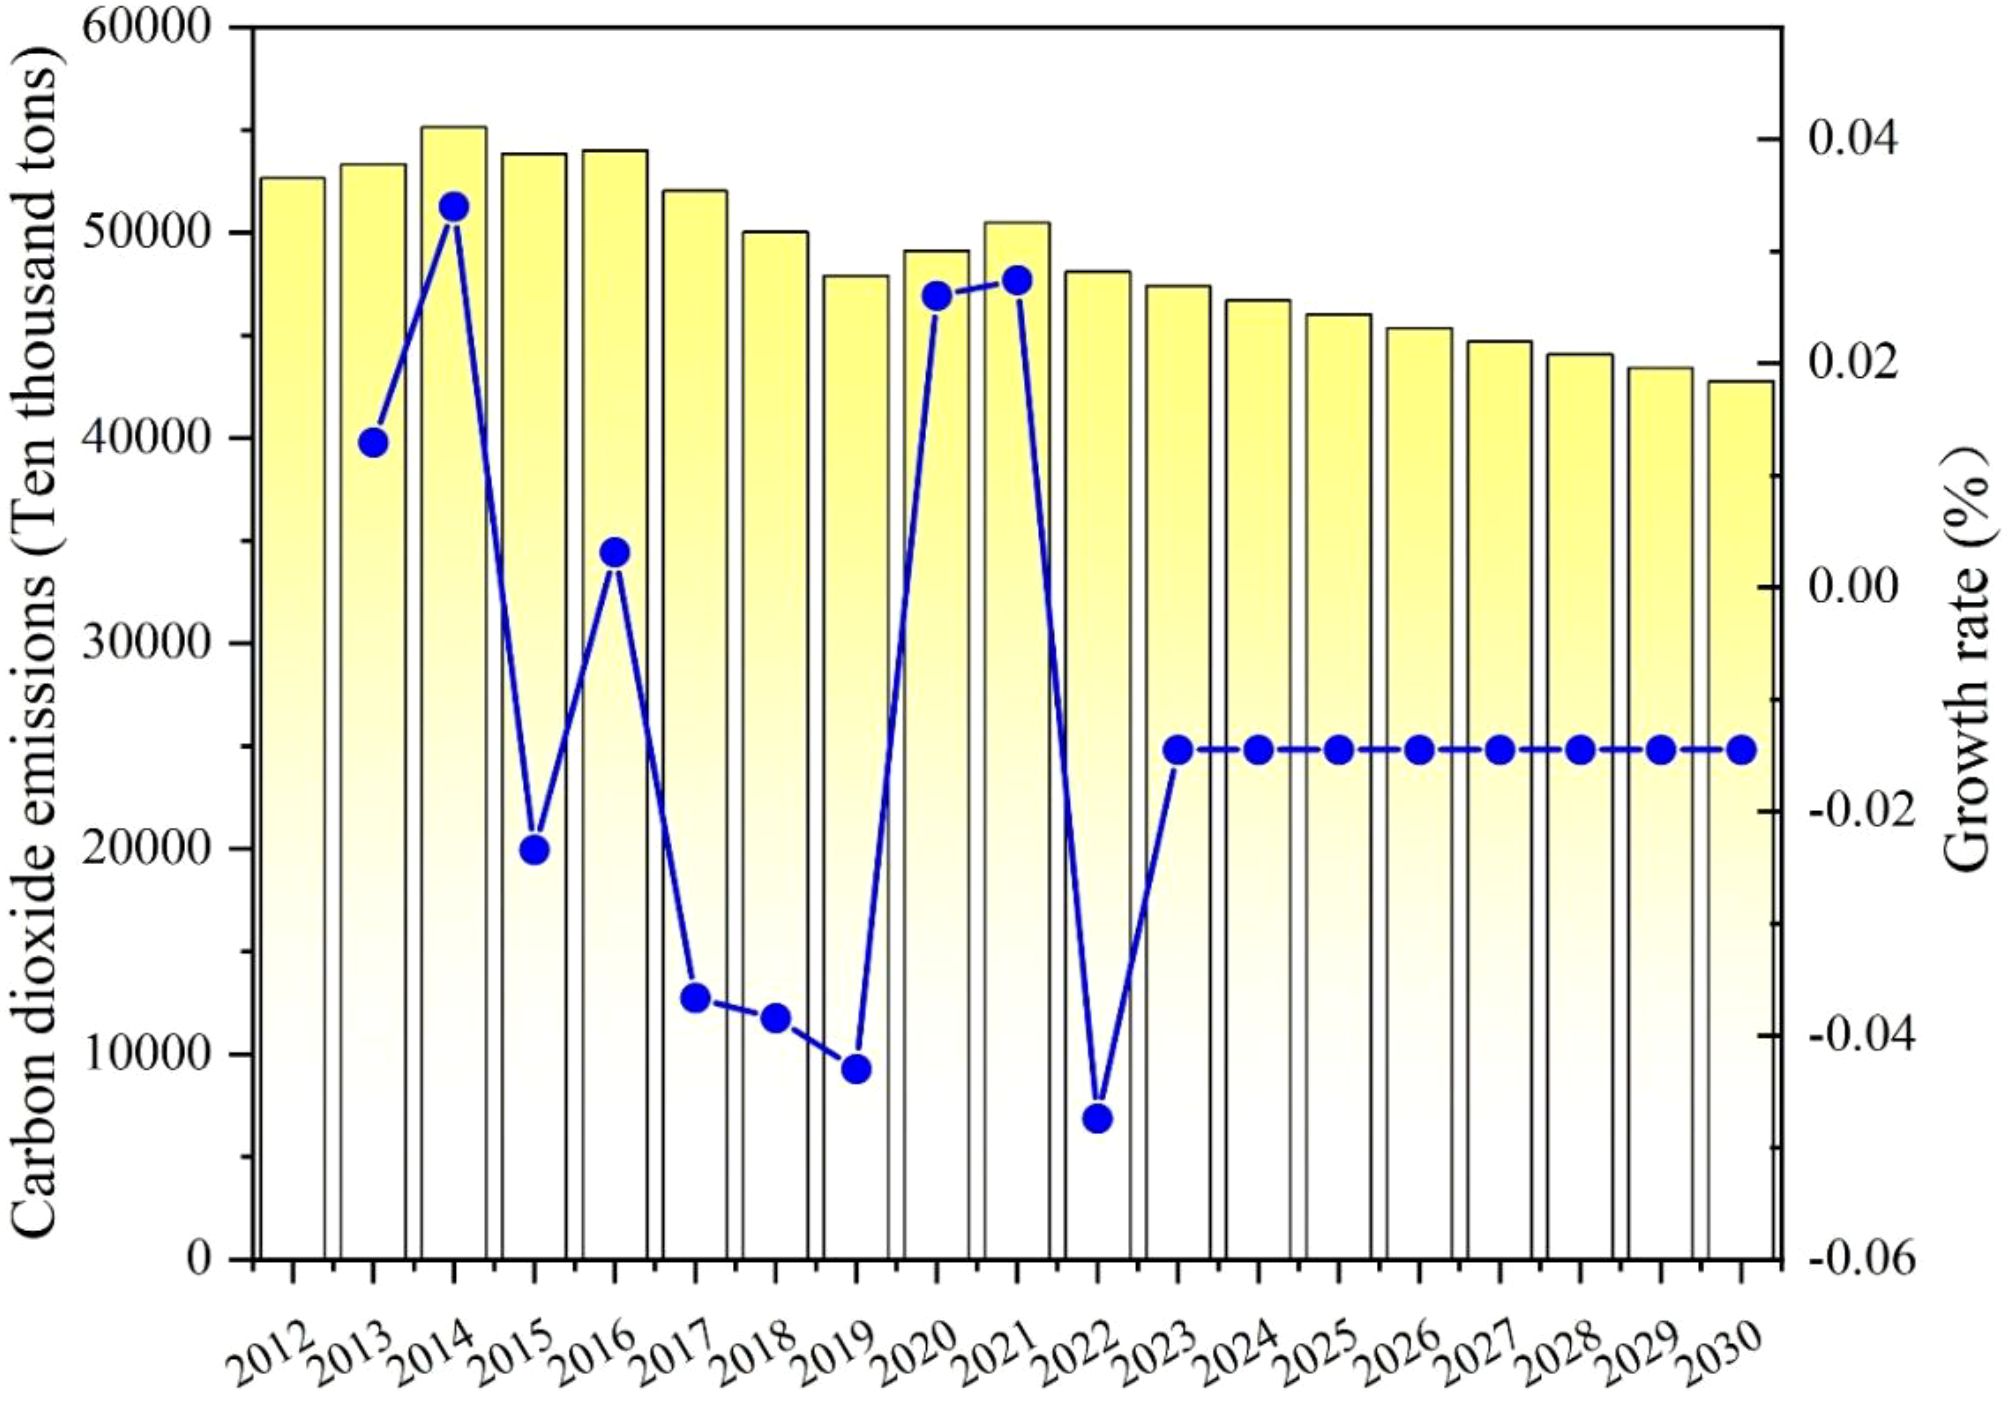
Figure 11. Carbon emissions and the growth rate of Henan Province from 2012 to 2030.
3.9 Analysis of forecast results of carbon dioxide emissions in Shandong Province
According to Table 11 and Figure 12, the total amount of carbon dioxide released in Shandong Province has shown a fluctuating upward trend. The emissions reached its peak in 2019, reaching 1045.2894 million tons. After 2019, emissions have decreased, indicating that emission reduction measures may achieve certain results, or economic activity may slow down. However, since 2021, emissions have risen again, indicating the need for more sustained and effective measures to control growth. Forecast data shows that from 2022 onwards, emissions are expected to increase annually. Although the growth rate tends to be stable, it is a positive growth. Although Shandong Province has made progress in carbon reduction, achieving the 2030 carbon peak target still faces challenges. Emissions of carbon dioxide are expected to reach 1.3331071 million tons by 2030. This suggests that in order to curb the rise in carbon emissions, Shandong Province must implement stricter policies. As a major economic province in China, Shandong relies heavily on fossil fuels—particularly coal—to support its industrial activities, leading to a steady increase in carbon dioxide emissions. As the economy develops, energy consumption escalates, complicating pollution control efforts. Inefficient energy utilization and an irrational industrial framework also affect the ecosystem of Shandong Province. In the future, Shandong Province should strictly regulate key high energy-consuming industries and implement stricter energy conservation and emission reduction standards. Increase funding for technical research and development, and advocate for the implementation of sustainable and low-carbon technologies, including energy storage and carbon capture and storage technologies. At the same time, advocate for new energy vehicles, increase the proportion of energy used from renewable sources, and facilitate low-carbon growth in areas and urbanization.
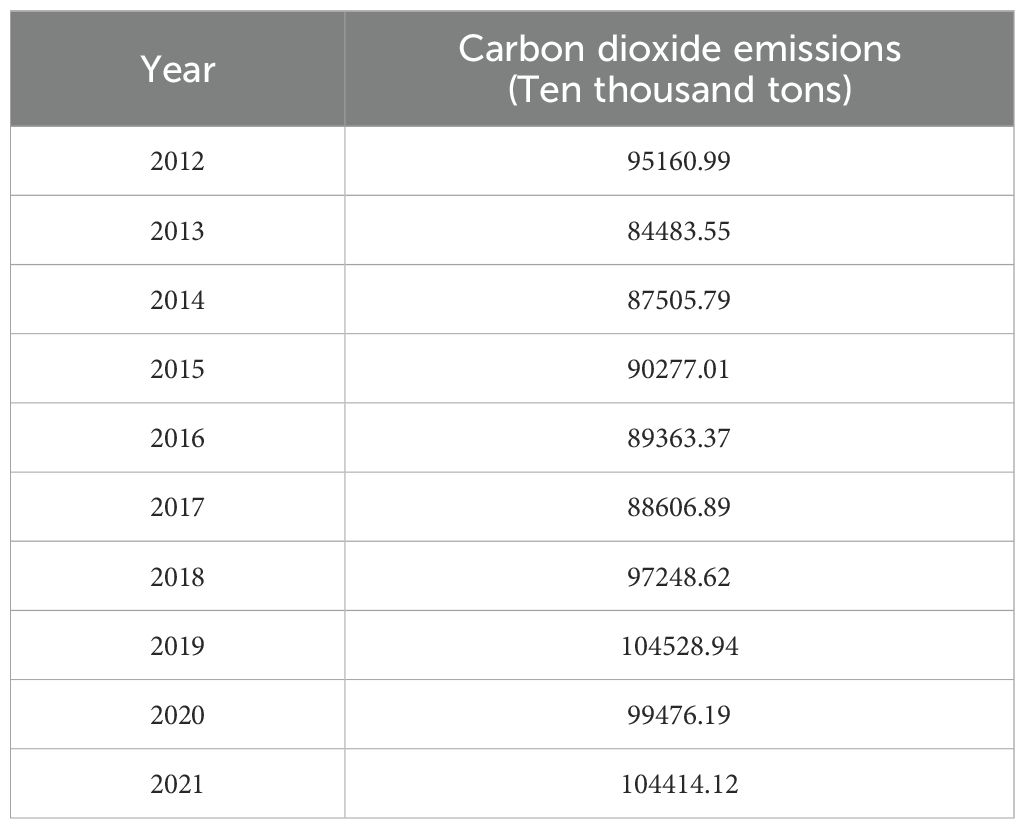
Table 11. Carbon emissions of Shandong Province from 2012 to 2021.
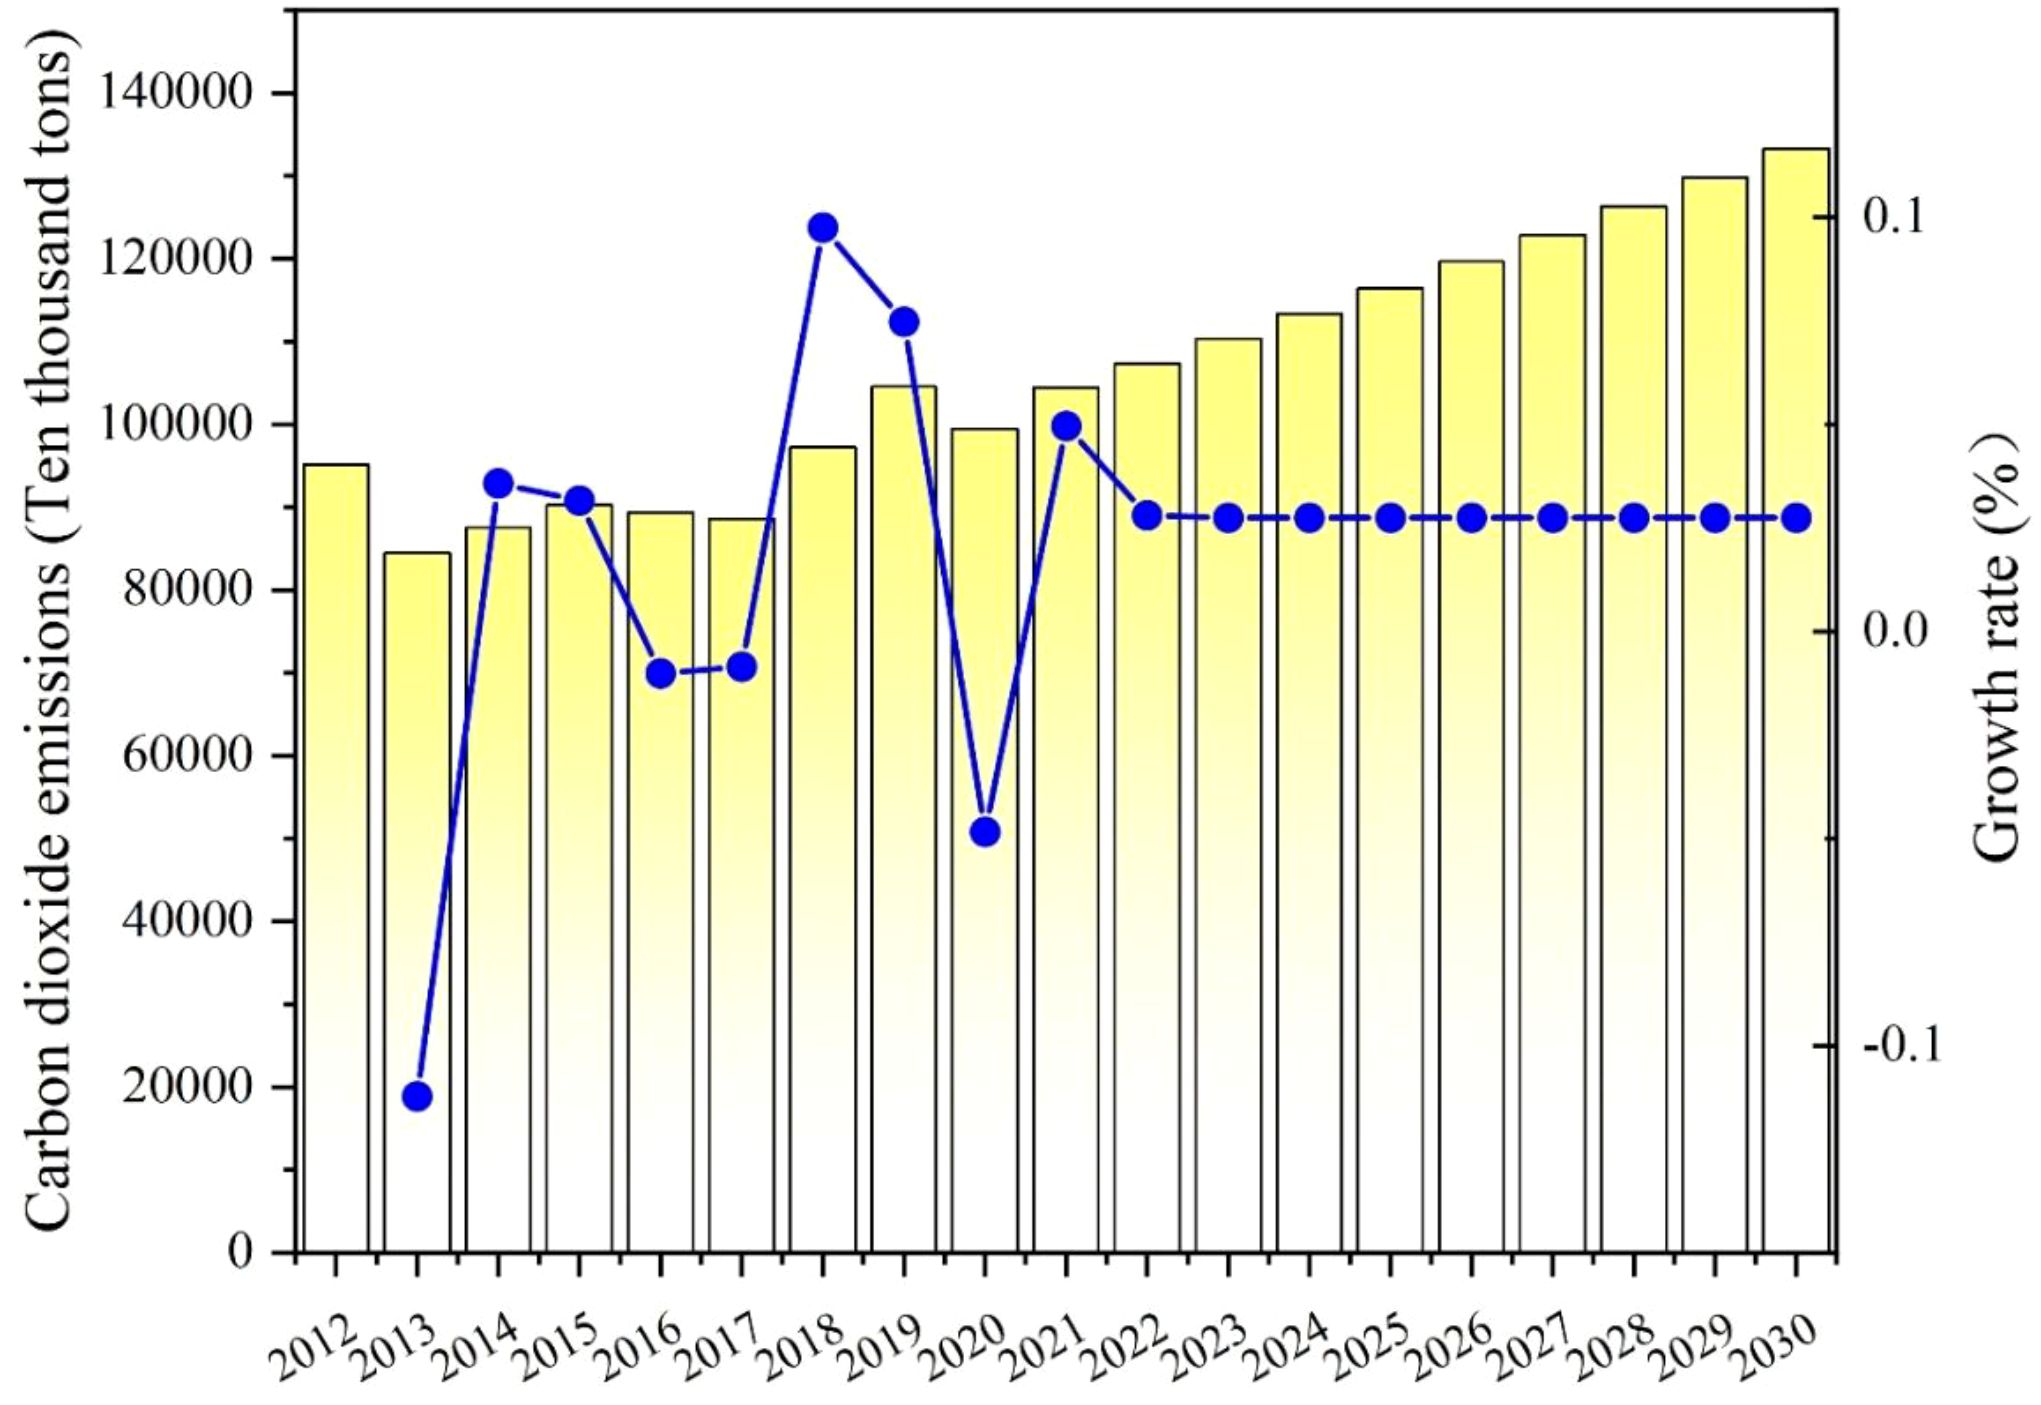
Figure 12. Carbon emissions and the growth rate of Shandong Province from 2012 to 2030.
4 Discussion
Compared with existing research, the contribution of this study mainly lies in the following aspects: firstly, in terms of methodology, the UNGM (1,1) model reconstructs the background value by introducing the integral mean value theorem, overcoming the bias problem of traditional grey models in parameter estimation and background value calculation, and significantly improving the prediction accuracy. Compared with models such as DGM (1,1), FGM (1,1), and CGM (1,1), UNGM (1,1) exhibits lower MAPE and more stable MAE curves in both fitting and prediction stages (Figures 2, 3), especially when dealing with nonlinear and non-homogeneous data. UNGM (1,1) exhibits stronger applicability and robustness in regional level carbon emission prediction.
Secondly, at the empirical level, this study systematically evaluated the carbon peak potential of nine provinces and regions in the Yellow River Basin for the first time, filling the gap in existing research that mostly focuses on the national or eastern regions and ignores internal differences within the basin. For example, although Yang et al. predicted the carbon intensity in western China, they did not refine it to the provincial level (Yang et al., 2024). Feng et al. paid attention to the fairness of carbon emissions at the city level, but did not involve the prediction of peak time (Feng et al., 2025). The provincial differentiation analysis of this study indicates that clean energy endowment (such as Qinghai and Sichuan), industrial structure optimization (such as Henan), and policy implementation are key factors affecting peak emissions. This is consistent with Huang’s conclusion that promoting renewable energy can effectively reduce carbon emissions (Huang, 2024), but also suggests that we need to pay attention to the tension between economic growth and emission reduction targets (such as Gansu and Ningxia).
Thirdly, the results of this study have been discussed with international research, emphasizing the importance of regional synergy and policy customization. For example, IPCC reports have repeatedly pointed out that developing countries need to develop differentiated emission reduction pathways based on regional characteristics. This study found that the main reasons for the failure of the six provinces in the Yellow River basin to reach the peak include fossil energy dependence (such as Shanxi and Inner Mongolia), heavy industry structure (such as Shaanxi) and infrastructure investment in western development (such as Ningxia). These findings echo Sun’s analysis of the driving factors of carbon emissions in the “the Belt and Road” countries (Sun et al., 2021), but highlight the structural challenges faced by China’s inland provinces in the process of transformation.
5 Conclusion
Researching the Yellow River Basin’s carbon emissions is crucial to promoting regional green transformation and achieving the dual-carbon goal. Its high-energy-consuming industries are concentrated, and the ecology is fragile. Accurate emission reduction can help coordinate the high-quality development of the economy and ecological protection. According to the characteristics of carbon emission data in nine provinces in the Yellow River Basin, a new unbiased grey model was selected. This model introduces the theorem of the integral median, which improves the shortcomings of traditional models in background values and modeling mechanisms. Subsequently, we employed the novel unbiased grey prediction model to analyze and forecast the carbon emissions of nine provinces in the Yellow River Basin from 2012 to 2030, and to assess their potential to reach a carbon peak before 2030.
Based on an analysis of carbon emission data from 9 provinces within the Yellow River Basin, it was found that Qinghai, Sichuan, and Henan provinces can achieve a carbon peak before 2030. In contrast, Gansu, Ningxia, Inner Mongolia, Shanxi, Shaanxi, and Shandong provinces cannot achieve a carbon peak before 2030. Qinghai achieved its carbon peak in 2016, and the growth rate of the total carbon emission rebounded in 2021 also increased significantly, but the total volume was steadily declining, and the growth rate was steadily decreasing. Sichuan achieved carbon peak in 2013. Despite temporary rebounds observed in 2019, 2021, and 2025, the overall trend remained downward, and the carbon emission growth rate has shown a consistent decline since 2027. Henan achieved a carbon peak in 2014 and experienced a modest increase between 2019 and 2021, but the peak remained below the 2014 level. Since 2022, Henan Province’s carbon emissions have been in the decline range. The common characteristics of Qinghai, Sichuan, and Henan provinces in the Yellow River Basin are: clean energy advantages: Qinghai accounts for over 90% of clean energy, while Sichuan’s hydropower resources account for 26% of the total; Industrial structure optimization: The proportion of high energy consuming industries in Henan has decreased from 38% to 28%; Strong policy implementation: For example, Sichuan promotes real-time monitoring of carbon emissions from key enterprises. Gansu cannot achieve a carbon peak in 2030. Gansu Province saw a small peak in 2018 and 2021. However, since 2022, its emissions have exhibited a continuous upward trend, surpassing the earlier peak levels. Given this sustained increase, the province is unlikely to achieve peak carbon emissions before 2030. Similarly, Ningxia’s carbon emissions peaked in 2017, Inner Mongolia in 2018 and 2022, Shanxi in 2017 and 2021, Shaanxi in 2019 and 2021, and Shandong in 2018, but then began to grow again and continued to grow after exceeding the historical peak, so the six provinces failed to attain carbon peak by 2030. The six provinces that have not yet reached their peak are dependent on fossil fuels: Shanxi/Inner Mongolia accounts for over 76% of coal consumption; The contradiction between economic growth and emission reduction: Ningxia’s short-term push up of emissions due to infrastructure investment in the western development; Transition lag: Inner Mongolia has a high proportion of heavy industry and slow replacement of clean energy. Predictions indicate that provinces that have not yet reached their peak will face significant pressure to reduce emissions before 2030, and there is a need to strengthen industrial upgrading and regional coordination mechanisms.
By analyzing and predicting carbon emissions in nine provinces of the Yellow River Basin, it is possible to understand regional emission trends even with limited data. This helps identify provinces with high emissions and fast growth rates, and provides a scientific basis for making targeted emission reduction policies, improving resource allocation, and supporting the precise achievement of dual-carbon goals. Provinces that are on track to meet their emission targets should maintain consistent policies, continue to advance emission reduction efforts, and prevent a rebound in the total carbon emissions. Based on the above findings, we propose the following specific policy recommendations: for provinces that have reached their peak (Qinghai, Henan, Sichuan), we should consolidate existing achievements and prevent a rebound in carbon emissions. Suggestion: (1) Establish a carbon emission warning mechanism to monitor the emissions of key enterprises in real time (such as the practices already implemented in Sichuan); (2) Further expand the proportion of clean energy and explore integrated projects of wind, solar, and water storage; (3) Incorporate carbon emission quota management into local regulations and promote the construction of carbon neutrality demonstration zones. For provinces that have not yet reached their peak (Gansu, Ningxia, Inner Mongolia, Shanxi, Shaanxi, Shandong): more radical structural reforms and technological interventions are needed: (1) strict restrictions on access to high energy consuming industries, accelerating the green transformation of industries such as steel and building materials; (2) Pilot coal electricity and renewable energy coupling projects in coal dependent provinces such as Inner Mongolia and Shanxi, gradually reducing the proportion of coal consumption; (3) Innovate green financial tools, such as launching provincial carbon quota pledge loans, green bonds, etc., to enhance economic incentives for emission reduction; (4) Incorporate the goal of reducing carbon emission intensity into the local government assessment system and strengthen policy implementation. Basin collaboration mechanism: It is recommended to establish a Yellow River Basin carbon emission trading alliance, promote inter provincial carbon emission quota adjustment and ecological compensation mechanisms, and achieve the minimization of emission reduction costs and maximization of benefits within the basin.
5.1 Limitations of the research and future research directions
Although this study accurately predicted carbon emissions in the Yellow River Basin using the UNGM (1,1) model, there are still several limitations. (1) The model’s extrapolation based on historical data assumes that future trends remain continuous, but fails to fully incorporate the impact of external shocks such as sudden policy interventions, technological breakthroughs, or extreme weather events, such as mandatory emission reduction policies under the “dual carbon” target or a sharp drop in renewable energy costs that may significantly alter emission trajectories. (2) The provincial carbon emission data used in the study lacks finer grained data support, such as at the city or industry level, which may prevent the discovery of differences and structural emission characteristics within the province.
Future research can be deepened in the following areas: (1) introducing dynamic scenario analysis or mixed modeling methods to quantify the marginal impact of policy interventions and technological progress on carbon emissions; (2) Integrating multiple sources of data (such as nighttime lighting, electricity consumption, traffic flow) to enhance data dimensionality and timeliness; (3) Conduct cross provincial comparative research to identify potential opportunities and mechanism designs for regional collaborative emission reduction.
Data availability statement
Publicly available datasets were analyzed in this study. This data can be found here: https://www.ipe.org.cn/index.html.
Author contributions
WG: Conceptualization, Data curation, Formal Analysis, Funding acquisition, Investigation, Methodology, Project administration, Resources, Software, Supervision, Validation, Visualization, Writing – original draft, Writing – review & editing.
Funding
The author(s) declare that financial support was received for the research and/or publication of this article. This research was funded by the Soft Science Project of the Science and Technology Department of Henan Province (Grant No: 232400410354).
Conflict of interest
The author declares that the research was conducted in the absence of any commercial or financial relationships that could be construed as a potential conflict of interest.
Generative AI statement
The author(s) declare that no Generative AI was used in the creation of this manuscript.
Any alternative text (alt text) provided alongside figures in this article has been generated by Frontiers with the support of artificial intelligence and reasonable efforts have been made to ensure accuracy, including review by the authors wherever possible. If you identify any issues, please contact us.
Publisher’s note
All claims expressed in this article are solely those of the authors and do not necessarily represent those of their affiliated organizations, or those of the publisher, the editors and the reviewers. Any product that may be evaluated in this article, or claim that may be made by its manufacturer, is not guaranteed or endorsed by the publisher.
References
Amin A., Yusoff N. Y. B. M., Peng S., Işık C., Ullah A., and Akbar M. (2024). The influence of energy transition, and natural resources on carbon emissions in China: an augmented ARDL application. Environment Dev. Sustainability. 1–19. doi: 10.1007/s10668-023-04398-0
Cai K. and Wu L. (2024). Grey prediction of carbon emission and carbon peak in several develo** countries. Eng. Appl. Artif. Intell. 133, 108210. doi: 10.1016/j.engappai.2024.108210
Ceylan Z. (2019). Short-term prediction of COVID-19 spread using grey rolling model optimized by particle swarm optimization. Appl. soft computing. 109, 107592. doi: 10.1016/j.asoc.2021.107592, PMID: 34121965
Chen Y. H., He K. J., and Zhang C. (2016). A novel grey wave forecasting method for predicting metal prices. Resour. Policy. 49, 323–331. doi: 10.1016/j.resourpol.2016.06.012
Chen X. L., Meng Q. G., Shi J. N., Liu Y. F., Sun J., and Shen W. (2022). Regional differences and convergence of carbon emissions intensity in cities along the Yellow River Basin in China. Land. 11, 1042. doi: 10.3390/land11071042
Deng J. L. (1982). Control problems of grey systems. Syst. control letters. 1, 288–294. doi: 10.1016/S0167-6911(82)80025-X
Ding S. and Zhang H. H. (2023). Forecasting Chinese provincial CO2 emissions: A universal and robust new-information-based grey model. Energy Econ. 121, 106685. doi: 10.1016/j.eneco.2023.106685
Feng T., Wang X., Wang N., Ma J., Chen Z., Tu Q., et al. (2025). Do low-carbon city pilots promote carbon equality? From the perspective of regional fairness. Struct. Change Economic Dynamics 74, 1–13. doi: 10.1016/j.strueco.2025.02.017
Gu H. (2024). Forecasting carbon dioxide emission regional difference in China by damping fractional grey model. Fractal Fractional. 8, 597. doi: 10.3390/fractalfract8100597
Hou J. C., Wan M. H., and Song M. L. (2024). Carbon emission inequality and fairness from energy consumption by prefecture-level cities in China. Ecol. Indicators. 158, 111364. doi: 10.1016/j.ecolind.2023.111364
Hsu L. C. (2003). Applying the grey prediction model to the global integrated circuit industry. Technol. forecasting Soc. change. 70, 563–574. doi: 10.1016/S0040-1625(02)00195-6
Huang X. (2024). The multidimensional relationship between renewable energy deployment and carbon dioxide emissions in high-income nations. NPJ Climate Action 3, 107. doi: 10.1038/s44168-024-00191-5
Huo T. F., Xu L. B., Feng W., Cai W. G., and Liu B. S. (2021). Dynamic scenario simulations of carbon emission peak in China’s city-scale urban residential building sector through 2050. Energy Policy. 159, 112612. doi: 10.1016/j.enpol.2021.112612
Jiang J., Ban Y., and Nong S. (2025). Novel disctete grey Bernoulli seasonal model with a time powter term for predicting monthly carbon dioxide emissions in the United States. Front. Environ. Sci 12. doi: 10.3389/fenvs.2024.1513387
Jiang L., Zuo Q. T., Ma J. X., and Zhang Z. Z. (2021). Evaluation and prediction of the level of high-quality development: A case study of the Yellow River Basin, China. Ecol. Indicators. 129, 107994. doi: 10.1016/j.ecolind.2021.107994
Kabir M., Habiba U. E., Khan W., Shah A., Rahim S., Patricio R., et al. (2023). Climate change due to increasing concentration of carbon dioxide and its impacts on environment in 21st century; a mini review. J. King Saud University-Science. 35, 102693. doi: 10.1016/j.jksus.2023.102693
Karakurt I. and Aydin G. (2023). Development of regression models to forecast the CO2 emissions from fossil fuels in the BRICS and MINT countries. Energy. 263, 125650. doi: 10.1016/j.energy.2022.125650
Karimi T. and Yahyazade Y. (2022). Developing a risk assessment model for banking software development projects based on rough-grey set theory. Grey Systems: Theory Application. 12, 574–594. doi: 10.1108/GS-05-2021-0074
Kaufman D. S. and Broadman E. (2023). Revisiting the Holocene global temperature conundrum. Nature. 614, 425–435. doi: 10.1038/s41586-022-05536-w, PMID: 36792734
Li L. S. and Luo D. (2024). Damping accumulated discrete MGM (1, m) power model and its application to forecasting agricultural output value share and employment share. Grey Systems: Theory Application. 14, 396–413. doi: 10.1108/GS-11-2023-0112
Li H., Wu Z. X., Yuan X., Yang Y. X., He X. Q., and Duan H. M. (2022). The research on modeling and application of dynamic grey forecasting model based on energy price-energy consumption-economic growth. Energy. 257, 124801. doi: 10.1016/j.energy.2022.124801
Luo J., Zhuo W. Y., Liu S. Y., and Xu B. F. (2024). The optimization of carbon emission prediction in low carbon energy economy under big data. IEEE Access. 12, 14690–14702. doi: 10.1109/ACCESS.2024.3351468
Oreggioni G. D., Ferraio F. M., Crippa M., Muntean M., Schaaf E., Guizzardi D., et al. (2021). Climate change in a changing world: Socio-economic and technological transitions, regulatory frameworks and trends on global greenhouse gas emissions from EDGAR v. 5.0. Global Environ. Change. 70, 102350. doi: 10.1016/j.gloenvcha.2021.102350
Shaheen A., Sheng J., Arshad S., Muhammad H., and Salam S. (2025). Forecasting the determinants of environmental degradation: a gray modeling approach. Energy Sources Part A: Recovery Utilization Environ. Effects 47, 1084–1104. doi: 10.1080/15567036.2020.1827090
Sun L., Cui H., and Ge Q. (2021). Driving factors and future prediction of carbon emissions in the ‘belt and road initiative’countries. Energies 14, 5455. doi: 10.3390/en14175455
Sun W. and Huang C. C. (2022). Predictions of carbon emission intensity based on factor analysis and an improved extreme learning machine from the perspective of carbon emission efficiency. J. Cleaner Production. 338, 130414. doi: 10.1016/j.jclepro.2022.130414
Wang L., Li Z., Xu Z. J., Yue X., Yang L. Q., Wang R. J., et al. (2024). Carbon emission scenario simulation and policy regulation in resource-based provinces based on system dynamics modeling. J. Cleaner Production. 460, 142619. doi: 10.1016/j.jclepro.2024.142619
Wang Y. L., Wang W., Chen Y., and Wu L. F. (2024). Projection of ecological water consumption under carbon emission in Chinese provinces. J. Cleaner Production. 448, 141630. doi: 10.1016/j.jclepro.2024.141630
Wang M., Wang W., and Wu L. F. (2022a). Application of a new grey multivariate forecasting model in the forecasting of energy consumption in 7 regions of China. Energy. 243, 123024. doi: 10.1016/j.energy.2021.123024
Wang M., Wu L. F., and Guo X. R. (2022b). Application of grey model in influencing factors analysis and trend prediction of carbon emission in Shanxi Province. Environ. Monit. Assessment. 194, 542. doi: 10.1007/s10661-022-10088-7, PMID: 35771294
Wang H. P. and Zhang Z. (2022). Forecasting Chinese provincial carbon emissions using a novel grey prediction model considering spatial correlation. Expert Syst. Applications. 209, 118261. doi: 10.1016/j.eswa.2022.118261
Wang B., Zhao J., Dong K. Y., and Jiang Q. Z. (2022). High-quality energy development in China: comprehensive assessment and its impact on CO2 emissions. Energy Econ 110, 106027. doi: 10.1016/j.eneco.2022.106027
Xu N., Wang T. Y., and Qin Q. H. (2024). Novel grey forecasting model with bi-level structure for application to logistic demand. Expert Syst. Applications. 235, 121181. doi: 10.1016/j.eswa.2023.121181
Yang Z., Gao W. J., Han Q., Qi L. Y., Cui Y. J., and Chen Y. Q. (2022). Digitalization and carbon emissions: how does digital city con-struction affect China’s carbon emission reduction? Sustain. cities society. 87, 104201. doi: 10.1016/j.scs.2022.104201
Yang M. C., Wang L., and Hu H. (2024). Analysis of factors influencing the spatial and temporal variability of carbon intensity in western China. Sustainability. 16, 3364. doi: 10.3390/su16083364
Ye L., Du P., and Wang S. B. (2024). Industrial carbon emission forecasting considering external factors based on linear and machine learning models. J. Cleaner Production. 434, 140010. doi: 10.1016/j.jclepro.2023.140010
Ye L., Yang D. L., Dang Y. G., and Wang J. J. (2022). An enhanced multivariable dynamic time-delay discrete grey forecasting model for predicting China’s carbon emissions. Energy. 249, 123681. doi: 10.1016/j.energy.2022.123681
Zhang X., Dang Y. G., Ding S., and Wang J. J. (2023). A novel discrete multivariable grey model with spatial proximity effects for economic output forecast. Appl. Math. Modelling. 2 115, 431–452. doi: 10.1016/j.apm.2022.10.041
Zhang Y. Q., Li L., Sadiq M., and Chien F. S. (2024). The impact of non-renewable energy production and energy usage on carbon emissions: evidence from China. Energy Environment. 35, 2248–2269. doi: 10.1177/0958305X221150432
Zhang J., Liu Y., Liu C. C., Guo S., and Cui J. F. (2023). Study on the spatial and temporal evolution of high-quality development in nine provinces of the Yellow River Basin. Sustainability. 15, 6975. doi: 10.3390/su15086975
Zhao W. (2022). China’s goal of achieving carbon neutrality before 2060: experts explain how. Natl. Sci Review. 9, nwac115. doi: 10.1093/nsr/nwac115, PMID: 35992237
Keywords: Yellow River Basin, carbon emissions, carbon peak, grey mode, UNGM(1,1)
Citation: Guo W (2025) A study on carbon emissions in the Yellow River Basin of China based on an unbiased prediction model. Front. Ecol. Evol. 13:1674626. doi: 10.3389/fevo.2025.1674626
Received: 28 July 2025; Accepted: 23 September 2025;
Published: 07 October 2025.
Edited by:
Dan Long, Hefei University of Technology, ChinaReviewed by:
Xiaochun Chen, Beijing Wuzi University, ChinaXuesong Gu, Beijing Forestry University, China
Copyright © 2025 Guo. This is an open-access article distributed under the terms of the Creative Commons Attribution License (CC BY). The use, distribution or reproduction in other forums is permitted, provided the original author(s) and the copyright owner(s) are credited and that the original publication in this journal is cited, in accordance with accepted academic practice. No use, distribution or reproduction is permitted which does not comply with these terms.
*Correspondence: Weidong Guo, ZHNobWlseUBsaXQuZWR1LmNu