 Ljubica Vlaović1
 Clarisse Lemonnier2
 Benjamin Alric2,3
 Frédéric Rimet2,3
 Miloš Ćirić4Srđan Miletić4Željka Milovanović4Vladimir Petrović4
 Danijela Vidaković4*
- 1Faculty of Biology, Institute of Botany and Botanical Garden “Jevremovac”, University of Belgrade, Belgrade, Serbia
- 2Université Savoie-Mont Blanc, INRAE, CARRTEL, Thonon-les-Bains, France
- 3Pôle R&D ECLA, INRAE, Thonon-les-Bains, France
- 4Institute of Chemistry, Technology and Metallurgy, National Institute of the Republic of Serbia, University of Belgrade, Belgrade, Serbia
Introduction: Diatoms are among the most widely used indicators for assessing ecological conditions in aquatic habitats, yet traditional microscopy remains time-consuming and taxonomically demanding. This study explores the potential of rbcL-based DNA metabarcoding as an alternative or complement to morphological analysis for monitoring both freshwater and saline lakes.
Methods: We investigated diatom assemblages in two artificial freshwater lakes and two inland saline lakes in Serbia by comparing species composition, diversity, and ecological index performance across both methods.
Results and discussion: A total of 227 taxa were detected by metabarcoding and 212 by microscopy, with both approaches consistently showing higher richness and Shannon diversity in freshwater than in saline lakes. Redundancy analysis revealed conductivity and salinity as the main drivers of community structure, clearly separating freshwater from saline systems, while co-inertia analysis demonstrated strong agreement between the two methods. In freshwater lakes, diatom index values derived from microscopy and metabarcoding showed partial to good agreement, with IPS and IBD emerging as the most consistent and reliable indices across methods. The DISP and TBI indices, initially developed for soda lakes, were applied here for the first time using metabarcoding data. However, their application was limited by incomplete reference databases, missing trait assignments, and lower taxonomic coverage, reducing the reliability of index-based evaluations in these habitats. Overall, while metabarcoding demonstrated strong potential --particularly in freshwater systems --a combined morphological and molecular approach offers a more comprehensive and reliable assessment across complex environments like inland saline lakes. This study contributes new sequence data to open-access diat.barcode databases, supporting the wider adoption of DNA-based tools in aquatic biomonitoring.
1 Introduction
Diatoms (Bacillariophyta) are silica-shelled algae and a highly diverse group of microalgae (Falkowski et al., 2004). They are responsible for nearly 45% of global primary production and play a significant role in global biomass production and biogeochemical processes (Benoiston et al., 2017), and ecosystem dynamics (e.g., by influencing trophic interactions (Armbrust, 2009). Owing to their ecological importance, they play a key role in freshwater ecosystems and are among the most widely used bioindicators in lake monitoring and ecological assessment (Smol and Stoermer, 2010). Due to their well-defined tolerances and preferences for a wide range of ecological conditions (pH, conductivity, nutrients, oxygen, and trophic state), their rapid response to environmental changes and sensitivity to anthropogenic pressures (Battarbee et al., 2001; Lobo et al., 2016; Kelly et al., 2008), diatoms are recognized as a key biological compartment under the Water Framework Directive (European Commission, 2000).
As part of routine biomonitoring under legislations such as the EU Water Framework Directive (WFD), diatom-based indices are used to determine ecological quality classes, which are then used to assess the ecological status of freshwater bodies (Kelly et al., 2014). These indices rely on the relative abundances of indicator species in the community along with their ecological preferences (sensitivities or tolerances), offering a robust approach to water quality monitoring (Blanco, 2024). Routine biomonitoring faces two major challenges: the time required for implementation and the insufficient taxonomic expertise to accurately identify species within this diverse group (Vidaković et al., 2024). In recent years, molecular techniques, including DNA metabarcoding, have emerged as powerful tools to overcome these challenges, complement or potentially replace traditional microscopy-based analyses (Keck et al., 2017). By amplifying and sequencing standardized regions of environmental DNA (eDNA), metabarcoding enables the rapid and high-throughput identification of diatom communities, often increasing taxonomic resolution and reducing operator bias (Zimmermann et al., 2015). Also, DNA metabarcoding enables the detection of numerous taxa that have traditionally remained overlooked due to their fragility, rarity, or the difficulty of identifying them using classical methods, such as microscopy. In this way, it serves as a valuable complement to conventional approaches, while also encouraging more in-depth taxonomic research aimed at achieving a more accurate understanding of diatom diversity and distribution in natural environments (Piredda et al., 2018). However, DNA metabarcoding is facing challenges such as the need for methodology harmonization to achieve consistency and define best practices (Leese et al., 2016) and the need for curated reference libraries of barcodes (Keck et al., 2023). In spite of some challenges, integrating metabarcoding into routine biomonitoring holds promise for improving the accuracy, efficiency, and scalability of ecological assessments in freshwater systems.
Metabarcoding of diatoms has increasingly been applied in lake ecosystems to enhance ecological assessments and gain greater insight into diatom diversity. For example, Rivera et al. (2018) compared microscopy and DNA metabarcoding in the ecological assessment of Lake Bourget and reported notable discrepancies between methods. These differences were mainly driven by inconsistencies in species-level floristic inventories, primarily resulting from the incompleteness of the DNA reference library. Kutty et al. (2022) tested the same methods in tropical lakes and reservoirs, while Duleba et al. (2021) tested on Hungarian lotic and soda pan habitats. Both studies showed that the correspondence between the two approaches was relatively weak at the species level, but it improved significantly in the case of morphologically dominant taxa and at the genus level. On the other hand, Rimet et al. (2018) compared different diversity indices using microscopy and molecular approaches in alpine lakes. The molecular approach revealed higher alpha diversity than microscopy, likely due to its ability to detect cryptic and rare taxa. In contrast, beta diversity was lower with the molecular approach, possibly reflecting the detection of very rare species and extracellular DNA. Despite these differences, diversity indices from both methods were well correlated, supporting the use of the new approach as a reliable alternative for diatom diversity assessment.
Serbia hosts a variety of natural (freshwater and saline) and artificial (reservoirs) lakes that play an important role in regional biodiversity, water supply, and recreation (Blagojević et al., 2020). Freshwater natural lakes are scarce, such as Lake Palić and Lake Ludaš. However, saline lakes are more numerous and also restricted in the Pannonian Plain region in the north of the country. These shallow, temporary, or semi-permanent water bodies are of significant ecological interest due to their unique physicochemical conditions and specialized halophilic biota (Gavrilović et al., 2018). Diatoms, in particular, have been shown to form specialized communities in these environments, with the presence of halotolerant and halophilic species that serve as valuable indicators of salinity gradients and hydrological regimes (e.g., Vidaković et al., 2019, 2022, 2023; Ćirić et al., 2021). In addition to natural lakes, artificial reservoirs play a crucial role in Serbia’s freshwater network. To date, more than 150 have been established, particularly in central and western parts of the country (Marković et al., 2023). These lakes are created primarily for water supply, hydropower production, irrigation, and flood control. Some studies have begun to address the importance of using diatom-based indices for assessing trophic status and water quality in artificial lakes, such as Sava Lake (Trbojević et al., 2021) and Vrutci Reservoir (Trbojević et al., 2019a). These water bodies are subject to various anthropogenic pressures, including eutrophication, hydromorphological alterations, and pollution from agriculture and urbanization (Karadžić et al., 2010; Vidović et al., 2015; Jakovljević et al., 2025).
Although phytobenthos holds a formal role in ecological assessment, according to data provided by Poikane et al. (2016), it is currently applied as an independent metric in lake monitoring by only 10 out of 28 EU Member States. Phytobenthos play a crucial role in the functioning of shallow lakes and the littoral zones of deeper lakes—an aspect that may be overlooked without suitable assessment frameworks (Cantonati and Lowe, 2014). In many instances, benthic algal production can match or even exceed that of phytoplankton, and it is also proven that compared to other biological groups, benthic diatoms often exhibit greater sensitivity to environmental changes and provide more precise (low-error) responses (Poikane et al., 2016). However, the application of DNA-based tools enables us to characterize biological communities further and enhance bioassessment efforts, ultimately improving our understanding of long-term changes. To advance and validate the effectiveness of diatom DNA metabarcoding for lake bioassessment, it is essential to apply and test existing indices—commonly used in routine biomonitoring—across a wide range of lake types.
By applying morphological and rbcL-based DNA metabarcoding methods, this study aimed 1) to show comparable patterns in the response of diatom communities to environmental variables in both freshwater and saline lakes, 2) to investigate the extent to which these two methods yield similar community structure characteristics, including diversity and species richness, 3) to contribute new sequence data to open-access diat.barcode databases, (4) to test indices developed for soda lakes (DISP and TBI), for the first time using metabarcoding data, and 5) to determine whether ecological status assessment based on diatom indices provides consistent results across the two approaches. Based on these aims, two hypotheses are set: (1) The metabarcoding approach will detect higher diatom taxon richness and diversity than traditional morphological identification, especially in extreme environments such as saline lakes, and (2) Metabarcoding is more reliable in assessing freshwater lakes’ water quality than saline.
2 Materials and methods
2.1 Study area and sampling
In this study, we examined four distinct aquatic ecosystems, comprising two saline and two freshwater lakes (Figure 1). Both saline lakes are located in the Vojvodina Province of northern Serbia. Pečena Slatina (PS) is a shallow, semi-static saline lake that functions as a closed hydrological system, receiving water primarily through surface runoff, direct precipitation, and occasionally from various groundwater sources, including deep-seated upwellings, which is generally characteristic of saline lakes in the Pannonian region (Vidaković et al., 2019). The lake measures 1.4 km in length and has an average width of 190 m. Its maximum depth, recorded during field sampling, is 1.2 m, and the total surface area is approximately 0.26 km². The second saline lake, Plava Banja (PB), originated as a clay extraction pit. Following the cessation of mining activities, the site was transformed into a recreational lake. Due to elevated concentrations of sulfates and chlorides, swimming has been officially restricted for the past 15 years (Trbojević et al., 2019b). Plava Banja measures approximately 290 m x 290 m, with a maximum depth of 7 m and a surface area of around 0.07 km². The two freshwater lakes included in the study are artificial reservoirs located in the central part of Serbia. Sava Lake (SL) is an artificial urban reservoir formed approximately five decades ago by damming a former arm of the Sava River. The lake stretches 4.4 km in length, with an average width of 210 m. The maximum recorded depth is 12 m, with an average depth of 4.5 m. Its total volume is approximately 4.1 million cubic meters, covering a surface area of around 0.90 km². Markovačko Lake (ML) was created by damming a stream near the village of Markovac. The lake is primarily used for irrigation and local recreation. The lake is approximately 0.9 km in length, with an average width of 190 m, and covers a total surface area of about 0.17 km². During sampling, the recorded maximum depth was 8 m.
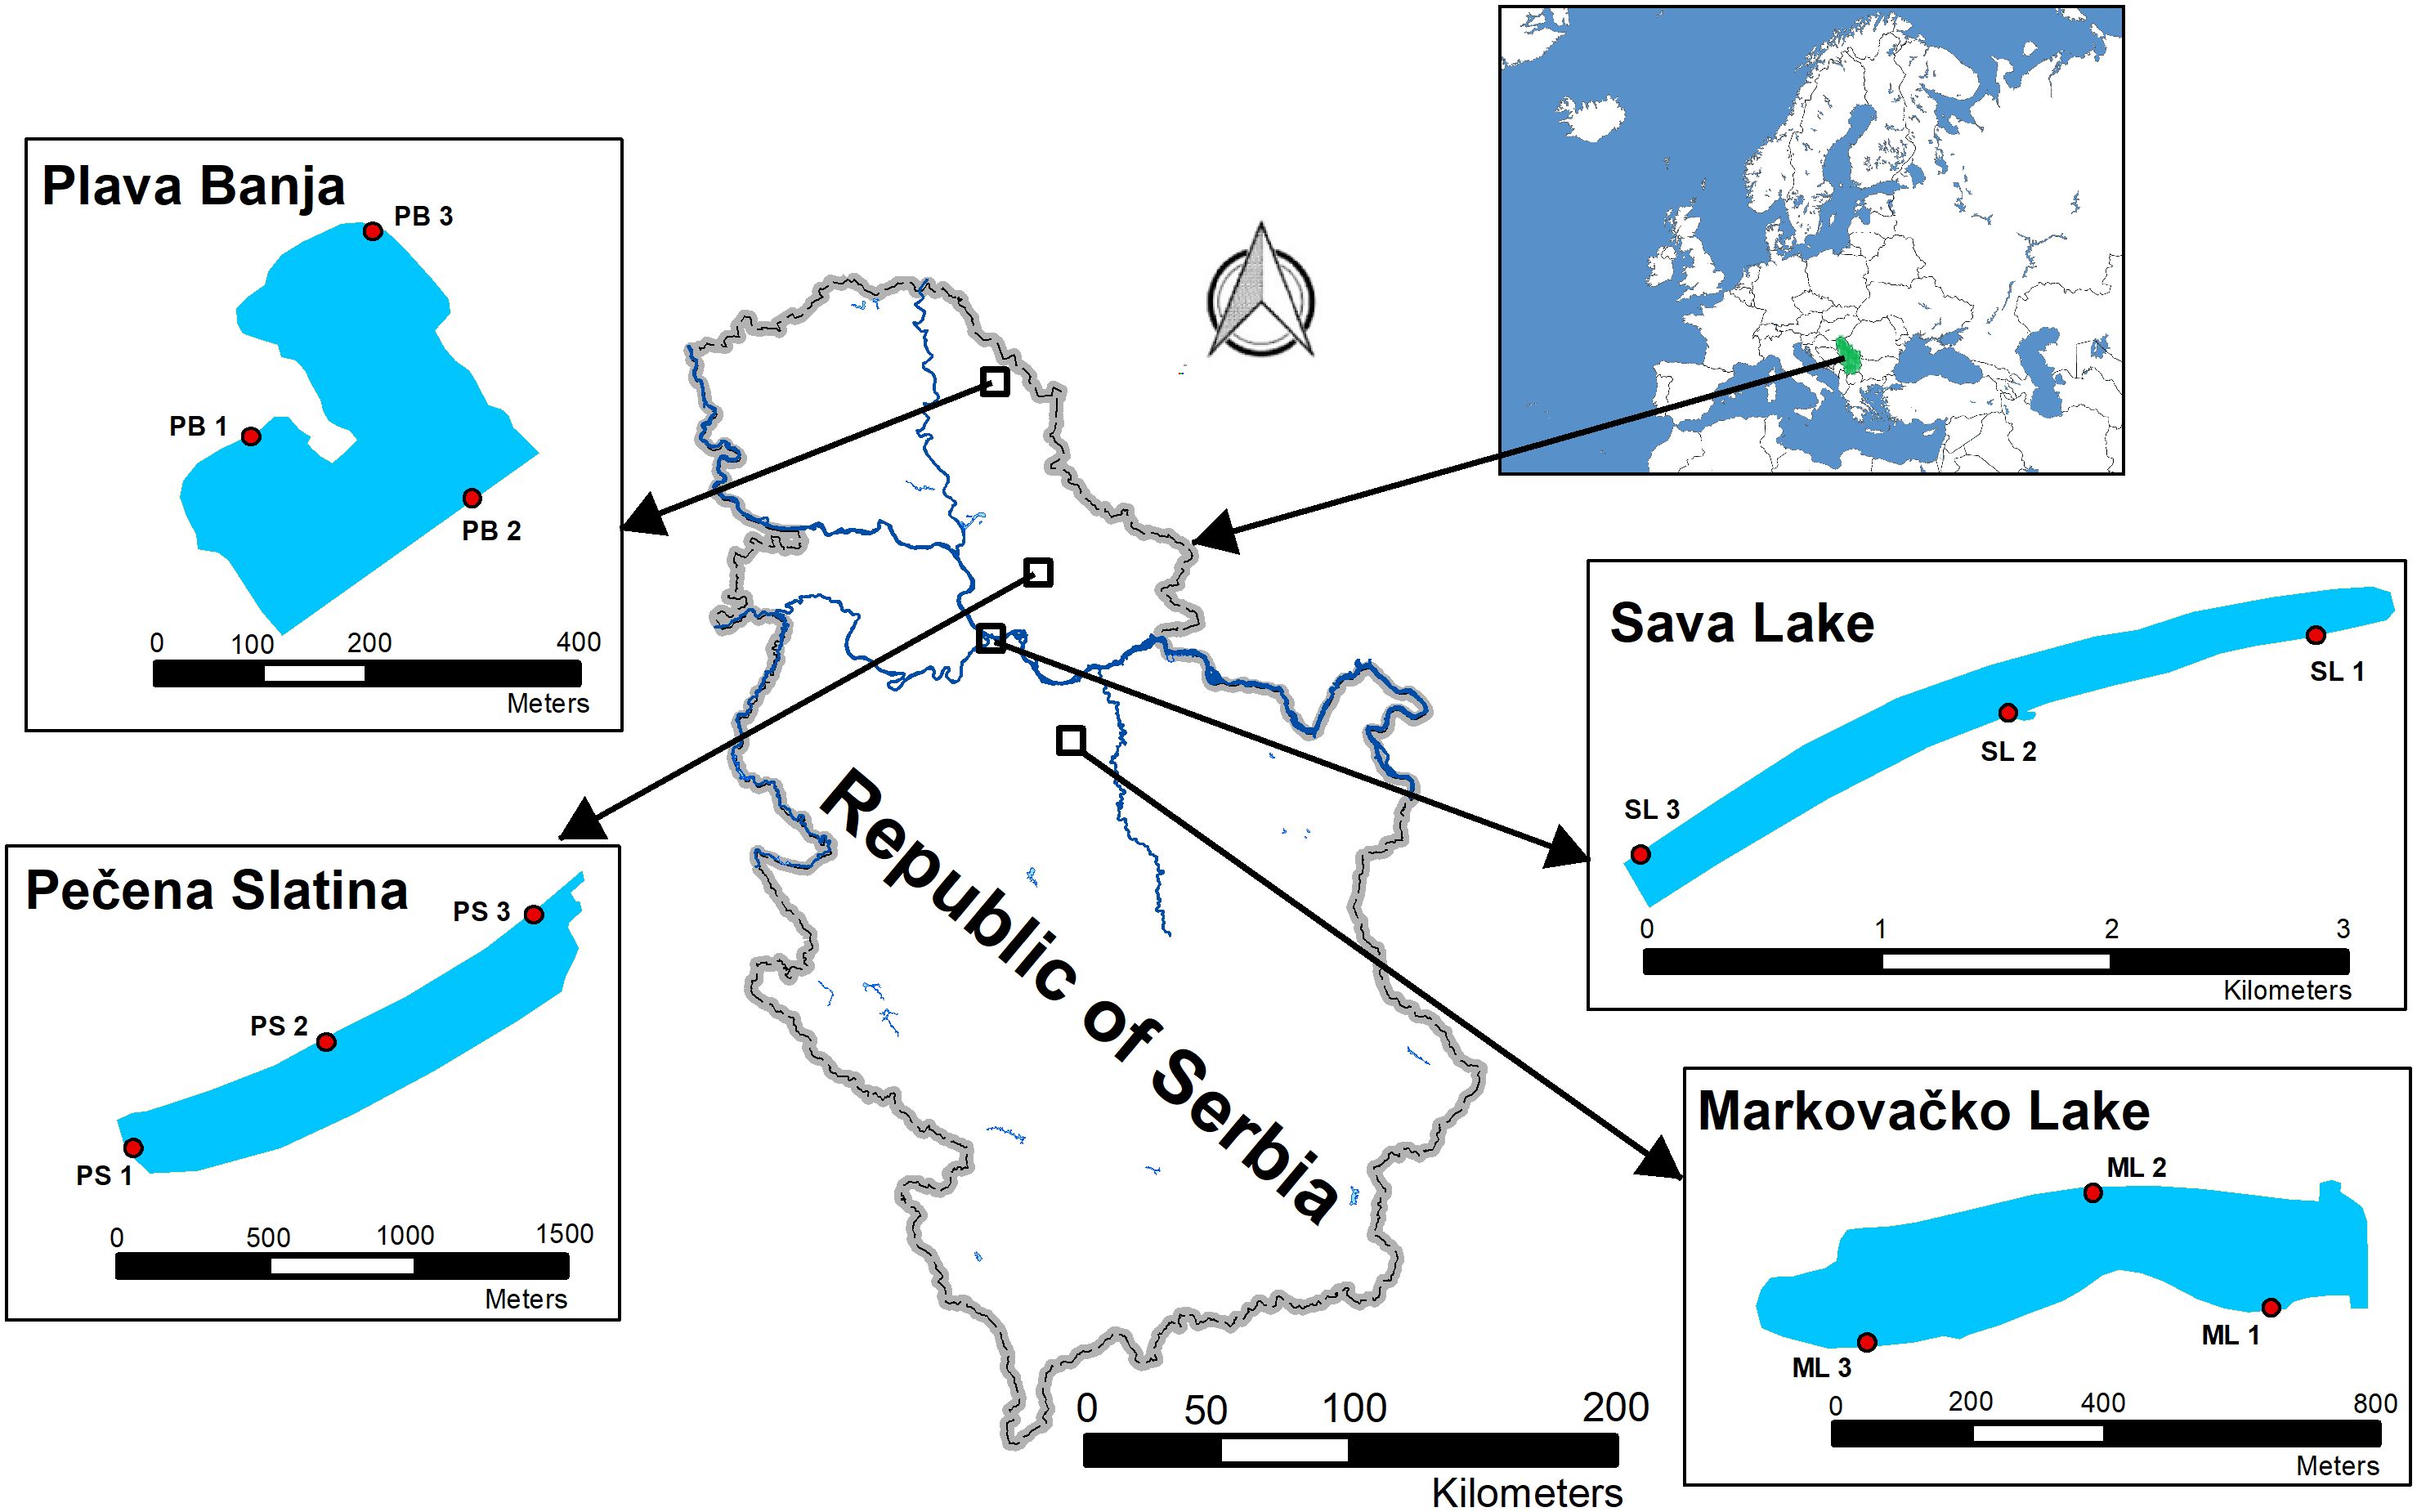
Figure 1. Map of the Republic of Serbia with the position of investigated lakes and sampling sites.
To cover the vegetation season sampling was conducted once in each of the following periods in 2023: spring, summer, and autumn. Samples for physical and chemical analysis of water and morphological and metabarcoding analysis were taken from 3 sites per lake (in total 36 samples for physical and chemical analysis). Depending on the lake bed, diatom samples were collected from mud, reed, artificial break, and/or stone. In Pečena Slatina, mud and reed were available, while in Plava Banja, reed was available in all sites, except in one site where an artificial break was also present. In Sava Lake, the substrate was stone, and in Markovačko Lake, mud and/or reed. More details about the substrate at each site were provided in the Supplementary Table 2. In total, 54 diatom samples were collected. Following homogenization, each sample was divided into two subsamples (54 for morphological analysis and 54 for molecular analysis). For morphological analysis, the subsample was preserved with formaldehyde to achieve a final concentration of 4%. For DNA analysis, 15 mL of the sample was transferred into a sterile 50 mL plastic centrifuge tube and filled with absolute ethanol to a final volume of 45 mL. DNA subsamples were stored at 4 °C until further processing (Vidaković et al., 2024).
2.2 Morphological analysis
The first step in obtaining permanent slides was to remove impurities from the diatom valves using hot, concentrated HCl and a supersaturated KMnO4 solution, as outlined by Taylor et al. (2007). The next step was mounting cleaned diatom valves using Naphrax (Brunel Microscopes Ltd). Observations of the permanent slides (1000× magnification) were performed using a Zeiss AxioImager M.1 light microscope fitted with differential interference contrast (DIC) optics, and images were processed and analyzed using AxioVision 4.9 software. Identification of taxa was carried out using different literature sources (e.g. Lange-Bertalot, 2001; Lange-Bertalot et al., 2017). A total of 400 diatom valves was counted on each permanent slide to quantify the relative abundance of taxa.
2.3 Metabarcoding analysis (DNA extraction, PCR amplification and NGS sequencing)
DNA was extracted from diatom samples using the Nucleospin Soil Kit (Macherey-Nagel) protocol and quantified using a NanoDrop™ 1000 Spectrophotometer (Thermo Fisher Scientific).
PCR amplification was performed on the rbcL plastid gene, targeting a 312 bp barcode with the combination of three different forward and two different reverse primer sequences (Vasselon et al., 2017a). All primers were diluted to a 10 mM concentration and combined to an equimolar mix. PCR amplification was done according to the workflow described in Diatom DNA library preparation for Illumina Miseq Sequencing using the rbcL marker gene (https://www.protocols.io/view/diatom-dna-library-preparation-for-illumina-miseq-kqdg3573zv25/v1.) According to protocol, 2-step PCR was performed. The first one (PR1) was specifically to amplify the rbcL fragment from the DNA sample, and the second one (PCR2) was carried out by the sequencing platform to amplicon library preparation for Illumina sequencing. To do so, our primers contain half of Illumina adapters P5 and P7 at the 5’ end of the forward and reverse primers, respectively (5’CTTTCCCTACACGACGCTCTTCCGATCT and 5’GGAGTTCAGACGTGTGCTCTTCCGATCT). These adapters will serve as primers for fixation in the PCR2. For each sample, the PCR1 amplification was performed in triplicate in a final volume of 25µL. PCR1 mix was consisted to 0.75U KAPA HiFi HotStart Ready Mix (Roche Molecular Systems, Inc), 2.5 μL reaction buffer 10X, 2 μL dNTP 2.5 mM, 1.25 μL of 10 mg/ml BSA, 1.25 μL of each primer, 0.15 μL TaKaRa LA Taq polymerase and 25 ng of template DNA. The amplification process, with slight modifications in cycle length, consisted of 33 cycles under the following conditions: initial denaturation at 95°C for 6 minutes, annealing at 54°C for 1 minute, and extension at 72°C for 6 minutes. After verification of the quality of PCR triplicates with gel electrophoresis on a 0.8% agarose gel, triplicates were pooled and a 50 μL aliquot was sent to a sequencing platform (GetPlage Toulouse, France, https://get.genotoul.fr) where amplicon library preparation was performed with PCR2 prior to sequencing on an Illumina MiSeq with the v3 reagent kit (2x250 bp).
2.4 Sequence data processing
To describe the diatom diversity, the demultiplexed and trimmed reads were analyzed using the DADA2 pipeline (Callahan et al., 2016) to generate amplicon sequence variants (ASVs). Taxonomic assignment of the resulting rbcL sequences was performed using the diat.barcode v12.4 reference database (Rimet et al., 2019), applying a minimum bootstrap confidence threshold of 60. Non-diatom ASVs were excluded from further analysis. For quality control, only ASVs represented by more than 10 reads were retained. Furthermore, ASVs with uncertain or unresolved taxonomy were manually annotated using BLAST searches against the NCBI nucleotide database, applying a minimum identity threshold of 95%, to finalize the diatom taxonomic assignments. Sequences not assigned to the genus level were removed from the final diatom list. The number of reads per sample was used to quantify the relative abundance of taxa.
2.5 Diatom indices
To assess the ecological status of the freshwater lakes (Sava Lake and Markovačko Lake), five established diatom-based indices were selected and calculated using the OMNIDIA software, version 6.1.4 (Lecointe et al., 1993; Lecointe and Coste, 2015). These indices were: IPS-Specific Pollution Sensitivity Index (Cemagref, 1982), IBD- Biological Diatom Index (Lenoir and Coste, 1996; Coste et al., 2009), TDIL-Trophic Diatom Index for lakes (Stenger-Kovács et al., 2007), Rott TI-Austrian trophic index (Rott et al., 1999), and Rott SI- Austrian saprobic index (Rott et al., 1997). These indices were selected because they can indicate global pollution by highlighting communities under stress (IPS and IBD), assess water saprobity (Rott SI), and evaluate eutrophication levels (TDIL and Rott TI). IPS is the index officially applied for assessing the ecological status of surface waters in Serbia (Official Gazette of the Republic of Serbia, 2011) and is broadly applied throughout Europe as its database encompasses the ecological characteristics of over 2,000 taxa (Kelly, 2013). Water quality class thresholds were determined according to the criteria established by Prygiel and Coste (2000). To evaluate the ecological status/potential of saline lakes (Pečena Slatina and Plava Banja), the Diatom Index for Soda Pans (DISP) and Trait-Based Index (TBI) were applied and calculated using the formula given by Stenger-Kovács et al. (2018). To evaluate the robustness of the diatom indices, we calculated the percentage of total abundance represented by taxa included in each index, for both microscopy and metabarcoding datasets.
2.6 Physical and chemical analysis
Water temperature (T) was measured in situ using a classic water thermometer. Water samples intended for chemical analysis were collected with a plastic hose along the vertical profile covering the photic zone (e.g., two times the Secchi depth - integrated sample) and poured into a 1 L plastic bottle and stored at 4 °C until further processing in the laboratory. Conductivity was determined using the U.S. EPA (1982) method (Conductance), following the U.S. EPA (1999) manual, with a conductometer LF 191 (WTW). Dissolved oxygen was measured using the Winkler method with aside modification (4500-O C), following the recommendations of APHA et al. (2015). The pH was measured potentiometrically according to the SRPS JUS H.Z1.111, 1987 standard, using an INOLAB pH 730 meter (WTW). Total nitrogen (TN) was analyzed according to SRPS EN12260, 2008 standard, while for the determination of orthophosphate and total phosphorus, the SRPS EN ISO 6878, 2008 method was applied, with measurements performed on a UV-Vis spectrophotometer Lambda (models 25/35/45, Perkin Elmer) at a wavelength of 880 nm. Carbonate (CO32-) and bicarbonate (HCO3-) concentrations were calculated using the titration method (APHA et al., 1995a), based on the relationship between p- and m-alkalinity. Cation concentrations (K+, Na+, Ca²+, Mg²+) were measured using ICP-OES (inductively coupled plasma–optical emission spectroscopy) on an iCAP 6500 Duo ICP instrument (Thermo Fisher Scientific, UK). For measuring ammonia concentration (NH4+, SRPS EN ISO 14911, 2009), nitrite (NO2-), nitrate (NO3-), chloride (Cl-, APHA et al., 1995b), and sulfate (SO4²-, APHA et al., 1995c) ion chromatography was used.
2.7 Statistical analysis
All statistical analyses were performed using R v4.4.0 (R Core Team, 2024).
To visualize the overlap in taxa identified by metabarcoding and morphological approaches, the “Venn diagram” package (Chen, 2022) was used. Alpha diversity indices, including species richness and Shannon-Wiener diversity index, were calculated using respectively the diversity() function and specnumber() function from the vegan R-package (Oksanen et al., 2024). For alpha diversity analyses, all 54 samples processed with rbcL were included. For beta diversity, only samples present in both microscopy and metabarcoding datasets were used, as five samples from Pečena Slatina Lake showed no diatoms in microscopy. These were excluded to ensure the dataset alignment required for multivariate comparisons. The relative abundance of dominant taxa (5% or more) was illustrated using stacked bar plots constructed with the ‘tidyverse’ packages (Wickham et al., 2019).
Prior to conducting multivariate statistical analyses, diatom abundance data were CLR-transformed using the decostand() function of the vegan R-package. Additionally, environmental variables exhibiting skewed distributions (COND, Cl-, Na+, SO4²-, TP, TN, NH4+, NO2-, PPO4³-, CO3²-, Mg²+) were log-transformed using a base-10 logarithm with an offset of +1 (log10(x + 1)) to improve normality. Subsequently, the environmental dataset was then standardized using the scale() function in R to ensure equal weighting. To explore the variation in environmental parameters across lakes, a Principal Component Analysis (PCA) was performed using the rda() function from the vegan R-package. The first two principal components were visualized using “ggplot2” (Wickham, 2016).
To examine the relationship between environmental variables and the diatom community composition, based on either morphological or metabarcoding data, Redundancy Analysis (RDA) was performed using the rda() function in the ‘vegan’ package (Oksanen et al., 2024). Forward selection was applied using forward.sel() from the adespatial R-package to identify significant explanatory variables, with a stopping criterion based on the adjusted R² of the full model. A parsimonious RDA model was then built using the selected variables. The significance of the RDA model, axes, and environmental variables was tested using anova.cca() function from the vegan R-package with 999 permutations. Taxa contributing most strongly to the ordination were identified using ordiselect() from the goeveg R-package (Von Lampe and Schellenberg, 2024) with thresholds for abundance and fit set to 0.2 (ablim = 0.2, fitlim = 0.2).
To evaluate the concordance between diatom community composition obtained from morphological and metabarcoding approaches, a co-inertia analysis (CoIA) was performed using the coinertia() function from the ade4 R-package (Dray and Dufour, 2007). Co-inertia analysis was based on two PCAs, performed on each table, using the dudi.pca() function from the ade4 R-package. Here, for both PCAs, we have selected the first two principal components. The shared structure between the datasets was quantified using the RV coefficient. The significance of the co-structure was assessed using a Monte Carlo permutation test with 999 replicates using the randtest() function from the ade4 R-package.
To assess differences in diatom index values between microscopy and metabarcoding, Welch’s ANOVA was applied to each lake. The test provided adjusted p-values and Hedges’ g effect sizes with confidence intervals to evaluate the significance and magnitude of differences between the two methods. In addition, we calculated the percentage of abundance represented by taxa with assigned index values in each method to evaluate index coverage.
3 Results
3.1 Physical and chemical characterization of lakes
In general, the freshwater lakes, Sava Lake and Markovačko Lake, exhibited stable chemical conditions with low nutrient levels, indicative of oligotrophic (Sava Lake) to mesotrophic (Markovačko Lake) status and minimal anthropogenic influence. Sava Lake maintained consistently stable parameters throughout the seasons, while Markovačko Lake showed moderate seasonal variability, particularly in pH and conductivity. In contrast, the saline lakes, Pečena Slatina and Plava Banja, were characterized by extreme seasonal variability, very high salinity and alkalinity, dominated by Na+ and Cl- or SO4²- ions. High nutrient levels were detected in Pečena Slatina, indicating hypereutrophic status. In contrast, nutrient levels in Plava Banja were lower, indicating mesotrophic status in spring and oligotrophic status in summer and autumn. Generally, conditions in saline lakes were primarily driven by evaporation and mineral-rich inflows. Values of all measured physical and chemical parameters in the four investigated lakes are provided in the Supplementary Table 1.
These gradients were further illustrated by a Principal Component Analysis (PCA), where samples clustered in accordance with salinity-driven separation (Supplementary Figure S1). PCA of the 19 standardized environmental variables revealed that the first two principal components explained a total of 80.2% of the variance among samples (PC1 = 57.8%, PC2 = 22.4%). Salinity emerged as the main gradient structuring the samples along the first principal axis. Samples from freshwater lakes (Sava Lake and Markovačko Lake) consistently exhibited negative scores, whereas those from saline lakes (Pečena Slatina and Plava Banja) showed positive scores across all seasons. This gradient primarily reflects high calcium (Ca++) concentrations and lower pH and alkalinity in freshwater lakes, versus lower calcium (Ca++) and elevated pH and alkalinity in saline lakes. Separation along the second axis was mainly driven by differences between the two saline lakes, suggesting distinct environmental profiles. In contrast, the two freshwater lakes clustered more closely together, indicating greater similarity in their physicochemical characteristics. Overall, the PCA captured two main patterns: (1) consistent differentiation between freshwater and saline lakes, and (2) stronger divergence between saline lakes than between freshwater ones.
3.2 Taxonomic composition and comparative alpha diversity
Based on morphological identification, a total of 212 taxa were distributed across 58 genera (Supplementary Table 2). After bioinformatic processing of molecular data, 2,758,126 raw reads across 54 samples were processed through the DADA2 pipeline, 2,249,522 reads belonging to 1,367 ASV remained. A total of 480 ASVs that did not match the expected 263 bp rbcL amplicon length were removed, and 144 ASVs with 10 or fewer reads were deleted. After blasting unassigned ASV sequences against GenBank with a percentage of identity >95% as a threshold, the number of taxonomically annotated ASVs was 502. A total of 227 taxa across 61 genera remained (Supplementary Table 2).
Species-level Venn diagrams were constructed for each lake to evaluate the overlap in taxa detection between microscopy and metabarcoding (Figure 2). The comparison revealed varying degrees of overlap in diatom taxa detection across the four lakes. Markovačko Lake showed the highest agreement between the two methods (Figure 2A), followed by slightly lower concordance in Sava Lake (Figure 2B). In contrast, Plava Banja (Figure 2C) and Pečena Slatina (Figure 2D) showed lower overlap, indicating significant divergence in taxa recovered by each approach. Notably, both saline lakes also exhibited a lower total number of taxa detected by microscopy and metabarcoding.
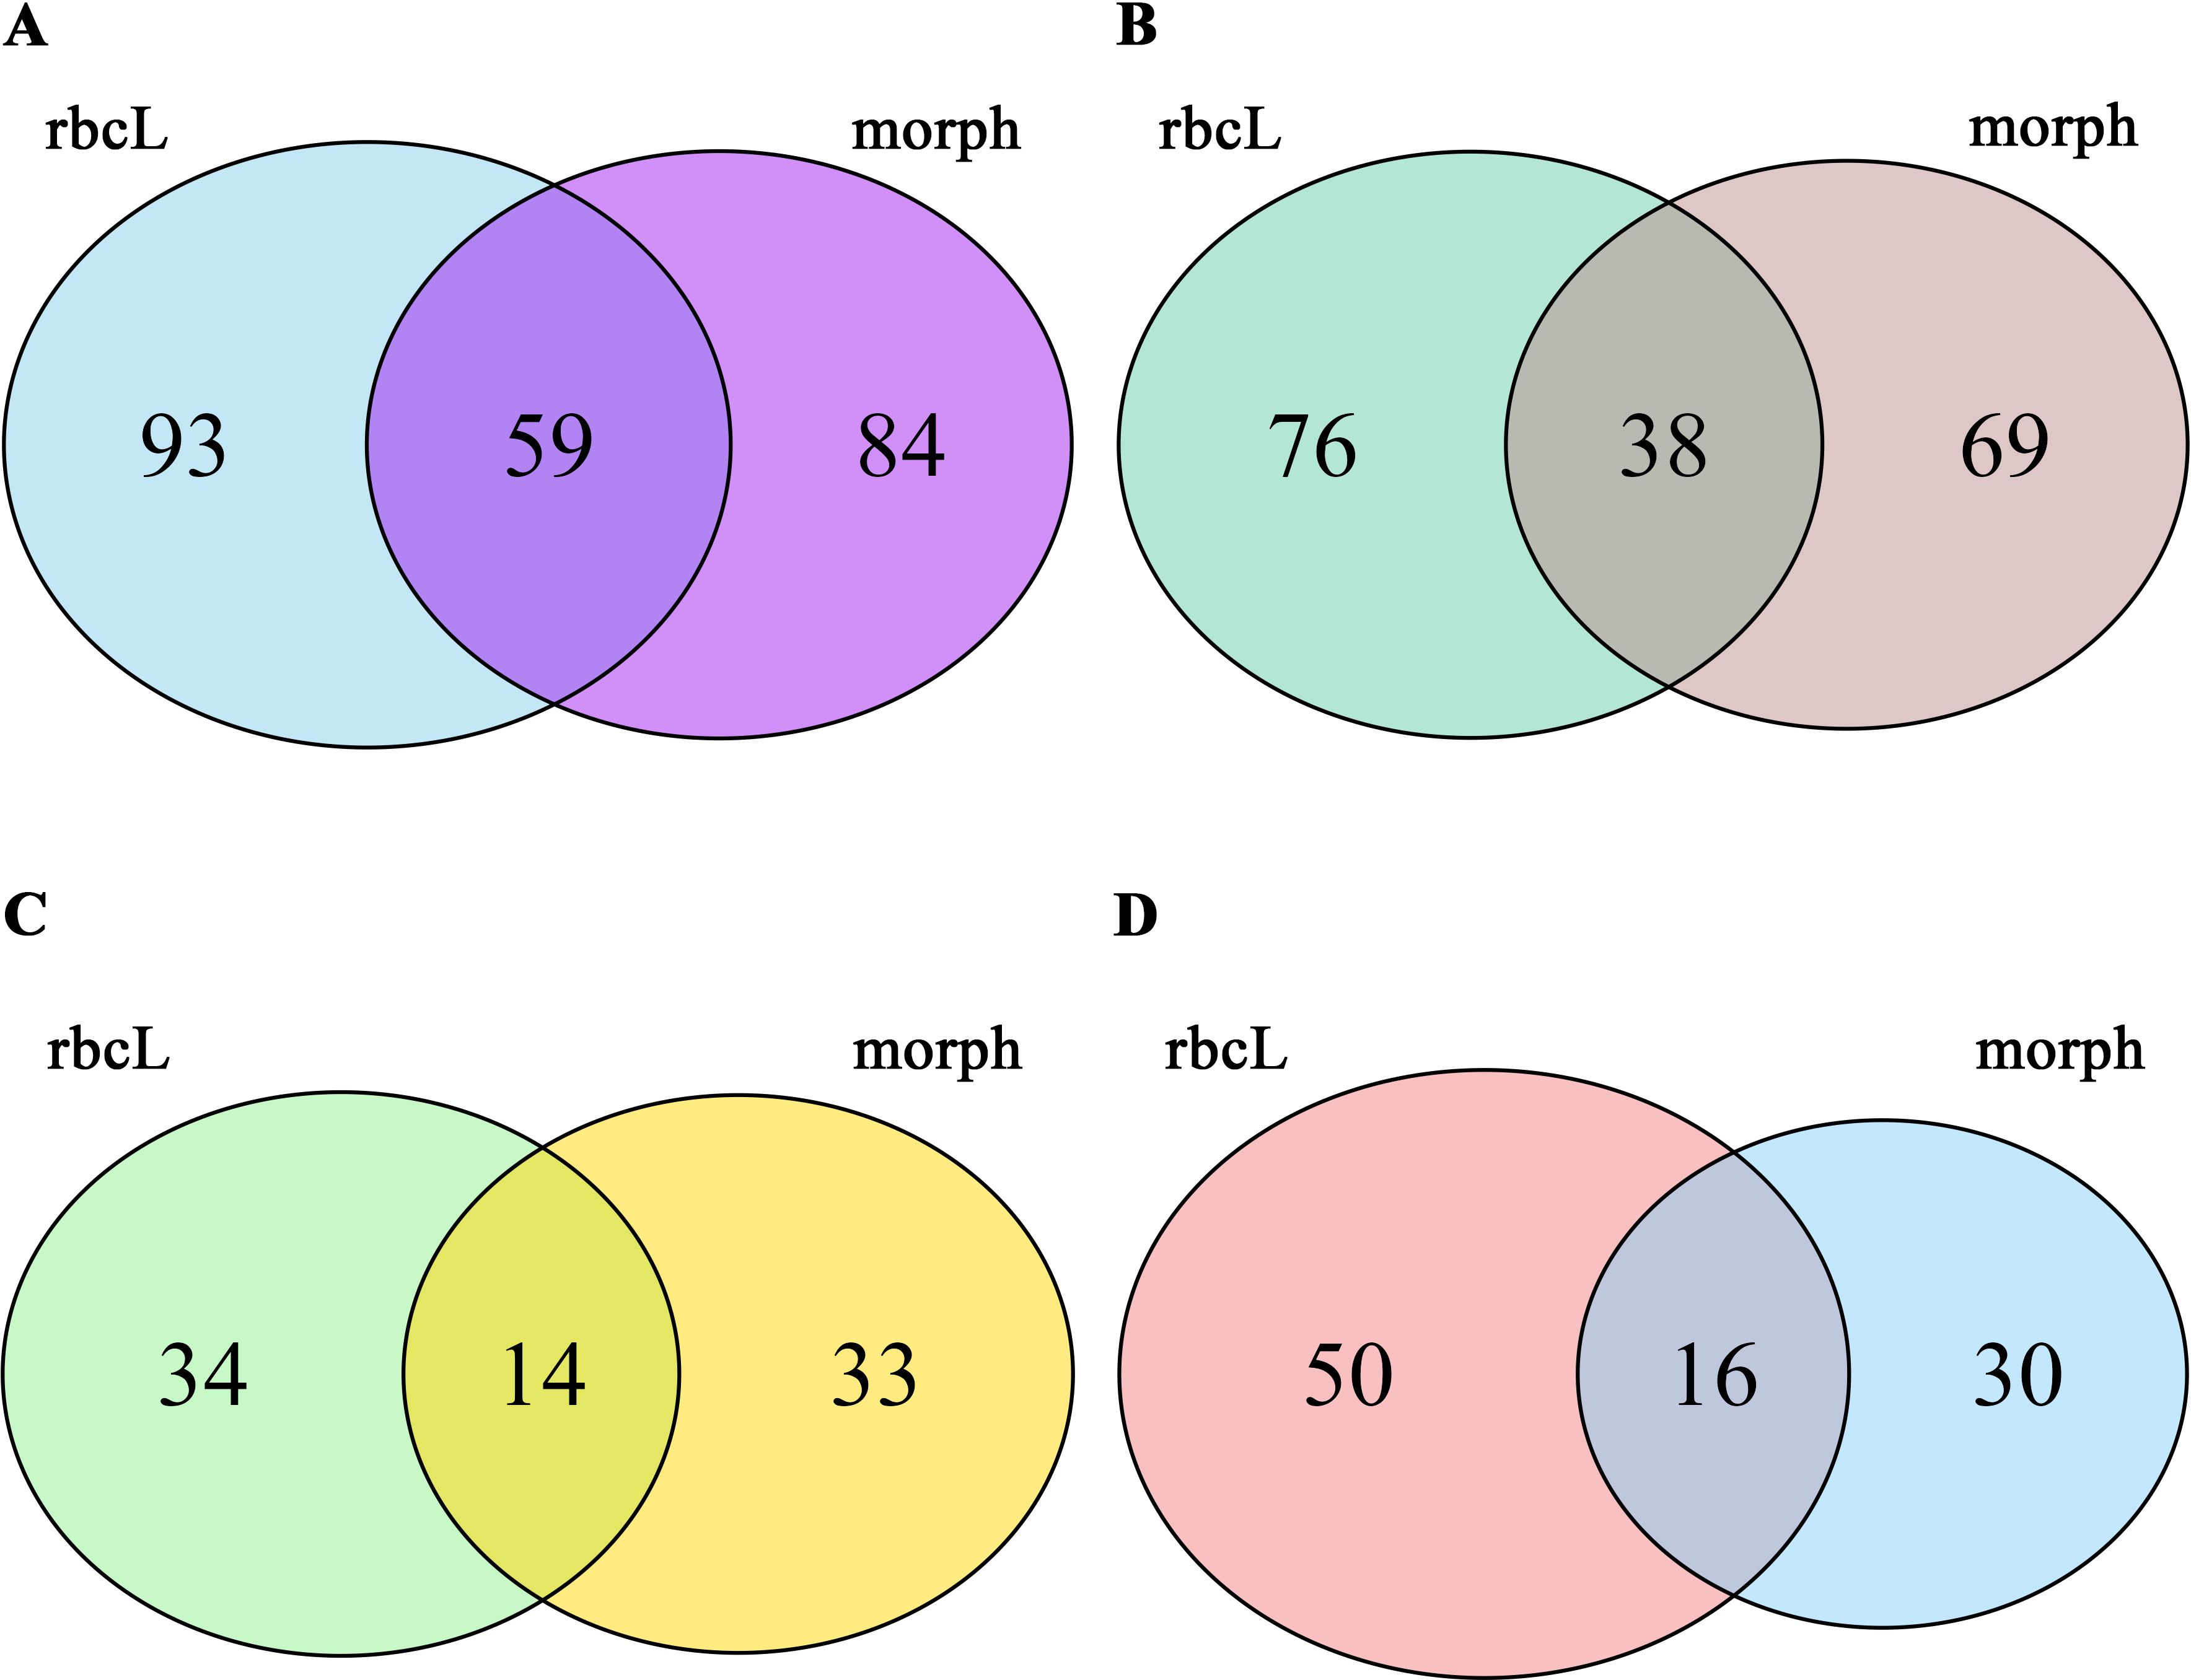
Figure 2. Venn diagram showing the overlap of diatom taxa detected by microscopy and metabarcoding across the four studied lakes. (A) Markovačko Lake, (B) Sava Lake, (C) Plava Banja, (D) Pečena Slatina. The diagrams were generated using the VennDiagram R package (Chen, 2022) to visualize shared and unique taxa between the two approaches.
Species richness and Shannon diversity index were consistently higher in freshwater lakes (Markovačko and Sava) compared to saline lakes (Plava Banja and Pečena Slatina), across both identification methods (Figure 3). Species richness values were significantly higher in metabarcoding than in microscopy in all lakes, as confirmed by Welch’s t-tests (p < 0.001 in each case). Shannon diversity showed a similar trend, with higher values in metabarcoding in all lakes, but the difference reached statistical significance only in Plava Banja (t = 2.98, p = 0.007). Importantly, both approaches revealed the same diversity gradient among lakes, with higher richness and diversity in freshwater than in saline systems, indicating consistency between methods in capturing the main ecological signal.
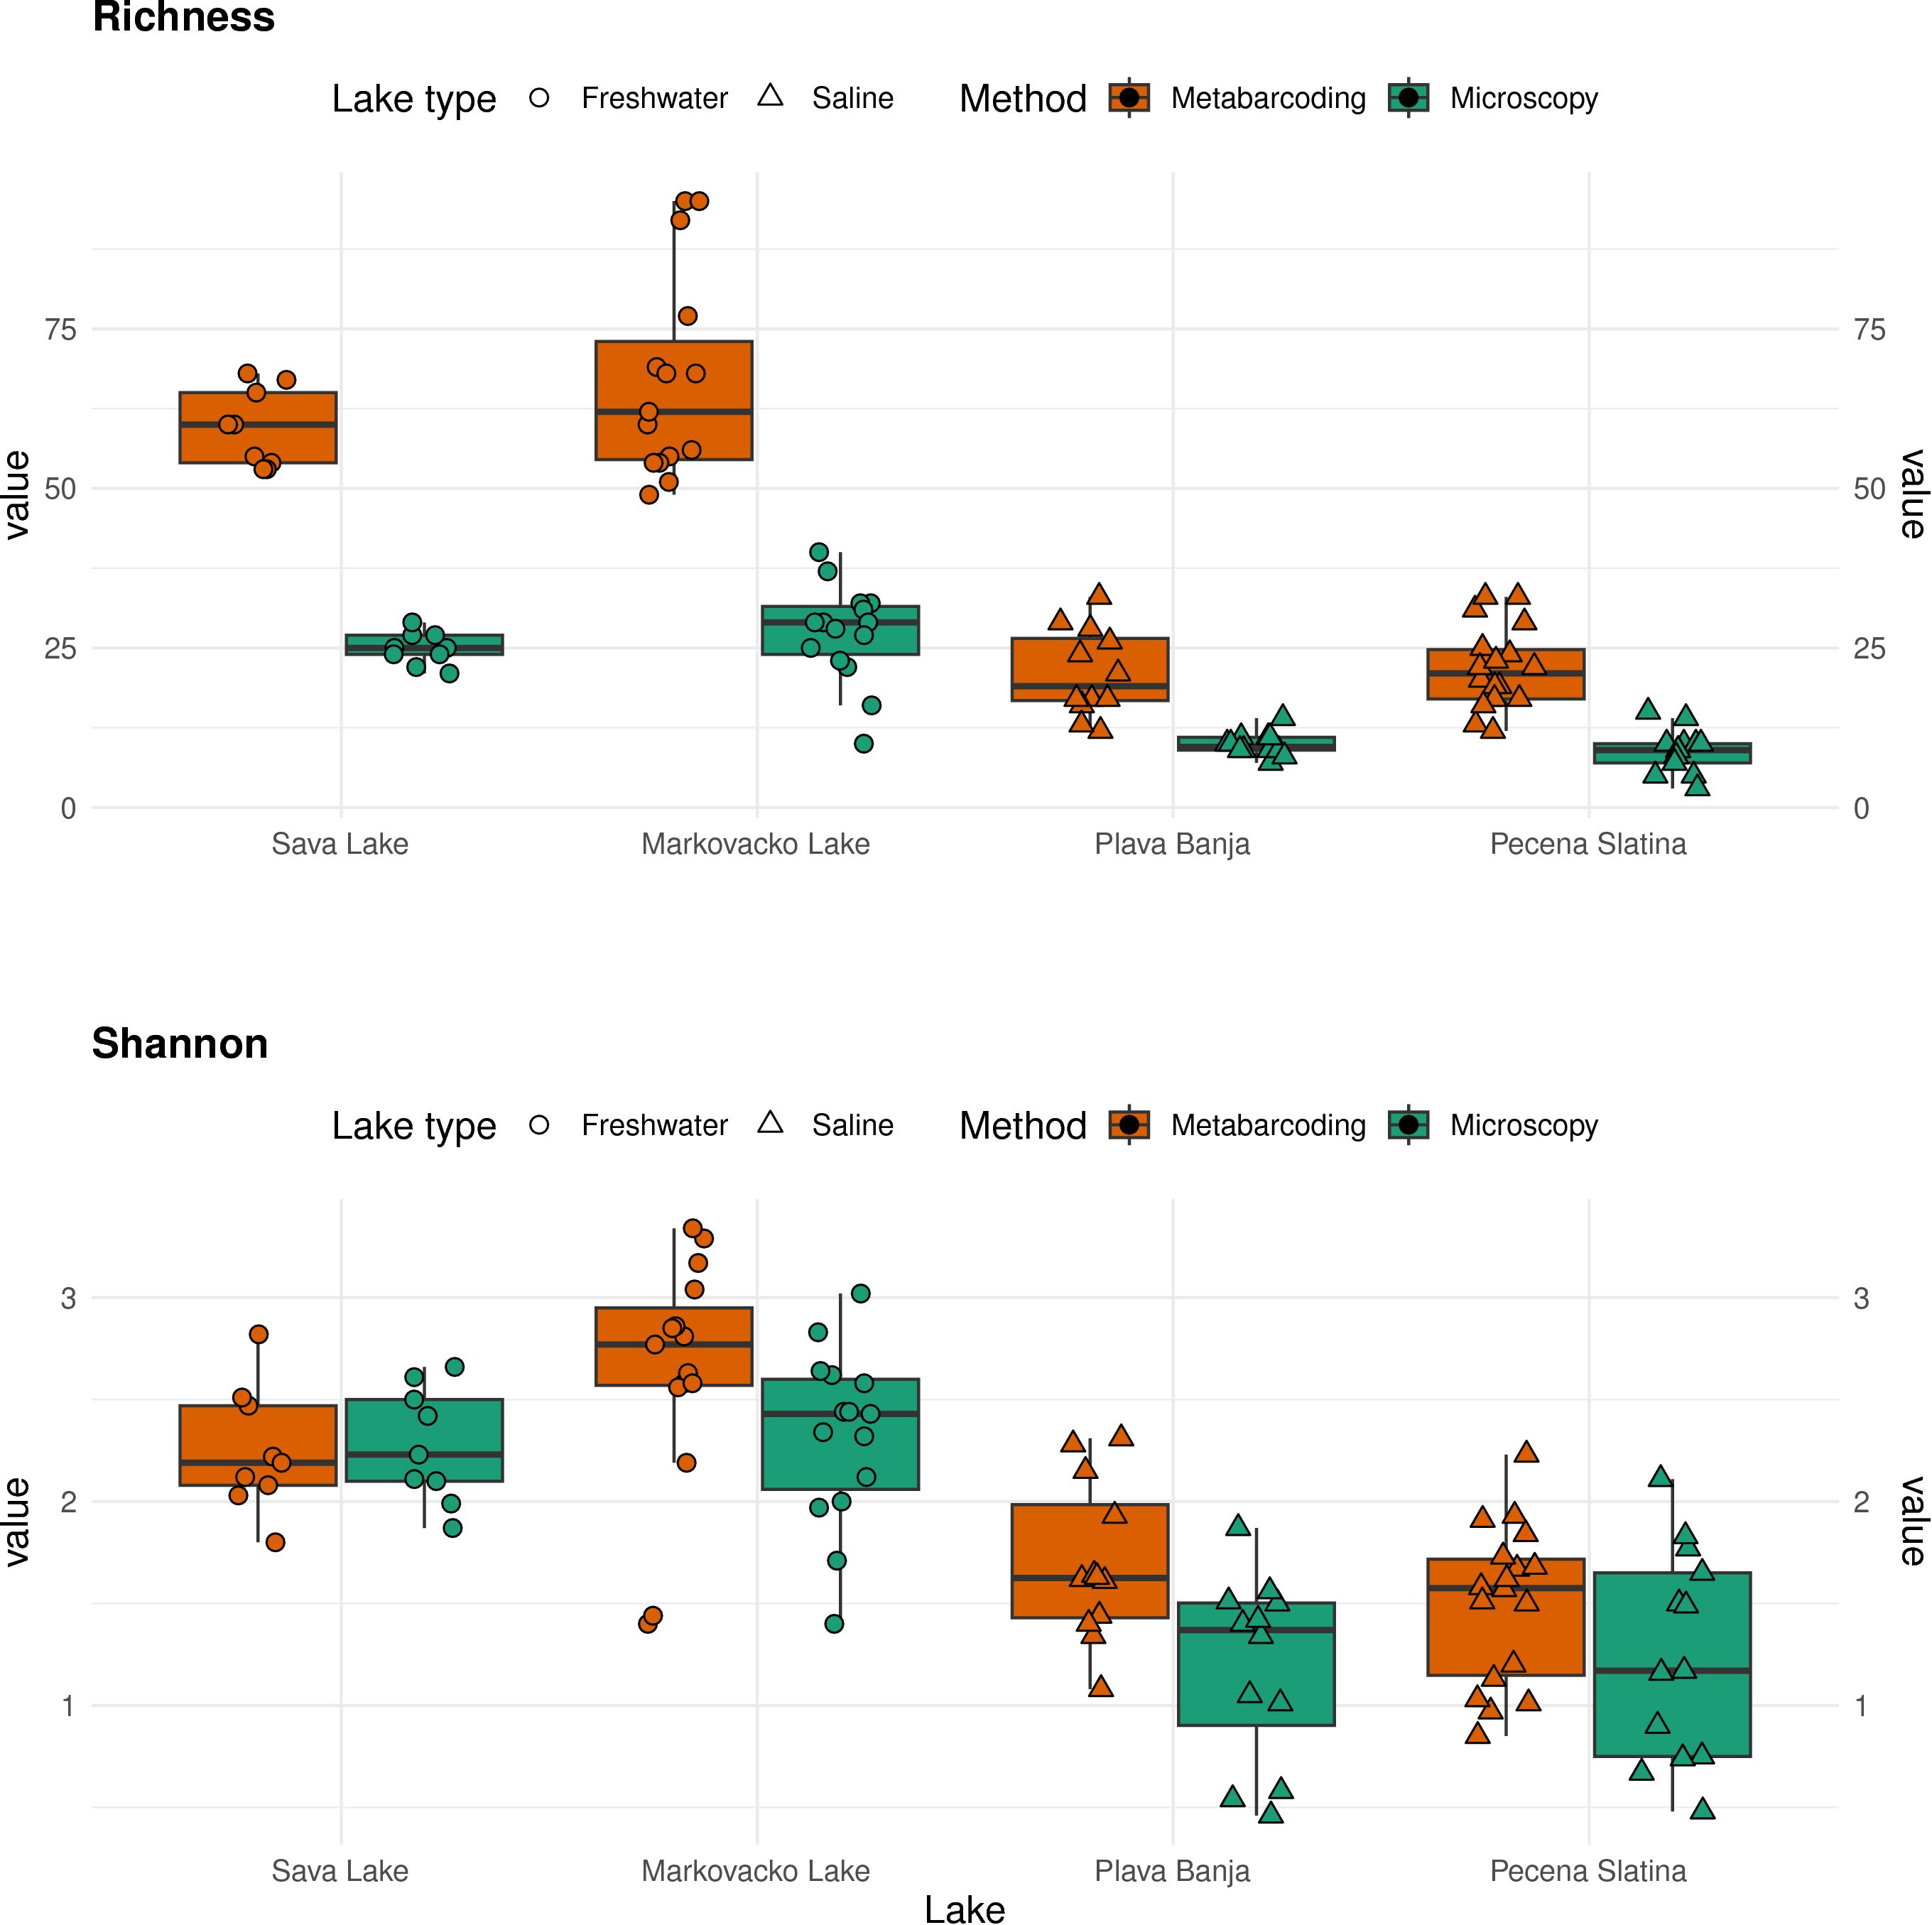
Figure 3. Comparison of species richness and Shannon–Wiener diversity index across the four lakes, based on metabarcoding and microscopy.
3.2.1 Taxonomic composition in the Markovačko Lake
Morphological analysis - A total of 143 taxa across 42 genera were recorded in the Markovačko Lake. The genera with the highest species richness were Nitzschia (23) and Navicula (20). During the spring, the most dominant taxon was Discostella pseudostelligera, while during the summer Aulacoseira muzzanensis dominated. In autumn, a few different taxa dominated the community, such as Pantocsekiella ocellata, Encyonema caespitosum, and Navicula veneta. (Figure 4E).
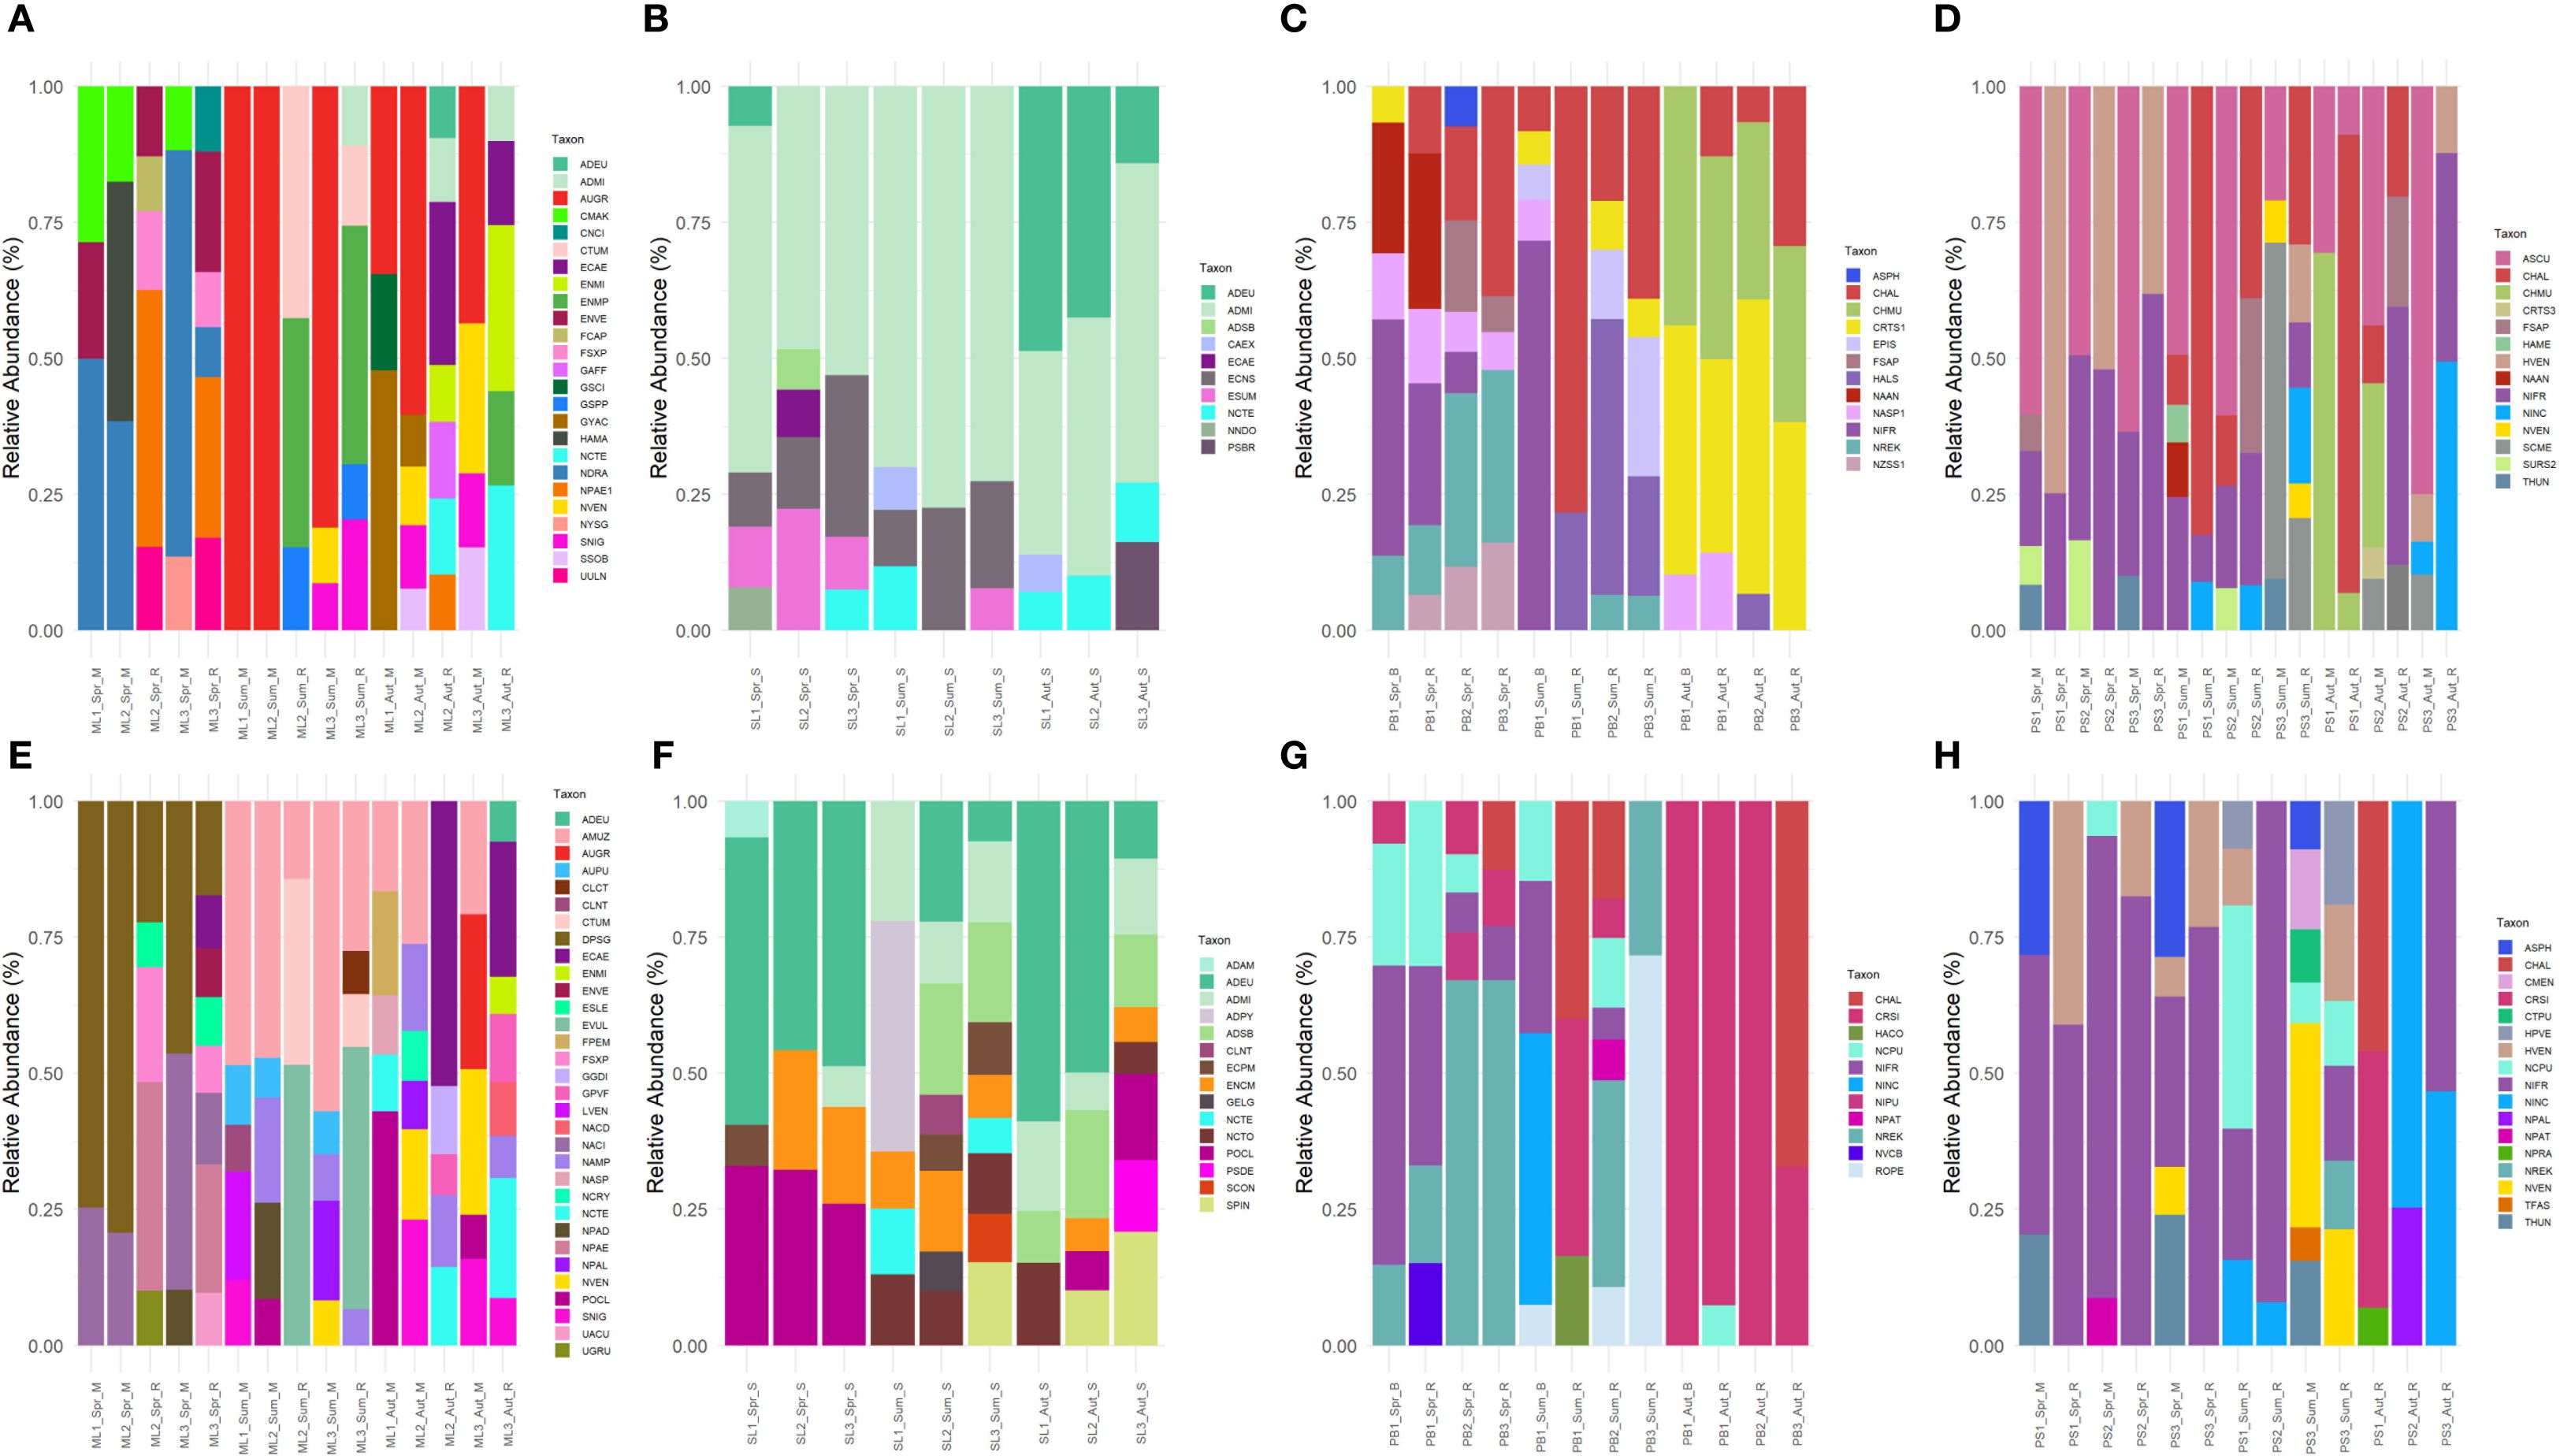
Figure 4. Comparison of dominant taxa (≥5%) between metabarcoding and microscopy across 4 lakes. (A) Markovačko Lake (rbcL), (B) Sava Lake (rbcL), (C) Plava Banja (rbcL), (D) Pečena Slatina (rbcL), (E) Markovačko Lake (microscopy), (F) Sava Lake (microscopy), (G) Plava Banja (microscopy), (H) Pečena Slatina (microscopy). Sample codes: ML-Markovačko Lake, SL-Sava Lake, PB-Plava Banja, PS-Pečena Slatina; Spr-Spring, Sum-Summer, Aut-Autumn; S-stone, M-mud, R-reed. Four-letter code based on the OMNIDIA short code, explained in Supplementary Table S2.
rbcL – The metabarcoding approach detected 151 taxa, with the highest species richness observed in the genera Nitzschia (26 taxa) and Navicula (15 taxa). In spring, Nitzschia draveillensis¸ Nitzschia cf. paleacea, Encyonema ventricosum, and Hantzschia amphioxys var. major were the most dominant. Aulacoseira granulata was dominant in summer and autumn in the mud samples. In contrast, the reed samples were dominated by Encyonema minutum var. pseudogracilis and Cymbella tumida in the summer, and by diverse dominant species in autumn (Figure 4A).
3.2.2 Taxonomic composition in the Sava Lake
Morphological analysis – A total of 107 taxa across 39 genera were recorded. The genera with the highest species richness were Nitzschia (17) and Navicula (14). Achnanthidium eutrophilum was the most dominant in almost all samples. In spring, dominance is shared with Pantocsekiella ocellata, while during the autumn it is dominated by several different species. During the summers, a shift is observed with Achnanthidium pyrenaicum at the locality SL1 (Figure 4F).
rbcL – Metabarcoding analysis of Sava Lake detected 114 taxa across 50 genera. The genera with the highest species richness were Nitzschia (17) and Navicula (10). Achnanthidium minutissimum was the most dominant taxon in every sample, except two autumn samples where it was dominant together with A. eutrophilum (Figure 4B).
3.2.3 Taxonomic composition in the Plava Banja
Morphological analysis - A total of 47 taxa across 17 genera were recorded in the Plava Banja. The genera with the highest species richness were Navicula (17) and Nitzschia (14). Nitzschia frustulum and Nitzschia reskoi were the most dominant during the spring. Depending on the sampling site, during the summer, Nitzschia inconspicua, Craticula taxa, N. reskoi, and Rhopalodia operculata dominated. Craticula taxa prevailed in autumn (Figure 4G).
rbcL – Through the metabarcoding approach, 48 taxa across 24 genera were recorded in the Plava Banja. The genera with the highest species richness were Nitzschia (9) and Navicula (5). Nitzschia and Craticula taxa were the most dominant in spring, while during the summer Craticula, Nitzschia, and an unknown Halamphora species prevailed. During autumn, the dominance of an unknown species of the genus Craticula is observed together with Chaetoceros muelleri (Figure 4C).
3.2.4 Taxonomic composition in the Pečena Slatina
Morphological analysis - A total of 46 taxa across 21 genera were recorded in the Pečena Slatina. The genera with the highest species richness were Nitzschia (13) and Navicula (5) Nitzschia frustulum was the most dominant taxon during all seasons, with a few exceptions. Navicymbula pusilla was dominant in summer at PS1 and Nitzschia inconspicua in autumn at PS3 in the reed sample, together with Nitzschia frustulum. Navicula veneta was the most dominant in PS3_Sum at both substrates. However, in autumn in reed samples, Craticula taxa were by far the most dominant taxa in PS1, as well as Nitzschia inconspicua in PS3 (Figure 4H).
rbcL – Metabarcoding approach identified 61 taxa across 29 genera in the PS. Nitzschia (13) and Navicula (5) were the most species-rich genera. Anomoeoneis sculpta and Nitzschia frustulum were the most dominant taxa in most of the samples. An increased relative abundance of Halamphora veneta in spring, Craticula halophila and Fistulifera saprophila in summer, Surirella sp., Craticula halophila, Chaetoceros muelleri, and Nitzschia inconspicua in autumn were observed (Figure 4D).
3.3 Impact of the environmental conditions on the community structure
3.3.1 Based on rbcL
The final model explained 69.2% of the total variance in community composition (adjusted R2 = 0692), with RDA1 and RDA2 accounting for 42.7% and 25.1% of the constrained variation, respectively (Figure 5). Permutation tests confirmed that the overall RDA model was highly significant (F = 13.99, p = 0.001), with the first seven axes explaining statistically significant portions of the variance (p < 0.05). Among the selected variables, conductivity, dissolved oxygen (DO), calcium (Ca++), and total phosphorus (TP) emerged as the most influential variables shaping diatom community composition. The first axis distinctively separated saline and freshwater lakes, with saline lakes associated with higher conductivity, Na+, Cl-, and CO3. Several taxa showed strong associations with the environmental gradients and lake types. Craticula halophila was clustered with Plava Banja, and its occurrence is influenced by high values of Na+, Cl- and CO3. Halamphora veneta, Nitzschia reskoi and Nitzschia frustulum were clustered with Pečena Slatina, indicating their strong affinity for high conductivity, ionic concentrations and ammonium level (NH4+). In contrast, Achnanthidium minutissimum, Encyonopsis subminuta, Encyonopsis sp., and Cymbella excisa were more closely aligned with Sava Lake, particularly along gradients of higher DO. Aulacoseira granulata, Encyonema minutum var. pseudogracilis, and Gomphonema saprophilum clustered with Markovačko Lake along the TP gradient, highlighting the influence of nutrient enrichment on community composition.
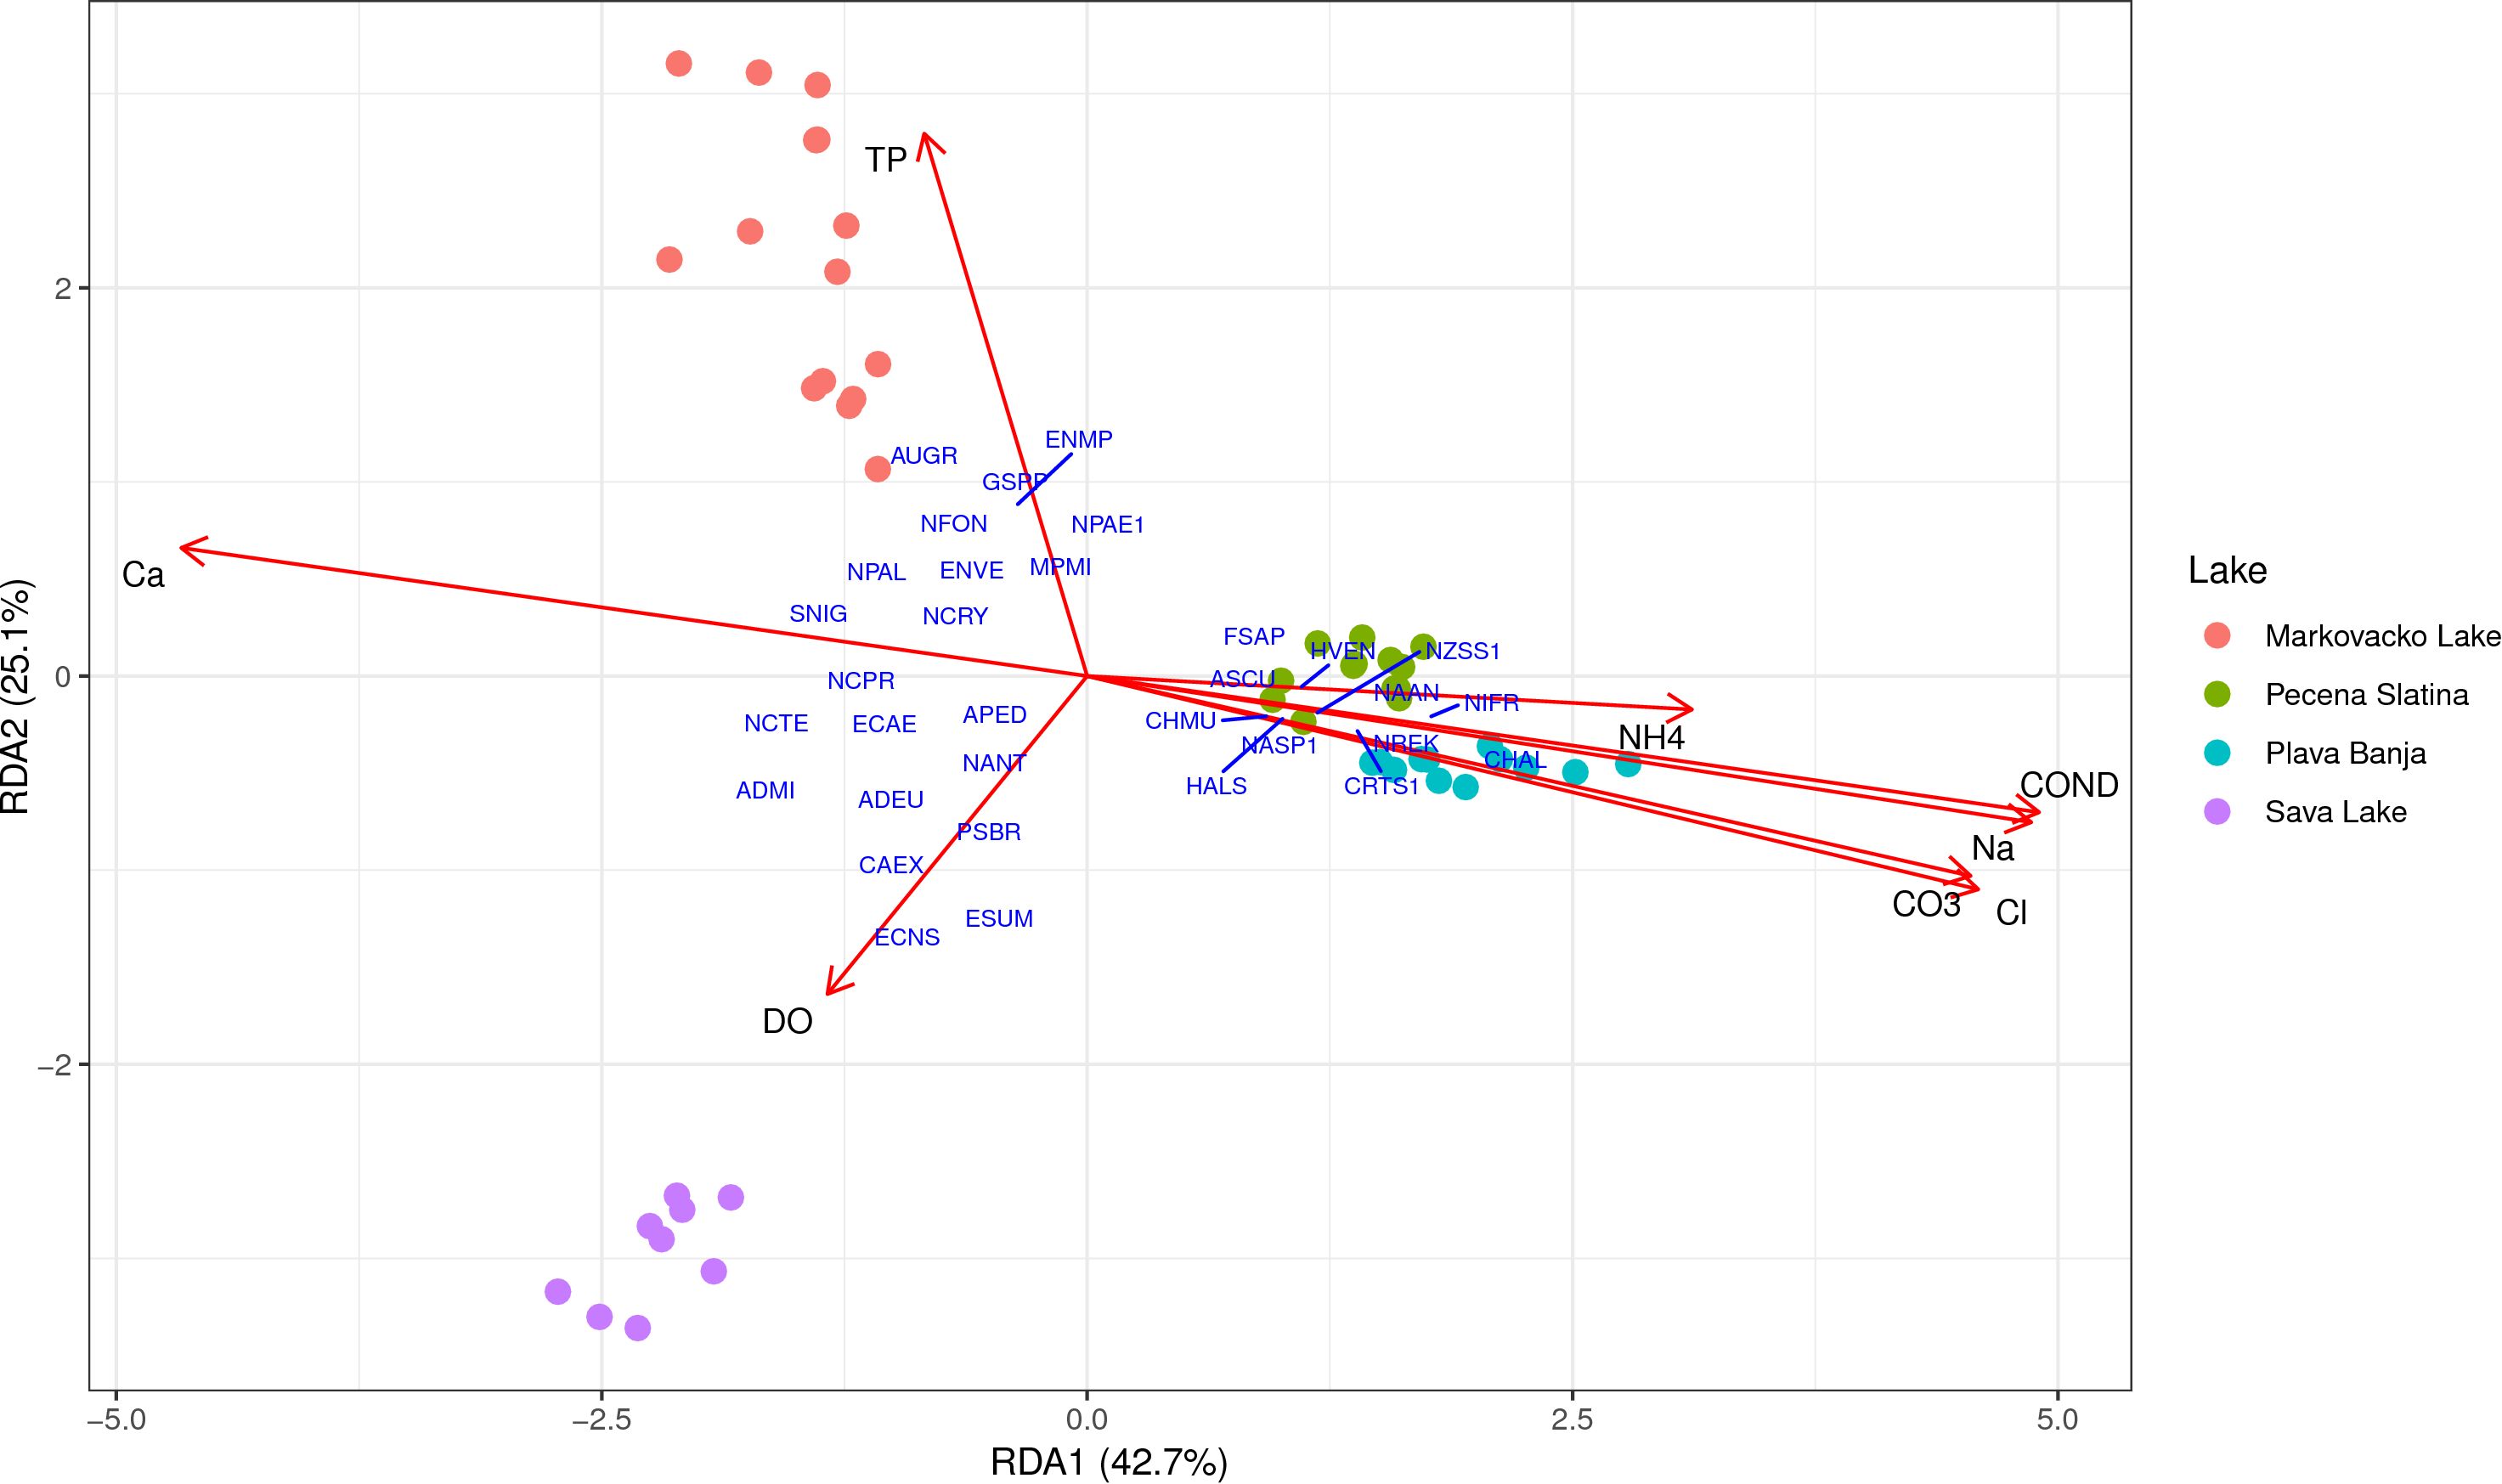
Figure 5. Redundancy analysis (RDA) triplot showing the relationship between environmental variables and diatom community composition based on metabarcoding. Arrows represent significant environmental variables selected through forward selection; sample scores and taxa scores are displayed in scaling 2. Results were visualized using “ggplot2” and “ggrepel” (Wickham, 2016).
3.3.2 Based on morphology
The final model of RDA based on the microscopy dataset revealed a statistically significant relationship between environmental variables and the diatom community composition observed via microscopy (F = 8.36, p = 0.001), with the constrained axes explaining 52.6% (adjusted R² = 0.526) of the total variance. The first two axes accounted for 36.3% and 24.7% variance, respectively, separating saline from freshwater lakes (Figure 6). Among the selected variables, conductivity, sulfate (SO4²-), calcium (Ca++), and total phosphorus (TP) were the strongest predictors of community structure. The positioning and clustering of the lakes show a similar pattern to that observed with the rbcL dataset. Samples from saline lakes were primarily associated with elevated conductivity, sulfate (SO4²-), chloride (Cl-), nitrite (NO2-), and carbonate (CO3²-) concentrations. Taxa such as Nitzschia frustulum, Nitzschia reskoi, and Navicymbula pusilla, clustered with saline lakes. In contrast, Aulacoseira muzzanensis, Nitzschia amphibia, and Discostella pseudostelligera were positioned closer to Markovačko Lake along the total phosphorus and Ca++ gradient, while Achnanthidium minutissimum, Achnanthidium eutrophilum, and Encyonopsis microcephala clustered near Sava Lake, samples did not show a strong correlation with any of the measured environmental variables.
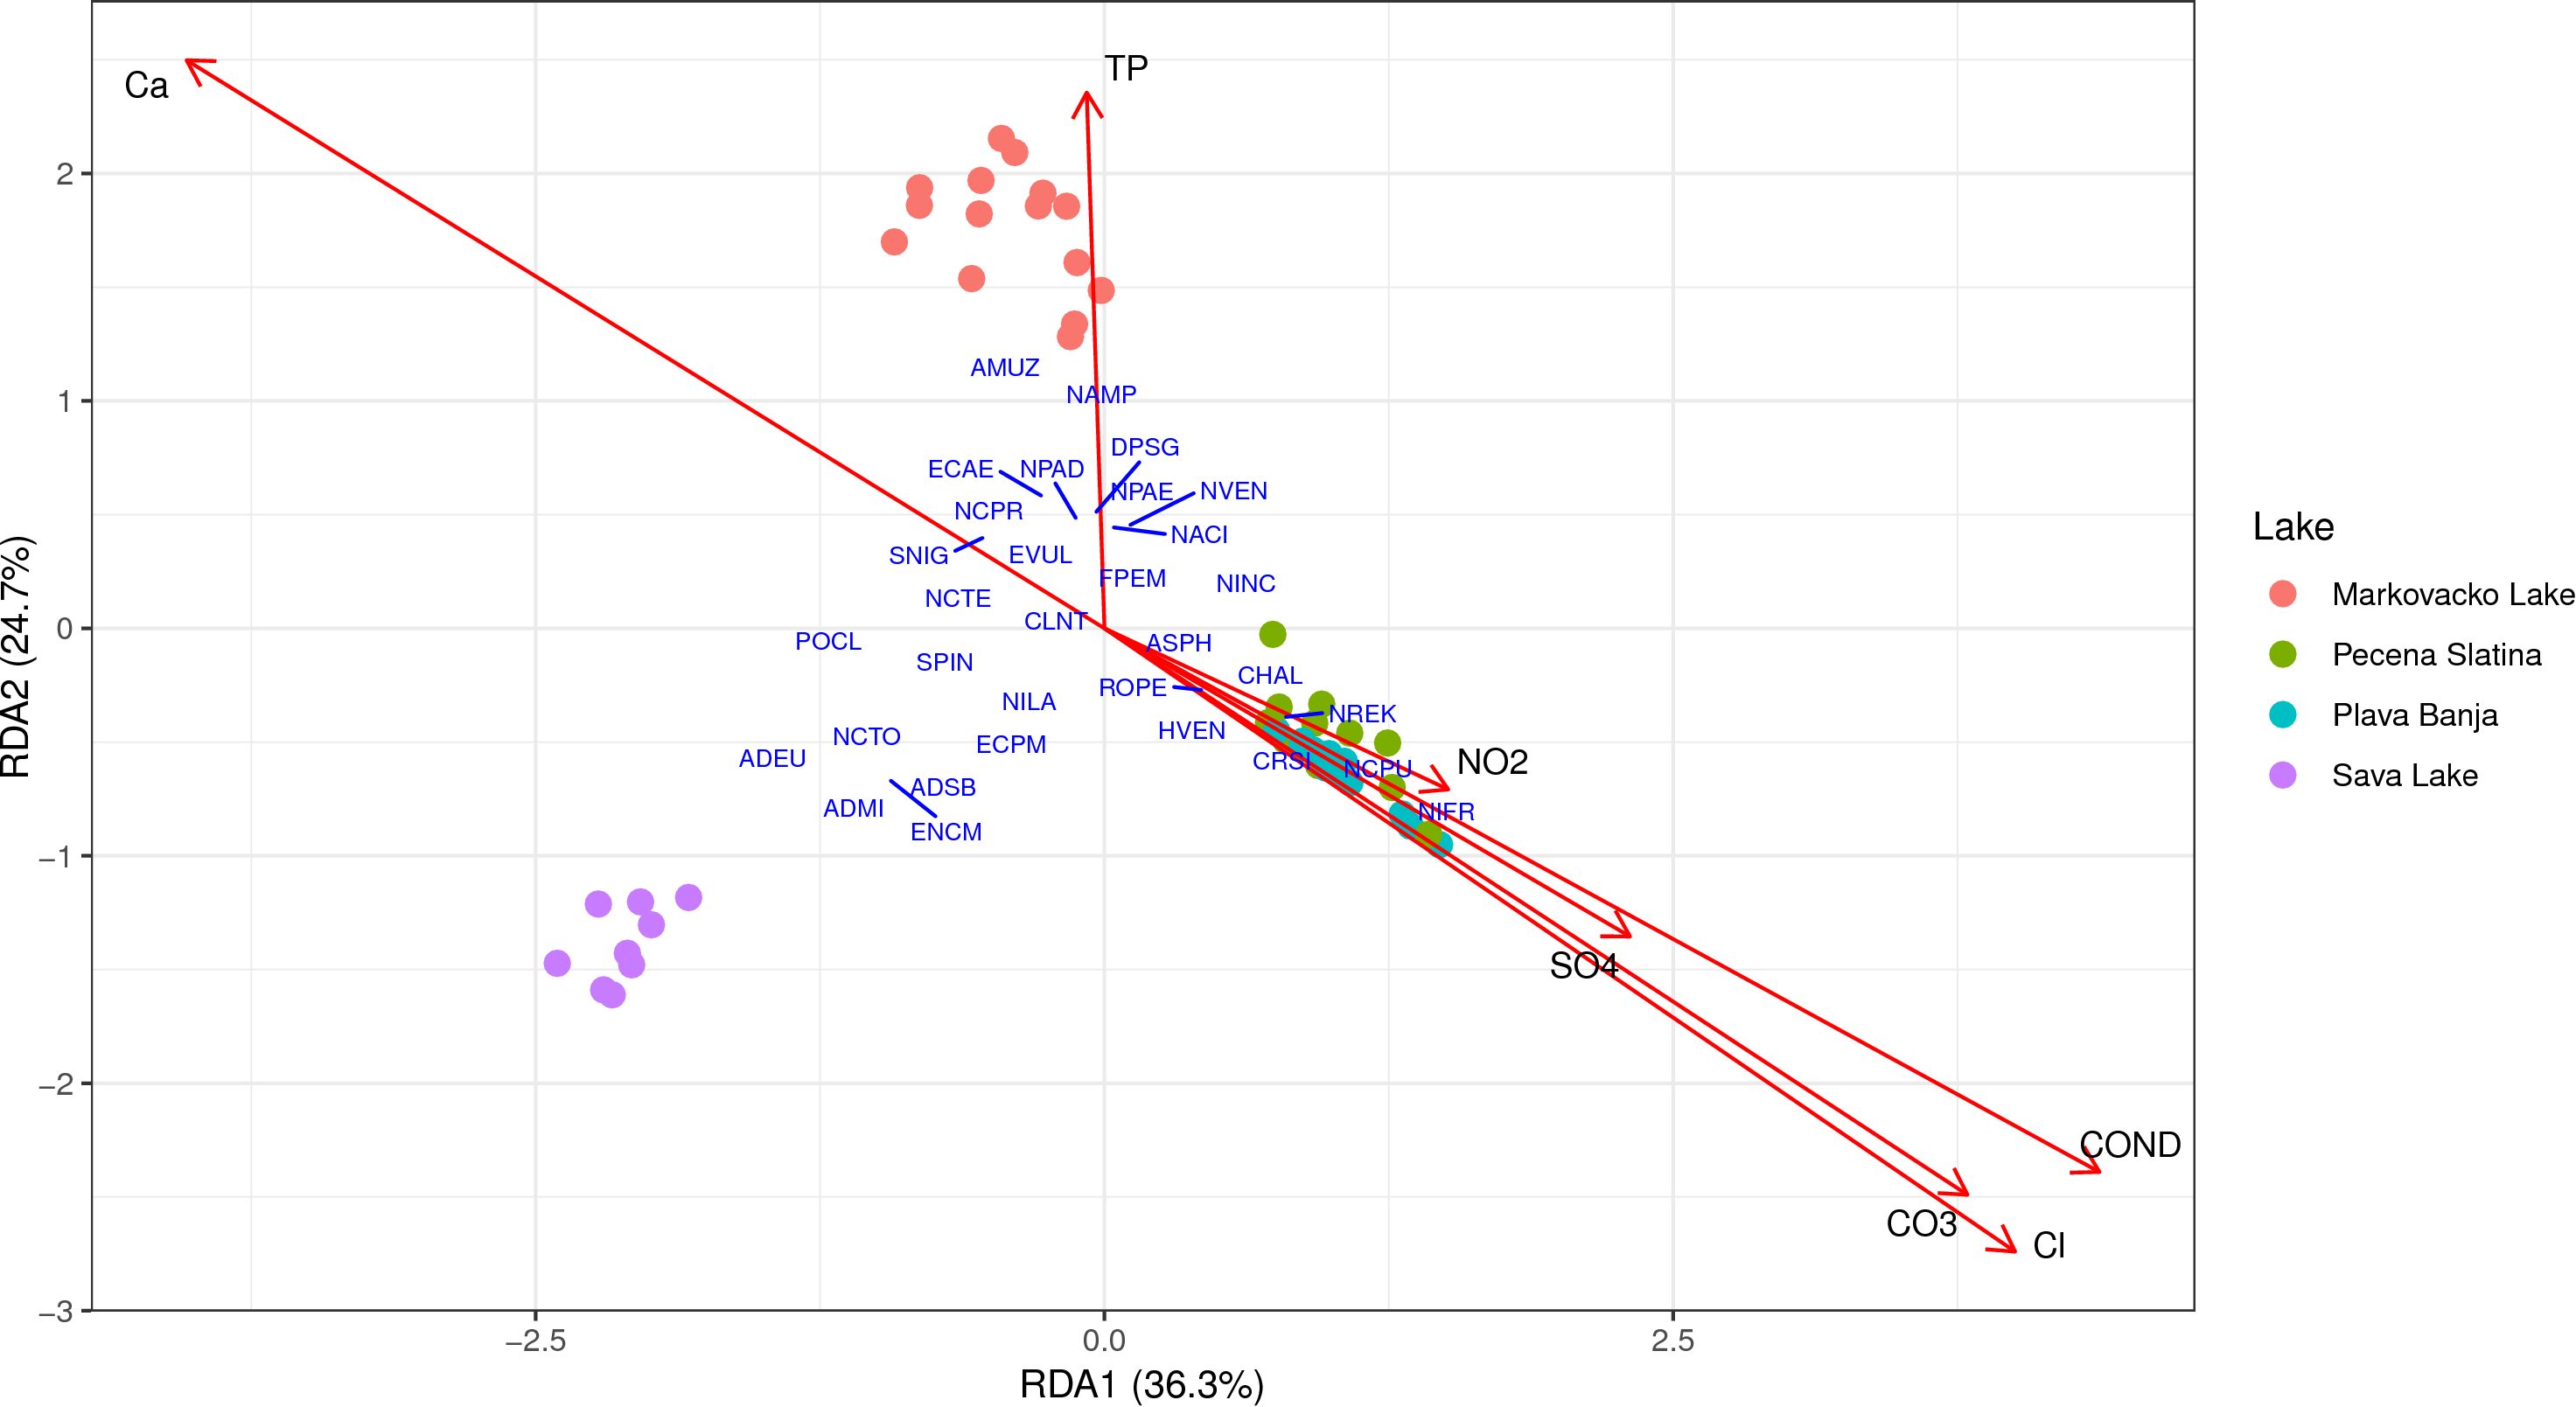
Figure 6. Redundancy analysis (RDA) triplot showing the relationship between environmental variables and diatom community composition based on microscopy. Arrows represent significant environmental variables selected through forward selection; sample scores and taxa scores are displayed in scaling 2. Results were visualized using “ggplot2” and “ggrepel” (Wickham, 2016).
3.4 Co-structure between microscopy and metabarcoding approach
To complete the co-inertia analysis, each dataset was first analyzed with a PCA. The first two axes in metabarcoding PCA captured more variance than in the microscopy PCA (52.0% and 37.4%, respectively). Co-inertia analysis revealed a strong and significant covariation between diatom community structures derived from metabarcoding and microscopy datasets, with a high RV coefficient of 0.92 (p = 0.001). The first two axes of the co-inertia ordination explained 81.6% of the shared variance (Axis 1: 56.0%, Axis 2: 25.6%). The ordination plot (Figure 7) displays sample positions in the space defined by both datasets, connected by arrows: each arrow originates from the rbcL-based position and ends at the corresponding morphology-based position. Overall, the arrows were relatively short, indicating good agreement between methods for most samples. Samples from each lake formed distinct and cohesive clusters. The consistent sample groupings and short arrow lengths indicate strong agreement between molecular and morphological methods in detecting differences in diatom communities across lakes.
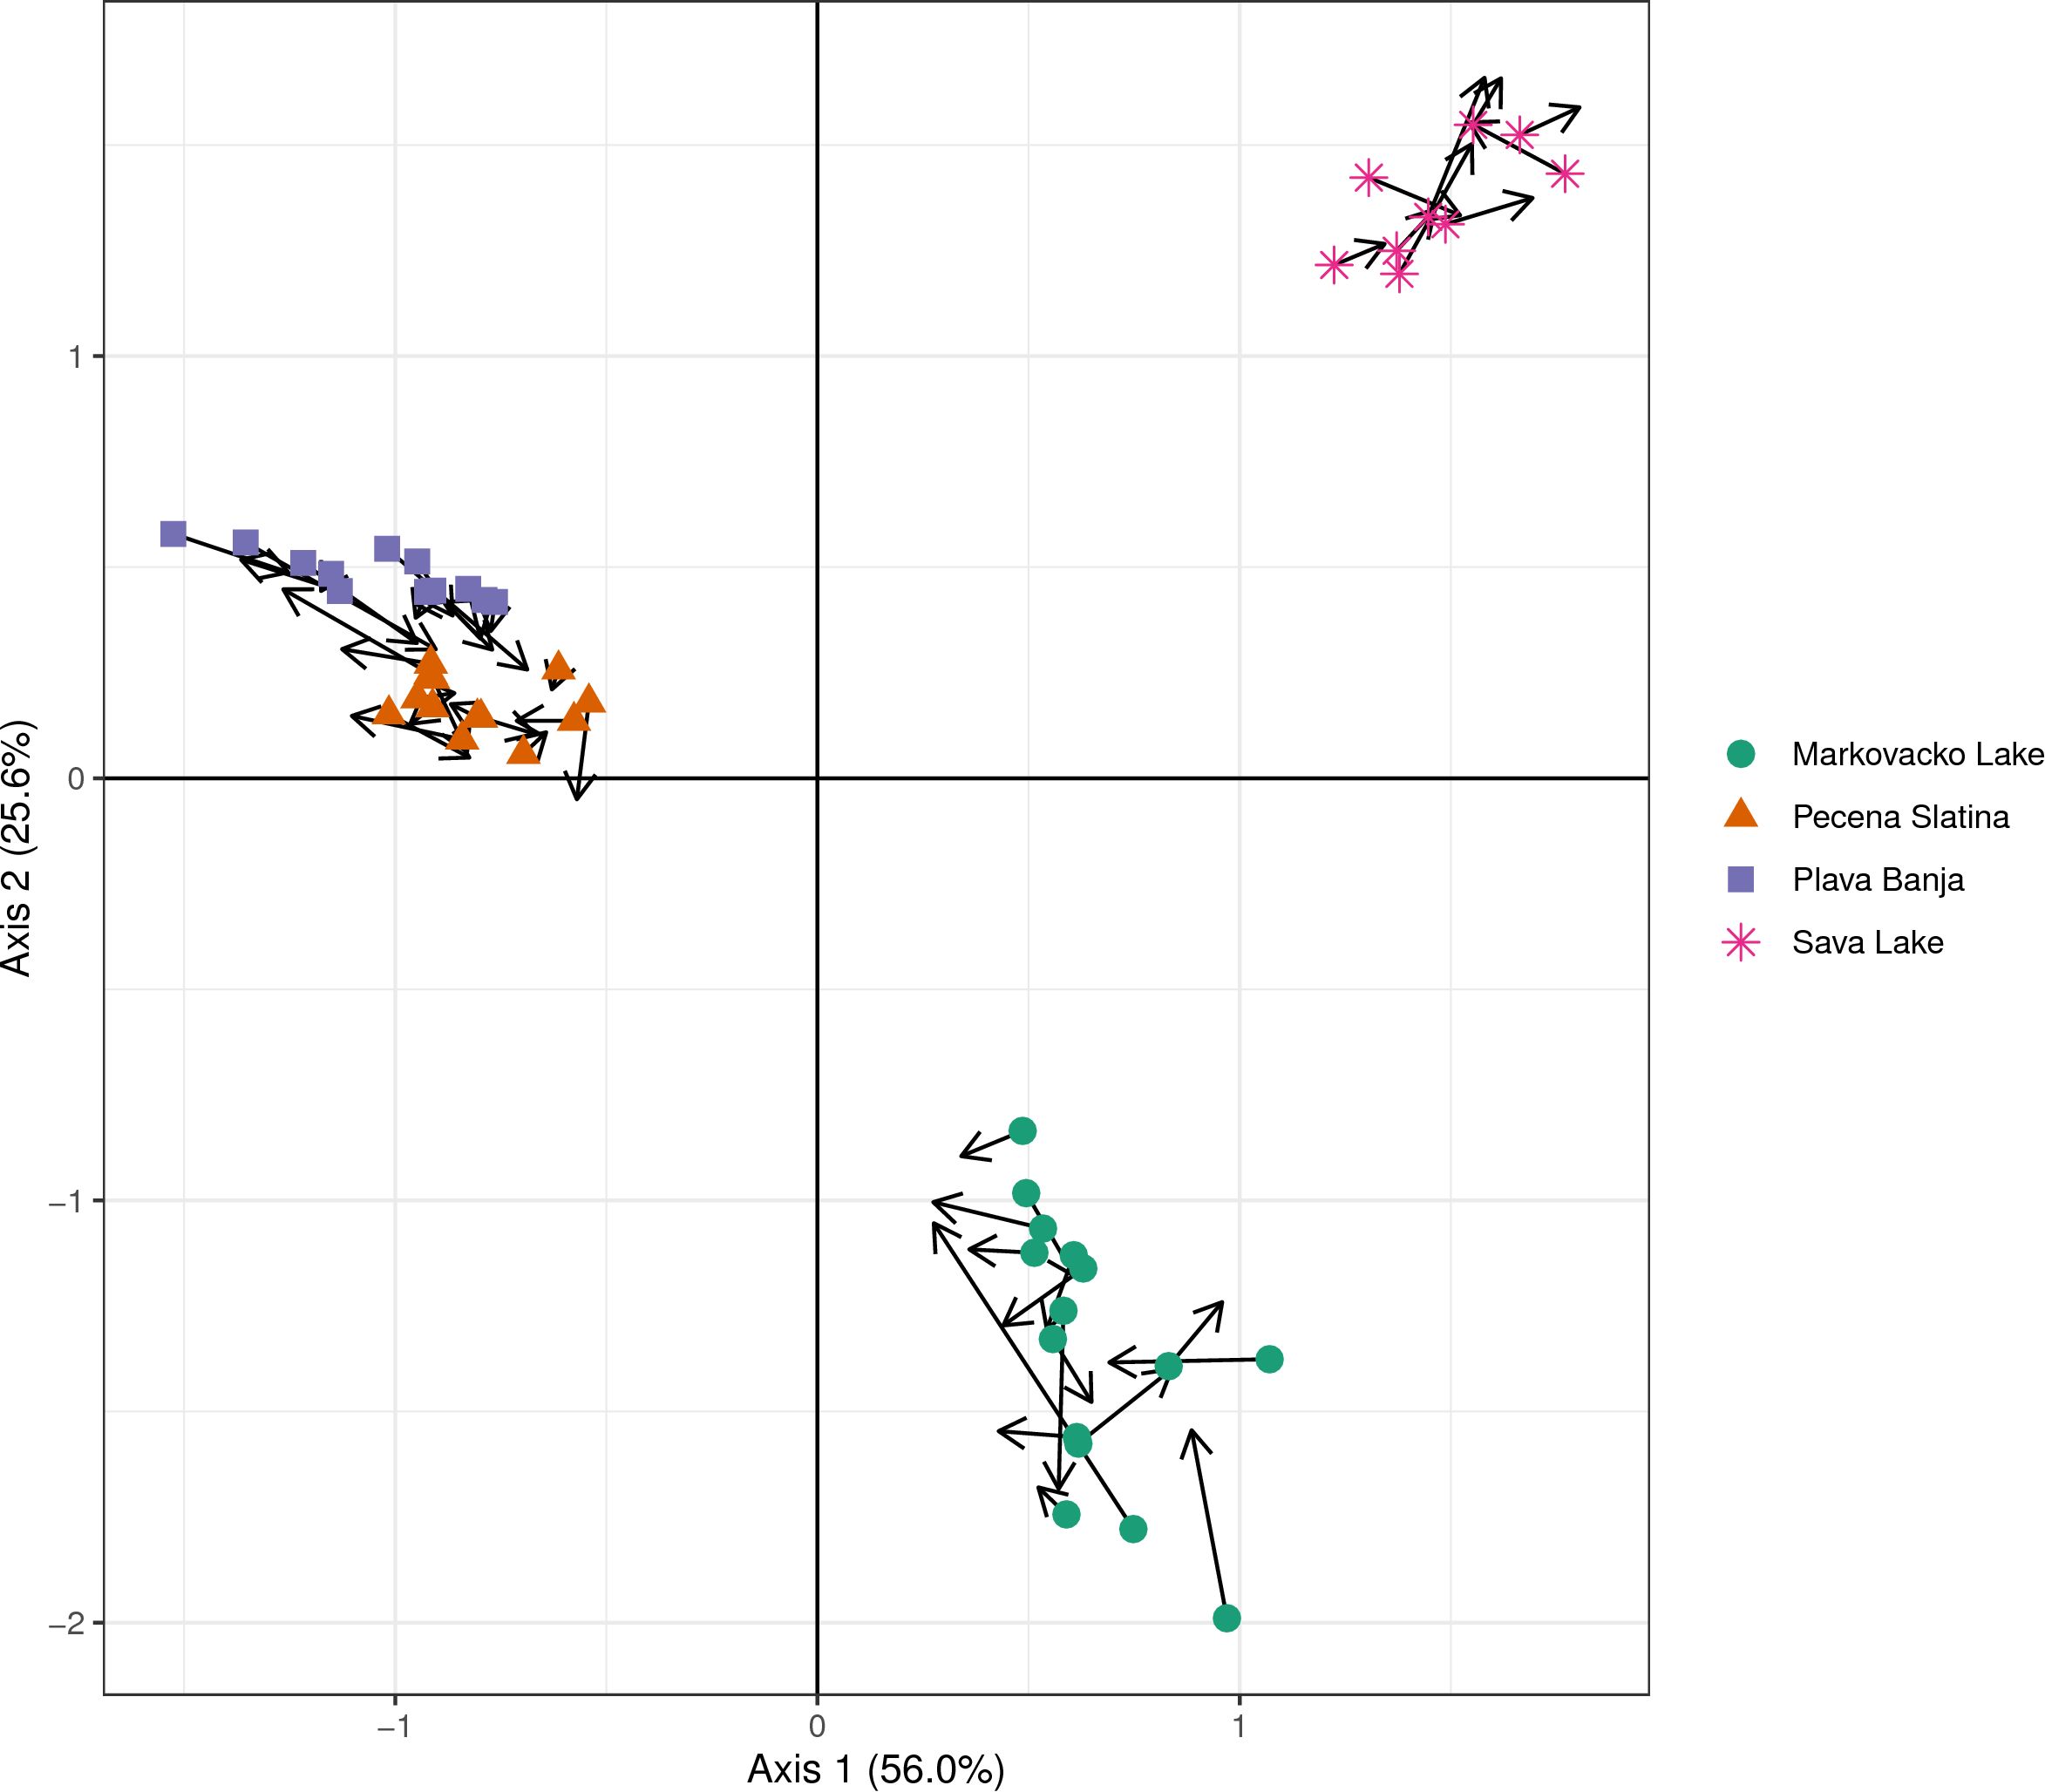
Figure 7. Co-inertia analysis showing the correspondence between diatom community compositions obtained from microscopy and metabarcoding. Arrows link the same sample as represented in the two datasets, with arrow length indicating the degree of discrepancy between methods.
3.5 Diatom indices
3.5.1 Freshwater lakes
A comparison of diatom indices between metabarcoding and microscopy for Markovačko Lake revealed partial agreement between the methods (Figure 8; Supplementary Table 3). Both approaches generally assigned the lake from moderate to good ecological potential, with Rott TI and TDIL showing lower scores through the samples (moderate to bad ecological potential). Microscopy tended to indicate slightly better ecological quality based on IBD, IPS, and TDIL, while metabarcoding showed higher values for Rott SI. The percentage of abundance represented by taxa with assigned index values was highest for the IPS and IBD indices in both approaches (≈87–96% on average), whereas Rott SI, Rott TI, and TDIL remained below 50% and showed larger discrepancies, with TDIL differing by over 20% between approaches.
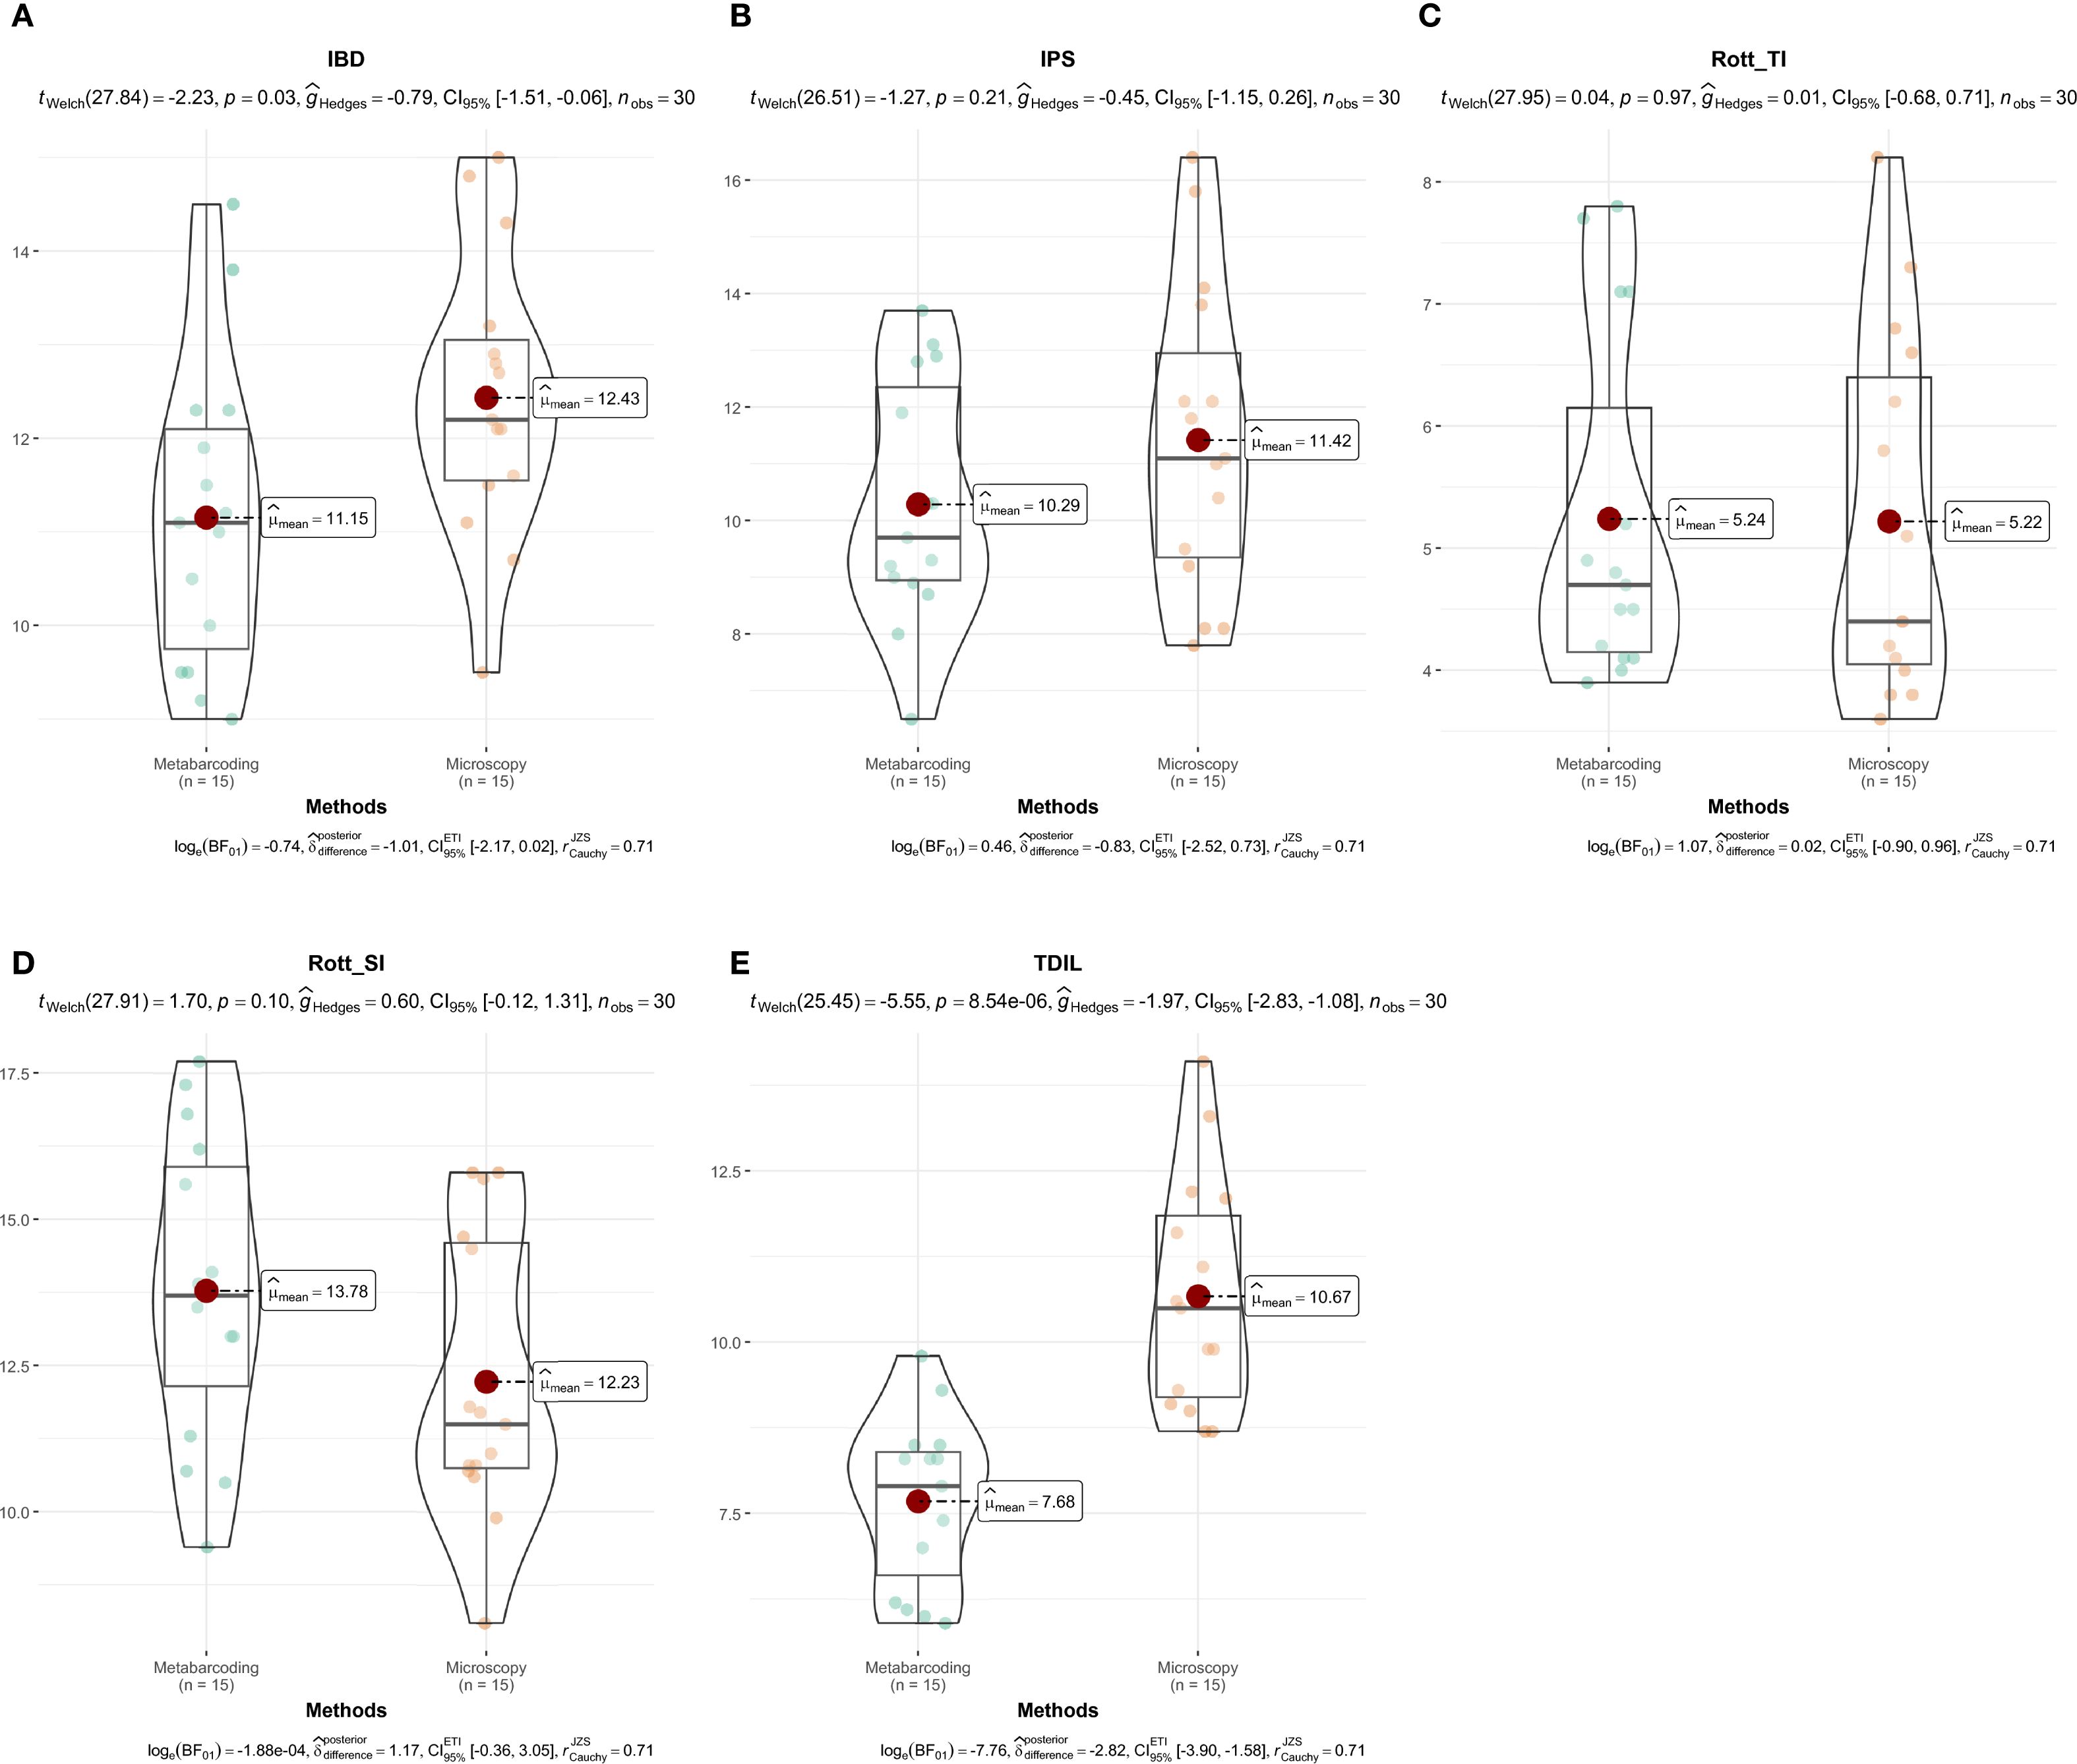
Figure 8. Comparison of diatom index values derived from microscopy and metabarcoding in Markovačko Lake. IBD (A), IPS (B), Rott TI (C), Rott SI (D), TDIL (E). Differences in diatom index values between identification methods were visualized using the “ggstatsplot” package (Patil, 2021).
In Sava Lake, the comparison of diatom indices derived from metabarcoding and microscopy revealed generally consistent ecological potential assessments (Figure 9; Supplementary Table 3). Both methods placed the lake predominantly in the good to very good ecological potential range. Metabarcoding tended to produce slightly elevated scores, particularly for the IPS, while for the IBD, both approaches mostly indicated good ecological potential, with only minor divergence. In contrast, Rott SI indicated a better ecological potential when based on microscopy (very good), compared to metabarcoding where it was classified as good. In Sava Lake, Rott TI and TDIL showed broad agreement between methods, with Rott TI indicating moderate trophic conditions and TDIL reflecting moderate to good ecological potential. The percentage of abundance represented by taxa with assigned index values was again highest for IPS and IBD (IPS ~97–100%, IBD ~84–97%), with IPS displaying the smallest difference between microscopy and metabarcoding (3.1%). In contrast, Rott SI and TDIL showed the greatest inconsistencies (≈20–23% difference), while Rott TI showed slightly more stable patterns(11.9%).
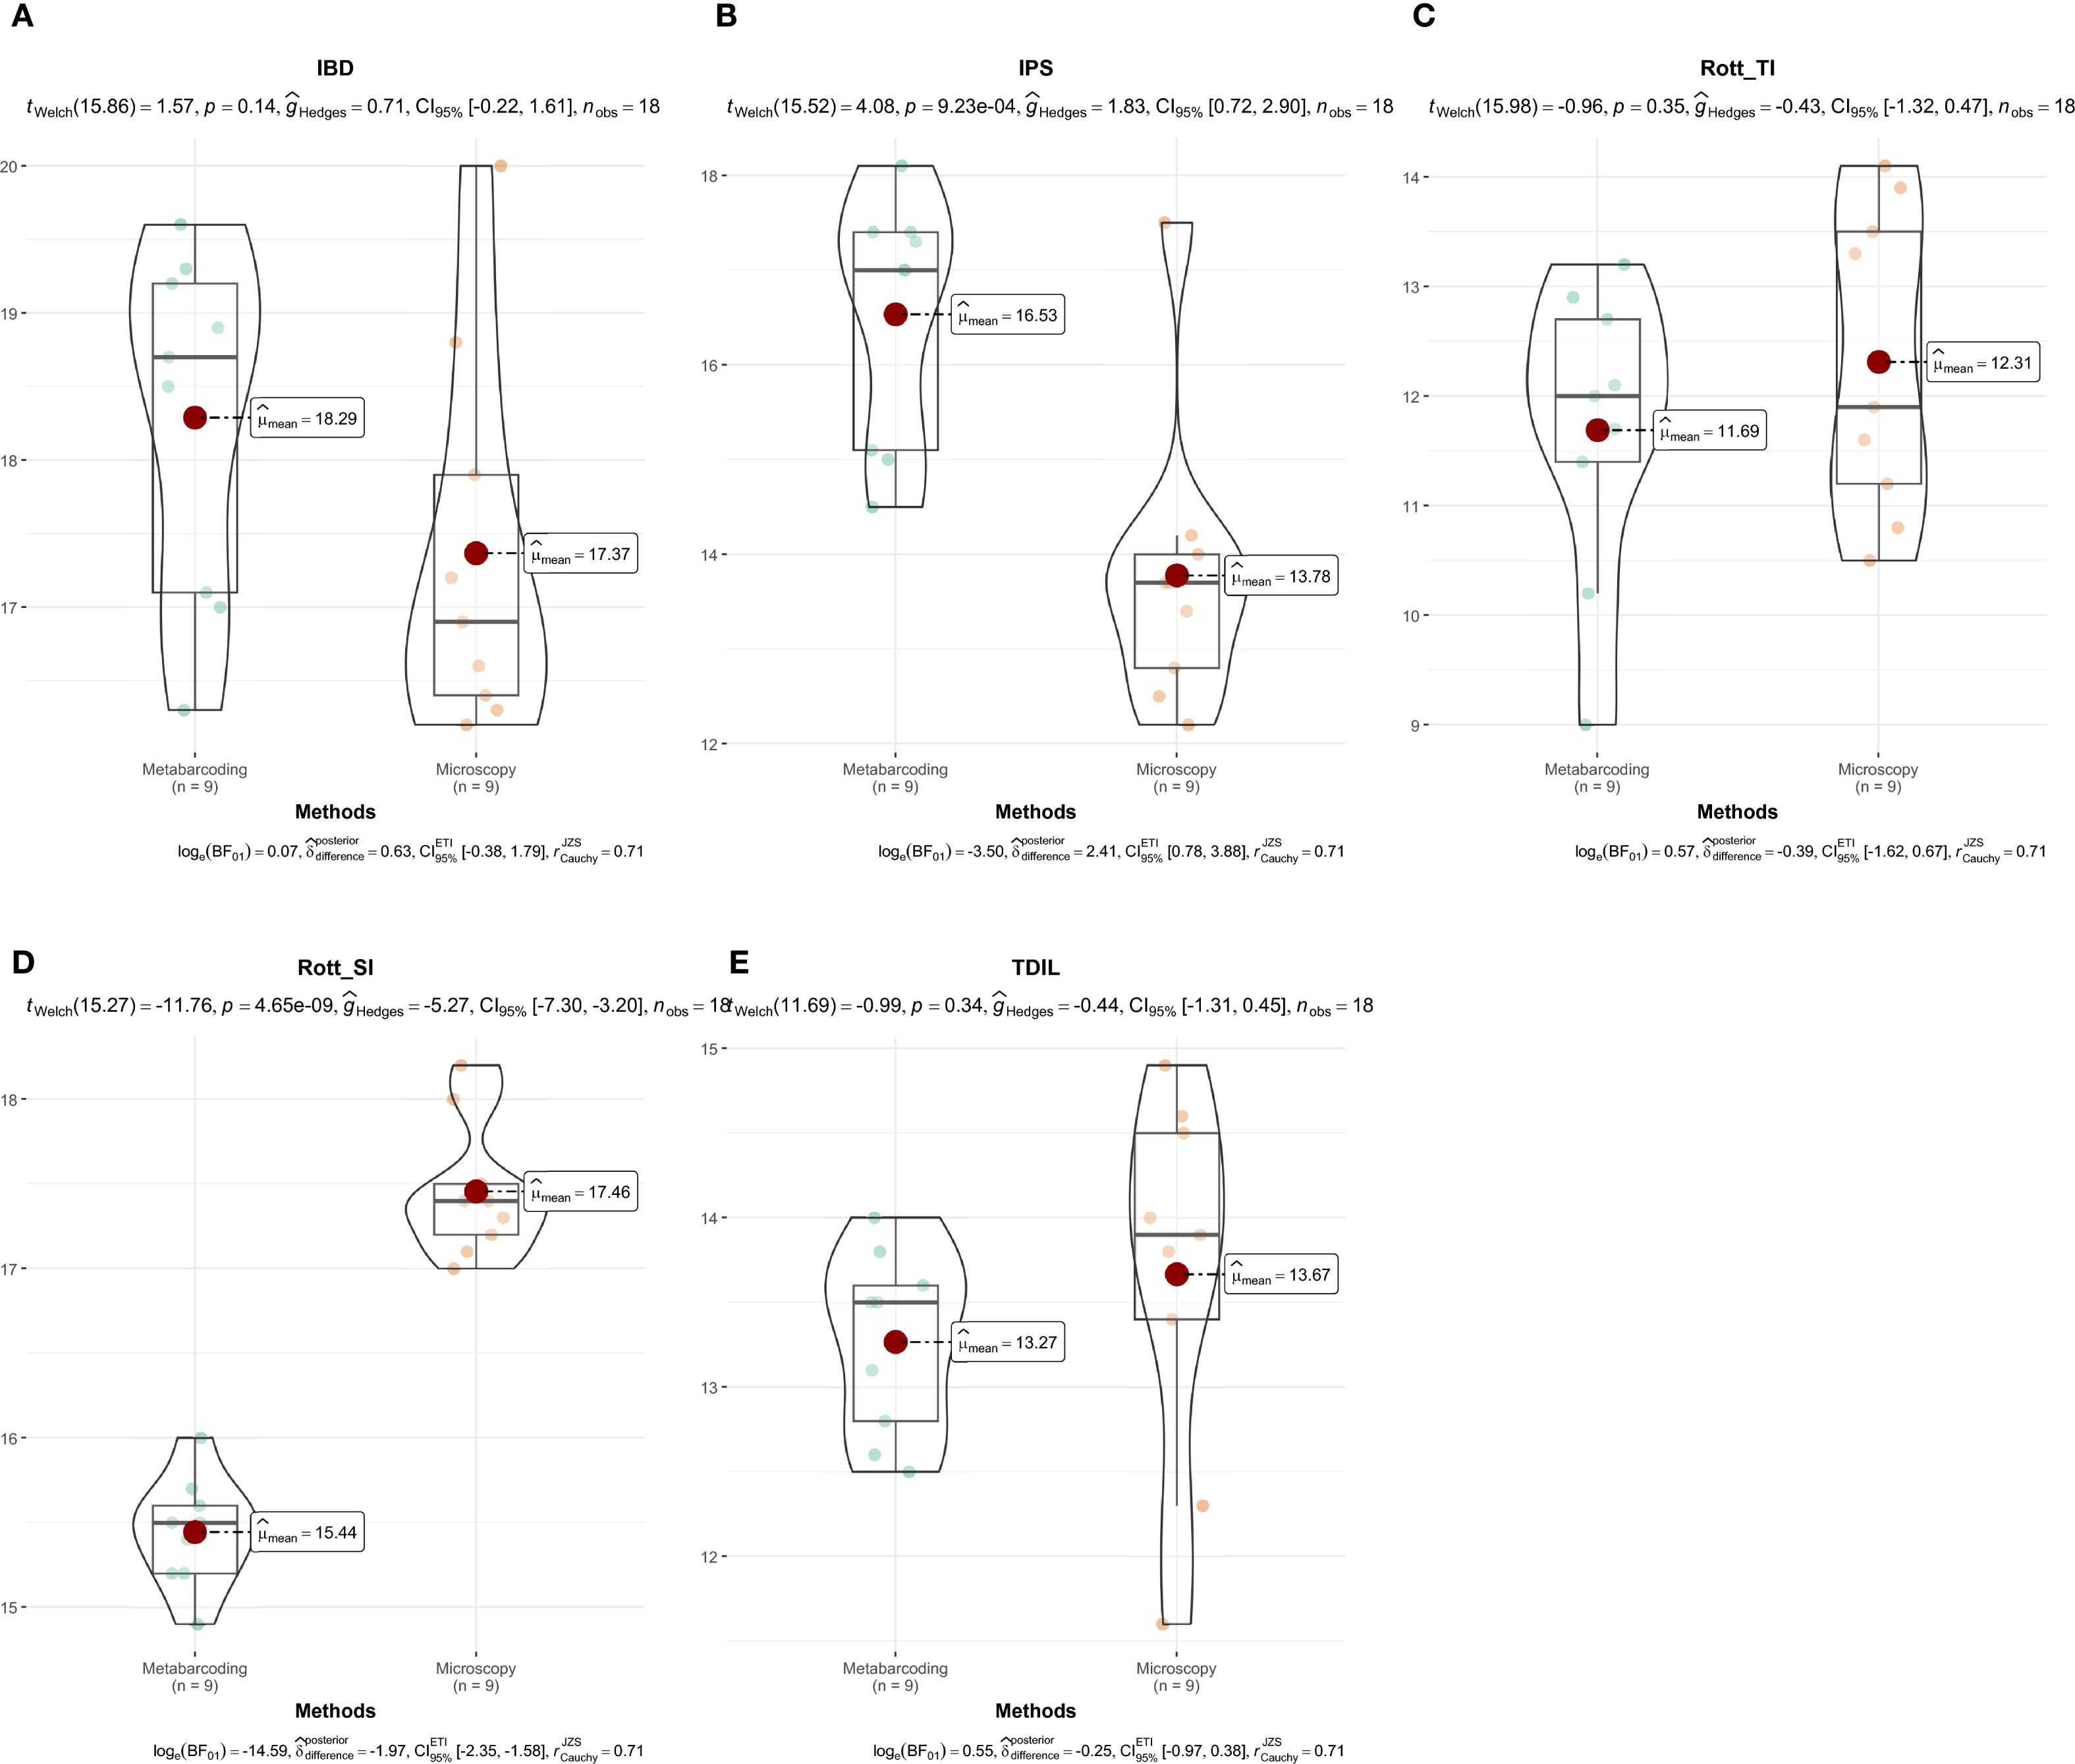
Figure 9. Comparison of diatom index values derived from microscopy and metabarcoding in Sava Lake. IBD (A), IPS (B), Rott TI (C), Rott SI (D), TDIL (E). Differences in diatom index values between identification methods were visualized using the “ggstatsplot” package (Patil, 2021).
3.5.2 Saline lakes
Results for the saline-specific indices and the percentage of abundance represented by taxa with assigned index values are provided in Supplementary Table 4. In Plava Banja, DISP values were higher when calculated from metabarcoding data than from microscopy. In contrast, TBI values were comparable across methods, with no significant difference observed (Figure 10). The relative value of both indices is closer to the upper limit of the index value, indicating a good ecological potential of Plava Banja. Only DISP showed a statistically significant difference between approaches. The percentage of abundance represented by taxa with assigned index values was notably higher in microscopy for both indices. Microscopy showed notably higher coverage for both DISP (avg. 79.6% vs. 51.5%) and TBI (80.1% vs. 57.2%), with large differences between approaches (30.7% for DISP and 27.1% for TBI), indicating reduced agreement in taxonomic coverage.
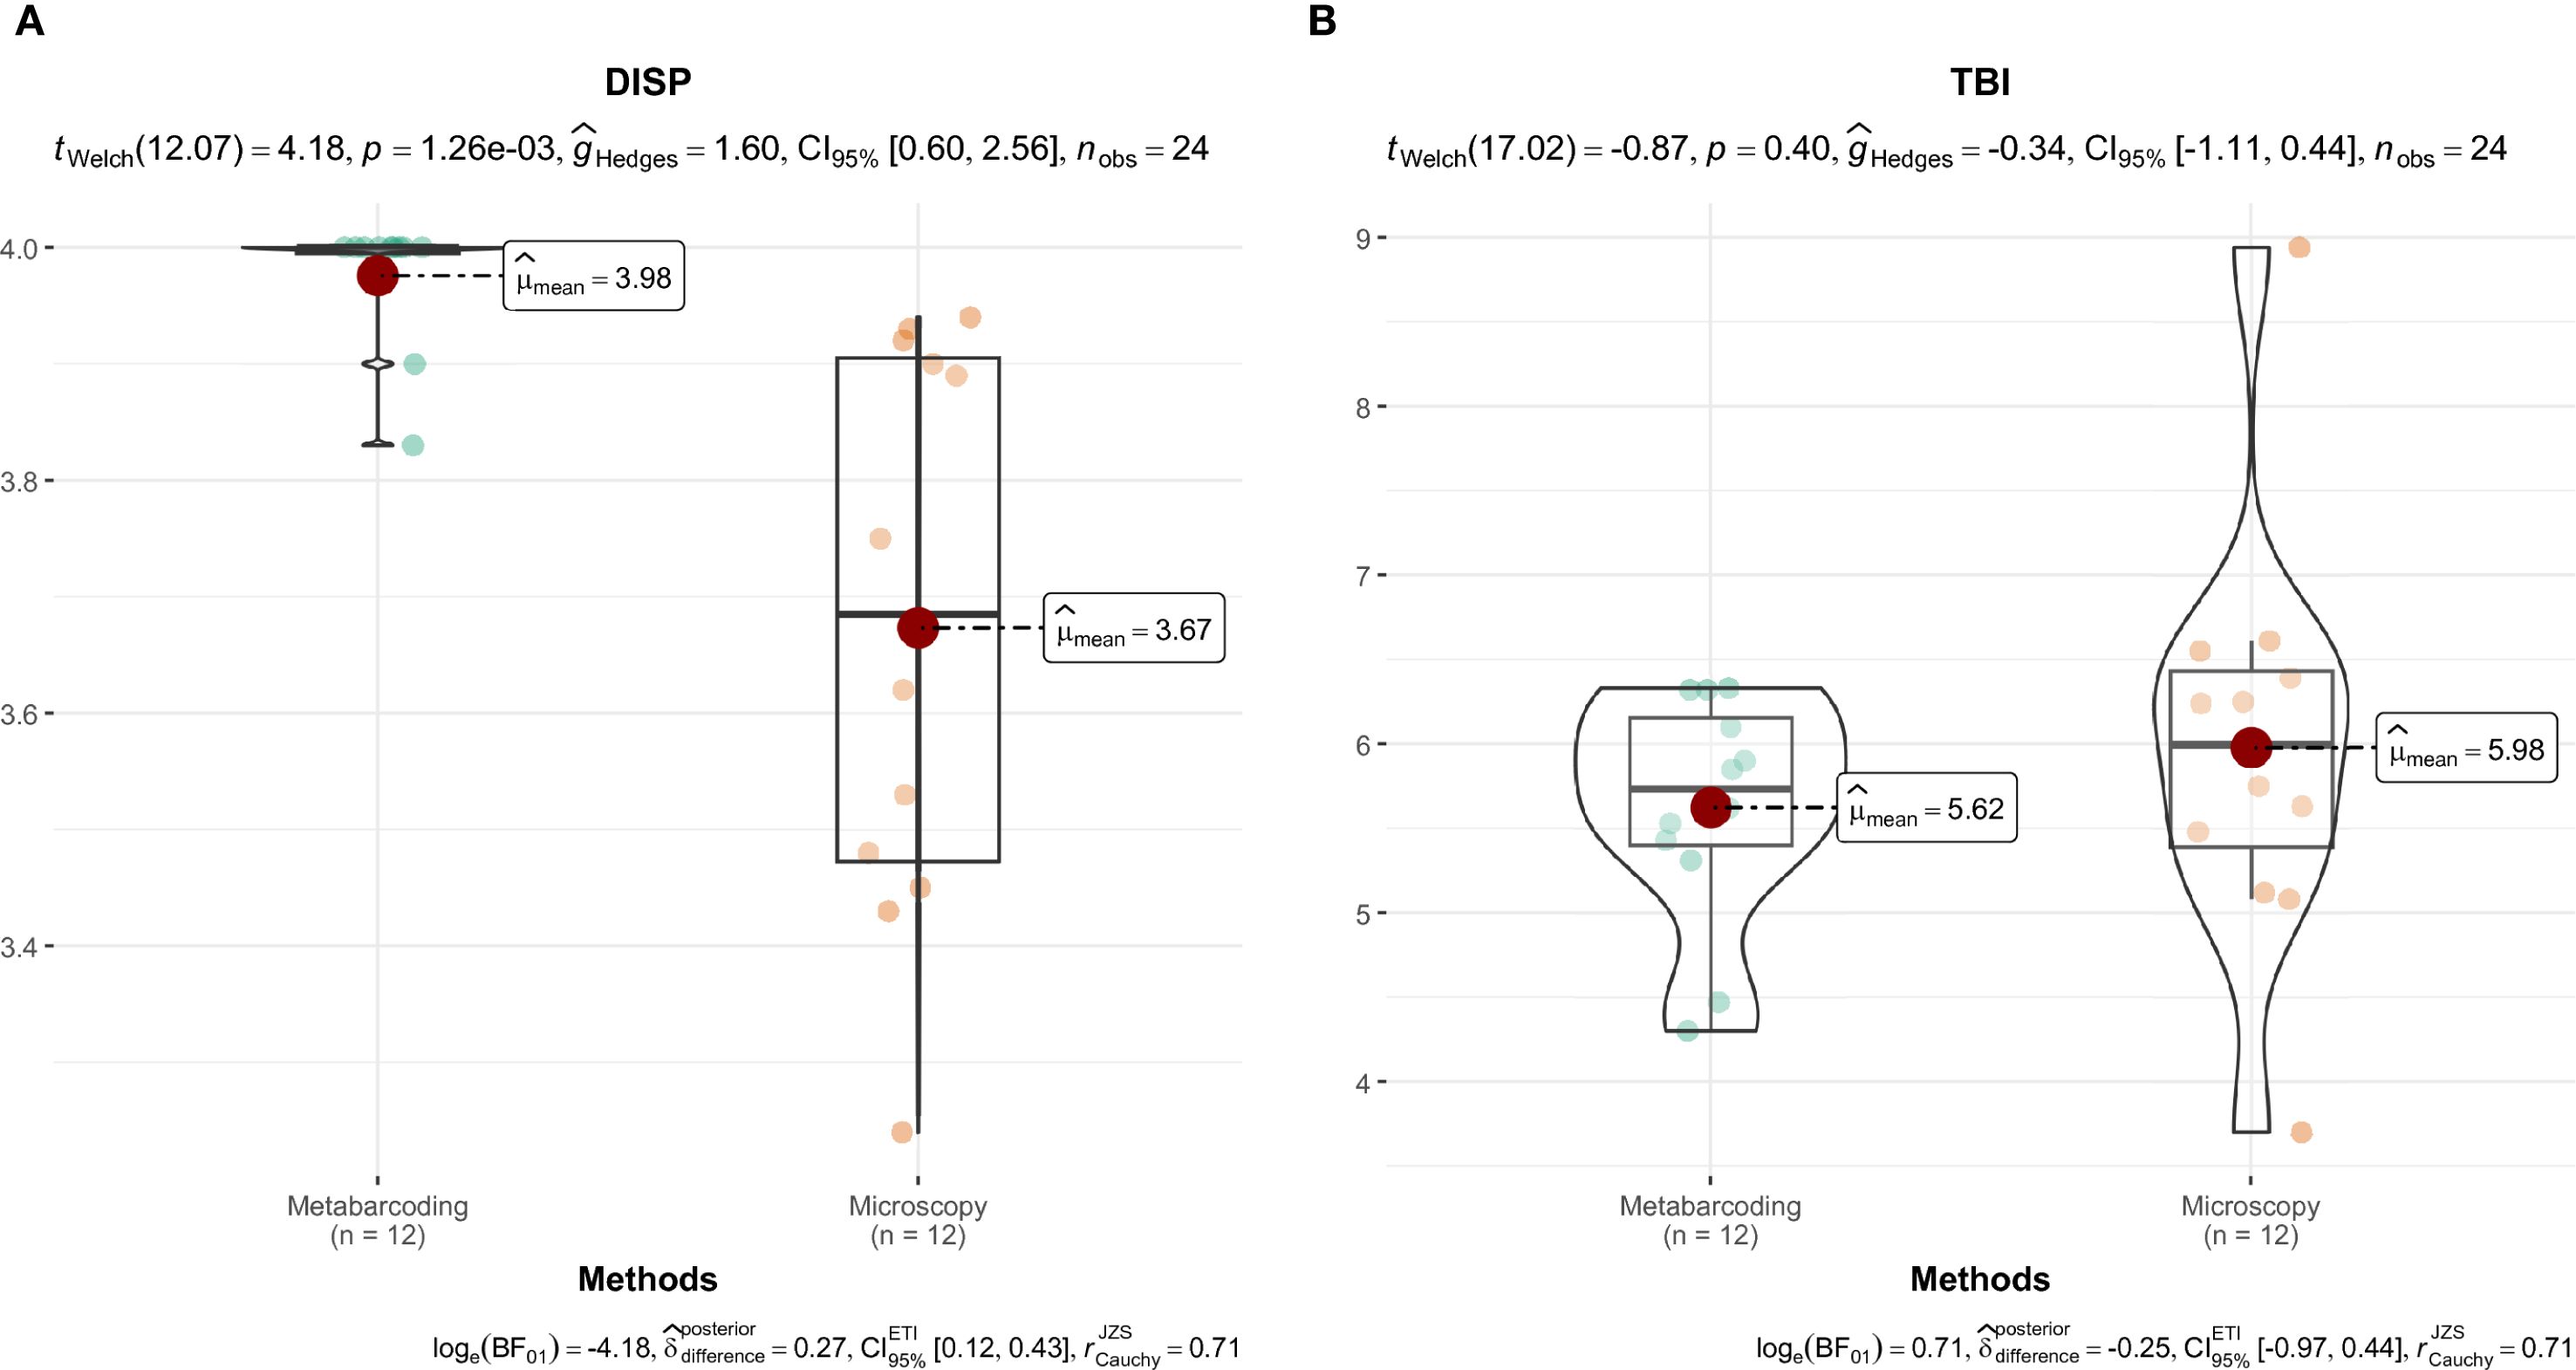
Figure 10. Comparison of diatom index values derived from microscopy and metabarcoding in Plava Banja. DISP (A), TBI (B). Differences in diatom index values between identification methods were visualized using the “ggstatsplot” package (Patil, 2021).
In Pečena Slatina, values of the saline-specific diatom indices are comparable across methods, and the relative values are closer to the upper limit of the index value, indicating the good ecological status of the lake (Figure 11; Supplementary Table 4). The percentage of abundance represented by taxa with assigned index values was markedly higher in microscopy than in metabarcoding for both indices. Microscopy showed higher coverage than metabarcoding for DISP (avg. 96.8% vs. 65.0%) and TBI (91.5% vs. 65.5%), with average absolute differences of 20.4 and 18.5 percentage points, highlighting substantial divergence in taxonomic coverage despite overall agreement in ecological status.
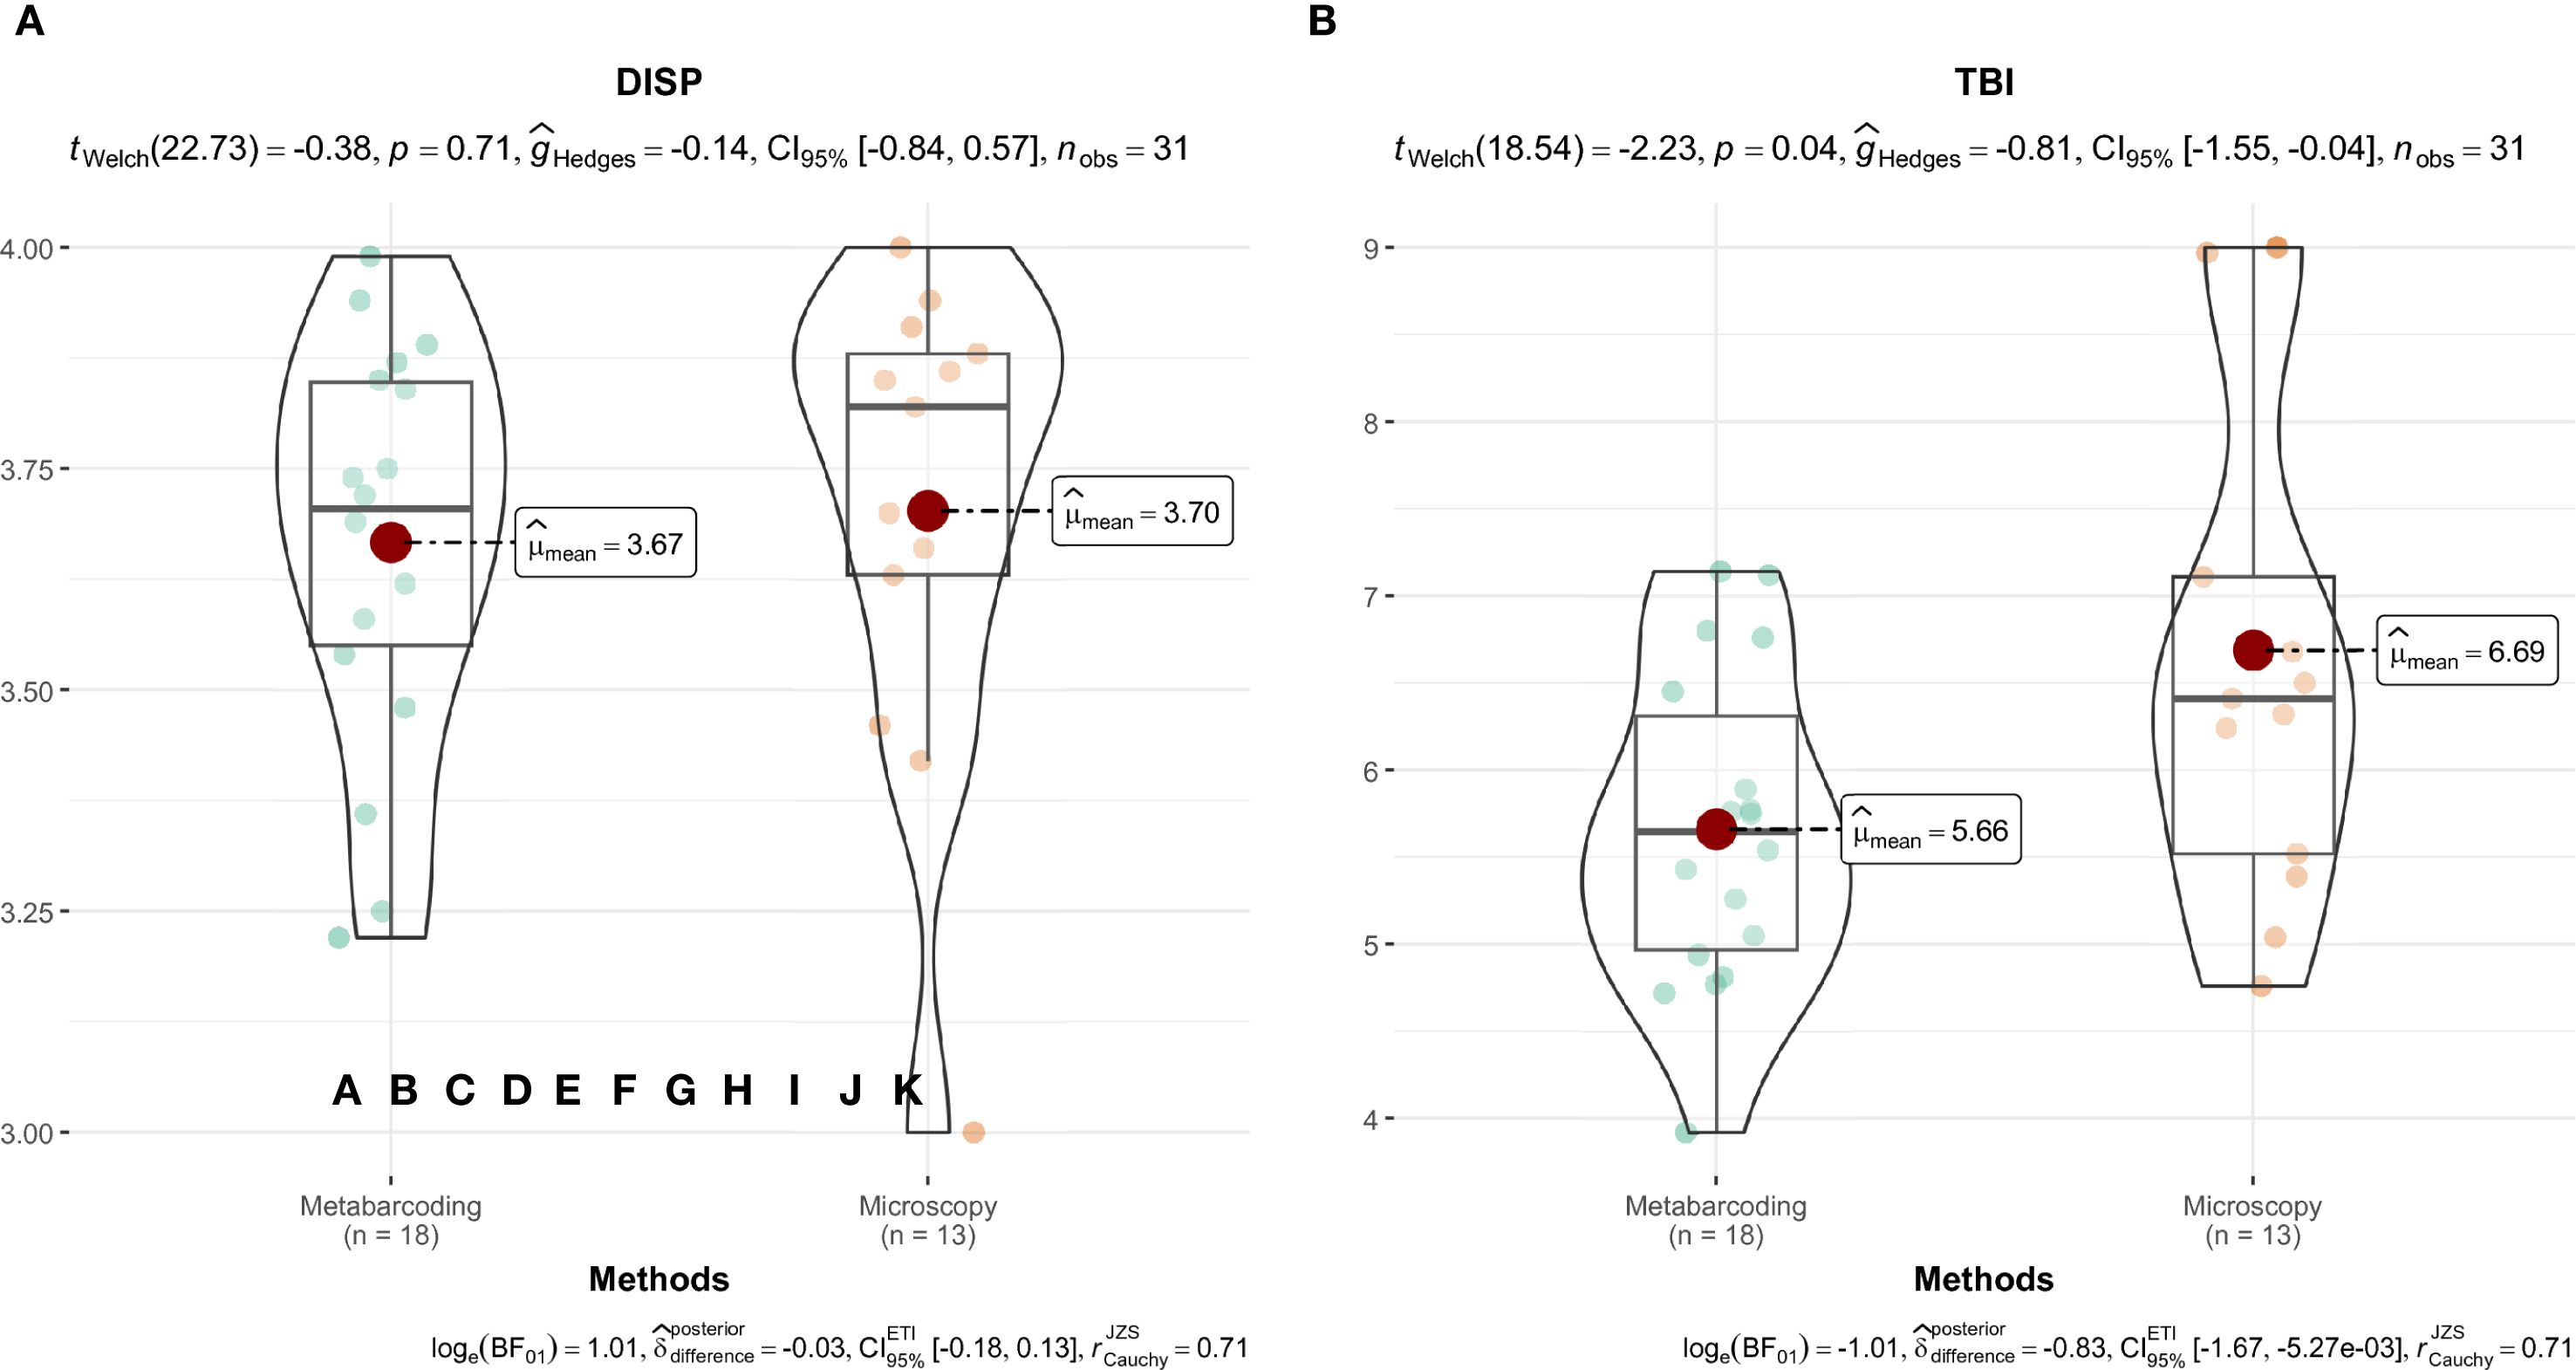
Figure 11. Comparison of diatom index values derived from microscopy and metabarcoding in Pečena Slatina. DISP (A), TBI (B). Differences in diatom index values between identification methods were visualized using the “ggstatsplot” package (Patil, 2021).
4 Discussion
4.1 Environmental context of diatom alpha diversity patterns
The environmental distinction between freshwater and saline lakes, already evident from their physical and chemical profiles, provides an ecological basis for the observed differences in diatom diversity. Freshwater systems were characterized by stable, oxygen-rich conditions, low nutrient availability, and moderate conductivity, consistent with an oligotrophic to mesotrophic status. Their carbonate-buffered, calcium–magnesium ion compositions likely created chemically stable habitats that support high diatom diversity (Duleba et al., 2021). In contrast, the saline lakes showed high mineralization and strong seasonal fluctuations in pH and conductivity, driven by intense evaporation, ion accumulation, and limited hydrological input. These extreme conditions, particularly high alkalinity and the dominance of sodium and sulfate or chloride ions, impose physiological constraints on diatom survival and reproduction (Stenger-Kovács et al., 2023), likely contributing to the significantly lower diversity observed in saline systems. These environmental differences help explain the lower diatom diversity observed in saline lakes, as detected by both microscopy and metabarcoding.
4.2 Comparison of taxonomic detection between methods
Overall, metabarcoding and microscopy approaches yielded a comparable number of taxa across all four lakes combined, with a slight advantage for metabarcoding (227 vs. 212 taxa, respectively). This suggests that both methods captured the main diatom assemblage composition in the studied systems, although some differences in taxon detection were evident between them. When considering shared taxa, both freshwater lakes (Markovačko Lake and Sava Lake) exhibited higher concordance between methods compared to saline lakes (Plava Banja and Pečena Slatina), a trend supported by earlier studies (Ács et al., 2019; Stenger-Kovács et al., 2016). This reduced overlap in saline lakes may reflect a combination of factors. These include method-specific detection biases, such as the preferential amplification of certain taxa in metabarcoding (Kermarrec et al., 2013; Bailet et al., 2019). Additional contributing factors are the generally lower taxonomic richness in such habitats (Stenger-Kovács et al., 2018, 2023; Balycheva et al., 2023) and the lack of comprehensive molecular reference coverage for continental halophilic diatom taxa in the reference library, as observed in other soda pans and saline wetlands (Duleba et al., 2021).
4.3 Alpha diversity patterns and method agreement
Species richness and Shannon-Wiener diversity were significantly lower in saline lakes compared to freshwater lakes, as some studies have also noted (Ács et al., 2019; Stenger-Kovács et al., 2007, 2016, 2020, Vidaković et al., 2024). As reported in multiple studies, metabarcoding generally yielded significantly higher species richness (e.g., Fontaine and Rynearson, 2023; Gelis et al., 2024; Rimet et al., 2018). Shannon-Wiener diversity index across the four lakes was slightly higher for the metabarcoding dataset than for microscopy, which could be attributed to the ability of metabarcoding to detect morphologically cryptic and rare species (Amato et al., 2007; Stoof-Leichsenring et al., 2012; Lindeque et al., 2013). Crucially, both methods captured the same ecological gradient, with higher diatom diversity in freshwater lakes. This indicates that the choice of identification method did not alter the overall diversity ranking among lakes, supporting the robustness of the observed pattern.
4.4 Differences in taxon detection between methods
In Markovačko Lake, the dominant taxa detected differed notably between the two methods. While Aulacoseira muzzanensis was consistently dominant in microscopy, it was not detected by metabarcoding. Conversely, A. granulata emerged as the dominant taxon in the metabarcoding dataset, despite being abundant in only a single sample microscopically. The reason for this discrepancy could be varied, those species look similar in light microscopy so it could mean misidentification in either method. Similar detection issues for Aulacoseira have been observed in other studies. For example, Stoof-Leichsenring et al. (2020) found that genetic approaches revealed Aulacoseira diversity patterns not captured by morphological identification, suggesting that the two methods may reflect different aspects of taxonomic resolution within this genus. Regarding microscopy, Discostella pseudostelligera was one of the most dominant taxa, while in the metabarcoding dataset, only low-abundance Discostella sp. was detected, despite having a representative sequence in the reference database. Supported by previous studies (Bailet et al., 2020), discrepancies in Sava Lake were particularly evident among Achnanthidium species, likely due to high sequence similarity in rbcL and taxonomic uncertainty in the database, leading to inconsistent species-level assignments between methods. Generally, A. minutissimum is more dominant according to metabarcoding, while A. eutrophilum dominates according to microscopy. Microscopy offers better resolution for Achnanthidium species when the valve ultrastructure is visible; however, morphological identification remains prone to error due to subtle differences. Encyonopsis microcephala was one of the dominant taxa in microscopy, but not present in metabarcoding.
In Plava Banja, some dominant taxa, such as Nitzschia reskoi (first finding in the diatom flora of Serbia– Sabovljević et al, 2024), Nitzschia frustulum, and Craticula halophila showed good concordance between metabarcoding and microscopy. However, some discrepancies were observed. Craticula aff. simplex was the dominant taxon in several samples based on microscopic analysis, while BLAST verification of Craticula sequences suggests the presence of a potentially new species from the highly alkaline Lake Van (manuscript under review). Navicymbula pusilla was not detected through metabarcoding despite its high relative abundance in the microscopy dataset of both saline lakes, likely due to the absence of reference sequences for this genus in the reference library (Rimet et al., 2019). A notable discrepancy between the two approaches in both saline lakes was the high relative abundance of Chaetoceros muelleri detected through metabarcoding, while the species was absent in microscopy observations. This mismatch can be attributed to the fragile, weakly silicified frustules of C. muelleri, which are prone to fragmentation or dissolution during oxidative cleaning and slide preparation (Zgrundo et al., 2013; Pérez-Burillo et al., 2020). Conversely, the formation of heavily silicified resting spores by this taxon may explain why its DNA remains in the environment and is detected by metabarcoding (Fukai et al., 2025). Anomoeneis sculpta was one of the most dominant taxa in Pečena Slatina regarding metabarcoding, while only A. sphaerophora was observed under microscopy. The discrepancy may be due to misidentification, as A. sculpta was historically considered a form of A. sphaerophora and is now treated as a separate species (Thrash et al., 2018). Nevertheless, Nitzschia frustulum, Nitzschia inconspicua, and Halamphora veneta presented good concordance between microscopy and metabarcoding in Pečena Slatina.
4.5 Environmental structuring of diatom communities
After assessing taxonomic overlap and alpha diversity between microscopy and metabarcoding, we further examined how environmental factors shape diatom community composition in both datasets. Redundancy analysis (RDA) based on each method revealed a clear environmental structuring of the communities, with salinity-related gradients emerging as the dominant drivers.
In both models, freshwater and saline lakes were distinctly separated along the primary RDA axis, highlighting the pivotal role of ionic composition in shaping diatom assemblages—consistent with findings by Duleba et al. (2021) and Potapova and Charles (2003). Among all measured environmental variables, conductivity consistently appeared as the strongest structuring factor, underscoring its robust ecological influence.
Most key environmental variables identified as significant were shared between the two methods, suggesting that microscopy and metabarcoding capture broadly similar ecological gradients. However, the metabarcoding-based RDA explained a larger proportion of variance and reached stronger statistical significance. This indicates a higher sensitivity in detecting environmental patterns, likely due to its ability to reveal rare, cryptic, or morphologically indistinct taxa that are often overlooked in microscopic analysis (Amato et al., 2007; Stoof-Leichsenring et al., 2012).
While some divergence in detected environmental drivers was observed, this suggests a complementary nature of the two approaches. Differences in taxonomic resolution, detection thresholds, and trait-based sensitivities likely contribute to their respective strengths. Still, the overall consistency in lake grouping and shared environmental gradients across both methods supports the reliability and robustness of ecological interpretations derived from these analyses.
4.6 Methodological concordance in community composition
We have shown that there is co-structure in diatom assemblages characterized by microscopy and metabarcoding, indicating a strong concordance between the two methods. The results of coinertia indicated that despite methodological differences and taxonomic mismatches, both approaches captured comparable gradients in community composition. A similar conclusion was drawn by Duleba et al. (2021), who found a significant correlation between methods in terms of both community composition. These results demonstrate that, while metabarcoding offers finer taxonomic resolution, the overall ecological patterns across lakes are reliably reflected by both approaches.
Altogether, the results of multivariate analyses and statistical tests indicate that both microscopy and metabarcoding captured clear ecological gradients and produced comparable community patterns across freshwater and saline lakes, supporting their utility in bioassessment. This ability to reflect environmental structure is fundamental in molecular biomonitoring, where such ecological responses are essential for the development of robust biotic indices (Tapolczai et al., 2019).
4.7 Use of diatom indices
4.7.1 Freshwater lakes
In freshwater lakes, diatom index values derived from microscopy and metabarcoding revealed partial to good agreement overall. In both Markovačko Lake and Sava Lake, IPS and IBD consistently stood out as the most robust and reliable indices, with high taxonomic coverage and relatively small differences between methods. Specifically, in Markovačko Lake, IPS and IBD each covered over 85% of the diatom community abundance on average, with IPS exceeding 90% in both microscopy and metabarcoding. Similarly, in Sava Lake, IPS and IBD covered over 84% of community abundance on average, with IPS showing the highest and most consistent coverage—exceeding 94%. Although the index values differed between methods for IPS, the coverage difference between methods was the smallest among all indices. This high coverage suggests that their scores are based on a substantial portion of the diatom community, increasing their ecological reliability in both lakes.
In contrast, other indices such as Rott SI, Rott TI, and TDIL showed lower taxonomic coverage and greater variability between methods. In Markovačko Lake, these indices incorporated less than 50% of the total abundance on average, with TDIL showing the highest discrepancy in taxa coverage. Similarly, in Sava Lake, Rott SI and Rott TI showed strong contrasts between methods but also exhibited low taxonomic coverage, representing less than 50% of total diatom abundance, which reduces the reliability of their ecological assessments. Notably, the TDIL index, developed specifically for Hungarian lakes, includes a limited set of indicator species, which likely explains its low coverage in our samples (Bolla et al., 2010).
Discrepancies between methods may reflect differences in taxon detection, as some taxa contributing to index scores may have been under- or overrepresented depending on the approach used (Vasselon et al., 2017b). For example, differences in the identification of dominant Aulacoseira taxa—A. muzzanensis, typically associated with oligo- to eutrophic conditions (Bicudo et al., 2016), versus A. granulata, characteristic of eutrophic environments (Van Dam et al., 1994)—could have influenced index scores, particularly those sensitive to trophic state. Overall, these findings highlight the importance of taxonomic coverage and indicator value completeness when applying molecular bioassessment in different freshwater systems.
4.7.2 Saline lakes
DISP and TBI indices have been developed to evaluate ecological status in soda lakes in Hungary (Stenger-Kovács et al., 2018), and until now, their use on metabarcoding data has not been tested. When tested on two saline lakes in Serbia, both indices yielded values that were close to the upper limit of the index scale. In Plava Banja, results for saline-specific indices revealed a partial agreement between microscopy and metabarcoding, while in Pečena Slatina yielded comparable values across microscopy and metabarcoding. However, in both lakes, microscopy consistently captured a higher average of total abundance (over 79% in Plava Banja and over 90% in Pečena Slatina) than metabarcoding (around 51–65%), highlighting limitations in the molecular approach. Therefore, it is important to recognize the methodological limitations of applying indices to saline lakes when using a molecular approach. TBI relies on biovolume-weighted trait metrics, which require the accurate estimation of each taxon’s cell size (Stenger-Kovács et al., 2018). Microscopy gives the ability to directly measure cell dimensions in the sample, allowing biovolume estimation even when taxonomic identification is incomplete. In contrast, because metabarcoding does not provide morphological data, taxa that are not identified to the species level limit the calculation of biovolume, making it impossible to assign a reliable biovolume estimate. In our saline lakes, 19 taxa from the metabarcoding dataset did not have data about biovolume (mostly taxa lacking species-level identification or recently described species), of which several are among the most dominant taxa in one or both lakes, such as Nitzschia reskoi, Navicula sp., Anomoeneis sculpta, Chaetoceros muelleri, and others. In contrast to trait-based indices, DISP is based on species-specific ecological optima (primarily conductivity tolerance) and does not require biovolume estimates, making it more robust across both identification methods. As noted by Stenger-Kovács et al. (2018), DISP includes a broader species pool and shows a consistent response to conductivity compared to previous indices. The calculation of the index relies on the indicator and sensitivity values given by the authors. However, not all taxa included in the datasets could be used in the index due to missing ecological values. In the microscopy dataset, a total of 15 taxa lacked DISP indicator and sensitivity values, but only three of these were dominant taxa—Halamphora coffeaeformis, Nitzschia reskoi, and Navicula praeterita—while the remaining were of minor abundance and unlikely to affect the index outcome significantly. In the metabarcoding dataset, 24 taxa lacked DISP values, including 11 dominant taxa such as Chaetoceros muelleri, Anomoneis sculpta, Nitzschia angusta, and N. reskoi, which may have had a greater influence on the final index values.
These results highlight a key limitation in the application of saline-specific indices to metabarcoding datasets. Although both DISP and TBI generally indicated good ecological potential/status, a substantial proportion of abundant and even dominant taxa detected via metabarcoding lacked assigned indicator values. This contrasts with the microscopy dataset, where most taxa without DISP values were of minor abundance and unlikely to affect index performance. The underrepresentation of ecologically relevant taxa in the index calculations for metabarcoding points to an important gap in current reference databases for saline environments. The lower percentage of community abundance represented by taxa included in index calculations—particularly in metabarcoding (9% in some samples)—further undermines the robustness and comparability of index outputs. While diatom indices show promise for molecular bioassessment, particularly in freshwater systems, their reliability in saline habitats remains limited. It should be interpreted with caution until taxonomic coverage and corresponding indicator values are improved.
While both indices provided broadly comparable ecological status/potential across methods in our study, it is important to recognize a methodological limitation in the application of trait-based indices such as TBI to metabarcoding data. Our results show that metabarcoding detects higher diatom richness and diversity than morphological identification in both freshwater and saline lakes, contrary to our initial assumption. In terms of bioassessment, metabarcoding has some limitations in saline lakes, primarily due to gaps and misidentifications in reference libraries and morphological trait values. Overall, while metabarcoding showed strong potential, especially in freshwater lakes, combining both methods provides a more complete and accurate assessment, particularly in complex environments like inland saline lakes. This research contributed new sequences to the updated version of the Diat.barcode database, V13 (https://doi.org/10.15454/TOMBYZ), thereby supporting and facilitating its broader use in future research.
4.8 Limitations of the study
Despite providing valuable insights, our study is subject to certain limitations that may influence the interpretation and generalization of the findings. Sampling was conducted in spring, summer, and autumn; potential seasonal dynamics in winter were not captured. Several discrepancies between microscopy and metabarcoding can be attributed to limitations in the diat.barcode reference database (Rimet et al., 2019). Aulacoseira muzzanensis was not present in the reference database. The reference library contains a better representation of A. minutissimum compared to A. eutrophilum (169 to 9), which increases the likelihood of ambiguous reads being classified under this name. Encyonopsis microcephala was absent in metabarcoding, likely due to only a single sequence entry in the database. Similarly, Navicymbula pusilla was not detected by metabarcoding despite high abundance in microscopy, reflecting the absence of reference sequences for this genus. Such deficiencies increase the likelihood of misclassifications and reduce the reliability of metabarcoding for certain taxa. In addition, the application of diatom diversity indices was limited by incomplete taxonomic coverage. The metabarcoding approach does not provide morphological traits such as cell size or biovolume, which restricts the applicability of trait-based indices like TBI. Finally, the ecological indices applied in this study (e.g., TDIL, DISP, TBI) were originally developed for different lake types and showed limited taxonomic coverage in our systems, which may reduce the robustness of ecological assessments.
Future research should focus on enhancing and expanding curated reference libraries, as well as integrating morphological trait data into molecular pipelines. For some taxa (e.g., Navicymbula), cultivation and barcoding are necessary to complete the database. Such efforts will help close the gap between microscopy and metabarcoding, thereby increasing the reliability and comparability of ecological assessments.
5 Conclusion
This study highlights both the strengths and current limitations of using rbcL-based metabarcoding in lake biomonitoring. While the molecular approach offers promising advantages, such as higher taxonomic resolution and the ability to detect rare or cryptic taxa, it cannot yet replace traditional microscopy-based methods, particularly in saline environments. The effectiveness of metabarcoding is currently constrained by incomplete and unevenly curated reference libraries, as well as taxonomic biases that may lead to misidentification or underrepresentation of ecologically essential taxa. To help improve this, we have contributed our ASV sequences to the Diat.barcode reference library, and we encourage other users to do the same — collective contributions are key to strengthening open-access taxonomic resources for diatom biomonitoring. To fully integrate DNA-based methods into routine bioassessment, especially in extreme habitats like inland saline lakes, reference libraries should be refined to include the taxa characteristic of these systems. Until then, combining morphological and molecular approaches gives complementary results as well as accurate and robust ecological assessments.
Data availability statement
The datasets presented in this study can be found in online repositories. The names of the repository/repositories and accession number(s) can be found in the article/Supplementary Material.
Author contributions
LV: Writing – original draft, Formal Analysis, Visualization, Methodology, Investigation. CL: Methodology, Writing – review & editing, Validation. BA: Validation, Writing – review & editing, Formal Analysis. FR: Data curation, Conceptualization, Writing – review & editing. MĆ: Investigation, Writing – review & editing, Validation. SM: Writing – review & editing, Methodology. ŽM: Investigation, Writing – review & editing, Methodology. VP: Writing – review & editing, Methodology. DV: Methodology, Investigation, Conceptualization, Supervision, Writing – review & editing.
Funding
The author(s) declare financial support was received for the research and/or publication of this article. This work has received funding from the European Union’s Horizon research and innovation programme under grant agreement No. 101079234 (BIOLAWEB project).
Acknowledgments
Ljubica Vlaović wants to express her gratitude to the Ministry of Science, Technological Development and Innovation of the Republic of Serbia (Grants No. 451-03-136/2025-03/200178 and No. 451-03-1041/2024-03/2/3322) for support.
Conflict of interest
The authors declare that the research was conducted in the absence of any commercial or financial relationships that could be construed as a potential conflict of interest.
The reviewer ABC declared a past co-authorship with the author DV to the handling editor.
Generative AI statement
The author(s) declare that Generative AI was used in the creation of this manuscript. AI was used to refine English syntax.
Any alternative text (alt text) provided alongside figures in this article has been generated by Frontiers with the support of artificial intelligence and reasonable efforts have been made to ensure accuracy, including review by the authors wherever possible. If you identify any issues, please contact us.
Publisher’s note
All claims expressed in this article are solely those of the authors and do not necessarily represent those of their affiliated organizations, or those of the publisher, the editors and the reviewers. Any product that may be evaluated in this article, or claim that may be made by its manufacturer, is not guaranteed or endorsed by the publisher.
Supplementary material
The Supplementary Material for this article can be found online at: https://www.frontiersin.org/articles/10.3389/fevo.2025.1677773/full#supplementary-material
Supplementary Figure 1 | Principal component analysis (PCA) of environmental parameters on freshwater and saline lakes.
Supplementary Table 1 | Values of physical and chemical parameters of the investigated lakes in Serbia.
Supplementary Table 2 | List of diatom taxa in the investigated lakes in Serbia with the four-letter OMNIDIA Code and their relative abundance.
Supplementary Table 3 | Markovačko Lake and Sava Lake – Diatom indices.
Supplementary Table 4 | Plava Banja and Pečena Slatina – Diatom indices.
References
Ács É., Földi A., Vad C. F., Trábert Z., Kiss K. T., Duleba M., et al. (2019). Trait-based community assembly of epiphytic diatoms in saline astatic ponds: a test of the stress-dominance hypothesis. Sci. Rep. 9, 15749. doi: 10.1038/s41598-019-52304-4, PMID: 31673074
Amato A., Kooistra W. H. C. F., Levialdi Ghiron J. H., Mann D. G., Pröschold T., and Montresor M. (2007). Reproductive isolation among sympatric cryptic species in marine diatoms. Protist 158, 193–207. doi: 10.1016/j.protis.2006.10.001, PMID: 17145201
APHA, AWWA, and WEF (2015). Standard Methods for the Examination of Water and Wastewater. 22nd ed (Washington, DC: American Public Health Association).
APHA, AWWA, and WPCF (1995a). Method 2320 B. Standard Methods for the Examination of Water and Wastewater. 19th ed. Eds. Eaton A. D., Clesceri L. S., and Greenberg A. E. (Washington, DC: American Public Health Association, American Water Works Association and Water Pollution Control Federation), 2–26.
APHA, AWWA, and WPCF (1995b). Method 4500-Cl- B. Standard Methods for the Examination of Water and Wastewater. 19th ed. Eds. Eaton A. D., Clesceri L. S., and Greenberg A. E. (Washington, DC: American Public Health Association, American Water Works Association and Water Pollution Control Federation), 4–49.
APHA, AWWA, and WPCF (1995c). Method 4500-SO42- C. Standard Methods for the Examination of Water and Wastewater. 19th ed. Eds. Eaton A. D., Clesceri L. S., and Greenberg A. E. (Washington, DC: American Public Health Association, American Water Works Association and Water Pollution Control Federation), 4–135.
Armbrust E. V. (2009). The life of diatoms in the world's oceans. Nature 459, 185–192. doi: 10.1038/nature08057, PMID: 19444204
Bailet B., Apothéloz-Perret-Gentil L., Baričević A., Chonova T., Franc A., Frigerio J. M., et al. (2020). Diatom DNA metabarcoding for ecological assessment: Comparison among bioinformatics pipelines used in six European countries reveals the need for standardization. Sci. Total Environ. 745, 140948. doi: 10.1016/j.scitotenv.2020.140948, PMID: 32736102
Bailet B., Bouchez A., Franc A., Frigerio J. M., Keck F., Karjalainen S. M., et al. (2019). Molecular versus morphological data for benthic diatoms biomonitoring in Northern Europe freshwater and consequences for ecological status. Metabarcod. Metagenom. 3, e34002. doi: 10.3897/mbmg.3.34002
Balycheva D., Anufriieva E., Lee R., Prazukin A., and Shadrin N. (2023). Salinity-dependent species richness of Bacillariophyta in hypersaline environments. Water 15, 2252. doi: 10.3390/w15122252
Battarbee R. W., Jones V. J., and Flower R. J. (2001). “Diatoms,” in Tracking Environmental Change Using Lake Sediments: Volume 3: Terrestrial, Algal, and Siliceous Indicators. Eds. Smol J. P., Birks H. J. B., and Last W. M. (Netherlands: Springer).
Benoiston A. S., Ibarbalz F. M., Bittner L., Guidi L., Jahn O., Dutkiewicz S., et al. (2017). The evolution of diatoms and their biogeochemical functions. Philos. Trans. R. Soc B Biol. Sci. 372, 20160397. doi: 10.1098/rstb.2016.0397, PMID: 28717023
Bicudo D. C., Tremarin P. I., Almeida P. D., Zorzal-Almeida S., Wengrat S., Faustino S. B., et al. (2016). Ecology and distribution of Aulacoseira species (Bacillariophyta) in tropical reservoirs from Brazil. Diatom Res. 31, 199–215. doi: 10.1080/0269249X.2016.1227376
Blagojević B., Langović M., Novković I., Dragićević S., and Živković N. (2020). “Water Resources of Serbia and Its Utilization,” in Water Resources Management in Balkan Countries. Eds. Negm A., Romanescu G., and Zelenakova M. (Springer, Cham). doi: 10.1007/978-3-030-22468-4_9
Blanco S. (2024). What do diatom indices indicate? Modeling the specific pollution sensitivity index. Environ. Sci. pollut. Res. 31, 29449–29459. doi: 10.1007/s11356-024-33115-1, PMID: 38580872
Bolla B., Borics G., Kiss K. T., Reskóné N. M., Várbíró G., and Ács É. (2010). Recommendations for ecological status assessment of Lake Balaton (largest shallow lake of Central Europe), based on benthic diatom communities. Vie Milieu 60, 197–208.
Callahan B., McMurdie P., Rosen M., Han A., Johnson A. J. A., and Dada S. H. (2016). DADA2: High-resolution sample inference from Illumina amplicon data. Nat. Methods 13, 581–583. doi: 10.1038/nmeth.3869, PMID: 27214047
Cantonati M. and Lowe R. L. (2014). Lake benthic algae: toward an understanding of their ecology. Freshw. Sci. 33, 475–486. doi: 10.1086/676140
Cemagref (1982). Etude des méthodes biologiques quantitative d’appréciation de la qualité des eaux (Pierre-Bénite: Rapport Division Qualité des Eaux Lyon – Agence financière de Bassin Rhône–Méditerranée–Corse), 218.
Chen H. (2022). VennDiagram: generate high-resolution Venn and Euler plots. R package version 1.7.3. Available online at: https://CRAN.R-project.org/package=VennDiagram.
Ćirić M., Gavrilović B., Krizmanić J., Dojčinović B. P., and Vidaković D. (2021). Can a benthic diatom community complement chemical analyses and discriminate between disturbed and undisturbed saline wetland habitats? A study of seven soda pans in Serbia. Wetl. Ecol. Manage. 29, 451–466. doi: 10.1007/s11273-021-09794-9
Coste M., Boutry S., Tison-Rosebery J., and Delmas F. (2009). Improvements of the Biological Diatom Index (BDI): Description and efficiency of the new version (BDI-2006). Ecol. Indic. 9, 621–650. doi: 10.1016/j.ecolind.2008.07.001
Dray S. and Dufour A. B. (2007). The ade4 package: implementing the duality diagram for ecologists. J. Stat. Software 22, 1–20. doi: 10.18637/jss.v022.i04
Duleba M., Földi A., Micsinai A., Várbíró G., Mohr A., Sipos R., et al. (2021). Applicability of diatom metabarcoding in the ecological status assessment of Hungarian lotic and soda pan habitats. Ecol. Indic. 130, 108105. doi: 10.1016/j.ecolind.2021.108105
European Commission (2000). Directive 2000/60/EC of the European Parliament and of the Council establishing a framework for Community action in the field of water policy. Off. J. Eur. Communities L327, 1–72.
Falkowski P. G., Katz M. E., Knoll A. H., Quigg A., Raven J. A., Schofield O., et al. (2004). The evolution of modern eukaryotic phytoplankton. Science 305, 354–360. doi: 10.1126/science.1095964, PMID: 15256663
Fontaine D. N. and Rynearson T. A. (2023). Multi-year time series reveals temporally synchronous diatom communities with annual frequency of recurrence in a temperate estuary. Limnol. Oceanogr. 68, 1982–1994. doi: 10.1002/lno.12400
Fukai Y., Fujiwara A., Nishino S., Kimura S., Itoh M., and Suzuki K. (2025). Characteristics of autumn phytoplankton communities in the Chukchi Sea: Resuspension of settled diatoms to the surface during strong wind events. Mar. Ecol. Prog. Ser. 752, 35–50. doi: 10.3354/meps14753
Gavrilović B., Ćirić M., Vesić A., Vidaković D., Novaković B., and Živanović M. (2018). Biodiversity overview of soda pans in the Vojvodina region (Serbia). J. Geogr. Inst. “Jovan Cvijic” SASA 68, 195–214. doi: 10.2298/IJGI1802195G
Gelis M. M. N., Canino A., Bouchez A., Domaizon I., Laplace-Treyture C., Rimet F., et al. (2024). Assessing the relevance of DNA metabarcoding compared to morphological identification for lake phytoplankton monitoring. Sci. Total Environ. 914, 169774. doi: 10.1016/j.scitotenv.2023.169774, PMID: 38215838
Jakovljević D., Milijašević Joksimović D., and Petrović A. M. (2025). Assessment of lake water quality in Central Serbia—Using Serbian and Canadian water quality indices on the example of the Garaši Reservoir. Sustainability 17, 4074. doi: 10.3390/su17094074
Karadžić V., Subakov-Simić G., Krizmanić J., and Natić D. (2010). Phytoplankton and eutrophication development in the water supply reservoirs Garaši and Bukulja (Serbia). Desalination 255, 91–96. doi: 10.1016/j.desal.2010.01.009
Keck F., Couton M., and Altermatt F. (2023). Navigating the seven challenges of taxonomic reference databases in metabarcoding analyses. Mol. Ecol. Resour. 23, 742–755. doi: 10.1111/1755-0998.13746, PMID: 36478393
Keck F., Vasselon V., Tapolczai K., Rimet F., and Bouchez A. (2017). Freshwater biomonitoring in the Information Age. Front. Ecol. Environ. 15 (5), 266–274. doi: 10.1002/fee.1490
Kelly M. (2013). Data rich, information poor? Phytobenthos assessment and the Water Framework Directive. Eur. J. Phycol. 48, 437–450. doi: 10.1080/09670262.2013.852694
Kelly M., Juggins S., Guthrie R., Pritchard S., Jamieson J., Rippey B., et al. (2008). Assessment of ecological status in U.K. rivers using diatoms. Freshw. Biol. 53, 403–422. doi: 10.1111/j.1365-2427.2007.01903.x
Kelly M., Urbanic G., Acs E., Bennion H., Bertrin V., Burgess A., et al. (2014). Comparing aspirations: intercalibration of ecological status concepts across European lakes for littoral diatoms. Hydrobiologia 734 (1), 25–141. doi: 10.1007/s10750-014-1874-9
Kermarrec L., Franc A., Rimet F., Chaumeil P., Humbert J. F., and Bouchez A. (2013). Next-generation sequencing to inventory taxonomic diversity in eukaryotic communities: a test for freshwater diatoms. Mol. Ecol. Resour. 13 (4), 607–619. doi: 10.1111/1755-0998.12105, PMID: 23590277
Kutty S. N., Loh R. K., Bannister W., and Taylor D. (2022). Evaluation of a diatom eDNA-based technique for assessing water quality variations in tropical lakes and reservoirs. Ecol. Indic. 141, 109108. doi: 10.1016/j.ecolind.2022.109108
Lange-Bertalot H. (2001). “Navicula sensu stricto, 10 genera separated from Navicula sensu lato, Frustulia,” in Diatoms of Europe Vol. 2. Ed. Lange-Bertalot H. (Ruggell: A.R.G. Gantner Verlag K.G), 1–526.
Lange-Bertalot H., Hofmann G., Werum M., and Cantonati M. (2017). “Freshwater benthic diatoms of Central Europe: over 800 common species used in ecological assessments,” in English edition with updated taxonomy and added species (Koeltz Botanical Books, Schmitten-Oberreifenberg), 1–942.
Lecointe C. and Coste M. (2015). Omnidia. Available online at: https://omnidia.fr/en/.
Lecointe C., Coste M., and Prygiel J. (1993). Omnidia”: Software for taxonomy, calculation of diatom indices and inventories management. Hydrobiologia 269, 509–513. doi: 10.1007/BF00028048
Leese F., Altermatt F., Bouchez A., Ekrem T., Hering D., Meissner K., et al. (2016). DNAqua-Net: Developing new genetic tools for bioassessment and monitoring of aquatic ecosystems in Europe. Res. Ideas Outcomes 2, e11321. doi: 10.3897/rio.2.e11321
Lenoir A. and Coste M. (1996). “Development of a practical diatom index of overall water quality applicable to the French National Water Board network,” in Use of Algae for Monitoring Rivers II. Eds. Whitton B. A. and Rott E. (Univ. Innsbruck, Inst, für Botanik), 29–43. Available online at: https://hal.inrae.fr/hal-02582184v1.
Lindeque P. K., Parry H. E., Harmer R. A., Somerfield P. J., and Atkinson A. (2013). Next generation sequencing reveals the hidden diversity of zooplankton assemblages. PloS One 8, e81327. doi: 10.1371/journal.pone.0081327, PMID: 24244737
Lobo E. A., Heinrich C. G., Schuch M., Wetzel C. E., and Ector L. (2016). “Diatoms as Bioindicators in Rivers,” in River Algae. Ed. Necchi O. Jr (Cham: Springer). doi: 10.1007/978-3-319-31984-1_11
Marković G., Kostić A.Ž., Pantelić N.Đ., Maletić R., Štrbački J., Cakić J., et al. (2023). Spatial distribution of major and trace elements in artificial lakes in Serbia: health risk indices and suitability of water for drinking and irrigation purposes. Environ. Monit. Assess. 195, 1237. doi: 10.1007/s10661-023-11740-6, PMID: 37733141
Official Gazette of the Republic of Serbia (2011). Rulebook on Parameters of Ecological and Chemical Status of Surface Waters and Parameters of Chemical and Quantitative Status of Groundwaters (Belgrade: Administration for Joint Services of Republic Bodies, Department for Information, Documentation and Library Affairs (INDOK).
Oksanen J., Simpson G., Blanchet F. G., Kindt R., Legendre P., Minchin P. R., et al. (2024). vegan: Community Ecology Package (R package version 2.6-8). Available online at: https://CRAN.R-project.org/package=vegan.
Patil I. (2021). Visualizations with statistical details: The ggstatsplot approach. J. Open Source Software 6, 3167. doi: 10.21105/joss.03167
Pérez-Burillo J., Trobajo R., Vasselon V., Rimet F., Bouchez A., and Mann D. G. (2020). Evaluation and sensitivity analysis of diatom DNA metabarcoding for WFD bioassessment of Mediterranean rivers. Sci. Total Environ. 727, 138445. doi: 10.1016/j.scitotenv.2020.138445, PMID: 32334210
Piredda R., Claverie J. M., Decelle J., de Vargas C., Dunthorn M., Edvardsen B., et al. (2018). Diatom diversity through HTS-metabarcoding in coastal European seas. Sci. Rep. 8, 18059. doi: 10.1038/s41598-018-36345-9, PMID: 30584235
Poikane S., Kelly M., and Cantonati M. (2016). Benthic algal assessment of ecological status in European lakes and rivers: Challenges and opportunities. Sci. Total Environ. 568, 603–613. doi: 10.1016/j.scitotenv.2016.02.027, PMID: 26936662
Potapova M. and Charles D. F. (2003). Distribution of benthic diatoms in US rivers in relation to conductivity and ionic composition. Freshw. Biol. 48, 1311–1328. doi: 10.1046/j.1365-2427.2003.01080.x
Prygiel J. and Coste M. (2000). Guide méthodologique pour la mise en œuvre de l’Indice Biologique Diatomées (Douai, France: Agences de l’Eau–Cemagref). Available online at: https://hal.inrae.fr/hal-02579176 (Accessed January 25, 2025).
R Core Team (2024). R: A Language and Environment for Statistical Computing (Vienna, Austria: R Foundation for Statistical Computing). Available online at: https://www.R-project.org.
Rimet F., Gusev E., Kahlert M., Kelly M., Kulikovskiy M., Maltsev Y., et al. (2019). Diat.barcode, an open-access curated barcode library for diatoms. Sci. Rep. 9, 15116. doi: 10.1038/s41598-019-51500-6, PMID: 31641158
Rimet F., Vasselon V., A.-Keszte B., and Bouchez A. (2018). Do we similarly assess diversity with microscopy and high-throughput sequencing? Case of microalgae in lakes. Org. Divers. Evol. 18, 51–62. doi: 10.1007/s13127-018-0359-5
Rivera S. F., Vasselon V., Jacquet S., Bouchez A., Ariztegui D., and Rimet F. (2018). Metabarcoding of lake benthic diatoms: from structure assemblages to ecological assessment. Hydrobiologia 807, 37–51. doi: 10.1007/s10750-017-3381-2
Rott E., Hofmann G., Pall K., Pfister P., and Pipp E. (1997). Indikationslisten für Aufwuchsalgen, Teil 1: Saprobielle Indikation (Wien: Bundesministerium für Land- und Forstwirtschaft).
Rott E., Pipp E., Pfister P., Dam H. V., Orther K., Binder N., et al. (1999). Indikationslisten für Aufwuchsalgen in Österreichischen Fliessgewassern. Teil 2: Trophieindikation (Wien: Bundesministerium für Land- und Forstwirtschaft), 248.
Sabovljević M., Tomović G., Ştefănuţ S., Djordjević V., Stanković S., Djurović S., et al. (2024). New records and noteworthy data of plants, algae and fungi in SE Europe and adjacent regions, 19. Bot. Serb 48, 297–307. doi: 10.2298/BOTSERB2402297S
Smol J. P. and Stoermer E. F. (2010). The Diatoms: Applications for the Environmental and Earth Sciences. 2nd ed (Cambridge: Cambridge Univ. Press).
SRPS EN 12260 (2008). Water Quality – Determination of nitrogen – Determination of bound nitrogen (TNb), following oxidation to nitrogen oxides (Belgrade: Institute for Standardization of Serbia).
SRPS EN ISO 14911 (2009). Water Quality – Determination of dissolved Li+, Na+, NH4+, K+, Mn²+, Ca²+, Mg²+, Sr²+ and Ba²+ using ion chromatography – Method for water and waste water (Belgrade: Institute for Standardization of Serbia).
SRPS EN ISO 6878 (2008). Water Quality – Determination of phosphorus – Ammonium molybdate spectrometric method (ISO 6878:2004) (Belgrade: Institute for Standardization of Serbia).
SRPS JUS H.Z1.111 (1987). Određivanje pH vrednosti – potenciometrijska metoda (Beograd: Savezni zavod za standardizaciju).
Stenger-Kovács C., Béres V. B., Buczkó K., Tapolczai K., Padisák J., Selmeczy G. B., et al. (2023). Diatom community response to inland water salinization: A review. Hydrobiologia 850, 4627–4663. doi: 10.1007/s10750-023-05167-w
Stenger-Kovács C., Buczkó K., Hajnal É., and Padisák J. (2007). Epiphytic, littoral diatoms as bioindicators of shallow lake trophic status: Trophic Diatom Index for Lakes (TDIL) developed in Hungary. Hydrobiologia 589, 141–154. doi: 10.1007/s10750-007-0729-z
Stenger-Kovács C., Hajnal É., Lengyel E., Buczkó K., and Padisák J. (2016). A test of traditional diversity measures and taxonomic distinctness indices on benthic diatoms of soda pans in the Carpathian Basin. Ecol. Indic. 64, 1–8. doi: 10.1016/j.ecolind.2015.12.018
Stenger-Kovács C., Körmendi K., Lengyel E., Abonyi A., Hajnal É., Szabó B., et al. (2018). Expanding the trait-based concept of benthic diatoms: Development of trait- and species-based indices for conductivity as the master variable of ecological status in continental saline lakes. Ecol. Indic. 95, 63–74. doi: 10.1016/j.ecolind.2018.07.026
Stenger-Kovács C., Lengyel E., Buczkó K., Padisák J., and Korponai J. (2020). Trait-based diatom functional diversity as an appropriate tool for understanding the effects of environmental changes in soda pans. Ecol. Evol. 10, 320–335. doi: 10.1002/ece3.5897, PMID: 31993118
Stoof-Leichsenring K. R., Dulias K., Biskaborn B. K., Pestryakova L. A., and Herzschuh U. (2020). Lake-depth related pattern of genetic and morphological diatom diversity in boreal Lake Bolshoe Toko, Eastern Siberia. PloS One 15, e0230284. doi: 10.1371/journal.pone.0230284, PMID: 32294095
Stoof-Leichsenring K. R., Epp L. S., Trauth M. H., and Tiedemann R. (2012). Hidden diversity in diatoms of Kenyan Lake Naivasha: a genetic approach detects temporal variation. Mol. Ecol. 21, 1918–1930. doi: 10.1111/j.1365-294X.2011.05412.x, PMID: 22221342
Tapolczai K., Keck F., Bouchez A., Rimet F., Kahlert M., and Vasselon V. (2019). Diatom DNA metabarcoding for biomonitoring: Strategies to avoid major taxonomical and bioinformatical biases limiting molecular indices capacities. Front. Ecol. Evol. 7. doi: 10.3389/fevo.2019.00409
Taylor J. C., Harding W. R., and Archibald C. G. M. (2007). WRC Report TT 281/07: A methods manual for the collection, preparation and analysis of diatom samples version 1.0 (Republic of South Africa: Water Research Commission).
Thrash T., Bahls L., and Bishop I. (2018). “Anomoeoneis sculpta,” in Diatoms of North America. Available online at: https://diatoms.org/species/94440/anomoeoneis-sculpta.
Trbojević I. S., Popović S. S., Milovanović V. V., Predojević D. D., Simić G. V. S., Jakovljević O. S., et al. (2021). Substrate type selection in diatom based lake water quality assessment. Knowl. Manage. Aquat. Ecosyst. 422, 21. doi: 10.1051/kmae/2021022
Trbojević I. S., Predojević D. D., Simić G. V. S., and Krizmanić J.Ž. (2019a). Periphytic diatoms in the presence of a cyanobacterial bloom: A case study of the Vrutci Reservoir in Serbia. Arch. Biol. Sci. 71, 215–223. doi: 10.2298/ABS181120003T
Trbojević I., Subakov Simić G., Blaženčić J., and Predojević D. (2019b). Rediscovery of chara canescens loiseleur in Serbia. Bot. Serb. 43, 97–102. doi: 10.2298/BOTSERB1901097T
U.S. EPA (1982). Method 120.1: Conductance (Specific Conductance, µmhos at 25 °C). In: Methods for Chemical Analysis of Water and Wastes (EPA-600/4-79-020) (Washington: U.S. Environmental Protection Agency).
U.S. EPA (1999). Method 120.1: Conductance (Electrometric Method). In: Methods for Chemical Analysis of Water and Wastes (Washington, DC: U.S. Environmental Protection Agency).
Van Dam H., Mertens A., and Sinkeldam J. (1994). A coded checklist and ecological indicator values of freshwater diatoms from the Netherlands. Neth. J. Aquat. Ecol. 28, 117–133. doi: 10.1007/BF02334251
Vasselon V., Domaizon I., Rimet F., Kahlert M., and Bouchez A. (2017a). Application of high-throughput sequencing (HTS) metabarcoding to diatom biomonitoring: Do DNA extraction methods matter? Freshw. Sci. 36, 162–177. doi: 10.1086/690649
Vasselon V., Rimet F., Tapolczai K., and Bouchez A. (2017b). Assessing ecological status with diatoms DNA metabarcoding: Scaling-up on a WFD monitoring network (Mayotte island, France). Ecol. Indic. 82, 1–12. doi: 10.1016/j.ecolind.2017.06.024
Vidaković D., Ector L., Wetzel C. E., Krizmanić J., Gavrilović B., Dojčinović B., et al. (2022). A new Nitzschia Hassall species (Bacillariaceae, Bacillariophyta) from saline ponds in Serbia. Cryptogam. Algol. 43, 85–94. doi: 10.5252/cryptogamie-algologie2022v43a4
Vidaković D., Krizmanić J., Dojčinović B. P., Pantelić A., Gavrilović B., Živanović M., et al. (2019). Alkaline soda Lake Velika Rusanda (Serbia): The first insight into diatom diversity of this extreme saline lake. Extremophiles 23, 347–357. doi: 10.1007/s00792-019-01088-6, PMID: 30888506
Vidaković D., Levkov Z., Krizmanić J., Beszteri B., Gavrilović B., and Ćirić M. (2023). A new small-celled naviculoid diatom species, Mayamaea pannonica sp. nov. (Bacillariophyceae) from soda pans in Serbia. Phycologia 62, 268–276. doi: 10.1080/00318884.2023.2193121
Vidaković D., Mayombo N. A. S., Castellanos A. B., Kloster M., and Beszteri B. (2024). Diatom metabarcoding as a tool to assess the water quality of two large tributaries of the Danube River. Ecol. Indic. 168, 112793. doi: 10.1016/j.ecolind.2024.112793
Vidović M., Rodić M. M., Vidović M. U., Trajković I., and Jovanić S. Z. (2015). Assessment of the trophic status by monitoring of reservoir’s water quality. J. Water Resour. Prot. 7, 1–13. doi: 10.4236/jwarp.2015.71001
Von Lampe F. and Schellenberg J. (2024). goeveg: Functions for community data and ordinations (Version 0.7.5). Available online at: https://CRAN.R-project.org/package=goeveg.
Wickham H. (2016). ggplot2: Elegant Graphics for Data Analysis (Berlin, Germany: Springer-Verlag). Available online at: https://ggplot2.tidyverse.org.
Wickham H., Averick M., Bryan J., Chang W., McGowan L. D., François R., et al. (2019). Welcome to the tidyverse. JOSS 4, 1686. doi: 10.21105/joss.01686
Zgrundo A., Lemke P., Pniewski F., Cox E. J., and Latała A. (2013). Morphological and molecular phylogenetic studies on Fistulifera saprophila. Diatom Res. 28, 431–443. doi: 10.1080/0269249X.2013.833136
Keywords: diatoms, freshwater lakes, saline lakes, microscopy, biomonitoring, rbcL
Citation: Vlaović L, Lemonnier C, Alric B, Rimet F, Ćirić M, Miletić S, Milovanović Ž, Petrović V and Vidaković D (2025) Diatom metabarcoding vs. morphology in monitoring freshwater and saline lakes in Serbia. Front. Ecol. Evol. 13:1677773. doi: 10.3389/fevo.2025.1677773
Received: 01 August 2025; Accepted: 10 September 2025;
Published: 29 September 2025.
Edited by:
Luca Gallitelli, Roma Tre University, ItalyReviewed by:
Davide Taurozzi, Roma Tre University, ItalyAndrea M. Burfeid Castellanos, University of Duisburg-Essen, Germany
Copyright © 2025 Vlaović, Lemonnier, Alric, Rimet, Ćirić, Miletić, Milovanović, Petrović and Vidaković. This is an open-access article distributed under the terms of the Creative Commons Attribution License (CC BY). The use, distribution or reproduction in other forums is permitted, provided the original author(s) and the copyright owner(s) are credited and that the original publication in this journal is cited, in accordance with accepted academic practice. No use, distribution or reproduction is permitted which does not comply with these terms.
*Correspondence: Danijela Vidaković, ZGFjYS52aWRha292aWM4OUBnbWFpbC5jb20=