 Kevin M. Wright1†Pranidhi Sood1
 Elena D. Zemlemerova2Danila S. Kostin2Nicole L. Fong1Nelda Yi1Andrea T. Ireland1Irene Lam1Kaitlyn N. Hardell-Lewis1Megan Smith1Jackie Villalta1Calvin H. Jan1Margaret A. Roy1David Botstein1
 Leonid A. Lavrenchenko2
 J. Graham Ruby1*
 Rochelle Buffenstein1,3*
- 1Calico Life Sciences LLC, South San Francisco, CA, United States
- 2Department of Mammalian Microevolution, Severtsov Institute of Ecology and Evolution, Russian Academy of Sciences, Moscow, Russia
- 3Department of Biological Sciences, University of Illinois, Chicago, IL, United States
Naked mole-rats (Heterocephalus glaber) are a species of rodent endemic to the Horn of Africa, notable among mammals for their long lifespans, resistance to a variety of stresses, and eusocial mating behavior. Although their natural range extends across large portions of Kenya, Ethiopia, Somalia, and Djibouti, the large majority of genetic and genomic analyses focus on Kenyan specimens. Here, we constructed a chromosome-scale reference genome assembly for H. glaber, along with new reference assemblies of both the Damaraland mole-rat (Fukomys damarensis) and guinea pig (Cavia porcellus) genomes to aid annotation. We leveraged our H. glaber assembly, along with modern whole-genome sequencing, to characterize the genetic diversity of specimens derived from Kenya, southern Ethiopia, and eastern Ethiopia. We found the Kenyan and southern Ethiopian specimens to be closely related to each other and highly diverged from eastern Ethiopian specimens. We also found specimens collected from nearby locations in southern Ethiopia to be more closely related to Kenyan specimens than to each other. This unexpected distribution of shared genetic diversity highlights the importance of local migration barriers to gene flow in wild H. glaber populations.
Introduction
Naked mole-rats (Rodentia; Heterocephalus glaber) are renowned for several unique behavioral, physiological, and metabolic traits (Buffenstein, Park, and Holmes, 2021). These eusocial, subterranean-dwelling rodents exhibit extreme longevity (Ruby et al., 2024; Buffenstein, 2005) with a concomitant negligible senescence phenotype (Buffenstein, 2008; Can et al., 2022) and fail to exhibit demographic aging, maintaining a constant mortality hazard for more than three decades (Ruby et al., 2018, Ruby et al., 2024). They show pronounced tolerance of hypoxia and hypercapnia (Park et al., 2017; Zions et al., 2020) and also exhibit exceptionally low cancer incidence relative to that shown by most other mammals (Buffenstein, 2008; Delaney et al., 2016; Hadi et al., 2021). Their immune system paradoxically lacks natural killer cells—that in other species play a crucial role in defense against cancer (Hilton et al., 2019)—but unusually has a substantial circulating population of cytotoxic gamma delta T (γδ T) cells (Lin et al., 2024). The molecular mechanisms behind these unusual features remain, however, poorly understood.
Naked mole-rats exhibit extreme variation in lifetime reproductive success as well as cooperative care of siblings, features that have been described as a eusocial breeding system (Jarvis, 1981; Holmes and Goldman, 2021; Buffenstein et al., 2022), with fewer than 1% of individuals reproducing over their lifespans (Jarvis, 1981). Most naked mole-rat colonies have only one breeding female, who births all of the offspring in the colony (Jarvis, 1981), and a handful of breeding males (Faulkes and Bennett, 2021). These rodents live in isolated underground colonies characterized by low rates of immigration and emigration (Jarvis, 1985). New colonies are thought to primarily arise from the splitting of existing colonies and subsequent matings among closely related individuals. Naked mole-rats are described as facultative inbreeders because the breeding female will mate with the founder male and, as the colony grows, may also mate with a few of her male offspring (Faulkes and Bennett, 2021). These features are thought to have resulted in high within-colony relatedness (Reeve et al., 1990; Honeycutt et al., 1991; Ingram et al., 2015).
The simultaneous appearance of fossils resembling present-day Heterocephalus, together with extinct bathyergid ancestors in Miocene deposits, supports an ancient origin for this genus. This fossil evidence, together with molecular clocks, suggests it to have been the earliest phylogenetic branch to diverge within the African mole-rat lineage Bathyergidae (Faulkes and Bennett, 2021) in the early Oligocene, approximately 31 million years ago (Patterson and Upham, 2014). Phylogeographic analyses suggest their distribution has been predominantly influenced by landscape evolution involving the formation of physical barriers (Hess et al., 2022), as well as ecological and climatic modifications associated with the formation of the African Rift Valley. The species range of naked mole-rats spans the Horn of Africa, extending from the southern border of Kenya, across the Somali–Masai biome, through Ethiopia, and reaching as far north as Djibouti (Zemlemerova et al., 2020; Bennett and Faulkes, 2000; Faulkes and Bennett, 2021). Most field studies and sampling of naked mole-rats have occurred in Kenya (Jarvis, 1981; Brett, 1991a, Brett, 1991b; Jarvis and Sale, 1971). The first genetic study of this species, using specimens from southern Kenya, measured low levels of genetic variation and concluded their eusocial mating system was responsible for a high inbreeding rate (Reeve et al., 1990). However, a follow-up study with broader geographic sampling found greater genetic diversity in northern Kenya (Ingram et al., 2015), suggesting migration-induced population bottlenecks at the edge of the species’ range were responsible for the low genetic variation observed in southern Kenya. For this species, the use of genetics to inform population history and demography has heretofore been limited to analyses of a restricted set of autosomal and mitochondrial markers (Zemlemerova et al., 2020, Zemlemerova et al, 2021).
Here, we examined the natural geographic distribution of genetic diversity among naked mole-rats using polymorphisms densely annotated from whole-genome sequencing of specimens originating from Kenya as well as southern and eastern Ethiopia. We found the Kenyan H. glaber to be closely related to southern Ethiopian specimens and highly divergent from eastern Ethiopian populations. Within southern Ethiopia, we found geographically proximal populations to be highly diverged and more closely related to the more distant Kenyan populations than to each other.
To facilitate our genetic analyses, we constructed a new chromosome-scale genome assembly for H. glaber using a combination of high-coverage short-read, long-read, and optical-mapping data. This new resource, along with gene annotations and underlying data, is described and provided with this manuscript. To additionally support those annotation efforts, we generated and provide new reference assemblies of other members within the suborder Hystricomorpha—both the close bathyergid relative, the Damaraland mole-rat (Fukomys damarensis), and the more distant relative, the guinea pig (Cavia porcellus) genomes.
Results
Heterocephalus glaber reference genome assembly and gene annotation
Our chromosome-scale genome assembly was constructed by leveraging multiple data modalities, including short-read sequencing, long-read sequencing, and optical mapping, following the Vertebrate Genome Project assembly protocols (Rhie et al., 2021). Scaffolds likely to derive from the same chromosome were grouped using sequence data from flow-sorted chromosomes (Soifer et al., 2020). Our workflow for genome assembly and annotation is described in detail in the Methods and schematized in Supplementary Figure 1, and assembly progress across each step is reported in Supplementary Table 1.
The diploid genome of H. glaber includes 29 pairs of autosomes plus sex chromosomes (Deuve et al., 2006) and is 5.8 picograms of DNA (Gallardo et al., 2003), which corresponds to approximately 2.84 gigabases (Gb) in a haploid genome (Dolezel et al., 2003). Our assembly included 2.53 Gb of sequence (2.56 Gb including scaffold-linking N’s) and therefore likely captured the majority of the genome. The 408 contigs were joined into 130 scaffolds, with N50 lengths of 22.88 megabases (Mb) and 68.60 Mb (69.35 Mb including scaffold-linking N’s), respectively (Figure 1A). A theoretical distribution of chromosome lengths based on the measured genome size and karyotype (see Methods) had an N50 of 102.3 Mb (Figure 1A). The less than twofold difference between scaffold- and karyotype-based N50 values suggested that scaffolds often traversed entire chromosome arms. This was validated by clustering 58 of the largest scaffolds into 30 groups using sequence data from flow-sorted chromosomes (Figure 1B; Supplementary Table 2). The scaffold groups had an N50 of 97.30 Mb, close to the theoretical N50 for entire chromosomes (Figure 1A).
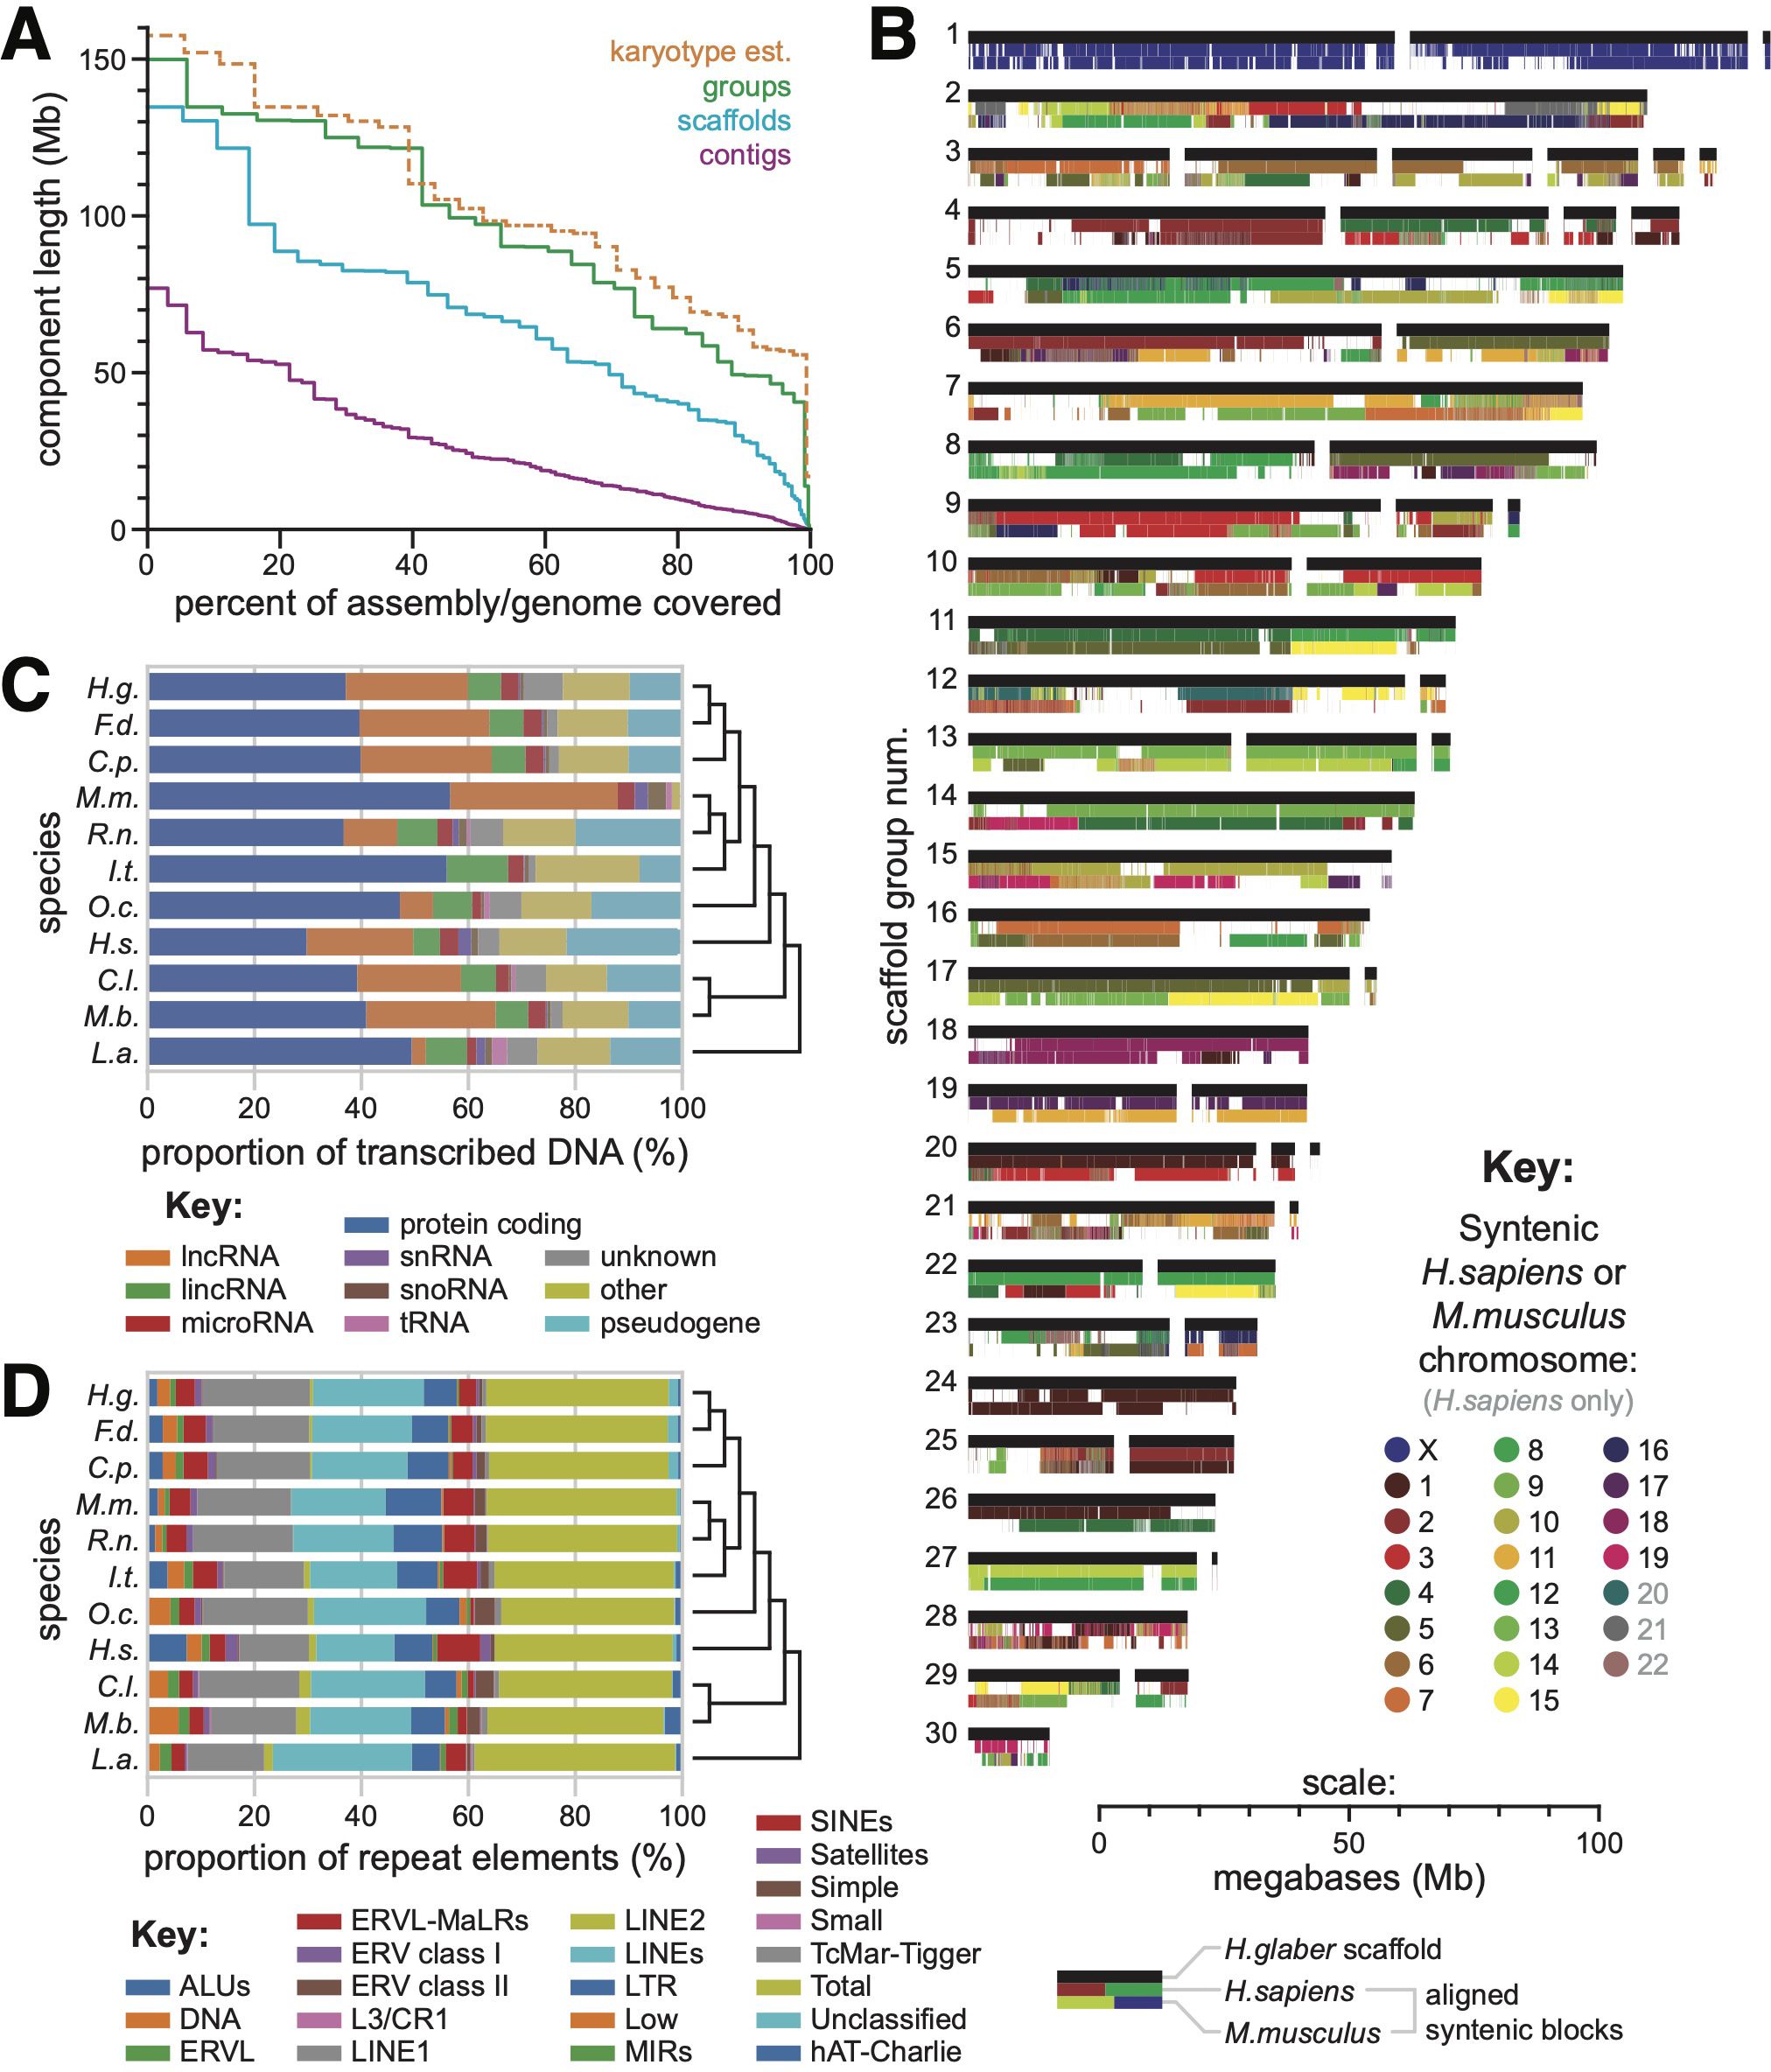
Figure 1. (A) Relative length distributions for contigs (magenta), scaffolds (cyan), and scaffold groups (green) in our reference H. glaber genome assembly. In orange: the relative length distributions for chromosomes based on analysis of karyotypes. (B) Scaffold groups based on sorted chromosome-seq. Black bars represent scaffolds, drawn to scale with their lengths. Colored bands below each scaffold bar indicate regions of syntenic alignment to human (middle band) or mouse (bottom band) reference genomes, color-coded by the aligned human/mouse chromosome. (C) Proportion of transcribed DNA dedicated to various gene/transcript categories, as annotated by CAT, across all species included in our multigenome alignment. (D) Distribution across classes of repetitive elements labeled by RepeatMasker, as annotated by CAT, across all species included in our multigenome alignment.
We annotated the H. glaber genome using the Comparative Annotation Toolkit (CAT) (Fiddes et al., 2018), run with the highly curated genomes of mouse and human as well as ab initio searches for genes specific to the less well-annotated lineages: rat, squirrel, elephant, rabbit, bat, and dog (Supplementary Figure 1). Genomes for the Damaraland mole-rat F. damarensis and guinea pig C. porcellus were also included because of their taxonomic proximity to H. glaber, for which we generated our own assemblies using 10X linked-read data (see Methods). The CAT annotation pipeline performed whole-genome alignments in Cactus (statistics provided in Supplementary Table 3; whole-genome alignments provided as Supplementary Data Files 3) and predicted gene family identities using comparisons to the well-annotated mouse and human genomes. Those conservation-based predictions were supplemented and validated using H. glaber gene expression data from both Illumina short reads and PacBio long reads. Repetitive elements were similarly annotated across all 10 genomes (see Methods for details). The proportions of both gene and repeat element classes were compared between our H. glaber genome and those of independently sequenced mammalian genomes (Figure 1C, D).
Our assembly exhibited extensive synteny with the human and mouse genomes (Figure 1B) and achieved a complete BUSCO score of 93.2% (Simão et al., 2015), suggesting its structure to be largely correct. Using our gene annotations and whole-genome alignments, we mapped syntenic blocks of human and mouse chromosomes onto our genome assembly (see Methods). Most scaffolds and groups were linked to individual orthologous chromosomes across large, tens-of-megabase blocks (Figure 1B). Notably, scaffold group 1 exhibited nearly exclusive synteny with the X chromosomes of both human and mouse, implying it to be the X chromosome of H. glaber.
Polymorphisms discovered through whole-genome sequencing reveal kinship patterns within a captive H. glaber population derived from Kenya
Our captive H. glaber population descended from approximately 200 animals collected from six sites in eastern and southern Kenya in 1979 (Jarvis, 1985). Wild-caught animals from each collection site were maintained in captivity and interbred for multiple generations to preserve as much of the original genetic diversity as possible. Given that history, we sought to describe and quantify the genetic diversity maintained from those founders to gain insight into the amount of genome-wide genetic variance that exists across Kenyan haplotypes. To that end, we performed whole-genome sequencing on a large number of animals selected to enrich individuals with distinct or unknown lineages.
The pedigree in Supplementary Figure 2 depicts the recorded genealogy of these captive animals. Given the eusocial structure of H. glaber society, nodes in this pedigree represent family colonies (composed of a breeding pair and their offspring), and arrows represent the migration of an animal from its birth colony to become a breeder in a new family colony. The records used to construct this pedigree were largely restricted to the past 25 years, and in only a few instances was there enough information to trace relationships back to wild-caught progenitors.
To examine genetic relatedness between animals in this pedigree, we sequenced their genomes with short reads to a median coverage of 20 to 26X (Supplementary Table 5). Figure 2A shows the subset of the pedigree linking those colonies whose members were sequenced. We identified high-confidence SNP variants meeting the following criteria: biallelic variant, quality score greater than 30, sample missingness less than 20%, minimum depth of coverage exceeding whichever of the two values was greater—the 5% genome-wide quantile or six reads—and maximum depth less than the 95% genome-wide quantile. Following this procedure, we identified between 2.8 and 4.1 million high-confidence SNPs per animal (Supplementary Table 5). Across all these animals, more than 8.1 million nonredundant polymorphisms were identified (Supplementary Data Files 2).
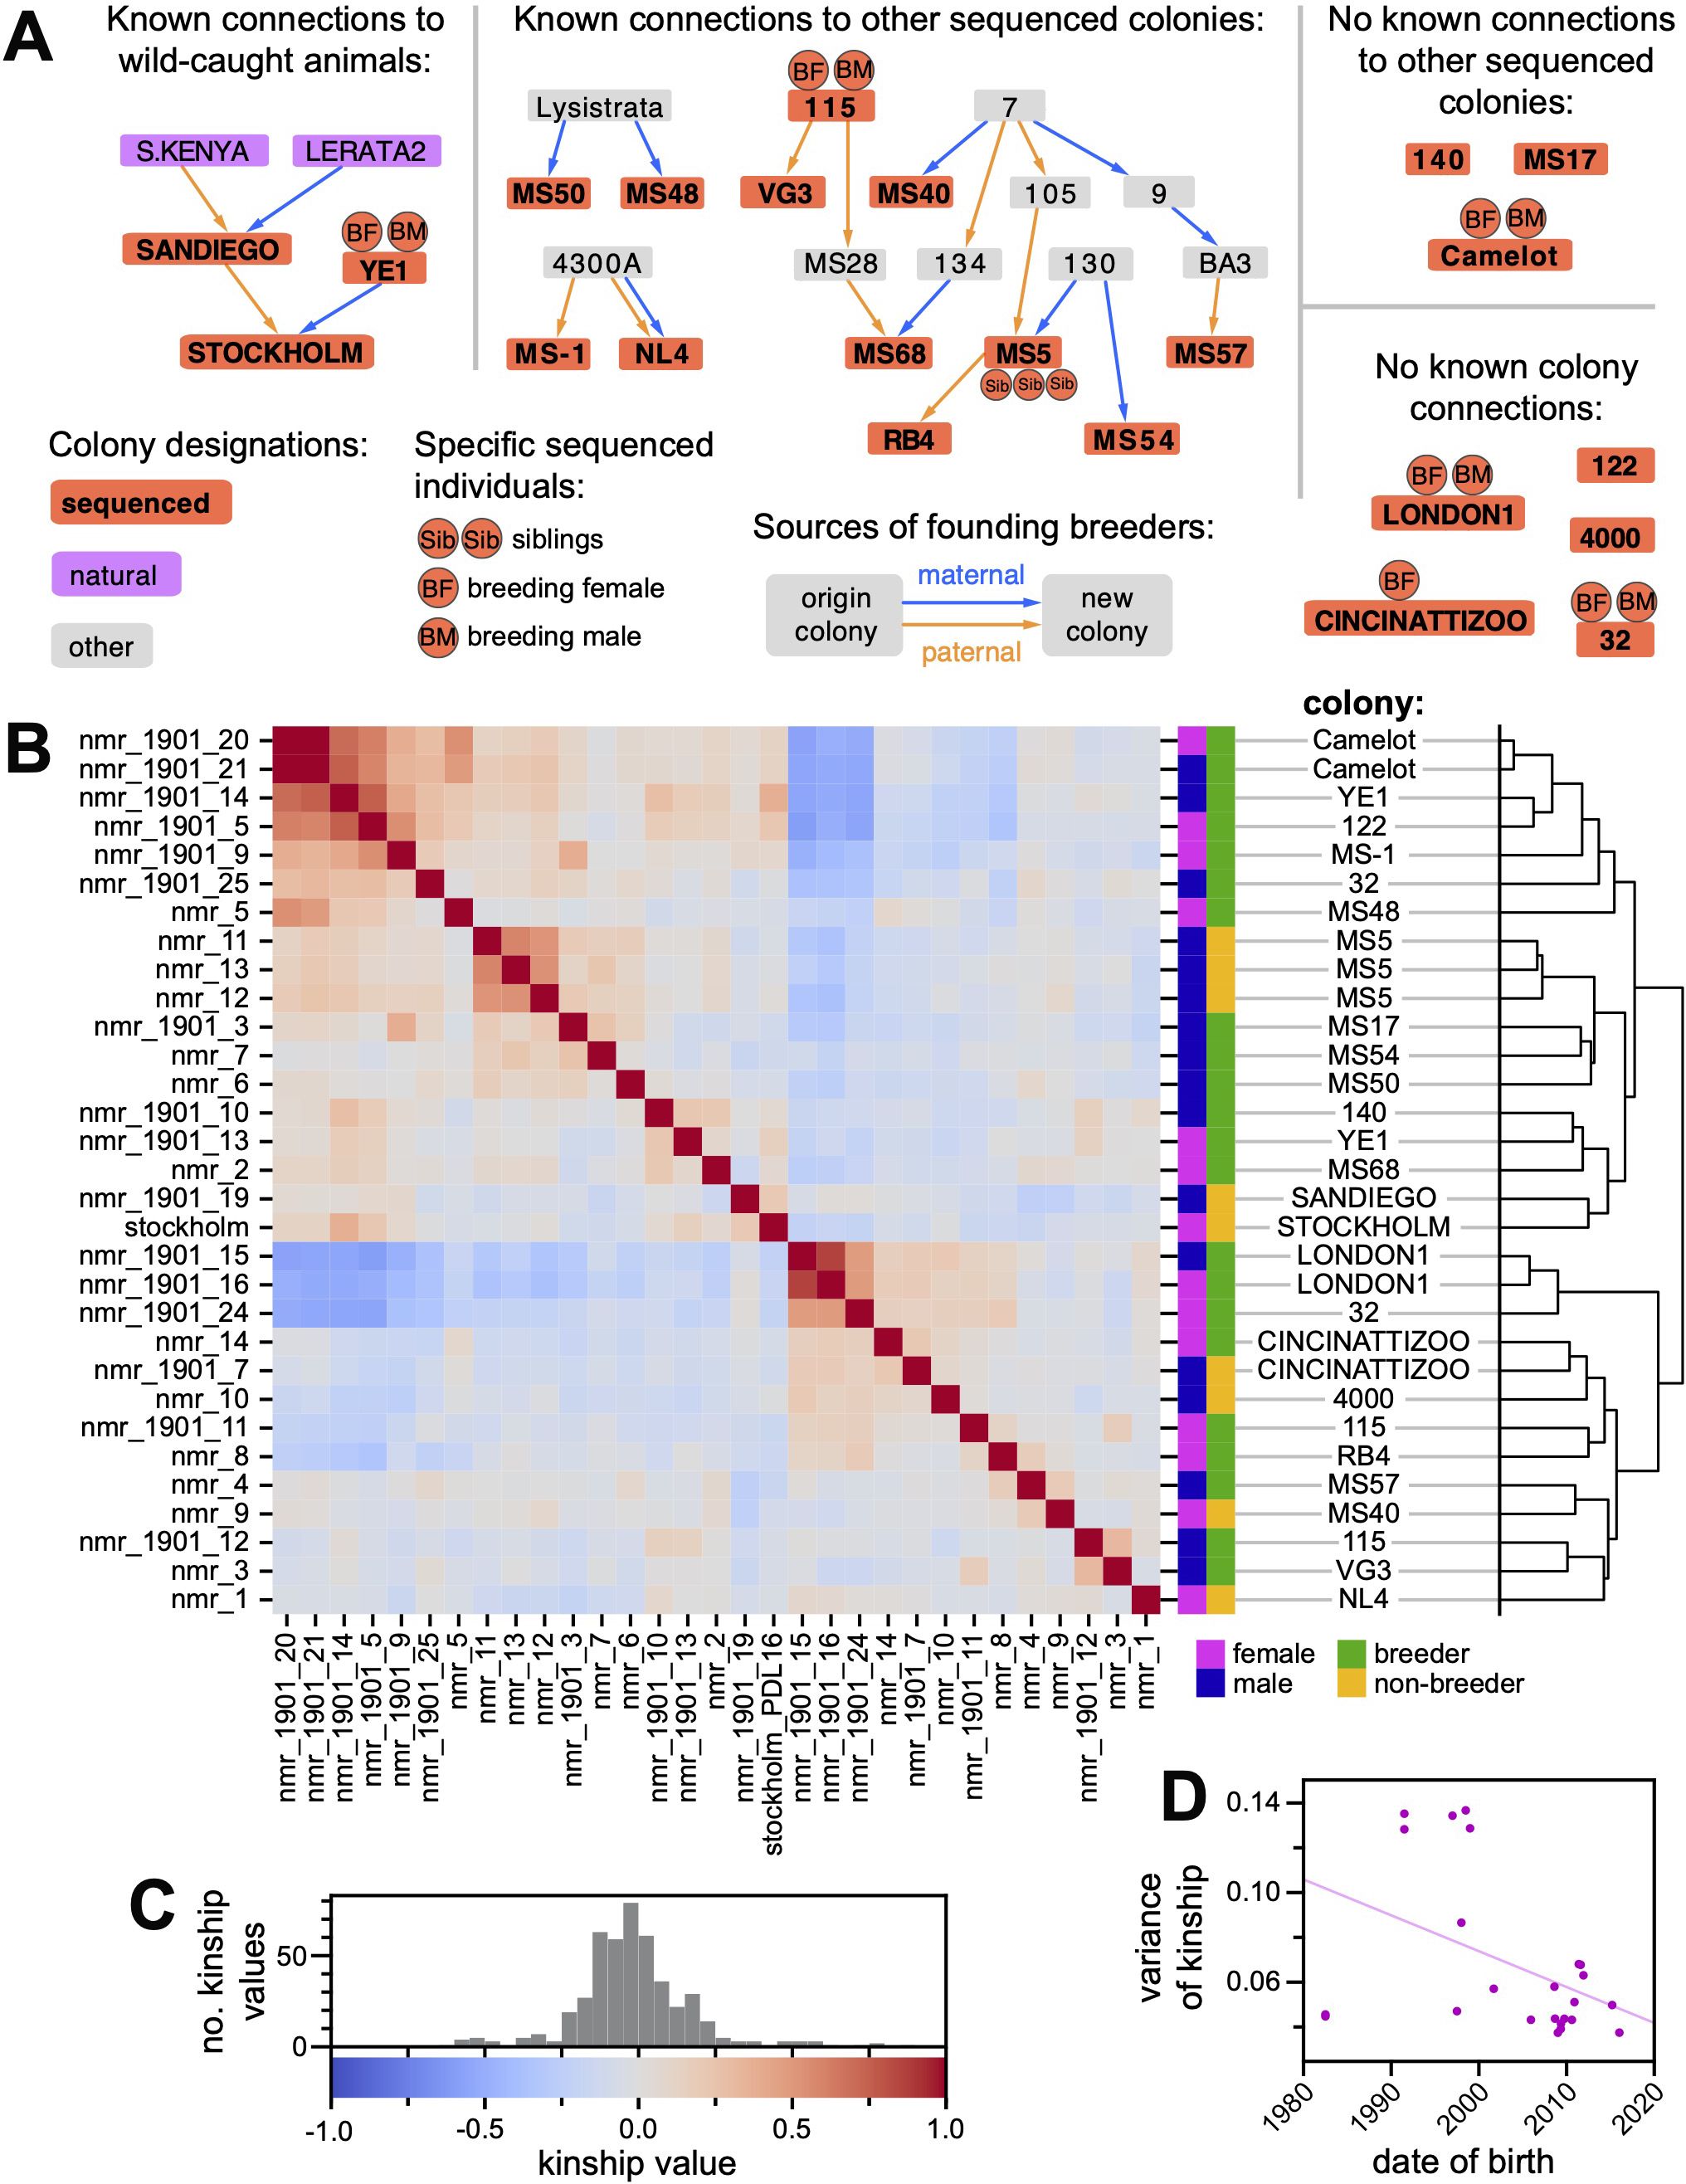
Figure 2. (A) Partial pedigree of the Kenya-derived H. glaber collection. Nodes in this pedigree represent family colonies (composed of a breeding pair and their offspring). Red nodes depict colonies that contain animals selected for whole-genome sequencing; abutting circles indicate when breeders or siblings were sequenced. Arrows show the origin colony for the breeding male (orange) and female (blue) and the new colony created by the union of these breeders. This panel includes networks linking sequenced colonies; the full pedigree is provided as Supplementary Figure 2. (B) A heatmap of pairwise kinship values (rw) between the 31 sequenced H. glaber ndividuals from the Kenya-derived collection. Hierarchical clustering of animals based on kinship is shown on the right. The key for color intensity values for the heatmap is shown in panel (C) The key for color intensity values for the heatmap in panel (B), with a histogram showing the distribution of observed values. (D) Plot of, for each animal, its date of birth (x-axis) versus the variance (y-axis) of its distribution of nonself kinship values (either rows or columns of panel B). Line shows linear regression (slope = −0.0016; y-intercept at 1980 = 0.106; slope SE = 0.00072; p-value = 0.036).
Whole-genome sequencing data were used to estimate kinship (VanRaden, 2008; Goudet et al., 2018) between all samples (Figure 2B). The majority of samples were from colonies without known pedigree connections, and estimates of kinship ranged from −0.2 to 0.2 (Figure 2C). In contrast, pairwise kinship values for the three full siblings from colony MS5 ranged from 0.521 to 0.587, similar to the expected pairwise kinship of 0.5.
Additional pairs or clusters of animals without known pedigree connections nonetheless shared kinship exceeding expectations for full siblings (e.g., nmr_1901_14 from colony YE1 and nmr_1901_5 from unlinked colony 122, whose pairwise kinship was 0.75; Figure 2B; Supplementary Table 6). Many of these also shared lower-than-expected kinship values across the sequenced individuals, including negative kinship values, which can indicate population structure (Figure 2B; see Methods for discussion of the meaning of negative kinship values). This population descends from animals collected at six sites in Kenya (Jarvis, 1985), found across regions known to be genetically distinct (Ingram et al., 2015). Although animals were crossbred throughout the history of the collection, it can take multiple generations for linkage disequilibrium to decay, even between unlinked loci (Pfaff et al., 2001). We hypothesized that animals born earlier in the collection’s history possessed less mixed genotypes, resulting in more extreme kinship values relative to one another, in both the positive and negative directions. To test this hypothesis, the variance of kinship values for each individual was regressed against its date of birth (Figure 2D). The relationship was significantly negative (p = 0.036), with substantial admixture achieved after the year 2000.
Subsequent analyses were restricted to 24 animals by excluding all but a single animal from each cluster sharing kinship above 0.5 (see Methods for details). The remaining animals carried more than 7.6 million (over 94%) of the nonredundant polymorphisms discovered across the Kenya-derived cohort (Supplementary Data Files 2).
Polymorphism discovery in Ethiopian H. glaber samples reveals high genetic divergence for eastern Ethiopian populations
We next sought to compare levels of genetic diversity within the Kenya-derived population to four and six wild-caught animals from southern and eastern Ethiopia, respectively (Figure 3A; Supplementary Table 4; Zemlemerova et al., 2021). The genomes of the Ethiopian animals were short-read sequenced to a median coverage of 13-22X (Supplementary Table 5), and high-confidence polymorphisms were called using the same methods applied to the Kenyan population. We identified 3.5–4.9 million sites with nonreference alleles per animal in the southern Ethiopian lines and 18.4–18.6 million sites per animal with nonreference alleles in the eastern Ethiopian lines (Supplementary Table 5). Sequencing of animals from southern and eastern Ethiopia added more than 3.9 million and 17.6 million nonredundant polymorphisms, respectively, to our discovery set, bringing the total (including Kenya-derived) to more than 30.1 million (Supplementary Data Files 2).
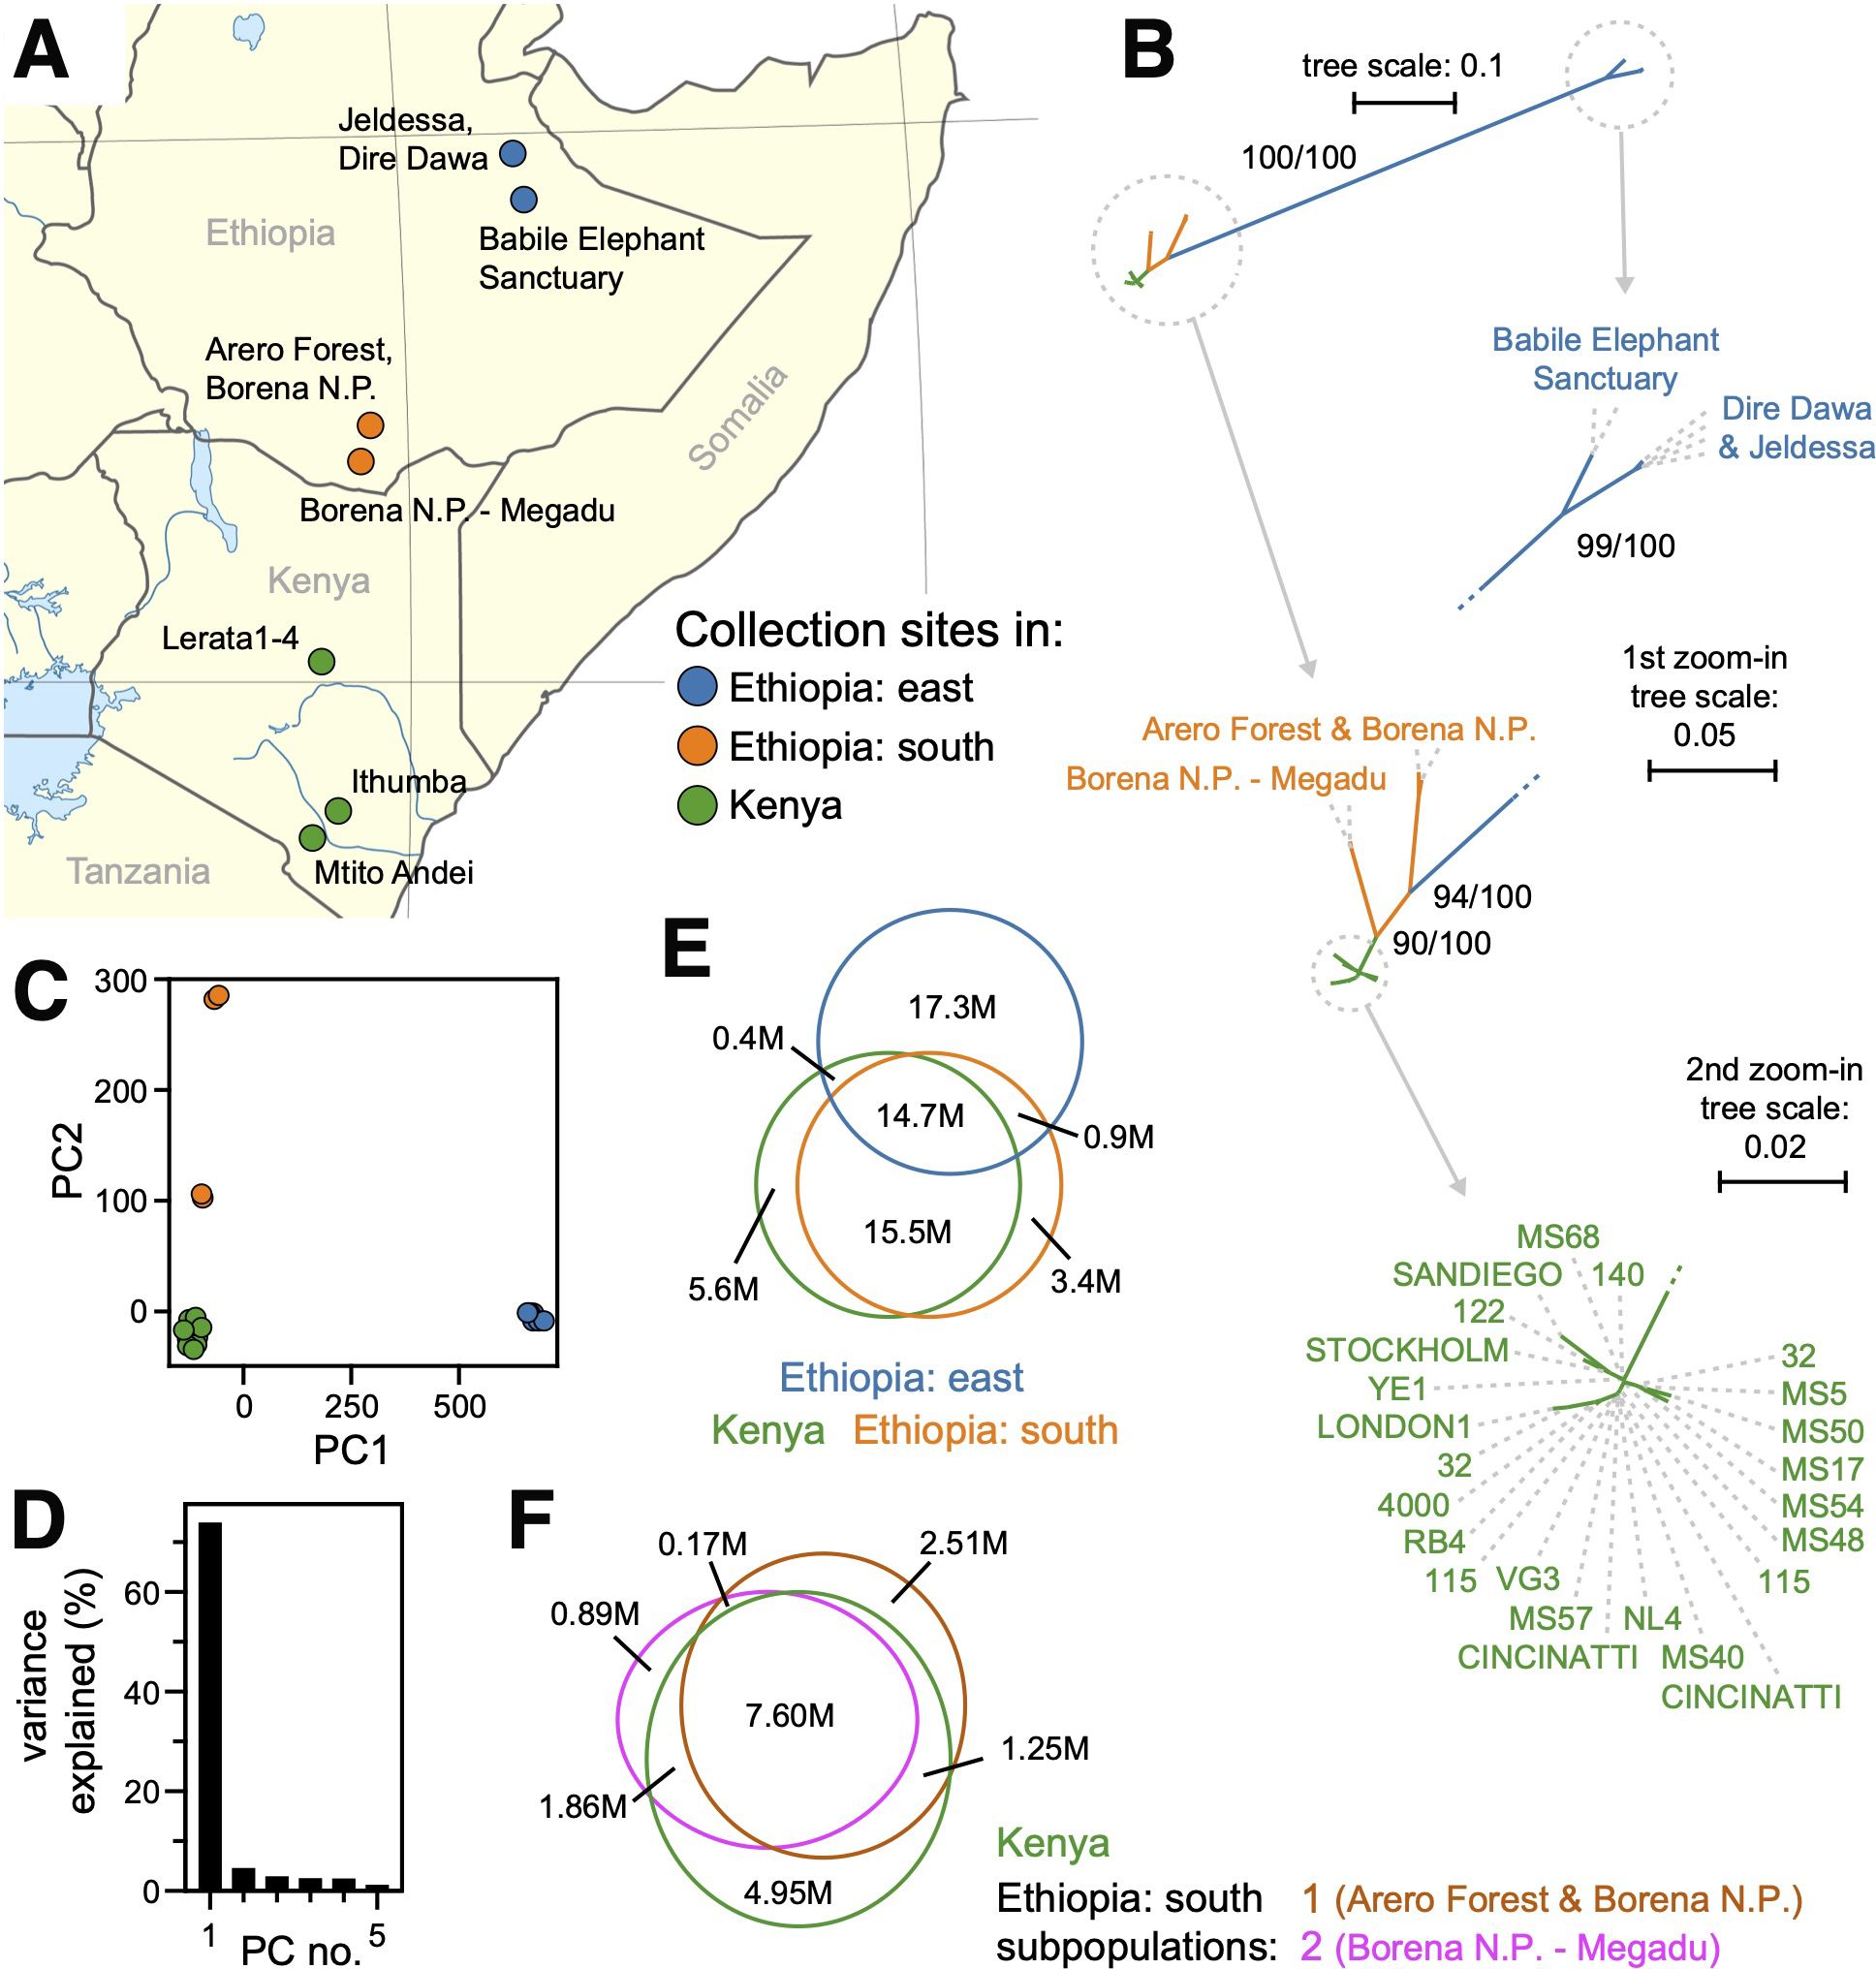
Figure 3. (A) A map of collection sites in Kenya and Ethiopia. The captive-bred Kenyan mole-rats were derived from animals collected at the indicated sites (green) in 1979 (Jarvis, 1985). The wild-caught Ethiopian samples were collected at the orange (southern Ethiopia) and blue (eastern Ethiopia) sites during multiple expeditions from 2008 to 2019 (Zemlemerova et al., 2020). (B) Maximum-likelihood, unrooted phylogenetic tree for the 34 samples selected from whole-genome sequencing. Nodes with bootstrap support of at least 90% are highlighted. Animals are labeled by their colony name or geographic origin (see Supplementary Table 4) and colored by geographic region as in panel (A, C) Principal component analysis of genotype values for all 41 samples. The scatterplot shows the first two principal components (PC1 and PC2) plotted on the x- and y-axes, respectively. Color-coded by geographic region as labeled in panel (A, D) Histogram of the variance explained for the first eight principal components (PC1 and PC2 are plotted in panel (C, E) Venn diagram of alleles shared across the three geographic regions of sample collection, colored as in panel (A) For each polymorphic site, reference and alternative alleles are both represented. Only alleles that were polymorphic across the 34 animals from this analysis are included. (F) Venn diagram of allele distributions across the Kenyan and two southern Ethiopian populations (Arero Forest and Borena N.P. in brown; Borena N.P.–Megadu in pink; Kenya in green). Only alleles that were polymorphic across the 28 animals from this analysis are included.
To probe population structure, we constructed a maximum-likelihood phylogenetic tree (see Methods), including the 24 Kenya-derived animals after kinship-based filtering plus the ten Ethiopian animals. There was high bootstrap support for the Kenyan population being closely related to southern Ethiopian animals and for this combined clade being highly diverged from the eastern Ethiopian animals (Figure 3B). Divergence of the eastern Ethiopian group was also revealed by principal component analysis (PCA) of genotype variation (Figure 3C). Eastern Ethiopian animals clustered separately from all other animals along the first principal axis, which accounted for more than 70% of genotype variance (Figure 3C, D). This divergence was also revealed by the distribution of alleles across geographic regions: while the Kenyan and southern Ethiopian animals shared most alleles, the majority of alleles discovered from the eastern Ethiopian animals were unique to that group (Figure 3E; Supplementary Table 7). We quantified divergence between geography-delimited groups (Kenya, south Ethiopia, east Ethiopia) using the FST statistic, which ranges from 0.0 for free exchange of alleles to 1.0 for no exchange of alleles (Wright, 1943). The eastern Ethiopian group had high FST versus either the Kenya-derived group (0.89) or the southern Ethiopian group (0.91), while the southern Ethiopia and Kenya groups shared lower FST values (0.68; Table 1A).
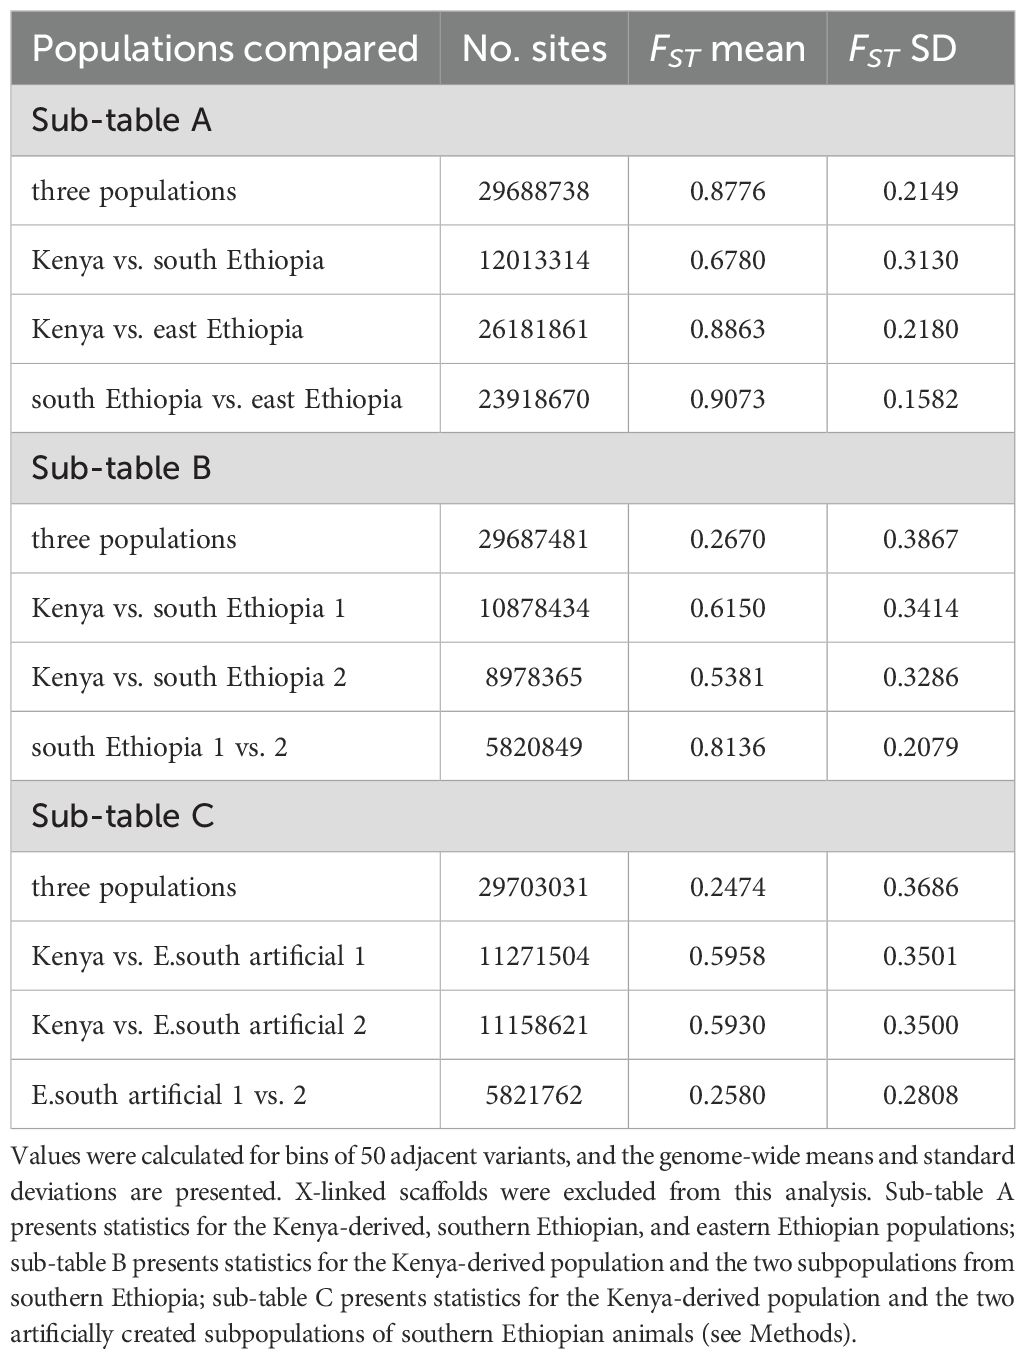
Table 1. Population differentiation measured with the FST statistic for trios of populations.
The possibility of admixture between these three population groups was evaluated using the f3 statistic (Patterson et al., 2012), calculated for each of the three geographically delimited populations with respect to the other two. In all cases, f3 was significantly greater than zero (Table 2A). This result indicated no recent admixture between these groups, with the east Ethiopian population again standing out as the most highly diverged.
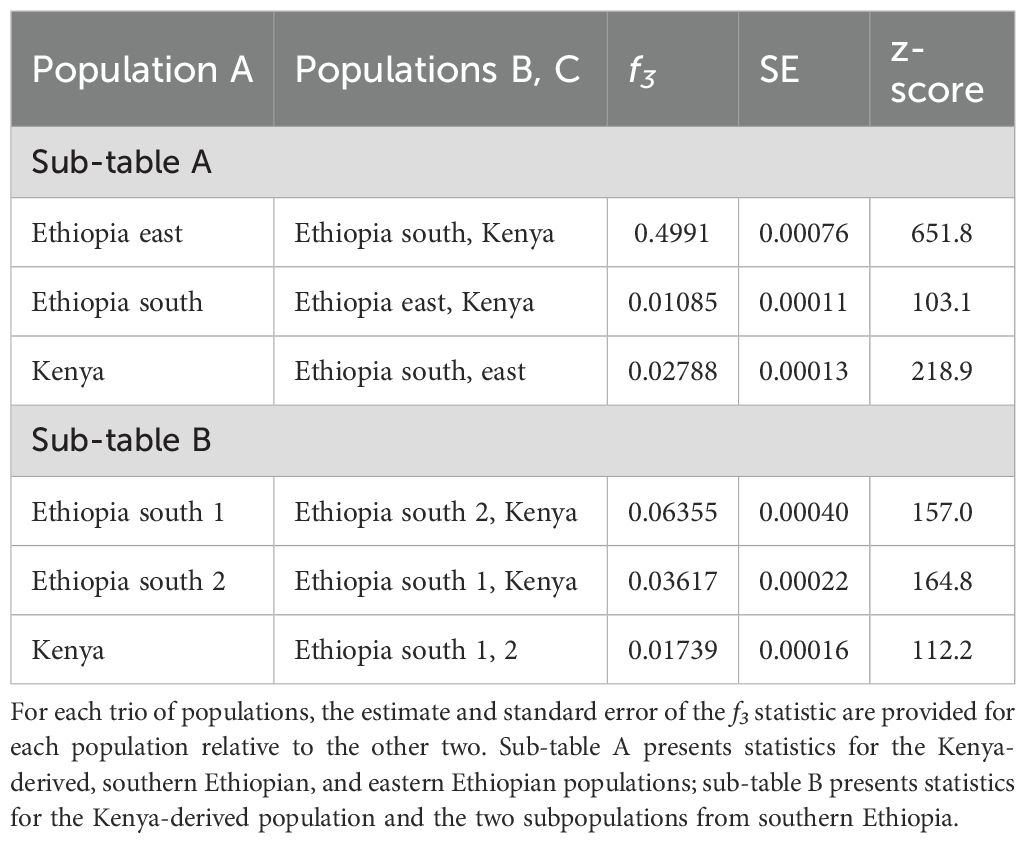
Table 2. Admixture tests using the f3 statistic.
Allelic distributions suggest two geographically proximal populations in southern Ethiopia to be more closely related to the Kenyan population than to each other
Principal component analysis revealed animals collected from two locales of southern Ethiopia (Borena National Park and Arero Forest, versus the Megadu block of Borena National Park; Figure 3A) to cluster separately from each other and from Kenya-derived samples along the second principal axis (Figure 3C). Likewise, phylogenetic clustering placed members of these two populations more proximal to Kenya-derived animals than to one another (Figure 3B). Heterozygosity analysis across the three geographically defined populations (Kenya, southern Ethiopia, eastern Ethiopia) also supported independent evaluation of the two southern Ethiopian populations. Using high-confidence polymorphisms, the observed versus expected numbers of heterozygous positions (Ho versus He, respectively) were calculated genome-wide, excluding X-linked scaffolds (Table 3A). While observation met expectation for the captive-interbred Kenyan samples (0.29 and 0.27 for Ho and He, respectively), substantially less heterozygosity was observed than expected across the southern Ethiopian samples (0.13 versus 0.41 for Ho and He, respectively).
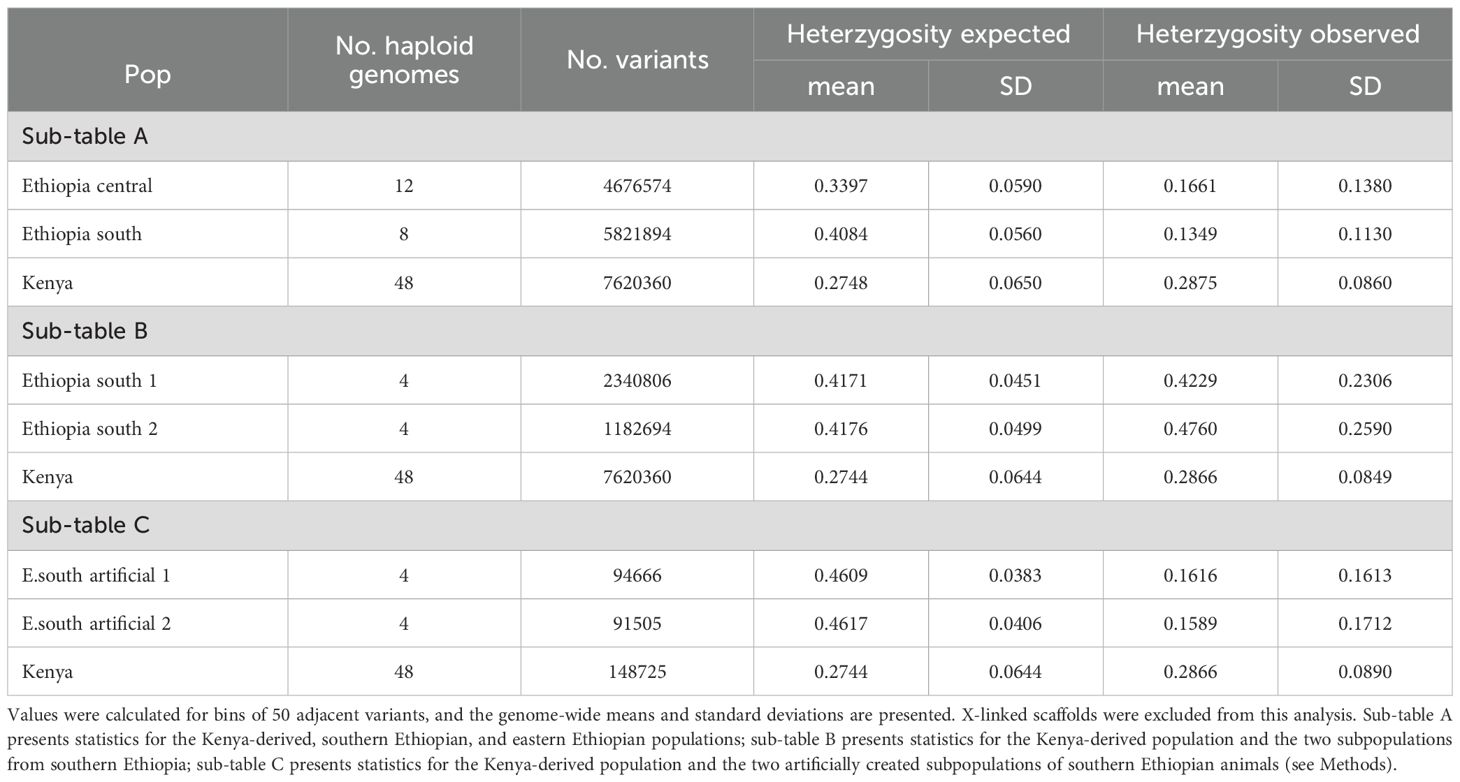
Table 3. Genetic diversity measured with observed and expected heterozygosity (Ho and He, respectively).
We performed additional analyses probing the relationships between the two distinct populations from southern Ethiopia and the Kenya-derived population. The two southern Ethiopian populations were composed of animals collected either from the Arero Forest and northern Borena National Park (s. Ethiopia population 1) or the Megadu block of Borena National Park (s. Ethiopia population 2). The collection sites for these two populations are separated by mountainous terrain and a lava field (Zemlemerova et al., 2021). The f3 statistics (Patterson et al., 2012) were significantly greater than zero for each population versus the other two (Table 2B), indicating no recent admixture. When considered separately, both southern Ethiopian populations had observed heterozygosity that matched expectation (Table 3B). To control for the limited population sizes of these groups (two animals/four haplotypes per population), we swapped membership to create two artificial, mismatched populations. Like the combined southern Ethiopian animal group (Table 3A), these two artificial populations both exhibited far less heterozygosity than would be expected by chance (Table 3C).
Calculation of the FST statistic between the Kenya-derived and two southern Ethiopian populations produced somewhat lower values (0.6150 and 0.5381 for populations 1 and 2, respectively; Table 1B) than when those populations were combined (0.6780; Table 1A). Surprisingly, the FST statistic between the two southern Ethiopian populations was substantially higher (0.8136; Table 1B), implying a greater barrier to allelic exchange between them than with Kenyan naked mole-rats. As a control, the swapped/artificial versions of these populations maintained similar values versus the Kenyan population (0.5958 and 0.5930) while drastically lowering the value between populations (0.2580; Table 1C). The postulation that the two southern Ethiopian populations are more closely related to Kenyan mole-rat populations than to one another was reinforced by the distribution of polymorphic alleles discovered across these populations: while millions of polymorphisms were discovered for each population that were either unique to it or uniquely shared with the Kenyan population, very few alleles were shared between the two southern Ethiopian populations that were not also shared with the Kenyan population (Figure 3F; Supplementary Table 7).
For the eastern Ethiopian samples, phylogenetic clustering (Figure 3B) and observed versus expected heterozygosity (0.16 versus 0.34 for Ho and He, respectively; Table 1A) indicated that the two geographical populations, derived from either Jaldessa/Dire Dawa or the Babile Elephant Sanctuary (Figure 3A), were also likely genetically distinct. However, due to their relative proximity to one another versus their distant relationships to the other populations we studied, this population structure could not have confounded our analysis of the southern Ethiopian and Kenyan populations and therefore was not analyzed further.
Discussion
The foundation for our analysis of H. glaber genetic diversity was a chromosome-scale assembly of the naked mole-rat genome. We provide this genome assembly, along with the data used to construct it, as resources that may be synergistic with other recent advancements in the quality of H. glaber reference genomes (Romanenko et al., 2023; Sokolowski et al., 2024). We additionally provide resources for genome analysis, including de novo gene annotations for H. glaber, along with transcriptome data supporting them, as well as novel de novo genome assemblies for the related species F. damarensis and C. porcellus.
We measured genetic diversity within a captive-bred H. glaber population as well as across naturally isolated individuals from either southern or eastern Ethiopia. After their initial collection over 40 years ago and multiple generations of captive breeding, the Kenya-derived collection has maintained substantial genetic diversity. These specimens were relatively closely related to those collected from southern Ethiopia, for which polymorphisms versus our Kenyan reference were identified at a frequency similar to human polymorphisms (~every 700 base pairs; Supplementary Table 5; Kruglyak and Nickerson, 2001).
In contrast, the eastern Ethiopian specimens were highly diverged from those originating from either Kenya or southern Ethiopia. These results were consistent with previous analyses using a more limited set of genetic markers (Ingram et al., 2015; Zemlemerova et al., 2021). They were also consistent with broad geographic analyses of double-digest restriction site–associated DNA markers from the nuclear genome, which also reveal the population group encompassing both Kenya and southern Ethiopia to be highly diverged from the eastern and northern Ethiopian populations (Šumbera et al., 2024). We do not speculate as to whether the degrees of divergence observed might justify novel taxonomic designations within the established H. glaber species.
Within southern Ethiopia, substantial division between populations from within versus north of the Megadu block of Borena National Park was strongly supported by our analyses of genome-wide polymorphisms. This distinction may be surprising given the short distance separating collection sites (as little as ~90 km), but it was previously established using a more limited set of genetic sequences and is well justified by the geological barriers separating the populations, including a mountain range and lava field (Zemlemerova et al., 2021).
More surprising was the greater relatedness of each of these southern Ethiopian populations to the captive Kenyan population. Prior analyses suggest the Megadu and Kenyan populations share a sister-group relationship versus the Borena/Arero population (Zemlemerova et al., 2021), which was confirmed in our phylogenetic analysis (Figure 3B). This greater distance was also evidenced by the much larger set of alleles that were unique to the Borena/Arero population (2.51 million) versus the Megadu population (0.89 million; Figure 3F). Comparatively few polymorphisms were discovered that were shared between the southern Ethiopian populations but not with the Kenyan population (0.17 million; Figure 3F). The captive Kenyan population descends from animals originally collected in central and southern Kenya (Jarvis, 1985), at sites no closer than ~340 km from the nearest Ethiopian collection sites. While the southern Ethiopian populations are separated from one another by natural barriers along the north/south axis, the extended Somali Acacia–Commiphora bushlands to the east provide a potential biogeographic barrier for those two populations plus the wider Kenyan population. This unexpected distribution of shared genetic diversity may provide insight into the ancient migration patterns that gave rise to these populations.
Methods
Culture of fibroblast cell-lines
Genomic DNA for the H. glaber reference genome was collected from a fibroblast cell line originally derived from skin sections collected from the Stockholm individual (Hg-01083), a 1-year-old, nonbreeding female. Prior to collection, the skin sections were washed with 70% ethanol. For each skin section, all subcutaneous fat was removed, followed by two washes in sterile, cold PBS and two washes with cold 70% ethanol. Skin tissue was then cut into small, pea-sized sections, minced with scissors, and placed in one well of a sterile 12-well plate containing a collagenase/Minimum Essential Medium (MEM; Gibco, 11095-080, 500 mL) mixture supplemented with 10% fetal bovine serum (FBS; Sigma-Aldrich Inc.) and 1x antibiotic/antimycotic (aa; Gibco, 15240-062, 100 mL/100×). The mixture consisted of 200 μL of reconstituted Roche Liberase DH research-grade purified enzyme blend (Roche, Ref#05401054001) mixed with 1 mL of MEM. Cells were cultured with the same lot number of FBS for the duration of this study.
The minced skin and media were mixed with a 5 mL serological pipette and incubated for 3 h in a 37 °C incubator (5% CO2, 3% O2) with periodic manual agitation to accelerate tissue digestion. After the 3 h incubation, the tissue/MEM/collagenase mixture was mixed again with a 5 mL serological pipette, transferred to a 15 mL conical tube, and centrifuged for 10 min at 1,000 rpm. The supernatant was carefully removed, and the remaining pellet was reconstituted in 3 mL of 10% FBS/1× aa/MEM media and plated in one well of a sterile 6-well collagen-coated tissue culture dish. Plates were incubated in a 32°C incubator (5% CO2, 3% O2) until confluence. All cells were then trypsinized with 0.25% trypsin–EDTA (1×) and transferred to a sterile 10 cm collagen-coated tissue culture dish. Skin fibroblasts were cultured until confluence and then split 1:3 onto new, sterile collagen-coated tissue culture dishes.
The procedure described above was used to generate the additional H. glaber cell lines used for genome sequencing (see Supplementary Table 5), as well as the Damaraland mole-rat cell line used for that purpose. The guinea pig dermal fibroblast cell line was purchased from Harlan Sprague, Inc. (Chicago, IL, USA). Additional H. glaber DNA samples were extracted from similarly prepared cell lines, flash-frozen lung tissue, or ethanol-stored liver samples (specified below). In all cases, DNA was extracted using a Quick-DNA Miniprep Kit (Zymo Research, Cat# D3025).
Tissues were obtained from animals that were sacrificed by cardiac exsanguination while under anesthesia with isoflurane.
Whole-genome sequencing
Linked-read sequencing was performed following the 10x linked-reads protocol to prepare Chromium Genome v2 libraries, following the Chromium™ Genome Reagent Kits v2 User Guide (provided at https://support.10xgenomics.com/genome-exome/index). Libraries were sequenced using paired-end (2 × 150 bp) sequencing on an Illumina HiSeq 4000. For sorted chromosome sequencing (HiTCH-seq), samples and libraries were prepared from Stockholm-derived fibroblasts as described by Soifer et al. (2020). BioNano optical mapping was also performed from those cells, as described by Soifer et al. (2020), but using only the DLE-1 Enzyme Assay (Bionano Genomics Document 30206A). PacBio long-read sequencing was performed on Stockholm fibroblast-derived DNA using both the RSII and Sequel platforms, and in the latter case using v1.2 and v2.0 chemistries. RSII-sequenced PacBio samples were prepared as described by Soifer et al., 2020. Sequel-sequenced samples were similarly prepared, with movie time increased up to 10 h.
Transcriptome sequencing library prep
For RNA sequencing, total RNA was extracted separately from a variety of tissues dissected from two animals (a female breeder and a male breeder), as described by Hilton et al. (2019). The tissues/organs included liver, kidney, heart, lung, spleen, pancreas, leg muscle, cerebellum, and whole brain. Equal-mass quantities of RNA from each tissue were pooled for sequencing. For size-selected RNA-seq, total RNA was size selected on a 1% MOPS gel run for 17 h, which was then cut into 50 ~1.5 mm slices. RNA from each slice was sequenced on an Illumina HiSeq 4000, as described by Hilton et al. (2019). Accession numbers for sequence data from each slice (labeled from 1, adjacent to the well, to 50, at the bottom of the gel) are available in Supplementary Table 7.
PacBio Isoform Sequencing (Iso-Seq) was performed on libraries constructed using the Clontech SMARTer cDNA Synthesis Kit and SageELFTM Size-selection System (PN 100-574-400-01) & Diffusion Loading, following manufacturer instructions: https://www.pacb.com/wp-content/uploads/2015/09/Procedure-Checklist-Isoform-Sequencing-Iso-Seq-using-the-Clontech-SMARTer-PCR-cDNA-Synthesis-Kit-and-the-BluePippin-Size-Selection-System.pdf.
De novo genome assemblies of the F. damarensis and C. porcellus genomes
For the Damaraland mole-rat and guinea pig genomes, genomic DNA collected from fibroblast cell lines was sequenced with 10x Genomics linked short-read data to estimated 46X and 45X genome coverage, respectively, as described above (see Methods: Whole-genome sequencing). Fold coverage is based on the picogram (pg) estimates of genome size from Gallardo et al. (2003) and assuming 978 Mb per pg (Dolezel et al., 2003). The 10x Supernova™ Assembler was used to create de novo genome assemblies using default settings and manufacturer instructions (https://support.10xgenomics.com/de-novo-assembly/software/pipelines/latest/using/running).
De novo genome assembly of the H. glaber genome
For de novo assembly of the H. glaber genome, we followed the Vertebrate Genome Project (VGP) assembly protocols (Rhie et al., 2021) for genome assembly, phasing, primary polishing using Falcon-unzip, removing duplicated haplotypes using purge_dups, scaffolding with scaff10x and BioNano, and secondary polishing with 10x Genomics’ FreeBayes. We deviated from the standard VGP1.6 pipeline in four ways: first, all PacBio reads (Sequel 2.0, Sequel 1.2, and RSII) were used in the assembly pipeline; second, for polishing the primary genome assembly with Falcon-unzip, only Sequel 1.2 and RSII reads were used (Sequel 2.0 and RSII could not be combined at this step); third, for polishing the secondary genome assembly with FreeBayes, 10x Genomics linked short-read data were downsampled to 60X from the original 290X sequence coverage to conform with the VGP specifications; fourth, only a single round of 10x scaffolding and polishing was executed. At every stage, genome completeness was assessed using BUSCO (Simão et al., 2015) (gene set: Vertebrata_odb9; Supplementary Table 1).
For the grouping of scaffolds derived from the same chromosome, low-pass sequencing was performed for 3,072 flow-sorted chromosomes (deposited in NCBI SRA under BioSample SAMN41435818) and used to assign the 60 scaffolds >1 Mb from our assembly into chromosome groups, following Soifer et al. (2020). Briefly, enrichment scores were calculated to estimate the likelihood that each pair of scaffolds derived from the same chromosome. A correlation matrix of these scores (Supplementary Data File 1) was used to cluster scaffolds using k-means, and the Kneedle algorithm (Satopää et al., 2011), as implemented by the Python kneed module (v0.8.5), was used to determine the number of clusters. Because H. glaber has 29 autosomes plus sex chromosomes, and the DNA sampled for assembly was from a female, only cluster counts of 30 or above were considered, resulting in 32 clusters (scaffold groups). These groups were sorted by the summed lengths of component scaffolds. Thirty groups had lengths >10 Mb, with the bottom two groups both being singleton scaffolds near the length threshold for inclusion in this analysis: Super-Scaffold_154 (1.69 Mb) and Super-Scaffold_183 (1.46 Mb). Those scaffolds were designated as ungrouped, leaving 30 groups (Supplementary Table 2) that we suspect correspond to the 30 chromosomes of H. glaber (Deuve et al., 2006). Synteny of the scaffolds with reference mouse (mm10) and human (hg38) genomes was determined using halSynteny (Krasheninnikova et al., 2020). In Figure 1B, syntenic blocks aligned to the same reference genome and separated by less than 0.25 Mb were visually fused.
Repeat element detection and masking
Genomic repeats specific to H. glaber were identified using RepeatModeler (version 1.0.11) and combined with conserved repeats from the Dfam database (Hubley et al., 2016). To mask repeats for genome analysis, we applied this composite repeat library to the H. glaber genome and the other nine genomes used in the whole-genome alignment process with RepeatMasker (version open-4.0.9; flags: -s, -xsmall, -poly) (Smit et al., 2013).
Gene annotation informed by comparative genomics and RNA-seq data
Pacbio IsoSeq data were processed using software tools downloaded from bioconda. Subreads were converted to circular consensus sequences using ccs (version 6.0.0, commit v6.0.0-2-gf165cc26; flags: min-rq=0.9). We removed 5′ and 3′ cDNA primers and barcodes using lima (version 2.0.0, commit v2.0.0; flags: --dump-clips, --peek-guess). Poly-A tails and artificial concatemers were removed using isoseq3 (version 3.2.2, commit v3.2.2; flags: --require-polya). The resulting unpolished, full-length, non-concatemer sequences were merged using dataset (version 0.1.27; flags: --force, --TranscriptSet), then clustered using the cluster function in isoseq3. IsoSeq reads were aligned to the genome using minimap2 (version 2.17-r941), and the Cupcake pipeline (https://github.com/Magdoll/cDNA_Cupcake/wiki) used to collapse these into a GFF-format file, using the script collapse_isoforms_by_sam.py.
Size-selected RNA-seq reads were trimmed using TrimGalore (version 0.6.3) and aligned to our H. glaber reference genome using STAR (version 2.5.3a).
Gene annotation was performed using the Comparative Annotation Toolkit (CAT) (https://github.com/ComparativeGenomicsToolkit/Comparative-Annotation-Toolkit; Fiddes et al., 2018). Three strategies were applied: (1) liftover of established annotations from the human genome; (2) liftover of established annotations from the mouse genome; and (3) ab initio searches to identify genes not conserved in those species. Our three newly generated genomes (H. glaber, F. damarensis, and C. porcellus) were simultaneously annotated using CAT, leveraging both comparative genomics (Cactus alignments, described below) and gene expression (Illumina short-read and PacBio Iso-Seq long-read data). CAT projects well-curated annotations (here, from mouse and human) onto less well-annotated genomes, then cleans and filters them using AUGUSTUS (Stanke et al., 2006). Additional novel information garnered by combining the projected annotations with predictions produced by Comparative Augustus (König et al., 2016) was incorporated into the annotation pipeline and further supplemented and validated by gene expression data.
Size-selected RNA-seq was used to inform annotation of intron–exon boundaries (i.e., intron-only mode). Iso-Seq data were used in two ways as part of the annotation pipeline: first, as input for AugustusPB; second, after derivation of gene models using Cupcake (described above). Cupcake annotations were used similarly to NCBI annotations—providing information to AugustusCGP. Iso-Seq transcripts were also directly incorporated into the H. glaber genome annotation if they provided a novel isoform or locus.
Whole-genome alignment was performed using Cactus (version 1.2.3) according to developer instructions (https://github.com/ComparativeGenomicsToolkit/cactus). Ten mammalian genomes were selected for alignment. In addition to the three assemblies generated here (H. glaber, F. damarensis, and C. porcellus), the following seven reference genomes were included, listed with their UCSC Genome Browser and NCBI IDs: human Homo sapiens (hg38; GCF_000001405.38; Schneider et al., 2017), mouse Mus musculus (mm10; GCF_000001635.26; Church et al., 2009), rat Rattus norvegicus (rn6; GCF_000001895.5; Ramdas et al., 2019), rabbit Oryctolagus cuniculus (oryCun2; GCA_000003625.1; Carneiro et al., 2014), squirrel Ictidomys tridecemlineatus (speTri2; GCA_000236235.1), dog Canis lupus familiaris (canFam3; GCA_000002285.2; Lindblad-Toh et al, 2005), Brandt’s bat Myotis brandtii (GCA_000412655.1), and African elephant Loxodonta africana (loxAfr3; GCA_000001905.1; Palkopoulou et al., 2018). These species were selected based on their taxonomic relationships to the naked mole-rat and/or the maturity and quality of their genome assemblies and annotations. The Newick-format string for the alignment-based tree for these genomes is provided in Supplementary Text File 1. Whole-genome alignments are provided as Supplementary Data Files 3.
Gene annotations for H. glaber are provided as Supplementary Data File 4.
Karyotype-based estimation of H. glaber chromosome sizes
The total size of the H. glaber genome was estimated as described in the Results, based on the picogram genome size measured by Gallardo et al. (2003). Relative sizes of the full chromosomes were calculated from the karyotype image published by Deuve et al. (2006) using KICS (Ludwig et al., 2022), with threshold set to 0.063 and blur set to 0.40.
Pedigree construction for the Kenyan-derived H. glaber collection
Our captive H. glaber collection descends from 200 animals gathered from six sites in Kenya in 1979 (Figure 3A; Jarvis, 1985) and has since been maintained and interbred in captivity. Throughout the history of the collection, new colonies have been established through the pairing of a single nonbreeding male and a single nonbreeding female by removing them from their birth colonies’ cages and placing them into a new cage. Pairings were considered successful, and a new colony was designated, if the female became pregnant. If the male died and there were no surviving or remaining offspring, the female would sometimes be paired with a new breeding male under the same colony designation.
As a tool for the selection of DNA samples to maximize genetic diversity, we used archival breeding records to construct a pedigree of our Kenya-derived H. glaber collection. Supplementary Figure 2 depicts the relatedness between colonies in the H. glaber collection as of January 2020; only network paths connecting the colonies of genotyped individuals and Kenyan founder colonies are shown in Figure 2A. Given the eusocial breeding structure of H. glaber society, nodes in this pedigree represent family colonies (composed of a breeding pair and their offspring). Successful pairing events are shown as arrows to each newly formed colony. The records used to construct this pedigree were incomplete and largely restricted to the prior 25 years, and in only a few instances where we able to trace relationships back to wild-caught progenitors (Figure 2A).
Genome sequencing and variant calling for H. glaber samples
Our reference genome for H. glaber was constructed from DNA collected from a single individual from our Kenya-derived collection (Stockholm, a.k.a. Hg-01083; see above). The genomes of 30 additional animals from this collection were sequenced to catalog genetic variants (see Supplementary Table 4 for animal data). For each of these animals, DNA was extracted from either a cell line or flash-frozen lung tissue (Supplementary Table 5). Genomes were also sequenced for four wild-caught animals from southern Ethiopia and six wild-caught animals from eastern Ethiopia (Figure 3A; Zemlemerova et al., 2021). For each of these Ethiopian animals, DNA was extracted from ethanol-stored liver samples. For each Kenya-derived and Ethiopian sample, DNA was extracted using a Quick-DNA miniprep kit (Zymo Research, Cat# D3025), and a linked-read library was prepared using the 10X Genomics Chromium™ kit. Paired-end sequencing (2 x 150bp) was performed for these libraries on an Illumina HiSeq 4000.
For variant calling, each sample was aligned to our H. glaber Stockholm reference genome using Long Ranger™ (version 2.2.2). Duplicate reads were filtered using Picard (version 2.19.1), and variants were called using HaplotypeCaller in GATK (version 4.0.0). Next, all samples were grouped together, and variants were jointly called using the GenotypeGVCFs tool in GATK v4.0 (Poplin et al., 2017). High-confidence variants were identified by Phred quality score (minimum of 30), maximum depth of coverage (0.95 quantile of coverage for each sample), and minimum depth of coverage (whichever number was greater between six or the 0.05 quantile of coverage for each sample). Additionally, variants had to be biallelic, and no more than 20% of samples could have missing data. Variant data are provided in Supplementary Data Files 2.
Kinship analysis
For sequencing of genetic variants from Kenyan H. glaber (described above), 27 of the animals were selected based on our pedigree to maximize diversity. Three full-sibling animals from a single colony, MS5, were also sequenced as positive controls for kinship analysis. The genome-wide panel of high-confidence polymorphisms segregating among these 31 animals (30 sampled, plus the Stockholm reference; n = 7,620,360) was used to estimate pairwise kinship values between these 31 animals. Kinship rw was measured using the equation:
where Xi and Xj are allelic dosages (0, 1, 2) of individuals i and j, and p is the frequency of the nonreference allele in the population at L markers (VanRaden, 2008; Goudet et al., 2018). All pairwise kinship values are provided in Supplementary Table 6.
For a population in Hardy–Weinberg equilibrium, kinship values are expected to vary between zero and one: zero corresponds to completely unrelated individuals, and one corresponds to identical twins. However, violations of Hardy–Weinberg equilibrium—particularly population structure—can also produce negative values. For example, since p is calculated across the full population being analyzed, individuals from subpopulations with distinct p values across many alleles, where individual i comes from the larger subpopulation (and therefore has greater influence on the overall value of p), will be biased toward positive values for the (Xi - 2p) term and negative values for the (Xj - 2p) term, producing products biased in the negative direction.
For Figure 2B, animals were clustered based on kinship using the dissimilarity values of (2 - rw)2, using cluster.hierarchy.linkage (method = ‘average’) from SciPy (v1.10.1). For any group of samples with kinship estimates >0.5 (the value expected for full siblings), all but one sample was removed for subsequent analyses. There were three such fully independent groups: group A (animals nmr_1901_5, nmr_1901_20, nmr_1901_21, nmr_1901_14); group B (animals nmr_11, nmr_12, nmr_13); and group C (animals nmr_1901_15, nmr_1901_16). Two additional groups were formed from threshold-exceeding kinship with individual animals from group A: nmr_5 with nmr_1901_20, and nmr_1901_5 with nmr_1909_9. The removal of seven animals (nmr_12, nmr_13, nmr_1901_9, nmr_1901_14, nmr_1901_16, nmr_1901_20, nmr_1901_21) left no kinship values exceeding 0.5, and those 24 remaining animals were used to represent the Kenya-derived population for further analyses.
Analyses of population divergence, admixture, heterozygosity, and FST
Our variant-sequenced H. glaber animals included wild-caught animals from eastern Ethiopia (n = 6), wild-caught animals from southern Ethiopia (n = 4), and captive animals descending from founders caught in Kenya (n = 24). Genetic differentiation between these three populations was measured by two methods: (1) construction of a maximum-likelihood phylogenetic tree and (2) principal component (PC) analysis of genotype scores for all samples. A random sample of 1% of the high-confidence polymorphisms (n = 299,933) was used to construct a maximum-likelihood tree for these 34 H. glaber samples using TreeMix v1.13 (Pickrell and Pritchard, 2012), run with the variant block size set to 10. Support for each node in the phylogeny was assessed by running 100 bootstrap replicates and reporting nodes with >90% support. Branch lengths in Newick-format representation for this tree are provided in Supplementary Text File 1.
For PC analysis, only polymorphisms measured in all samples were used to calculate the first eight PC values using the decomposition function in the scikit-learn Python package (version 0.22.2.post1). Evidence of recent admixture was evaluated using the f3 statistic (Patterson et al., 2012), implemented in TreeMix v1.13 (Pickrell and Pritchard, 2012), using the threepop function with 29.9 million polymorphisms split into blocks of size 10,000.
For Venn diagram construction, for each population considered, and for each polymorphic site where both alternative alleles were observed across all three populations, the distribution of each alternative allele was determined across the three populations and the allele was binned according to the combination of populations in which it was observed, at any frequency. Allele counts are therefore twice the number of polymorphic sites contributing to each diagram. For each trio of populations, alleles were only included if their identity was called in all three populations in at least four haplotypes or half of the haplotypes in that population, whichever was greater. The same criteria were applied when reporting the number of newly discovered polymorphisms. Raw values for Venn diagrams are provided in Supplementary Table 7.
For each of the three populations, per-site observed heterozygosity Ho was calculated as the number of samples with a heterozygous genotype, and the expected heterozygosity He as 2p(1 − p), where p is the frequency of the nonreference allele in each population. Genetic differentiation between populations FST was calculated as the ratio of between-population variance to total variance using ANOVA. Genotypes were scored as binary variables, and unbiased estimates of the within- and between-group variance were calculated using one-way ANOVA (Kelly and Hughes, 2019). To summarize these results, the average heterozygosities and FST were calculated across nonoverlapping windows of 50 polymorphisms across the genome.
Heterozygosity, FST and f3 analyses were performed across geographically defined populations of animals from either Kenya, southern Ethiopia, or eastern Ethiopia, as annotated in Supplementary Table 4, with high-kinship animals excluded from the Kenyan roster as described above. Additional analyses were performed comparing the same Kenyan population to two subpopulations from southern Ethiopia: southern Ethiopian population 1 included animals 3119 and 2953; population 2 included animals 3172 and 3205. As a control against small-number effects, the pairings for the southern Ethiopian subpopulations were swapped, producing two artificial populations. Artificial population 1 included animals 3119 and 3172, and artificial population 2 included animals 2953 and 3205.
Data availability statement
The following raw data are available from the SRA under BioProject PRJNA825530: IsoSeq transcriptomics for H. glaber (under experiment ID: SRX17869813); size-selected RNA-seq transcriptomics for H. glaber (see Supplementary Table 8 for experiment ID’s); short-read sequencing for the reference H. glaber genome (stockholm) and Kenya-derived H. glaber specimens (see Supplementary Table 5 for experiment ID’s). Additional data for construction of the H. glaber reference genome are available from the SRA under BioProject PRJNA1112813, including: HiTCH-seq data (under BioSample SAMN41435818); BioNano optical mapping (under BioSample SAMN41463170); 10X linked reads (under BioSample SAMN41492148); and PacBiolong reads (BioSamples SAMN41513184 and SAMN41513185). Data for whole-genome sequencing of the Damaraland mole-rat F. damarensis (10X linked reads) are available from the SRA under BioProject PRJNA1110213. Data for whole-genome sequencing of the guinea pig C. porcellus (10X linked reads) are available from the SRA under BioProject PRJNA1110269. Data for whole-genome sequencing of Ethiopian H. glaber samples for SNP discovery are available from the SRA under BioProject PRJNA1111087. For H. glaber, the Whole Genome Shotgun project has been deposited at DDBJ/ENA/GenBank under the accession JBPUHJ000000000. The version described in this paper is version JBPUHJ010000000. Supplemental Data Files 1-4, along with other Supplemental Materials, are available from Dryad under the DOI: https://doi.org/10.5061/dryad.m37pvmdf4. The Dryad repository includes raw fasta-formatted versions of the H. glaber, F. damarensis, and C. porcellus genomes used for analyses presented here.
Ethics statement
The animal study was approved by Buck Institute IACUC (A10138), Novato, CA. The study was conducted in accordance with the local legislation and institutional requirements.
Author contributions
KW: Data curation, Formal analysis, Investigation, Methodology, Project administration, Visualization, Writing – original draft, Writing – review & editing. PS: Data curation, Formal analysis, Investigation, Methodology, Project administration, Visualization, Writing – original draft. EZ: Data curation, Resources, Writing – review & editing. DK: Data curation, Resources, Writing – review & editing. NF: Investigation, Resources, Writing – review & editing. NY: Investigation, Resources, Writing – review & editing. AI: Investigation, Resources, Writing – review & editing. IL: Investigation, Resources, Writing – review & editing. KH-L: Investigation, Resources, Writing – review & editing. MS: Data curation, Resources, Writing – review & editing. JV: Investigation, Resources, Writing – review & editing. CJ: Resources, Supervision, Writing – review & editing. MR: Data curation, Resources, Supervision, Writing – review & editing. DB: Conceptualization, Supervision, Writing – review & editing. LL: Conceptualization, Data curation, Resources, Supervision, Writing – review & editing. JR: Conceptualization, Data curation, Formal analysis, Investigation, Project administration, Resources, Supervision, Writing – original draft, Writing – review & editing. RB: Conceptualization, Project administration, Resources, Supervision, Writing – original draft, Writing – review & editing.
Funding
The author(s) declare financial support was received for the research and/or publication of this article.
Conflict of interest
The research was funded by Calico Life Sciences LLC, where KW, PS, NF, NY, AI, IL, KH-L, MS, CJ, JV, MR, DB, GR, JR, and RB were employees at the time the study was conducted.
The remaining authors declare that the research was conducted in the absence of any commercial or financial relationships that could be construed as a potential conflict of interest.
The reviewer TC declared a past co-authorship with the author LL to the handling editor.
The authors declare that this study received funding from Calico Life Sciences LLC. The funder had the following involvement with the study: the majority of research and manuscript writing was performed by employees of Calico Life Sciences LLC who are listed as authors.
Generative AI statement
The author(s) declare that no Generative AI was used in the creation of this manuscript.
Any alternative text (alt text) provided alongside figures in this article has been generated by Frontiers with the support of artificial intelligence and reasonable efforts have been made to ensure accuracy, including review by the authors wherever possible. If you identify any issues, please contact us.
Publisher’s note
All claims expressed in this article are solely those of the authors and do not necessarily represent those of their affiliated organizations, or those of the publisher, the editors and the reviewers. Any product that may be evaluated in this article, or claim that may be made by its manufacturer, is not guaranteed or endorsed by the publisher.
Supplementary material
The Supplementary Material for this article can be found online at: https://www.frontiersin.org/articles/10.3389/fevo.2025.1689079/full#supplementary-material
| Supplementary Data Sheets 1-4 can be found online at https://doi.org/10.5061/dryad.m37pvmdf4.
Supplementary Figure 1 | Flow chart describing whole-genome assembly and annotation pipelines.
Supplementary Figure 2 | A maximally complete colony pedigree for our Kenya-derived H. glaber collection, constructed using all available historical records. Colored as in Figure 2A, which depicts the subset of this pedigree linking genome-sampled colonies. See Methods for details.
Supplementary Table 1 | Genome assembly statistics at each assembly step.
Supplementary Table 2 | Super-scaffold membership in each clustered group, based on chromosome-sorted sequencing (as depicted in Figure 1A).
Supplementary Table 3 | Whole genome alignment statistics for 10 focal species. The phylogenetic tree is illustrated in Supplementary Figure 1. Branch lengths in Newick format for this phylogenetic tree are provided in Supplementary Text File 1.
Supplementary Table 4 | Demographic and geographic data for genome-sequenced animals. For IDs, Local ID refers to the animal/sample ID used in this manuscript; where appropriate, Literature ID refers to how the animal is referenced in Ruby et al. (2018 & 2024). For the only Kenya-derived animal not referenced in those publications, a new ID was assigned according to that convention: Hg-08602. Latitude/longitude values refer to the collection sites for Ethiopian specimens: all are north and east, respectively.
Supplementary Table 5 | Tissue/cell sample type, coverage statistics, and polymorphism counts for each genome-sequenced animal. SRA experiment ID’s are also listed for each animal.
Supplementary Table 6 | Numerical values for kinship rw, as displayed in Figure 2B.
Supplementary Table 7 | Exact values for Venn diagrams from Figure 3.
Supplementary Table 8 | A table of SRA experiment ID’s for each slice of the size-selected RNA-seq data set (see Methods).
Supplementary Text File 1 | Netwick format text representations of phylogenetic trees, for genome-aligned species and H. glaber individuals from Kenya and Ethiopia.
Supplementary Data Sheet 1 | A json-formatted pandas data frame of the enrichment scores (estimating the likelihood of each pair of scaffolds deriving from the same chromosome) from flow-sorted chromosome sequencing.
Supplementary Data Sheet 2 | Gnu-zipped tar files containing per-animal, per-polymorphism information on either coverage (SuppDataFile2.Depth.tgz; unzips into 63 *.depth.csv files) or genotype (SuppDataFile2.Geno.tgz; unzips into 63 *.geno_score.csv files), for the polymorphisms discovered by whole-genome sequencing. Polymorphisms are organized into files by super-scaffold.
Supplementary Data Sheet 3 | Cactus-generated whole-genome alignments of the genome assemblies produced herein for H. glaber, F. damarensis, and C. porcellus, along with published genome assemblies from relevant mammals (see Methods). The gzipped tar files SuppDataFile3.maf.tgz and SuppDataFile3.sup.tgz contain the whole-genome alignment (.maf format) and supporting annotation files, respectively.
Supplementary Data Sheet 4 | A gnu-zipped tar file that contains gene annotation files, in .gff3 and .gp formats.
References
Bennett N. C. and Faulkes C. G. (2000). African mole-rats: ecology and eusociality (New York, NY, United States: Cambridge University Press).
Brett R. A. (1991a). “5. The ecology of naked mole-rat colonies: burrowing, food, and limiting factors,” in The biology of the naked mole-rat. Eds. Sherman P. W. and Alexander R. D. (Princeton University Press, Princeton), 137–184. doi: 10.1515/9781400887132-008
Brett R. A. (1991b). “The population structure of naked mole-rat colonies,” in The biology of the naked mole-rat. Eds. Sherman P. W., Jarvis J. U. M., and Alexander R. D. (Princeton University Press, Princeton), 97–136. doi: 10.1515/9781400887132-007
Buffenstein R. (2008). Negligible senescence in the longest living rodent, the naked mole-rat: insights from a successfully aging species. J. Comp. Physiol. B: Biochemical Systemic Environ. Physiol. 178 (4), 439–445. doi: 10.1007/s00360-007-0237-5
Buffenstein R. (2005). The naked mole-rat: a new long-living model for human aging research. The Journals of Gerontology Series A: Biological Sciences and Medical Sciences 60 (11), 1369–1377.
Buffenstein R., Park T. J., and Holmes M. M. (2021). The extraordinary biology of the naked mole-rat. Springer Nature, Cham, Switzerland.
Buffenstein R., Amoroso V., Andziak B., Avdieiev S., Azpurua J., Barker A. J., et al. (2022). The naked truth: a comprehensive clarification and classification of current ‘myths’ in naked mole‐rat biology. Biological Reviews 97 (1), 115–140.
Can E., Smith M., Boukens B. J., Coronel R., Buffenstein R., and Riegler J. (2022). Naked mole-rats maintain cardiac function and body composition well into their fourth decade of life. GeroScience 44, 731–465. doi: 10.1007/s11357-022-00522-6
Carneiro M., Rubin C. J., Di Palma F., Albert F. W., Alföldi J., Barrio A. M., et al. (2014). Rabbit genome analysis reveals a polygenic basis for phenotypic change during domestication. Science 345, 1074–1079. doi: 10.1126/science.1253714
Church D. M., Goodstadt L., Hillier L. W., Zody M. C., Goldstein S., She X., et al. (2009). Lineage-specific biology revealed by a finished genome assembly of the mouse. PloS Biol. 7, e1000112. doi: 10.1371/journal.pbio.1000112
Delaney M. A., Ward J. M., Walsh T. F., Chinnadurai S. K., Kerns K., Kinsel M. J., et al. (2016). Initial case reports of cancer in naked mole-rats (Heterocephalus glaber). Veterinary Pathol. 53, 691–696. doi: 10.1177/0300985816630796
Deuve J. L., Bennett N. C., O’Brien P. C. M., Ferguson-Smith M. A., Faulkes C. G., Britton-Davidian J., et al. (2006). Complex evolution of X and Y autosomal translocations in the giant mole-rat, Cryptomys mechowi (Bathyergidae). Chromosome Res. 14, 681–691. doi: 10.1007/s10577-006-1080-3
Dolezel J., Bartos J., Voglmayr H., and Greilhuber J. (2003). Nuclear DNA content and genome size of trout and human. Cytometry A. 51, 127–128. doi: 10.1002/cyto.a.10013
Faulkes C. G. and Bennett N. C. (2021). Social evolution in african mole-rats – A comparative overview. In. Adv. Exp. Med. Biol. 1319, 1–33. doi: 10.1007/978-3-030-65943-1_1
Fiddes I. T., Armstrong J., Diekhans M., Nachtweide S., Kronenberg Z. N., Underwood J. G., et al. (2018). Comparative annotation toolkit (CAT)-simultaneous clade and personal genome annotation. Genome Res. 28, 1029–1038. doi: 10.1101/gr.233460.117
Gallardo M. H., Bickham J. W., Kausel G., Köhler N., and Honeycutt R. L. (2003). Gradual and quantum genome size shifts in the hystricognath rodents. J. evolutionary Biol. 16, 163–169. doi: 10.1046/j.1420-9101.2003.00507.x
Goudet J., Kay T., and Weir B. S. (2018). How to estimate kinship. Mol. Ecol. 27, 4121–4355. doi: 10.1111/mec.14833
Hadi F., Smith E. J., and Khaled W. T. (2021). Naked mole-rats: resistant to developing cancer or good at avoiding it? In. Adv. Exp. Med. Biol. 1319, 341–352. doi: 10.1007/978-3-030-65943-1_14
Hess J., Braude S., Ingram C., and Templeton A. (2022). Population genetics of the naked mole-rat Heterocephalus glaber: The role of rivers in shaping genetic structure. Front. Ecol. Evol. 10. doi: 10.3389/fevo.2022.857660
Hilton H. G., Rubinstein N. D., Janki P., Andrea T., Bernstein N., et al. (2019). Single-cell transcriptomics of the naked molerat reveals unexpected features of mammalian immunity. PloS Biol. 17, e3000528. doi: 10.1371/journal.pbio.3000528
Holmes M. M. and Goldman B. D. (2021). Social behavior in naked mole-rats: individual differences in phenotype and proximate mechanisms of mammalian eusociality. Adv. Exp. Med. Biol. 1319, 35–58. doi: 10.1007/978-3-030-65943-1_2
Honeycutt R. L. K., Schlitter N., and Sherman D. A. P. W. (1991). “Genetic variation within and among populations of the naked mole-rat: evidence from nuclear and mitochondrial genomes,” in The biology of the naked mole-rat. Eds. Sherman P. W. J., Jarvis J. U. M., and Alexander R. D. (Princeton University Press, Princeton, NJ).
Hubley R., Finn R. D., Clements J., Eddy S. R., Jones T. A., Bao W., et al. (2016). The dfam database of repetitive DNA families. Nucleic Acids Res. 44, D81–D89. doi: 10.1093/nar/gkv1272
Ingram C. M., Troendle N. J., Gill C. A., Braude S., and Honeycutt R. L. (2015). Challenging the inbreeding hypothesis in a eusocial mammal: population genetics of the naked mole-rat. Heterocephalus Glaber. Mol. Ecol. 24, 4848–4655. doi: 10.1111/mec.13358
Jarvis J. U. M. (1981). Eusociality in a mammal: cooperative breeding in naked mole-rat colonies. Science 212, 571–573. doi: 10.1126/science.7209555
Jarvis J. U. M. (1985). Ecological studies on Heterocephalus glaber, the naked mole-rat. Kenya. National Geographic Society Research Reports, 20, 429–437.
Jarvis J. U. and Sale J. B. (1971). Burrowing and burrow patterns of East African mole-rats Tachyoryctes, Heliophobius and Heterocephalus. J. Zoology 163, 451–479. doi: 10.1111/j.1469-7998.1971.tb04544.x
Kelly J. K. and Hughes K. A. (2019). Pervasive linked selection and intermediate-frequency alleles are implicated in an evolve-and-resequencing experiment of drosophila simulans. Genetics 211, 943–961. doi: 10.1534/genetics.118.301824
König S., Romoth L. W., Gerischer L., and Stanke M. (2016). Simultaneous gene finding in multiple genomes. Bioinformatics 32, btw494. doi: 10.1093/bioinformatics/btw494
Krasheninnikova K., Diekhans M., Armstrong J., Dievskii A., Paten B., and O’Brien S. (2020). HalSynteny: A fast, easy-to-use conserved synteny block construction method for multiple whole-genome alignments. GigaScience 9, giaa047. doi: 10.1093/gigascience/giaa047
Kruglyak L. and Nickerson D. A. (2001). Variation is the spice of life. Nat. Genet. 27, 234–236. doi: 10.1038/85776
Lin T. D., Rubinstein N. D., Fong N. L., Smith M., Craft W., Martin-McNulty B., et al (2024). Evolution of T cells in the cancer-resistant naked mole-rat. Nature Communications 15 (1), 3145.
Lindblad-Toh K., Wade C. M., Mikkelsen T. S., Karlsson E. K., Jaffe D. B., Kamal M., et al. (2005). Genome sequence, comparative analysis and haplotype structure of the domestic dog. Nature 438, 803–819. doi: 10.1101/2022.05.22.492982
Ludwig A., Dibrov A., Myers G., and Pippel M. (2022). Estimating chromosome sizes from karyotype images enables validation of de novo assemblies. bioRxiv, 2022-05. doi: 10.1101/2022.05.22.492982
Palkopoulou E., Lipson M., Mallick S., Nielsen S., Rohland N., Baleka S., et al. (2018). A comprehensive genomic history of extinct and living elephants. Proc. Natl. Acad. Sci. 115, E2566–E2574. doi: 10.1073/pnas.1720554115
Park T. J., Reznick J., Peterson B. L., Blass G., Omerbašić D., Bennett N. C., et al. (2017). Fructose-driven glycolysis supports anoxia resistance in the naked mole-rat. Science 356, 307–311. doi: 10.1126/science.aab3896
Patterson N., Moorjani P., Luo Y., Mallick S., Rohland N., Zhan Y., et al. (2012). Ancient admixture in human history. Genetics 192, 1065–1935. doi: 10.1534/genetics.112.145037
Patterson B. D. and Upham N. S. (2014). A newly recognized family from the Horn of Africa, the Heterocephalidae (Rodentia: Ctenohystrica). Zoological J. Linn. Soc. 172, 942–963. doi: 10.1111/zoj.12201
Pfaff C. L., Parra E. J., Bonilla C., Hiester K., McKeigue P. M., Kamboh M. I., et al. (2001). Population structure in admixed populations: effect of admixture dynamics on the pattern of linkage disequilibrium. Am. J. Hum. Genet. 68, 198–207. doi: 10.1086/316935
Pickrell J. K. and Pritchard J. K. (2012). Inference of population splits and mixtures from genome-wide allele frequency data. PloS Genet. 8, e10029675. doi: 10.1371/journal.pgen.1002967
Poplin R., Ruano-Rubio V., DePristo M. A., Fennell T. J., Carneiro M. O., van der Auwera G. A., et al. (2017). Scaling accurate genetic variant discovery to tens of thousands of samples. biorxiv, 201178. doi: 10.1101/201178
Ramdas S., Ozel A. B., Treutelaar M. K., Holl K., Mandel M., Woods L. C. S., et al. (2019). Extended regions of suspected mis-assembly in the rat reference genome. Sci. Data 6, 39. doi: 10.1038/s41597-019-0041-6
Reeve H. K., Westneat D. F., Noon W. A., Sherman P. W., and Aquadro C. F. (1990). DNA ‘Fingerprinting’ Reveals high levels of inbreeding in colonies of the eusocial naked mole-rat. Proc. Natl. Acad. Sci. United States America 87, 2496–25005. doi: 10.1073/pnas.87.7.2496
Rhie A., McCarthy S. A., Fedrigo O., Damas J., Formenti G., Koren S., et al. (2021). Towards complete and error-free genome assemblies of all vertebrate species. Nature 592, 737–746. doi: 10.1038/s41586-021-03451-0
Romanenko S. A., Kliver S. F., Serdyukova N. A., Perelman P. L., Trifonov V. A., Seluanov A., et al. (2023). Integration of fluorescence in situ hybridization and chromosome-length genome assemblies revealed synteny map for Guinea pig, naked mole-rat, and human. Sci. Rep. 13, 21055. doi: 10.1038/s41598-023-46595-x
Ruby J.G., Smith M., and Buffenstein R. (2018). Naked mole-rat mortality rates defy gompertzian laws by not increasing with age. ELife 7, e31157. doi: 10.7554/eLife.31157
Ruby J. G., Smith M., and Buffenstein R. (2024). Five years later, with double the demographic data, naked mole-rat mortality rates continue to defy Gompertzian laws by not increasing with age. GeroScience 46, 5321–5341. doi: 10.1007/s11357-024-01201-4
Satopää V., Albrecht J., Irwin D., and Raghavan B. (2011). “Finding a kneedle in a haystack,” in Detecting Knee Points in System Behavior 31st International Conference on Distributed Computing Systems Workshops. Minneapolis, MN, USA: IEEE, 166–171. doi: 10.1109/ICDCSW.2011.20
Schneider V. A., Graves-Lindsay T., Howe K., Bouk N., Chen H. C., Kitts P. A., et al. (2017). Evaluation of GRCh38 and de novo haploid genome assemblies demonstrates the enduring quality of the reference assembly. Genome Res. 27, 849–864. doi: 10.1093/bioinformatics/btv351
Simão F. A., Waterhouse R. M., Ioannidis P., Kriventseva E. V., and Zdobnov E. M. (2015). BUSCO: assessing genome assembly and annotation completeness with single-copy orthologs. Bioinformatics 31 (19), 3210–3212. doi: 10.1093/bioinformatics/btv351
Smit A. F. A., Hubley R., and Green R. (2013).RepeatMasker open-4.0. Available online at: http://www.repeatmasker.org (Accessed June 3, 2019).
Soifer l., Fong N. L., Ireland A. T., Lam I., Sooknah M., et al. (2020). Fully phased sequence of a diploid human genome determined de novo from the DNA of a single individual. G3 Genes|Genomes|Genetics 10, 2911–2925. doi: 10.1534/g3.119.400995
Sokolowski D. J., Miclăuş M., Nater A., Faykoo-Martinez M., Hoekzema K., Zuzarte P., et al. (2024). An updated reference genome sequence and annotation reveals gene losses and gains underlying naked mole-rat biology. bioRxiv, 2024–2011. doi: 10.1101/2024.11.26.625329
Stanke M., Keller O., Gunduz I., Hayes A., Waack S., and Morgenstern B. (2006). AUGUSTUS: A b initio prediction of alternative transcripts. Nucleic Acids Res. 34, W435–W439. doi: 10.1093/nar/gkl200
Šumbera R., Uhrová M., Mikula O., Bryja J., Frýdlová P., Zemlemerova E., et al. (2024). Not one but three species of the naked mole-rat, a new biomedical model. Res. Square. doi: 10.21203/rs.3.rs-5587985/v1
VanRaden P. M. (2008). Efficient Methods to Compute Genomic Predictions. J. Dairy Sci. 91, 4414–4423. doi: 10.3168/jds.2007-0980
Zemlemerova E. D., Kostin D. S., Gromov A. R., Martynov A. A., Alexsandrov D. Y., and Lavrenchenko L. A. (2020). Preliminary data on phylogeography of the naked mole-rat Heterocephalus glaber (Rodentia: Heterocephalidae). Russian Journal of Genetics 56 (3), 370–374.
Zemlemerova E. D., Kostin D. S., Lebedev V. S., Martynov A. A., Gromov A. R., Alexandrov D. Y., et al. (2021). Genetic diversity of the naked mole-rat heterocephalus glaber. J. Zoological Systematics Evolutionary Res. 59, 323–405. doi: 10.1111/jzs.12423
Keywords: naked mole-rat, genome, population structure, polymorphism, genetic diversity
Citation: Wright KM, Sood P, Zemlemerova ED, Kostin DS, Fong NL, Yi N, Ireland AT, Lam I, Hardell-Lewis KN, Smith M, Villalta J, Jan CH, Roy MA, Botstein D, Lavrenchenko LA, Ruby JG and Buffenstein R (2025) Geographic distribution of genetic diversity of Heterocephalus glaber analyzed using whole genome sequencing and a chromosome-scale genome assembly. Front. Ecol. Evol. 13:1689079. doi: 10.3389/fevo.2025.1689079
Received: 20 August 2025; Accepted: 28 October 2025;
Published: 24 November 2025.
Edited by:
Stephane Boissinot, New York University Abu Dhabi, United Arab EmiratesReviewed by:
Martin Knytl, Charles University, CzechiaTerrence C. Demos, Field Museum of Natural History, United States
Copyright © 2025 Wright, Sood, Zemlemerova, Kostin, Fong, Yi, Ireland, Lam, Hardell-Lewis, Smith, Villalta, Jan, Roy, Botstein, Lavrenchenko, Ruby and Buffenstein. This is an open-access article distributed under the terms of the Creative Commons Attribution License (CC BY). The use, distribution or reproduction in other forums is permitted, provided the original author(s) and the copyright owner(s) are credited and that the original publication in this journal is cited, in accordance with accepted academic practice. No use, distribution or reproduction is permitted which does not comply with these terms.
*Correspondence: Rochelle Buffenstein, cmJ1ZmZlbkB1aWMuZWR1; J. Graham Ruby, Z3JhaGFtQGNhbGljb2xhYnMuY29t
†Present address: Kevin M. Wright, Actio Biosciences, San Diego, CA, United States