 Brian D. Harris1*
 Aleksandra Ostojic1
 Lenore P. Tedesco2Keith VanDerSys3
 Susan Bailey4
 Justin L. Shawler1Navid H. Jafari5†Monica Chasten6
- 1Coastal Hydraulics Laboratory, Engineer Research and Development Center (ERDC), Vicksburg, MS, United States
- 2The Wetlands Institute, Stone Harbor, NJ, United States
- 3Office of Landscape and Architecture, University of Pennsylvania, Philadelphia, PA, United States
- 4Environmental Laboratory, Engineer Research and Development Center (ERDC), Vicksburg, MS, United States
- 5Department of Civil and Environmental Engineering, Louisiana State University, Baton Rouge, LA, United States
- 6Operations Division, US Army Corps of Engineers- Philadelphia District, Philadelphia, PA, United States
A Correction on
Wetland elevation change following beneficial use of dredged material nourishment
By Harris BD, Ostojic A, Tedesco LP, VanDerSys K, Bailey S, Shawler JL, Jafari NH and Chasten M (2025) Front. Ecol. Evol. 13:1518759. doi: 10.3389/fevo.2025.1518759
In the published article, there was a mistake in Figure 7. The y-axis stated “Elevation Gain (cm)”, when we actually showed “Consolidation.” The figure has been remade with the correct data and appears below.
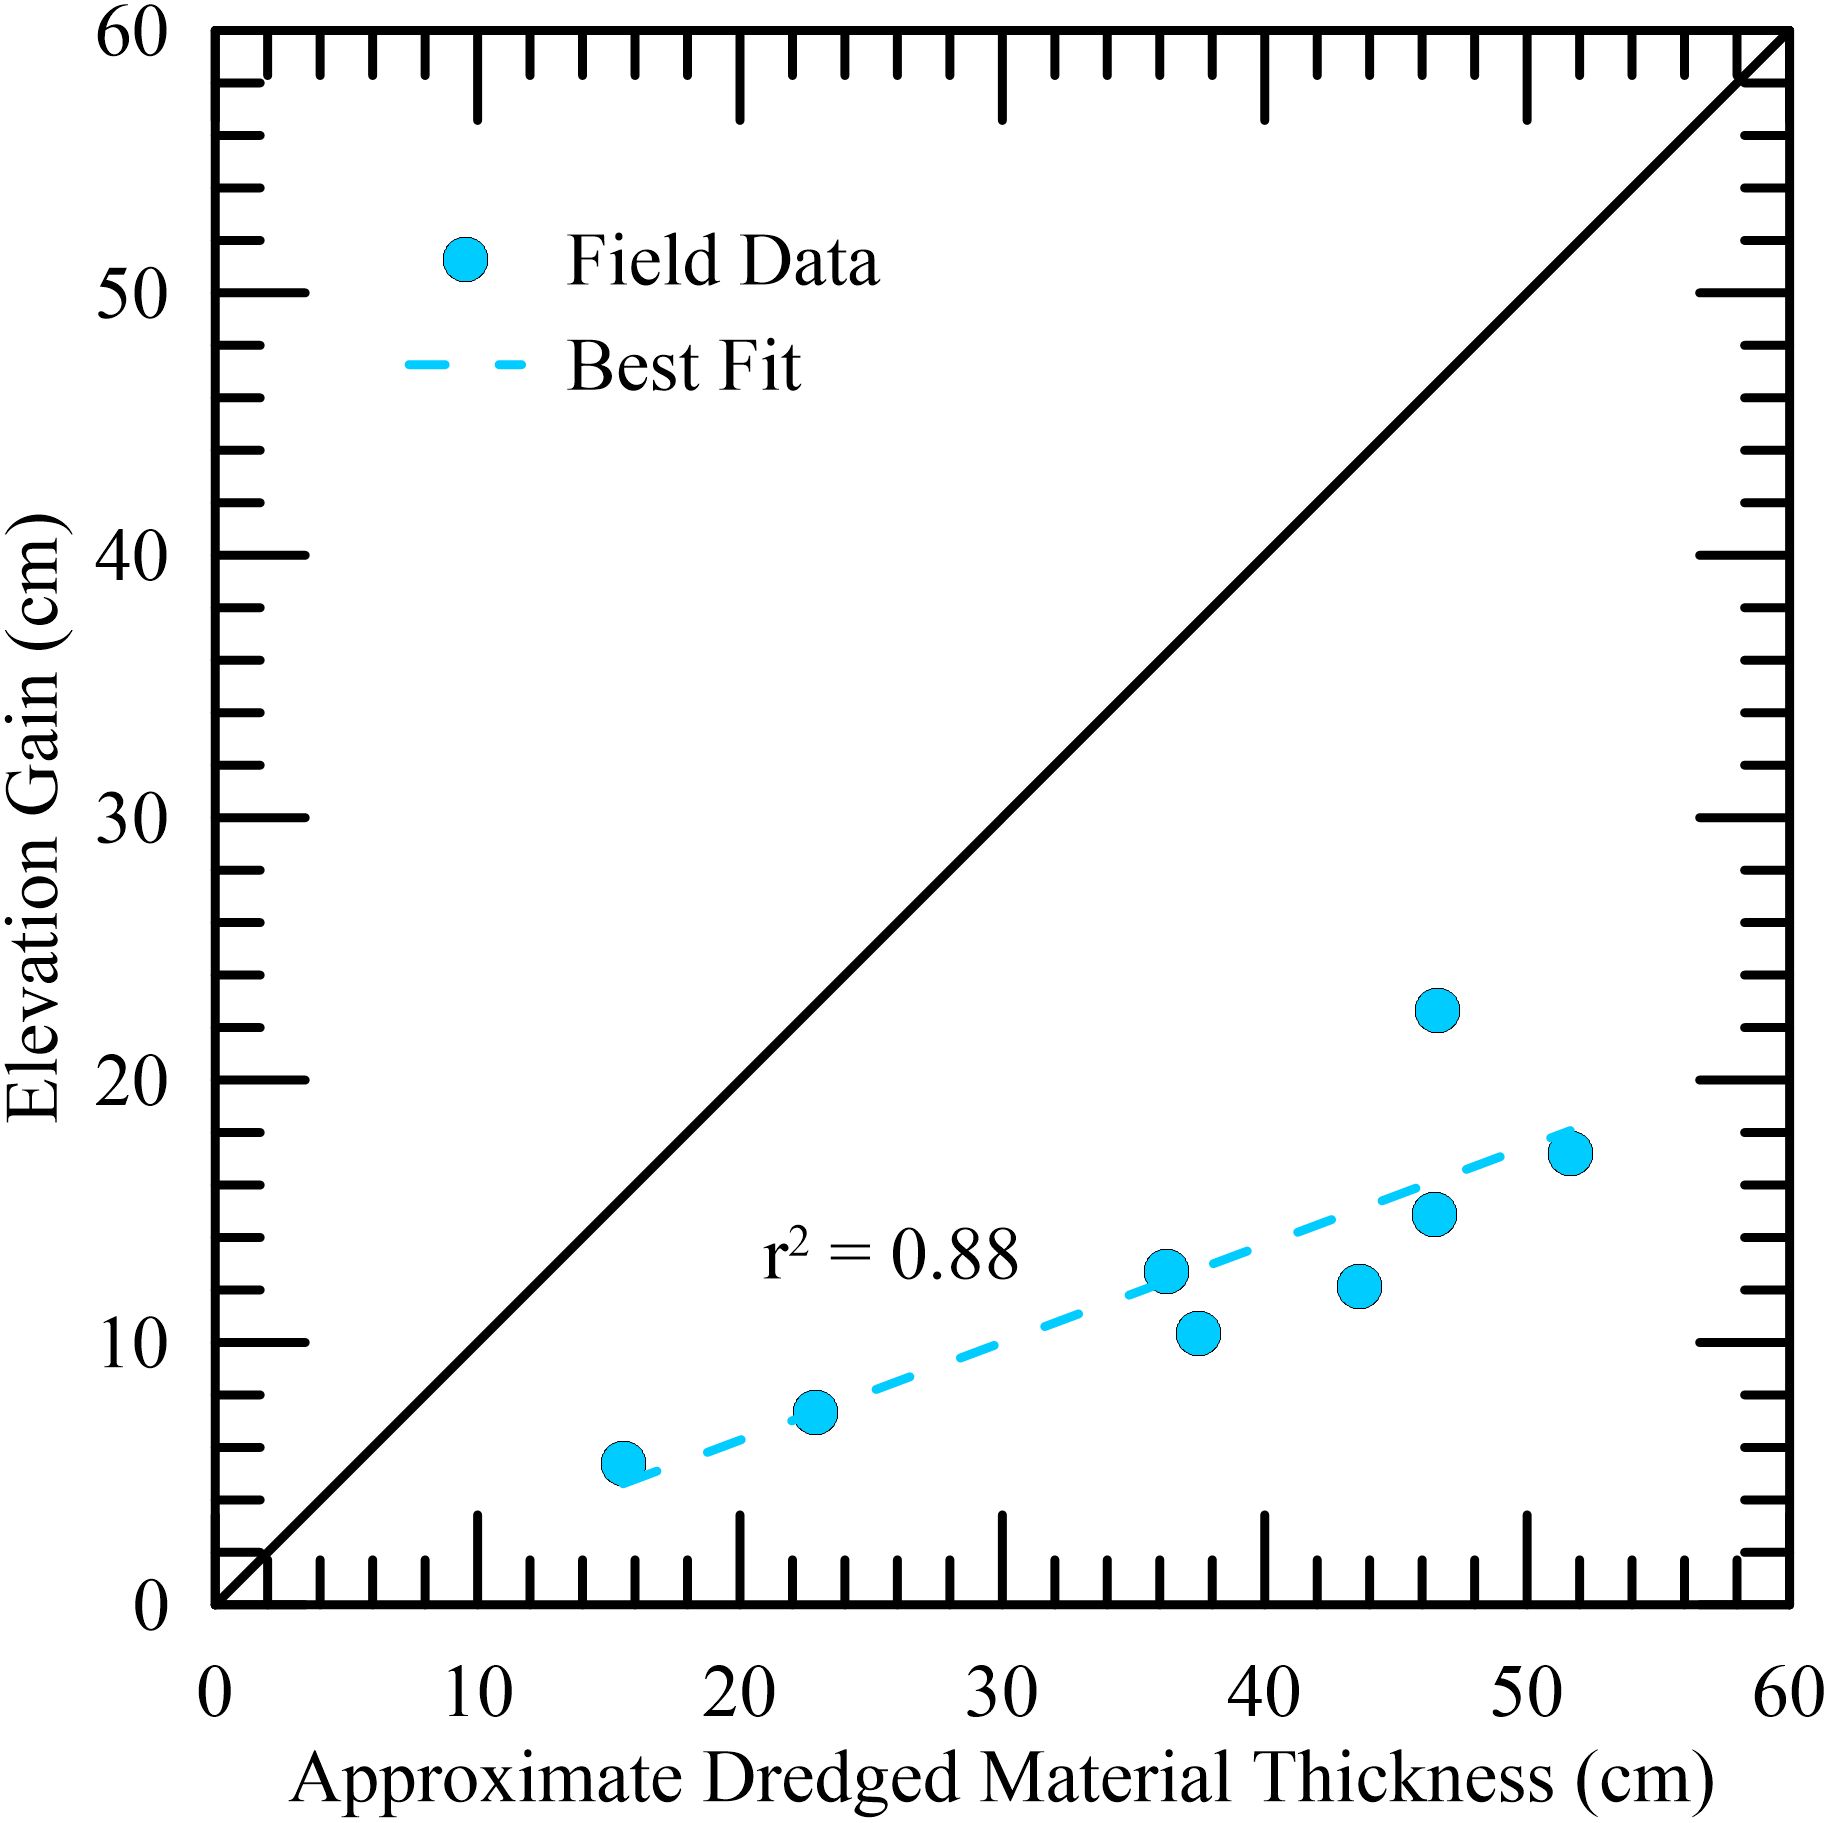
Figure 7. Comparison of approximate dredged fill thickness to elevation gain from field survey data at two years post-nourishment.
We would like to acknowledge the person that pointed out the error we made in Figure 7. The Acknowledgements has thus been updated as follows:
The authors would like to acknowledge the U.S. Army Corps of Engineers through the Dredging Operations and Environmental Research (DOER) Program and the Department of Defense (DoD) through its Science, Mathematics, and Research for Transformation (SMART) program. In addition, the USACE Philadelphia District, Joint Airborne Lidar Bathymetry Technical Center of Expertise (JALBTCX), The Wetland Institute, and the University of Washington NSF Natural Hazards Engineering Research Infrastructure (NHERI) Reconnaissance Experimental Facility (RAPID) for support of field data collection. Lastly, the authors would like to thank Mary Bryan Barksdale for noting an error within Figure 7 of the original paper that led to clarifying correction to this article.
In the Abstract, we stated that approximately one-third of elevation loss was the result of consolidation, when this was really two-thirds. The text has been corrected to read:
“The beneficial use of dredged material (BUDM) to nourish degrading wetlands is a direct solution to increase surface elevation to help wetlands keep pace with sea level rise (SLR). While there have been numerous demonstrations of BUDM in wetland environments, there is a limited understanding of the resultant spatial and temporal elevation response due to consolidation of the dredged material and underlying wetland foundation soils. To address this, surface elevations were monitored following multiple BUDM nourishments on a back-bay island in New Jersey. Field data was compared to consolidation models to assess the viability of current geotechnical modeling practices. Multispectral surveys were performed to document the revegetation of the nourished island over time. The placement of dredged material smothered the vegetation, but the site experienced significant revegetation (low of 22% cover in August 2021 to 52% in September 2023) after three full growing cycles. Approximately two years post BUDM, the nourished area experienced a 0.19 ± 0.11-m increase in elevation. The comparison of elevation immediately after nourishment and two years post-nourishment found that approximately two-thirds of elevation loss was the result of consolidation of deposited dredged material and the underlying wetland foundation. It was found that a reliance on solely laboratory data can induce a large degree of uncertainty within projected surface elevations. Thus, the implementation of in-situ geotechnical methods is strongly advised when possible. This investigation allowed for a comprehensive examination of geotechnical modeling methods for planning wetland nourishments, including predicting the ability to keep pace with sea level rise. Ultimately, the two BUDM nourishments offset the effects of SLR by approximately 18–28 years.”
A correction has been made to Section 3.3 Consolidation modeling, paragraph 2. The description of Figure 7 stated we saw a 33% loss of elevation due to consolidation, but this was 66%. The text has been updated to read:
“A comparison of approximate dredged material thickness and surface elevation gain derived from field data is shown in Figure 7. The data indicate a positive correlation between approximate dredged material thickness and elevation gain. A linear trend shows that nearly 66% of gained elevation post placement was lost due to self-weight consolidation of the dredged material and primary consolidation of the foundation soils two years post BUDM nourishment. This relationship is dependent on the environment, soil properties of the dredged material and foundation, site geometries (size, slopes, containment), and tidal conditions, among others. In addition, the results displayed are from the unique dredged material placements (e.g., Phase 1 and 2) and not a combination, thus results from the first nourishment may not represent true values of total primary consolidation.”
A correction has been made to Section 4.2 Wetland surface elevation, paragraph 2. The description of Figure 7 stated we saw a 33% loss of elevation due to consolidation, but this was 66%. The text has been updated to read:
“A comparison of dredged fill thicknesses to overall elevation gain revealed that approximately two-thirds of gained elevation was lost due to consolidation two years post placement (Figure 7). This consolidation is a combination of self-weight consolidation of dredged material and primary consolidation of the wetland foundation. By contrast, Graham and Mendelssohn (2013) found that 23-cm of increased elevation following a BUDM nourishment in a brackish marsh in Louisiana was largely erased 2.5-years later. The difference between our observations at Sturgeon Island and that of Graham and Mendelssohn (2013) may be attributable to differing subsurface conditions, as Sturgeon Island has a shallow sand foundation (<2-m below ground surface) that is significantly less compressible than typical deltaic soils found within Louisiana.”
A correction has been made to Section 5 Conclusions, 1st bullet point. The description of Figure 7 stated we saw a 33% loss of elevation due to consolidation, but this was 66%. The text has been updated to read:
“With each BUDM placement, the surface elevation became flatter as dredged material filled in the depressions and was reworked by tides and currents. Two-thirds of the immediate elevation gain was eventually lost two-years post nourishment due to a combination of the dredged fill and wetland foundation consolidation and sediment reworking.”
The original version of this article has been updated.
Publisher’s note
All claims expressed in this article are solely those of the authors and do not necessarily represent those of their affiliated organizations, or those of the publisher, the editors and the reviewers. Any product that may be evaluated in this article, or claim that may be made by its manufacturer, is not guaranteed or endorsed by the publisher.
Keywords: wetland restoration, consolidation, cone penetrometer test, lidar, ecogeomorphology, compaction, elevation capital
Citation: Harris BD, Ostojic A, Tedesco LP, VanDerSys K, Bailey S, Shawler JL, Jafari NH and Chasten M (2025) Correction: Wetland elevation change following beneficial use of dredged material nourishment. Front. Ecol. Evol. 13:1703114. doi: 10.3389/fevo.2025.1703114
Received: 10 September 2025; Accepted: 17 October 2025;
Published: 23 October 2025.
Edited and reviewed by:
Stephanie Dohner, Naval Research Laboratory, United StatesCopyright © 2025 Harris, Ostojic, Tedesco, VanDerSys, Bailey, Shawler, Jafari and Chasten. This is an open-access article distributed under the terms of the Creative Commons Attribution License (CC BY). The use, distribution or reproduction in other forums is permitted, provided the original author(s) and the copyright owner(s) are credited and that the original publication in this journal is cited, in accordance with accepted academic practice. No use, distribution or reproduction is permitted which does not comply with these terms.
*Correspondence: Brian D. Harris, QnJpYW4uRC5IYXJyaXNAdXNhY2UuYXJteS5taWw=
†Present address: Navid H. Jafari, Department of Civil & Environmental Engineering, Texas A&M University, College Station, TX, United States