 Mary-Louise Leger
 Louis M. Gomez
- School of Education and Information Studies, University of California, Los Angeles, CA, United States
This study investigates how educational leaders within a research-practice partnership used improvement science thinking and tools to address declining attendance rates following the COVID-19 pandemic. Utilizing time-series data and run charts, central office leaders and school administrators visualized system performance, allowing them to see variations and patterns over time. The partnership’s focus on variation helped leaders challenge their initial biases, leading to a more accurate understanding of the factors driving attendance improvement. Cypress Elementary, identified as a positive outlier, demonstrated that small-scale, context-specific interventions, including personalized outreach and incentives, played a crucial role in enhancing attendance. The study also highlights the importance of building leadership capability to interpret data effectively and implement sustainable, locally relevant solutions. Through this process, leaders developed greater proficiency in diagnosing system-level issues and enacting systemic improvements, contributing to the broader literature on data-driven decision-making, sensemaking, and educational equity. This research demonstrates how improvement science can support leaders in understanding data more clearly and building their capacity to lead system-wide improvements.
Introduction
The contemporary educational landscape is marked by a robust national discourse around data-driven decision-making. However, despite the widespread availability of data and a desire among practitioners to leverage it for systems improvement, there is evidence suggesting that educators struggle to effectively interpret and utilize available data (Bertrand and Marsh, 2015). One explanation why practitioners may struggle in using data to drive school improvement comes from research on attribution theory and sensemaking (Marsh, 2012; Weick, 1995). This scholarship underscores the influence of personal beliefs and biases on data interpretation. It suggests that educators often view data through a lens shaped by their existing beliefs, leading to confirmation biases that can undermine efforts to change practices and improve systems (Bertrand and Marsh, 2015; Coburn, 2001). These cognitive and social processes can constrain well-intentioned efforts to use data for improvement. For example, teachers may attribute low student test scores to various causes, including prior instruction (Datnow et al., 2012) or perceived student deficits (Schildkamp and Kuiper, 2010). In turn, how practitioners attribute causality may have implications for how teachers use data and may limit their ability to glean new insights or effectively plan for improvement (Jussim and Harber, 2005; Schildkamp and Kuiper, 2010).
To build the capacity for genuine and sustainable improvement, educators need methods that enable them to use data effectively and understand the systems in which they practice. Such methods should mitigate the natural biases exerted by personal beliefs and experiences, which can often limit data interpretation and constrain new insights. Previous approaches to addressing this challenge include blinded data analysis (Malouff and Thorsteinsson, 2016), collaborative data inquiry teams (Wayman et al., 2017), and protocols for data interpretation, such as Data Wise (Boudett et al., 2008).
This study uses a case study methodology to examine how educational leaders engaged in an improvement science-focused research-practice partnership identified and addressed variation in attendance outcomes. Improvement science provides a structured approach to tackling complex educational challenges by emphasizing iterative learning and system-level change. While the six core principles of improvement science (Bryk et al., 2015) serve as its conceptual foundation, their enactment varies in practice (Lewis, 2015). Typically, improvement science-informed initiatives involve practitioners defining a problem of practice and using iterative data collection to analyze and address it (Hinnant-Crawford, 2020).
This research effort was guided by the overarching question: How can improvement science-informed inquiry build local capability to understand and address educational systems? We describe a partnership that brought together educational and researchers in a collaborative effort to use run charts to visualize time series data. Using these visualizations, we analyzed attendance trends, which had declined during COVID-19 and had yet to return to pre-pandemic levels. In addition to using improvement science and the structured methods it provides for analyzing system variation, we bring a capability perspective (Sen, 1992; Nussbaum, 2006) to the analysis we offer here. Capability offers a perspective on how leaders develop the agency and capacity to enact data-driven change that aims toward sustainability. By integrating these perspectives, this study investigates not only how improvement science can enhance leaders’ ability to interpret data but also how it characterizes their ability to define and pursue school improvement in locally meaningful ways.
The work aligned closely with two of the six key principles of improvement science: (1) “Variation in performance is the core problem to address,” which emphasizes examining differences in outcomes and processes to define problems and monitor, and (2) “See the system producing the current outcomes,” which encourages system-level thinking to address root causes rather than symptoms. Our findings demonstrate that improvement science tools—run charts in particular—offered educational leaders novel ways to see and interpret their data and understand it systematically. We demonstrate how improvement thinking helped to build the local capability of leaders to pursue improvement that aligns with their values and goals (Sen, 1992).
Through this partnership, leaders further developed their capability to understand and address the system producing low attendance outcomes in context-responsive and locally meaningful ways. This work contributes to the growing body of literature on data-driven decision-making, attribution theory, and sensemaking in education. By showcasing one such application of improvement science, we highlight the potential of this approach to drive meaningful and sustainable improvements in schools.
Attendance improvement at the nexus of attribution, sensemaking, and capability building
Data-driven decision-making through the lens of attribution and sensemaking theory
Attribution theory and Sensemaking theory suggest that educators often interpret data through the lens of their personal beliefs, leading to a confirmation bias that can undermine efforts to change practices and improve systems (Bertrand and Marsh, 2015). Attribution theory suggests that the way individuals explain the causes of observed outcomes influences their motivation and actions to address those outcomes (Schildkamp and Kuiper, 2010; Seifert, 2004). For example, if teachers attribute poor student performance to external factors such as student deficits that are immutable, rather than malleable growth areas, they may feel less motivated to change their instructional practices (Jussim and Harber, 2005). Further, if they see schooling outcomes as a result of their own instructional methods, practitioners are more likely to engage in efforts to improve their teaching (Datnow et al., 2012).
Sensemaking theory complements this assertion by emphasizing how individuals construct meaning from their experiences, filtering information through existing beliefs and knowledge, which can lead to varied interpretations and actions even when faced with the same data (Weick, 1995; Spillane et al., 2002). While some research points to the potential of data to inform and shape practices substantively (Hamilton et al., 2009), other studies show that teachers may not significantly alter their practice based on data (Ikemoto and Marsh, 2007). One reason for this discrepancy hinges on how practitioners interpret data. As practitioners encounter data, their sensemaking is influenced by their mental models and frames of understanding, which are deeply embedded in prior experience and often lead to biased interpretations of data rather than straightforward assessment and application of data (Weick, 1995; Spillane and Miele, 2007). At base, it follows that practitioners’ ability to use data to glean new insights for improvement can be influenced or constrained by prior knowledge, beliefs, and values (Coburn, 2001; Marsh, 2012). In this study, we explore the possibility that improvement science thinking and the tools associated with it can interrupt the impact of prior experience and ongoing bias on seeing current reality. In the case of attendance, these tools may provide a lens to see attendance as connected to a multifaceted systemic complex, including poverty, health disparities, transportation issues, and school climate (Chang et al., 2018; Hofferth et al., 2001; Kearney, 2008). School leaders, for example, might attribute persistent absenteeism to family disengagement while overlooking how rigid schedules, limited transportation, or exclusionary disciplinary practices may be contributing factors (Childs and Grooms, 2017; Moonie et al., 2008; Teasley, 2004). In turn, these leaders may be more likely to adopt punitive attendance policies that unintentionally reinforce absenteeism by alienating students and families rather than addressing root causes (Teasley, 2004; Monahan et al., 2014). Attribution and sensemaking theory may help to illuminate how explanations such as these can limit schools’ ability to design effective interventions (e.g., Grooms and Bohorquez, 2022).
Improving schools through seeing the system and attending to variation
Improvement science has gained prominence as a structured framework for navigating the complexities of school improvement. While encompassing various approaches—such as engagement in Networked Improvement Communities (Dolle et al., 2013) and iterative Plan-Do-Study-Act cycles (Tichnor-Wagner et al., 2017)—its foundation rests on six core principles that guide the development, testing, implementation, and dissemination of change (Bryk et al., 2015). These principles, outlined in Table 1, provide a systematic approach to addressing persistent challenges in education. This study draws on all six principles but focuses particularly on the second and third, which are central to enhancing leaders’ ability to engage in data-driven inquiry for systemic improvement. Principle #2 underscores the importance of examining variation in outcomes and processes to accurately define problems and track progress, while Principle #3 promotes a systems-thinking perspective that seeks to identify and address root causes rather than surface-level symptoms. Together, these principles “suggest” that improving schools requires seeing the current system that produces unwanted variability in educational outcomes (Bryk et al., 2015; Senge, 2006; Shaked and Schechter, 2014).
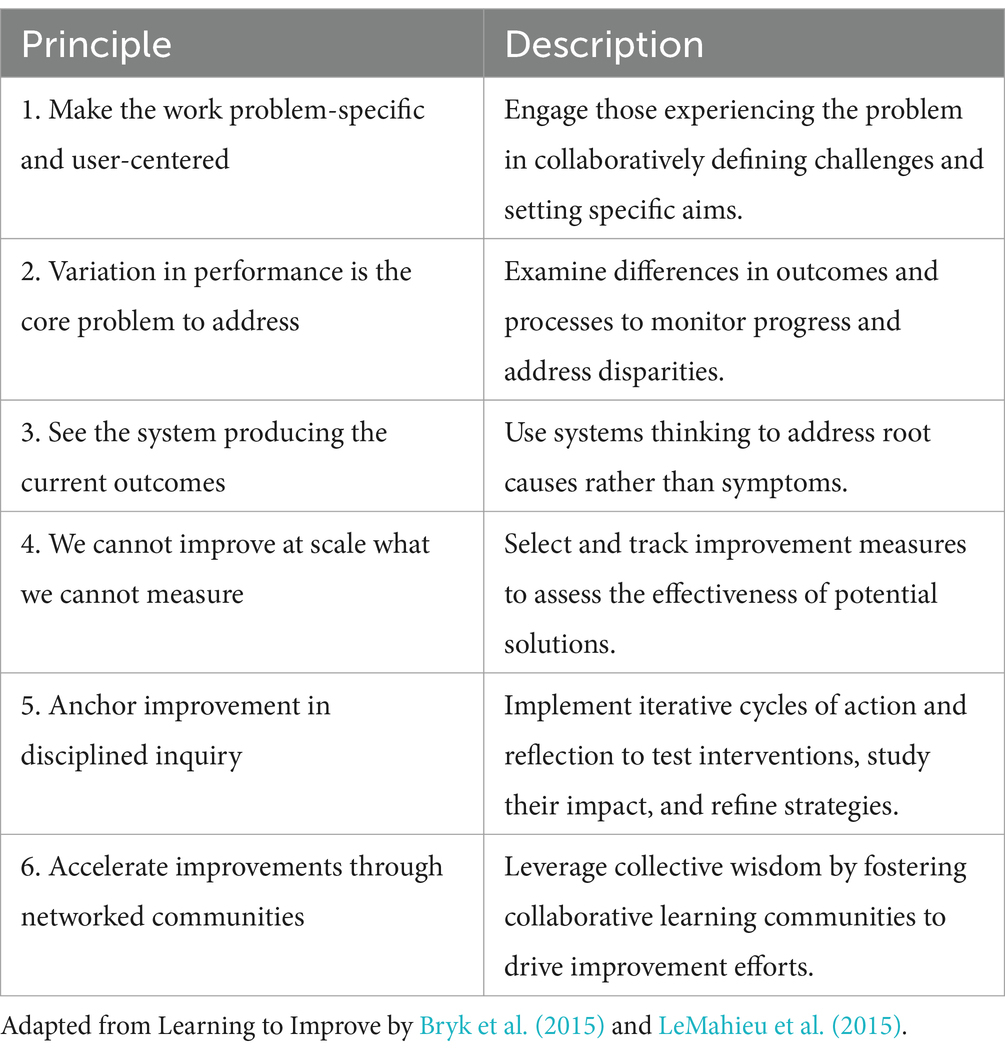
Table 1. Principles of educational improvement science.
By understanding a system performance’s complex and interconnected nature, educators and administrators can make more informed decisions that address root causes rather than just symptoms. This perspective helps identify systemic barriers that may be invisible when focusing solely on individual components or symptomatic events that can be driven by views of outcomes that are clouded by prior knowledge (Arnold and Wade, 2015; Sterman, 2000). By considering the broader system and its interconnected components, school leaders may be able to expand the number of choices, identify possible consequences of various alternatives, and seek and analyze relevant information that leads to meaningful improvements (Holmes et al., 2012; Tejeda and Ferreira, 2014; Maitlis and Christianson, 2014; Smerek, 2011).
By paying attention to variability in system performance across different groups of students, teachers, and schools, educators can gain valuable clarity into what contributes to success or failure in different contexts (Bryk et al., 2015). Time-series data is particularly valuable in this regard, as it allows educators to track performance over time, revealing trends that may not be visible in static data snapshots. The dynamic nature of time-series data may help counterbalance the natural limitations in human attributional abilities by showing the progression of changes, thus helping practitioners differentiate between isolated events and long-term patterns (Lewis, 2015; Yeager et al., 2013). Moreover, time-series representations allow for more effective identification of outliers—those performing significantly better (positive outliers) or worse (negative outliers) than their peers under comparable conditions. Positive outliers offer insights into areas of exceptional performance, which may illuminate underlying practices or strategies contributing to success, while negative outliers highlight specific areas of concern requiring targeted intervention (Durá and Singhal, 2009; Pascale et al., 2010). By leveraging time series data to identify these outliers and understand what is working, for whom, and under what conditions (Bryk et al., 2015), we can mitigate the influence of personal biases or preconceived notions when evaluating performance outcomes. Examining both positive and negative outliers can thus provide a deeper understanding of the factors driving both high and low performance, fostering the development of improvement theories to guide future actions.
Several improvement science tools can help educational leaders use time series data to better understand their systems and to detect outliers. For example, run charts plot data points over a period, helping identify trends and patterns that may go unnoticed (Langley, 2009; Grunow et al., 2024). Run charts reveal changes in system performance over time, enabling educators to monitor the effectiveness of interventions and make necessary adjustments. Control charts are similar to run charts, except they include control limits, typically set 2–3 standard deviations above the average, that are useful in detecting kinds of variation (Langley, 2009; Grunow et al., 2024). By visualizing patterns of variation over time, these tools can help leaders see the system, confront their preconceptions, and identify both positive trends and areas of concern.
The capability approach: origins and applications to school improvement
The capability approach, conceptualized by Sen (1992) and Nussbaum (2006), is a theoretical framework that focuses on the development of human wellbeing shaped by the freedoms individuals have to pursue their own values and interests. Originally formulated in the context of economic development, the approach challenges conventional measures of progress, arguing that development should be assessed not solely by wealth or material resources but by the real opportunities individuals have to achieve their aspirations. The capability approach sees true wellbeing as not merely the attainment of specific outcomes but the freedom to choose and pursue those outcomes in ways that are meaningful to individuals and their communities.
At the core of the capability approach are three interrelated concepts: functionings, capabilities, and agency. Functionings refer to actual achievements—such as being healthy, participating in education, or engaging in civic life (Sen, 1985). Capabilities, on the other hand, represent the set of real opportunities available to an individual or community—the substantive freedoms they have to achieve functionings they value (Sen, 1985; Sen, 1992). This distinction highlights that true wellbeing is not just about achieving specific outcomes but also having the freedom to choose and pursue those outcomes. Agency, the third pillar of the capability approach, refers to individuals’ and collectives’ ability to shape their own futures. Sen (1999) argues that development efforts should not dictate what people ought to value but should instead create conditions that enable them to define and pursue their own valued goals.
Though originally developed within the field of economics, the capability approach has been applied to education and school improvement. Scholars have drawn parallels between the approach’s emphasis on expanding individual freedoms and the role of education in fostering human potential (Toson et al., 2013). Hart (2012), for instance, proposed the capability approach as a leadership framework that guides educational institutions in expanding students’ opportunities to lead lives they have reason to value. When applied to school improvement, this perspective shifts the focus beyond providing resources and interventions to designing educational systems that genuinely expand the freedoms and opportunities of students and educators.
From this standpoint, effective school improvement is not merely about achieving better academic outcomes but about ensuring that students, practitioners, and communities have the real ability to pursue educational and professional trajectories that are both locally and globally meaningful. Educational wellbeing should not be imposed by externally defined measures of success but should empower individuals to make decisions about the kind of life they value, while simultaneously removing systemic barriers that constrain their agency (Gutiérrez, 2016). In their discussion of how school improvement can accomplish meaningful equity, Eddy-Spicer and Gomez (2022) extend this argument to the capability framework, writing that “the ability of education to give students access to the knowledge, tools, and routines, together with productive peer relationships that enable the exploration of one’s capabilities to the fullest, to realize the unfettered prospect of translating capabilities (what we value and can expect to attain) into functionings (what we are currently doing) offers a benchmark for strong equity in education” (p. 93).
When we couple capability and improvement, we must necessarily adopt a more comprehensive and community-driven view of what constitutes educational success. This perspective demands that improvement efforts make space for the agency of local actors, particularly those in historically marginalized communities, ensuring that both the goals of improvement and the knowledge systems embedded within it are locally meaningful. Conceptualizing school improvement as capability building attunes us to the ways that improvers design school improvement that offers communities “the freedom to choose one kind of life rather than another” (Sen, 1992, p. 77), both in the outcomes it sets out to achieve and the processes by which those outcomes are realized.
Attendance challenges in COVID-19 and beyond
The COVID-19 pandemic exacerbated attendance challenges nationwide, making it critical to examine strategies that support student attendance (Liu, 2022; Darling-Aduana et al., 2022). In 2020, one in four American students was chronically absent (Santibañez and Guarino, 2021), and in the years that followed, many districts continued to report thousands of missing students, even after accounting for alternative schooling options (Musaddiq et al., 2022). Poor attendance is strongly linked to adverse outcomes, including lower achievement, increased dropout rates, unemployment, and mental health challenges (Egger et al., 2003; Kearney and Graczyk, 2014). Conversely, a growing body of research suggests that sustained improvements in attendance contribute to higher academic achievement, stronger relationships with teachers and peers, on-time graduation, and greater postsecondary success (Gottfried, 2019; Ready, 2010; Balfanz and Byrnes, 2012). Additionally, improving attendance can create a reinforcing cycle of engagement: as students attend more regularly, they receive more instructional time, build stronger social connections, and develop a greater sense of belonging in school—factors that, in turn, further reduce absenteeism (Wang and Dishion, 2012). Given these benefits, improving attendance is not just a matter of increasing seat time but a potentially critical lever for enhancing student learning, engagement, and overall wellbeing.
One challenge lies in how attendance data is measured and interpreted. Chronic absenteeism is defined as missing at least 15 school days or missing 10% or more of school days in one academic year (U.S. Department of Education, Office of Civil Rights, 2016). Therefore, chronic absenteeism rates provide insight into which students are missing excessive school days but offer a limited understanding of broader school-wide attendance trends (Liu, 2022). In contrast, Average Daily Attendance (ADA) captures the proportion of students present on a given day but can mask chronic absenteeism problems by averaging attendance across all students (Chang and Romero, 2008; Nauer, 2016).
Both measures have limitations. Chronic absenteeism, often driven by external factors like health challenges and housing instability (Gee, 2018), may not be immediately responsive to school-based interventions. Moreover, using fixed cutoffs (e.g., 10% of instructional days missed) can obscure disparities among student groups and exclude students just below the threshold from needed interventions (Kearney, 2021). Meanwhile, ADA, though useful for monitoring school-wide attendance patterns, does not distinguish between students with sporadic absences and those experiencing persistent disengagement (Balfanz and Byrnes, 2012).
Given these limitations of both ADA and chronic absenteeism, perhaps the best way to distinguish the use of these measures is through the problems they attune us to addressing. In this study, we focus on how leveraging ADA as a continuous measure can help practitioners better track attendance patterns, assess the impact of interventions, and design targeted strategies for improvement. This is an important goal, given that studies suggest that even small, consistent increases in attendance yield cumulative benefits, improving learning outcomes and overall school climate (Wang and Dishion, 2012). Time series analysis can be helpful for presenting and analyzing ADA (Koopmans, 2011). Conventional attendance measures are often static snapshots, failing to provide limited insight into a school’s effectiveness in fostering student attendance (Liu, 2022). Moreover, research suggests that attendance rates often vary widely between schools and remain relatively stable over time (Liu, 2022). Little research explores the root causes of variation between peer-alike schools or how positive outlier schools are able to intervene in ways that produce drastic improvements. This study contributes to this ongoing dialogue by examining how improvement science methods and time-series visualizations can help educational leaders make sense of attendance data, enabling context-responsive interventions and learning for ongoing improvement.
Methods
This research employed a case study approach (Flyvbjerg, 2011) to capture the complexity of one research-practice partnership’s efforts to improve attendance, provide a detailed understanding of the context, and facilitate the exploration of capability building within the organization.
Description of network
The partnership explored in this paper was a collaborative effort between two researchers, who specialize in improvement science methods, and a group of leaders from the Southwest Schools Network (referred to hereafter as the Network), a non-profit organization dedicated to transforming some of the highest-need schools in Metropolitan School District. Metropolitan School District is one of the largest school districts in the country. The Network leadership was particularly interested in addressing a critical challenge: improving student attendance across their network of schools. Like many schools across the country, the schools within the Network experienced a significant decline in attendance during the COVID-19 pandemic. As the Network returned to fully in-person instruction in the 2021–2022 school year (SY22), the focus shifted to getting students back in school and raising attendance rates to or above pre-pandemic levels. However, despite their efforts, they faced ongoing struggles in achieving these goals. Network leaders brought this issue directly to the research team, framing the partnership’s initial focus on strategies to improve attendance through collaborative, data-driven inquiry.
In December 2022, the partnership embarked on a journey to explore how improvement science tools could provide new insights into boosting attendance outcomes in Network schools. The objectives of this collaboration were to (1) Produce a new understanding of the system that drives attendance outcomes in Network schools, (2) Identify positive outlier schools and contexts that have sustainably increased student attendance, particularly for at-risk student subgroups, (3) Understand the actions, routines, and structures that support or challenge positive attendance outcomes, (4) Offer implications and strategies for improving attendance outcomes across the entire network of Network schools.
This partnership convened regularly over the next 2 years to visualize, analyze, and use data to inform their learning for improvement. During the period of the collaboration between the Network and researchers there were approximately 15 meetings. This collaboration exemplified a data-driven, inquiry-based approach to addressing complex challenges in education, demonstrating the potential of improvement science to foster meaningful and sustainable change in school attendance practices. Through this process, the group identified several schools within the network as positive outliers due to their consistently strong attendance performance relative to other schools in the Network. As we discuss in our findings, they chose to conduct a focus group at one such school, Cypress Elementary, to better develop a theory and plan for improving attendance.
Our methodological approach was grounded in improvement science and collaborative inquiry frameworks, emphasizing data-driven decision-making to enhance school attendance outcomes (Bryk et al., 2015 Honig, 2012). Improvement science principles guided the collection and interpretation of run chart data, enabling us to visualize attendance trends and identify performance patterns over time. This approach supported the development of data-informed theories about what drives improvements in student attendance. Leadership discussions were analyzed through the lens of sensemaking theory, focusing on how school leaders interpret data to inform decisions (Weick, 1995). Collaborative meetings functioned as structured learning environments where team members critically examined data, surfaced assumptions, and adjusted their strategies through iterative cycles of inquiry. This continuous refinement process aligned with improvement science’s emphasis on using empirical evidence to guide system-level change. Together, these theoretical perspectives framed our investigation of how educational leaders engage in data-driven learning and adaptive problem-solving within a complex organizational setting.
Data sources and theoretical underpinnings of data use
This study engaged in conversational inquiry using a qualitative data approach to examine how improvement science tools and practices shaped leaders’ ability to interpret attendance data, identify challenges, and develop strategies for improvement. Specifically, data collection aimed to capture collaborative learning processes, shifts in leader thinking, and the site-specific practices at one positive outlier school, Cypress Elementary.
Data were collected over a two-year research partnership between Network leaders and university-based researchers. The process unfolded in two phases. The first phase focused on 15 structured meetings between Network leaders and researchers, designed to facilitate data-driven inquiry and improvement planning. The meetings were guided by routines that disciplined collaborative practice. We aimed to have all team members contribute insights and perspectives to shape the data and to inform the analysis. The following collaborative guideposts centered the discussions to make assumptions about the Network and its systems more visible. Each meeting was guided by (1) concrete agendas that were explicitly connected to attendance as the problem of practice. Agendas specified focal questions for each meeting and emphasized which data sources and data foci would be under discussion; (2) the meetings sought to document the sense-making and conclusions that resulted from discussions and to document critical analysis; (3) data-driven discussions were grounded in quantitative and qualitative data analysis and problem-solving, such as the content of metrics, surveys plans, performance reports, or research findings; (4) iterative feedback loops were used to refine data analysis procedures. Continuous learning was a hallmark of the process.
During these meetings, participants collaboratively analyzed student attendance data, developed improvement theories, and refined action plans. Guided by detailed agendas, these discussions centered on attendance challenges and relied heavily on time-series data visualized through run charts tracking average daily attendance (ADA) trends across Network schools. By analyzing attendance patterns from three academic years (SY18-19, SY21-22, and SY22-23), the team identified positive outlier schools and emerging trends warranting deeper investigation. Discussions were audio-recorded when feasible and supplemented by field notes when recordings were not possible, ensuring a robust qualitative dataset.
The second phase involved a site visit and focus group at Cypress Elementary, a school with consistently strong attendance outcomes. This focus group—comprising school leaders, teachers, and support staff—provided rich contextual insights into the school’s attendance practices and systems. This exploration of local strategies complemented the systemic-level learning from the structured meetings, offering a multi-level perspective on attendance improvement.
To further strengthen the analysis, additional data sources included analytic memos maintained by the research team to track emerging themes and hypotheses, as well as internal Network documents such as school policies, performance reports, and meeting agendas. Together, these multiple data streams provided a comprehensive view of how data-driven strategies were developed, tested, and refined throughout the partnership.
Time series data collection and analysis
Improvement Science tools and principles have helped schools, districts, and other educational institutions improve student outcomes (Grunow et al., 2024). In this project, we visualized attendance performance in Network schools using run charts. Run charts are graphical representations of data plotted over time, serving as a crucial tool in assessing the effectiveness of changes within a system. Since improvement is a process that unfolds gradually, tracking data over time is essential for determining whether genuine and sustainable improvement has occurred. By visualizing patterns, run charts enable teams to observe how changes impact performance, providing insights into whether those changes have led to meaningful improvements (Langley, 2009).
We used data from 3 years of attendance data at Network Schools to make the run charts. This included the year before COVID-19 (SY18-19) and the 2 years following in-person learning (SY21-22, SY22-23). We did not include years SY19-20 and SY20-21 because of issues related to collecting reliable attendance associated with the virtual and hybrid learning wrought by COVID-19. Each dataset contained a wide variety of data elements. However, for data visualization, we visualized average daily attendance (ADA) on the X-axis aggregated by week for the duration of the school year on the Y-axis. Given the substantial differences in attendance patterns and causes between the Elementary and Middle/High levels, we explored these school levels separately. This yielded two charts: one for elementary schools and one for schools in the upper levels. For each year, we therefore created two dashboards that visualized time-series trends in daily average attendance for the Network. However, the work of the partnership mostly focused on interpreting, analyzing, and using the run charts from SY22-23. Figures 1, 2 show both charts for SY22-23. In each of the run charts depicted in Figures 1, 2, the colored lines represent schools and it charts their average attendance rates by week across the 36 weeks of the school year.
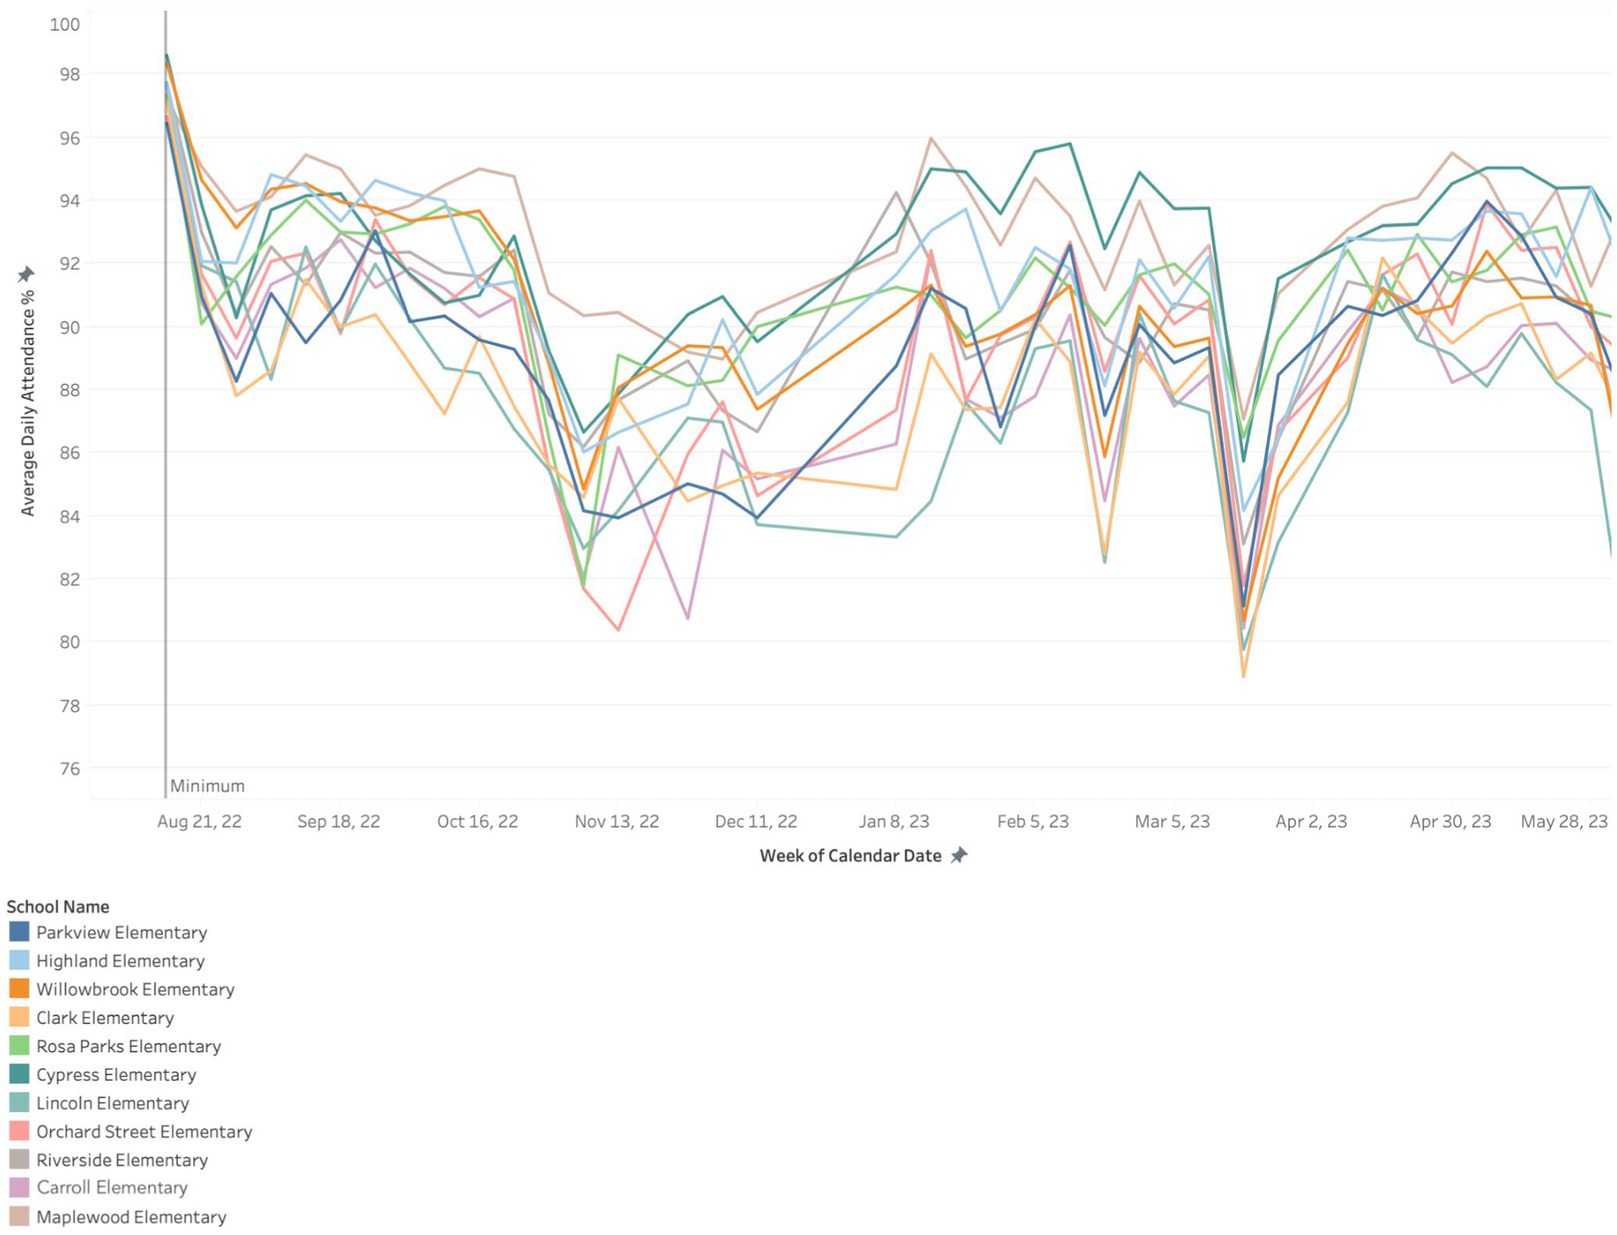
Figure 1. Run chart for student attendance in network elementary schools (2022–2023).
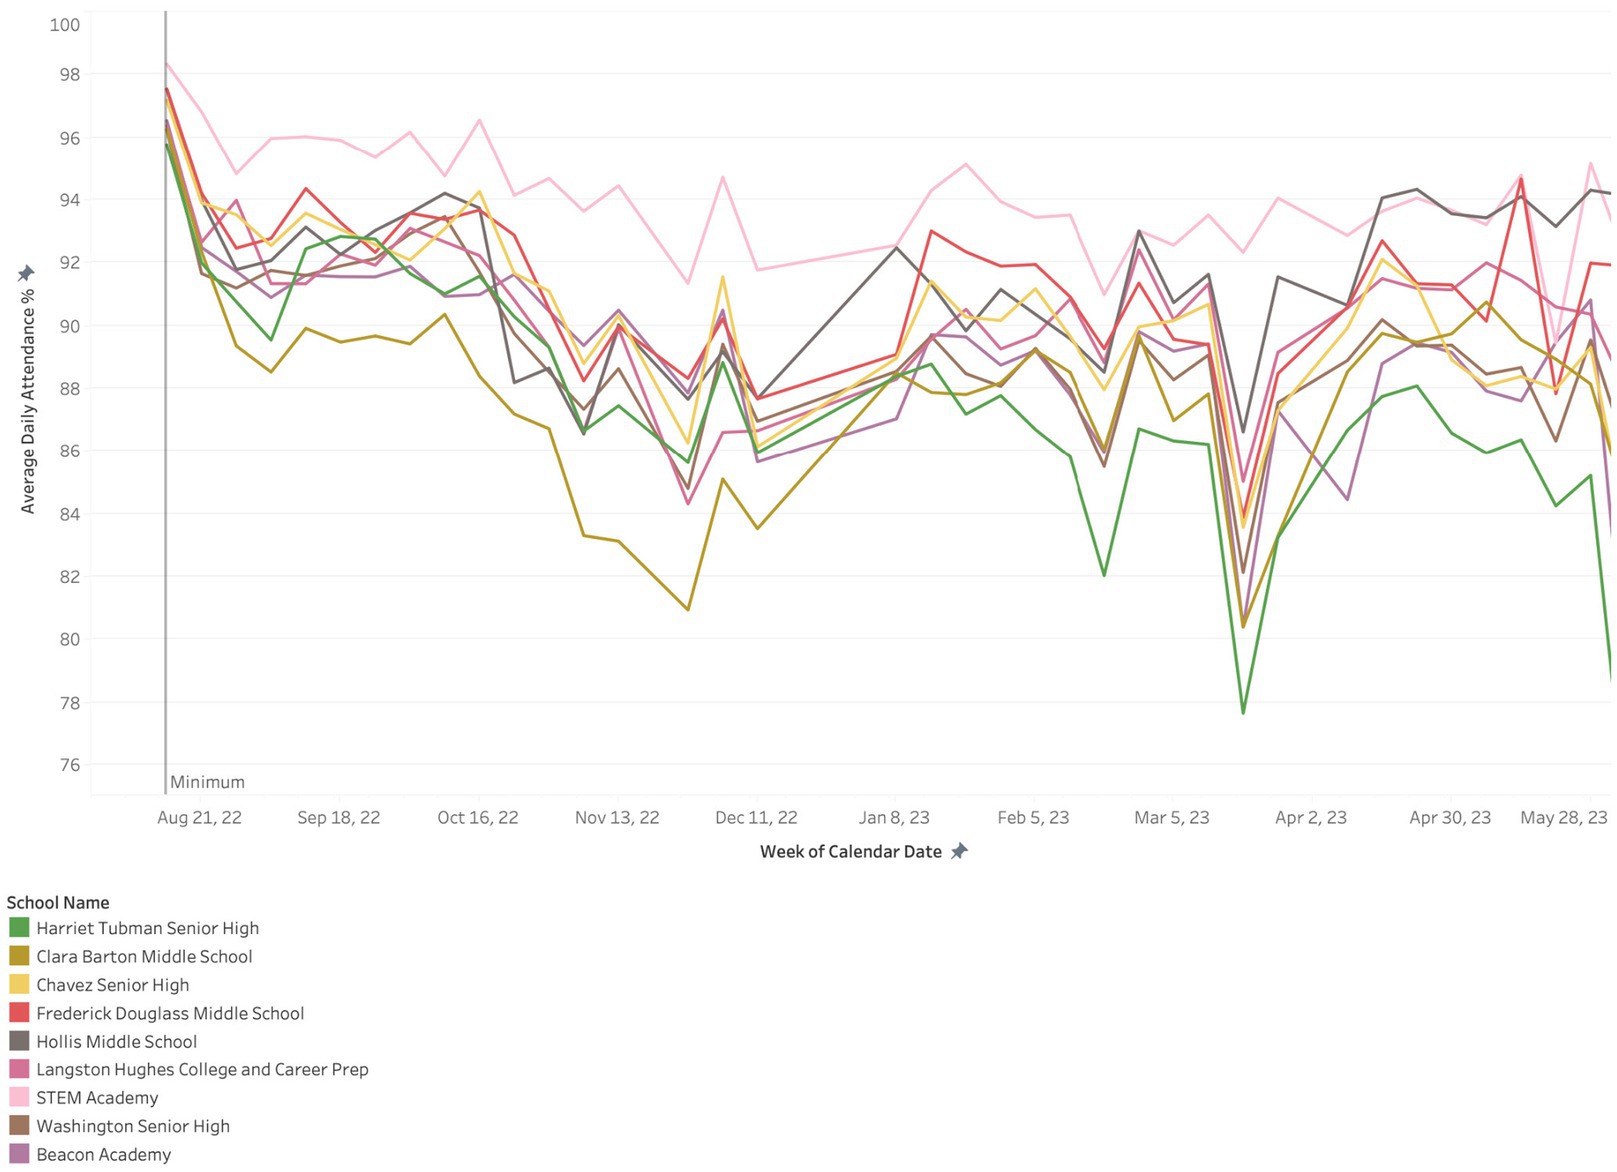
Figure 2. Run chart for student attendance in network middle and high schools (2022–2023).
We were interested in what we could learn by comparing the schools’ relative performance and improvement trajectories. The use of outliers is one way that improvement scholars have compared relative performance and used it to understand sources of variation within a given system (e.g., Pascale et al., 2010). We considered positive outliers as those with consistently high attendance relative to other Network schools throughout the school year. We consider negative outliers to be those with consistently low attendance relative to other partnership schools throughout the school year. All other schools were considered middle performers. Table 2 lists all the schools in the Network, as well as their school level, need status, and performance band.
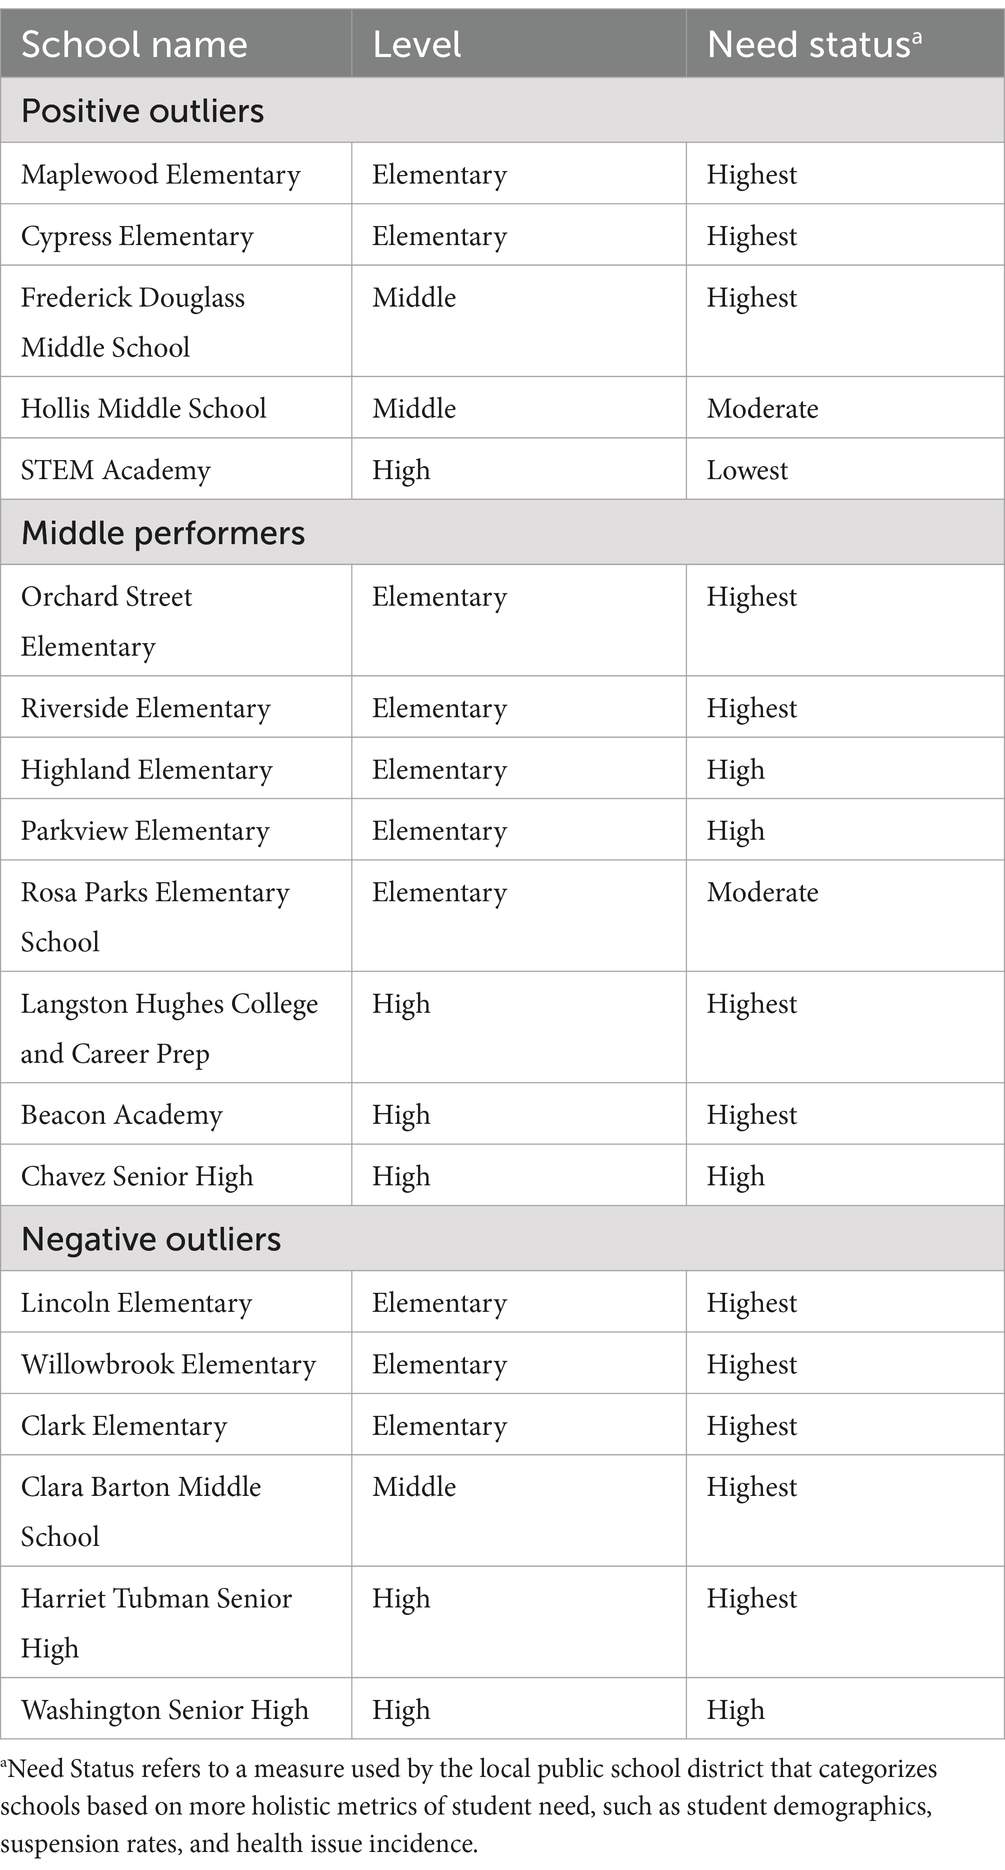
Table 2. Network schools: outlier status, level, and need status (2022–2023).
Qualitative data collection and analysis
In the first phase of the study, data collection focused on Network leadership and the reflections they shared during meetings. We recorded our virtual meetings and took field notes. These meetings took place from December 2022 to January 2024 over the video conferencing. Many meetings were audio recorded and transcribed. For those that were not transcribed, rigorous field notes were taken. Transcripts and field notes from meetings during this time became the main qualitative data source.
During the second phase, we conducted a focus group at one of the positive outlier schools, Cypress Elementary, in May 2024. The protocol we used for this meeting is included in Appendix A. This meeting was audio recorded and transcribed. Interview transcripts and field notes were then cleaned. Using a priori codes based on our research questions, the first author coded all transcripts descriptively in MAXQDA. We used analytic memos to track our thinking and develop our findings (Miles et al., 2014). Table 3 lists all participants involved in both components of qualitative analysis, as well as their role, their sites, and which phase of the study they were involved in.
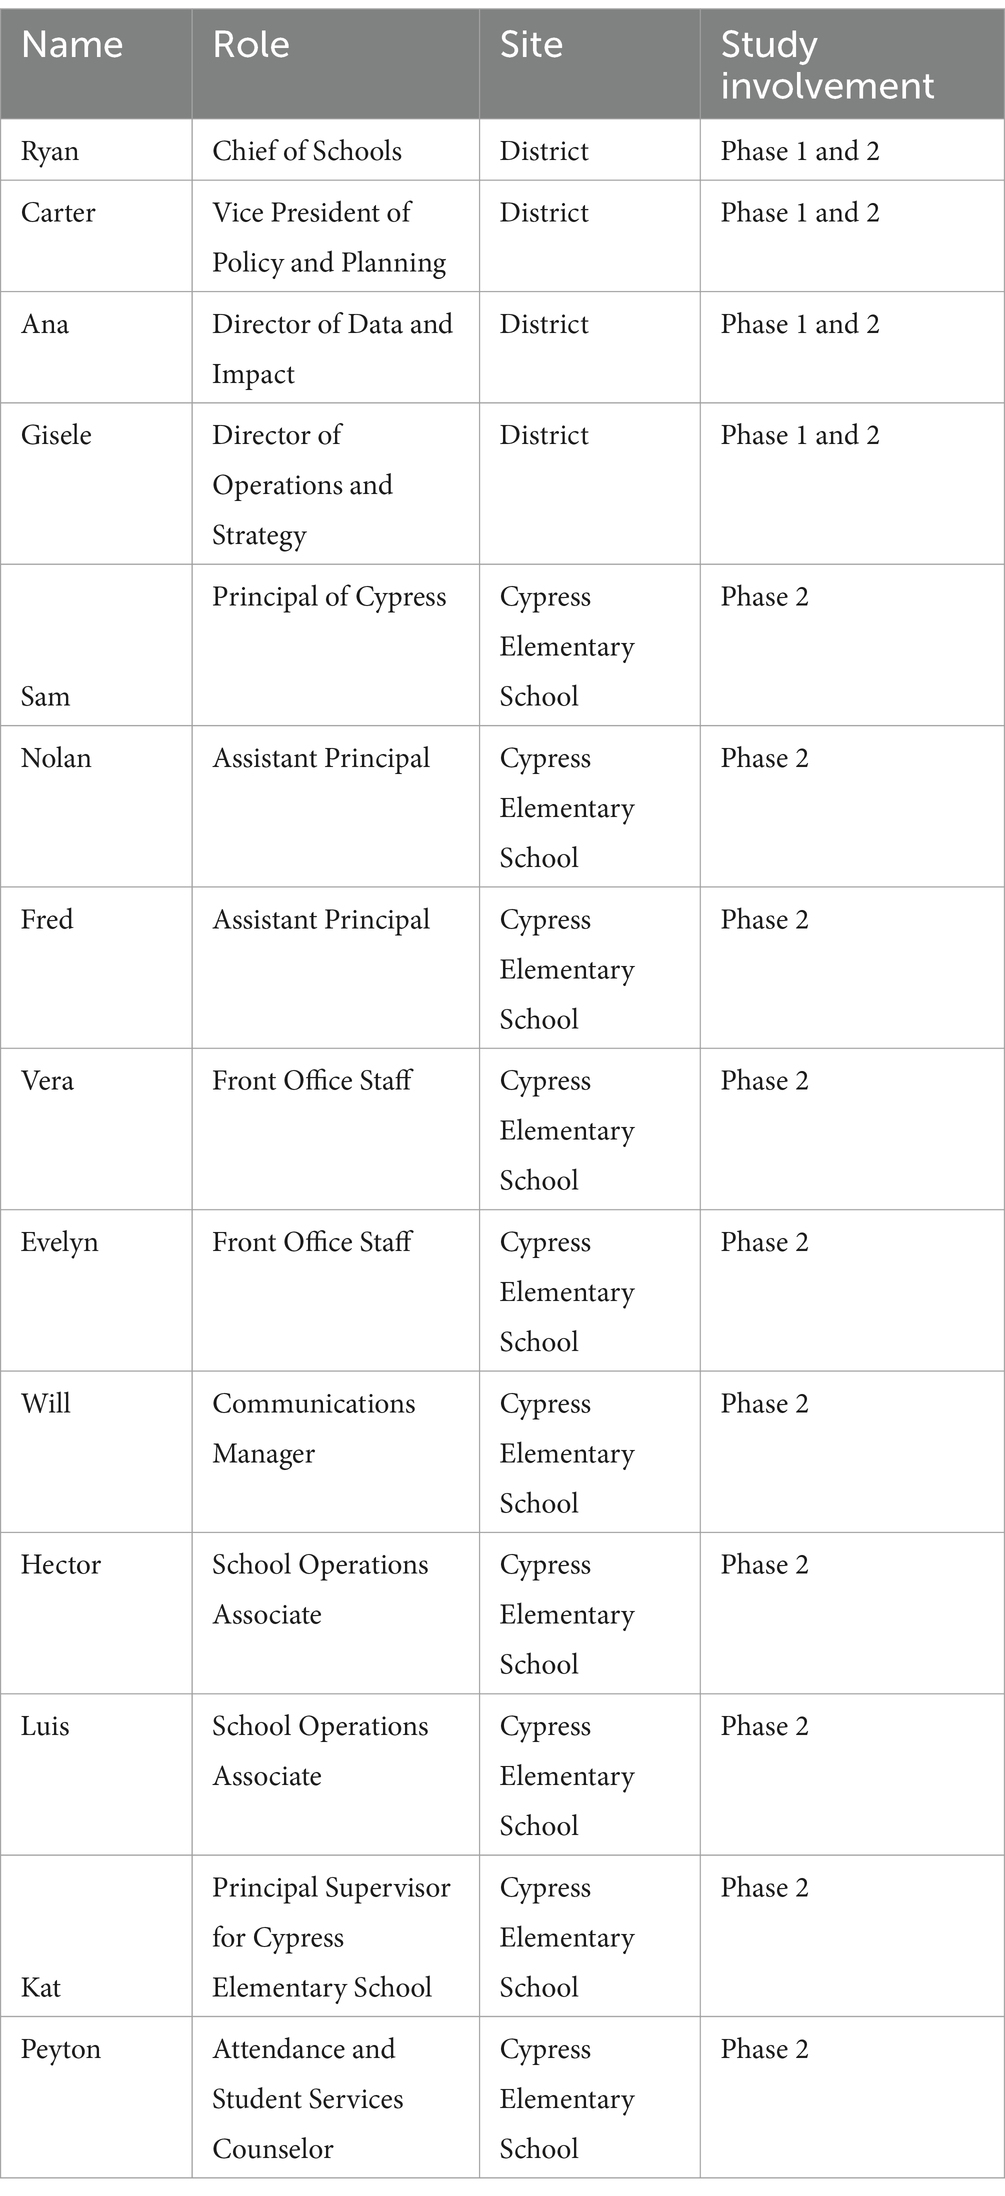
Table 3. Participants.
Findings
In this section, we first explore how Network leaders initially struggled to see their system with respect to attendance, before detailing how the improvement methods used within the partnership then allowed them to better understand the system that produced attendance patterns. We then describe the learnings these leaders gained from (1) visualizing the data in time series representations and (2) interpreting the data with a focus on understanding and addressing variation catalyzed the design of a focus group at one positive outlier school. We conclude this section by describing the insights gained from this focus group.
Leaders’ challenges in interpreting system performance
Our investigation into attendance outcomes revealed leaders’ initial struggles in predicting school attendance performance. As a research team, we first engaged the leadership (Ryan, Carter, and Gisele) in a discussion to identify the factors they believed were critical to strong attendance systems. We did so because we wanted to better understand the implicit theories these leaders held about what constitutes a high-performing attendance school before they made specific predictions. Leaders can view data in ways that obscure meaningful patterns. By first eliciting their initial hypotheses, we were able to surface Network leaders’ assumptions and highlight how relying solely on preconceived notions can limit data interpretation. This approach helped to prepare this group of leaders to engage with data more effectively and encouraged them to adopt tools designed to reveal variation.
Ryan, Carter, and Gisele identified five key categories they believed influenced attendance: Family and Community Engagement (FACE), Joyful Learning, Sense of Belonging, Attendance/Record Keeping, and Strong, Consistent Leadership. Based on these categories, they predicted that Maplewood Elementary, Rosa Parks Elementary, Beacon Academy, Chavez Senior High, and Washington Senior High would be the strongest performers. Table 4 depicts their rankings, where X indicates schools that the group of leaders nominated for high performance in the category they believed to be predictive of strong attendance. However, comparing Tables 2–4 reveals a significant discrepancy between leader predictions and actual attendance data. Table 2 categorizes all schools in the Network by their school level, need status, and performance band based on actual attendance data. Table 4, on the other hand, depicts Network leaders’ initial predictions of high-performing schools based on specific categories they believed were critical for attendance, such as “Family and Community Engagement” (FACE) and “Joyful Learning.” An “X” indicates schools nominated by leaders as likely to excel in those categories.
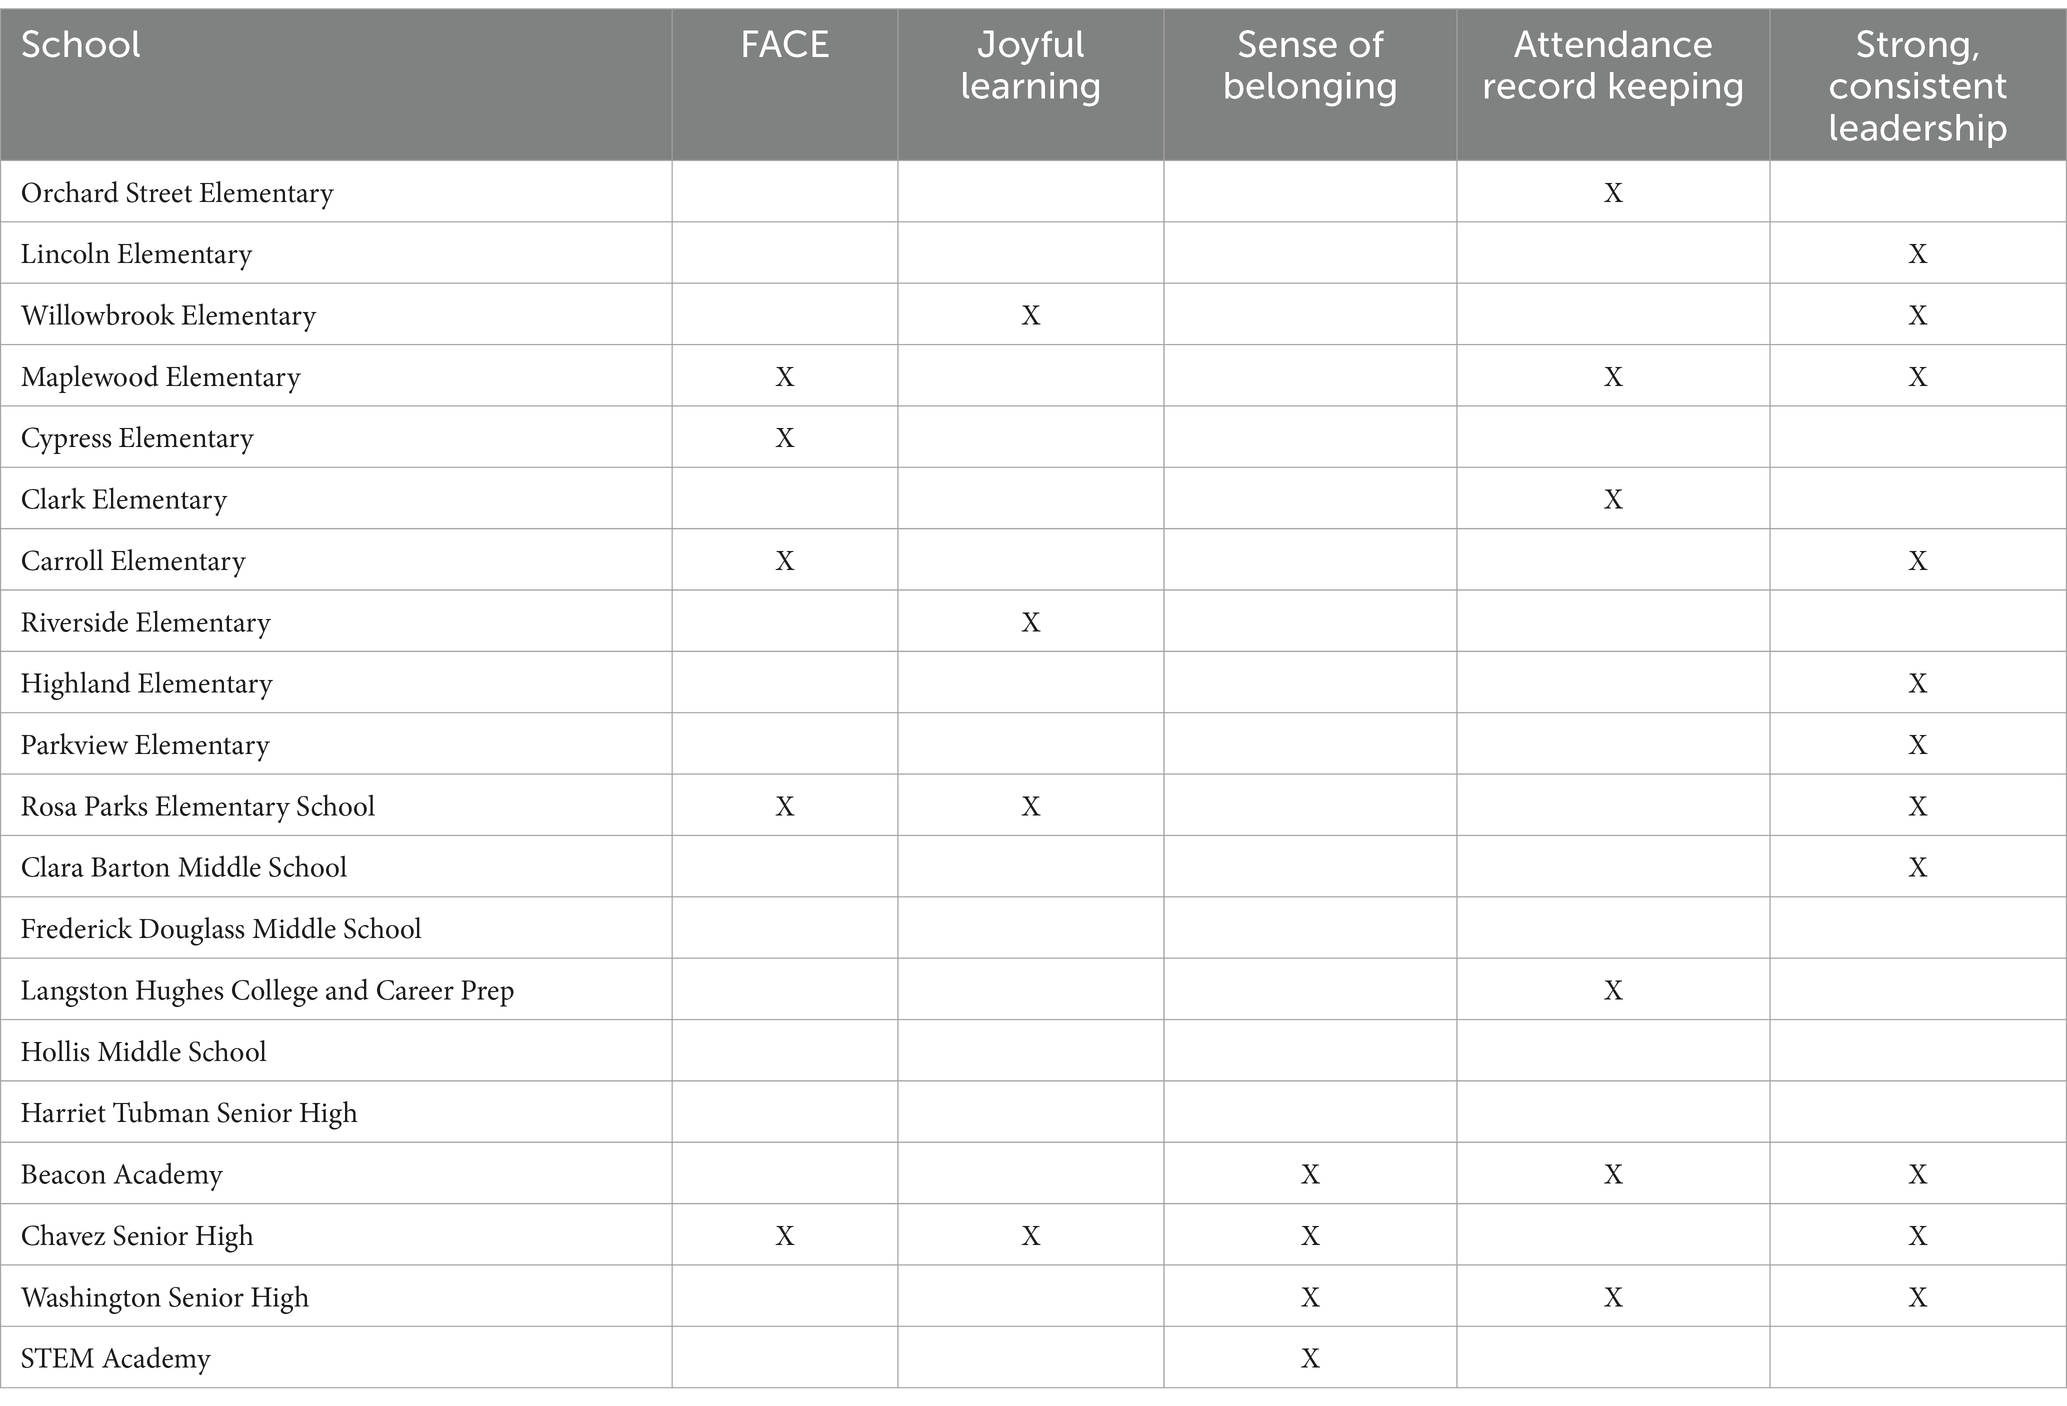
Table 4. Leader predictions for attendance performance based on key school categories.
A comparison of these tables reveals notable discrepancies between predictions and actual performance. While Maplewood Elementary aligned with leader expectations, other schools like Cypress Elementary and Frederick Douglass Middle School significantly outperformed predictions. Conversely, schools such as Rosa Parks Elementary and Washington Senior High were ranked highly by leaders in the categories they identified but did not achieve strong attendance outcomes. These differences highlight how reliance on static averages and preconceived notions can obscure meaningful patterns, which improvement science tools, such as time-series data analysis, helped illuminate.
Moreover, several of the schools indicated to be high performing in Table 2, such as Cypress Elementary and STEM Academy, were not widely predicted to excel across these categories by this group of leaders, indicating that the leaders’ initial assessment overlooked key elements contributing to effective attendance systems. This discrepancy suggests that the leaders may hold a weaker understanding of the indicators that drive strong attendance, indicating that their theories of improvement around what matters for strong attendance are not well-developed or consistently applied.
What makes this discrepancy particularly notable is that this group of leaders had spent considerable time studying attendance data across their network of schools. Attendance was a core focus of their regular data dives, yet they frequently analyzed static averages rather than more granular, time-series data. This tendency toward aggregated or static views may have led them to develop weaker theories of attendance improvement and performance, which became evident when their predictions were misaligned with the actual data. Despite their belief that the identified categories—such as Joyful Learning and Sense of Belonging—were strong indicators of attendance performance and that the schools they identified illustrated strong performance in these categories, the actual data suggested greater learning was needed to understand how such categories could be recognized, operationalized, and measured within schools.
How did improvement thinking and improvement methods help leaders see their system?
After capturing their predictions about which schools would demonstrate high attendance performance, we then reviewed two run charts with this group of leaders: one for all elementary schools and one for all middle schools within their system. These charts visualized attendance averages by week across the school year, allowing for a detailed examination of attendance trends and variability. As we presented the run charts, we highlighted the relative attendance performance of various schools and their consistency, or lack thereof, over time. We prompted the leaders to reflect on the surprises that emerged as they compared time series visualizations to their initial predictions, asking them to identify new questions and insights about their perceptions of the data. This process led to three significant learnings: (1) that their prior theories of attendance and performance improvement were not adequate to explain system performance, but could be improved through deeper questioning and analysis, (2) that system performance demonstrated predictable patterns over the year, which they could use to proactively design attendance interventions, and (3) that prior reliance on static snapshots of chronic absenteeism had curtailed learning for school and system-wide improvement. We discuss each finding below.
Re-evaluating and re-building theories of attendance improvement
In examining time series visualizations of attendance data and applying improvement science commitments to exploring variation, Network leaders began to realize that their existing theories of improvement for predicting high attendance performance were not as robust as they had assumed. By juxtaposing their predictions with actual performance data, it became evident that they had failed to accurately identify several schools—Cypress, Frederick Douglass, and Hollis—as relative positive outliers in attendance. These schools consistently outperformed their grade-level peers, making them valuable cases for deeper analysis.
The process of comparing predictions to actual time series performance sparked an interest among the leaders in understanding what contributed to the unexpected success of schools like Cypress and Frederick Douglass. This curiosity led them to reconsider their initial assumptions and explore new factors that might explain high attendance rates. They began to hypothesize about the role of student body size, resource allocation, and specific school practices, such as personalized outreach to students and creative transportation solutions. For example, when asked what she believed contributed to Cypress’s success, Gisele noted that smaller schools like Cypress might benefit from their size, which may allow for more personalized attention. She said, “With Maplewood and Cypress, I think a lot of the things that we have learned that they are doing that are working well are small school things. I’m not sure, and I want to learn more, but I wonder how the smaller nature of these schools could contribute to their success.”
Carter added to this, reflecting on the innovative approach he had heard about at Cypress, where staff had devised methods to transport students to school, such as arranging shuttles or personally escorting students from their homes. He said, “I think at Cypress they were figuring out how to go pick students up from their homes, whether it was an adult walking there and bringing the student in or I think they got some permit for some kind of shuttle situation that we were trying to learn more about, which again, is feasible to pilot because of the small school community.” Together, this group of leaders began to capture and refine a set of questions that would help them better understand why some schools, such as Cypress, were more successful than others in improving and sustaining high attendance rates. These questions included, “What did schools like Maplewood and Cypress implement in order to increase and sustain their attendance rates? What might other schools learn from their interventions? How can Network leadership better understand the root causes of the relatively positive performance of these schools?” These questions were eventually included in the protocol used at the focus group conducted at Cypress Elementary School, which is included in Appendix A. In sum, by engaging with the data through the lens of improvement science and focusing on variation, educational leaders could identify gaps in their knowledge and challenge their preconceptions. This process helped them refine their theories of improvement and encouraged a more data-driven, inquisitive approach to understanding and enhancing school performance.
Recognizing predictable attendance patterns across the school year
Because time series data offers a much more granular and specific view of performance than simple averages, the run charts allowed Network leaders to better detect predictable periods where attendance consistently dipped or increased, such as the sharp declines seen in November, corresponding to Veterans Day and Thanksgiving, and the steep rise in attendance between December 11th and January 15th. As Carter noted, “I haven’t looked at this before this way, so I appreciate what [this view] allows us to see now,” highlighting the novelty and value of this approach. By comparing these trends to previous years, the leaders could see that some patterns, like the November dip, were consistent across multiple years, while others, like the December to January rise, varied significantly. This analysis also revealed that some schools, such as Cypress, were less affected by these time periods. In fact, at Cypress, attendance rates experienced a significant and sustained increase starting in November. This unexpected example of positive variation prompted leaders to generate new questions and hypotheses about what specific actions or changes might have driven this improvement. The leaders recognized that a greater understanding of these patterns and their contributing factors could provide them with valuable insights for developing more effective attendance strategies across the Network. Gisele reflected on how understanding these trends “could be pretty actionable for us if we could understand that better,” indicating an openness toward using data-driven insights to inform new strategic decisions. This experience underscored the importance of visualizing system variability over time and how it can be a powerful tool for learning and continuous improvement in school attendance performance.
Rethinking attendance data use
Network leaders were more practiced in using and reporting on chronic absenteeism, compared to ADA. This focus on chronic absenteeism shaped how they represented and analyzed attendance data, leading them to concentrate heavily on interventions that focused on children who miss school most frequently. In contrast, when the research team presented time series data of average daily attendance, the leaders were confronted with a different and novel picture of school performance. It revealed that there were unexpected positive outliers, like Cypress Elementary, whose improvement trajectories suggested they had developed strategies and systems to improve attendance.
The visualizations of ADA revealed variations in performance that the leaders had not anticipated, prompting surprise, learning, and new questions. This experience underscored the limitations of their previous data exploration methods, which had been overly focused on static representations of chronic absenteeism, and highlighted the value of using time series ADA data to gain a deeper and more actionable understanding of system performance. As Gisele said, “I feel like one of the things that makes chronic absenteeism hard to change is that it’s tied to factors beyond our control, like medical issues or housing. So we can put a lot of effort in but not see a lot of gain.” Consequently, past efforts to improve chronic absenteeism typically involved intensive, individualized interventions that, while necessary, did not allow for a broader, more dynamic understanding of attendance trends and the systems that might be aimed at every child’s attendance.
Insights from cypress elementary focus group
Analyzing attendance data using run charts suggested that certain schools, like Cypress Elementary School, had developed strategies to improve and consistently maintain high daily average attendance rates, even during periods when other schools struggled. Cypress Elementary was a particularly intriguing case because it exhibited a marked improvement in attendance starting in November 2022 despite being labeled as a high-need status (see Table 2). Network leaders also noted how, at the beginning of the school year, Cypress’s attendance was average relative to other elementary schools in the network; however, by November, the school rose to the top of the attendance rankings. They were interested in exploring the reasons for this improvement trajectory.
Network leaders and the research team jointly organized a school visit to Cypress to understand the root causes of this improvement trajectory. Focus group participants included Network leaders, Cypress school staff involved in attendance procedures, and various district support staff. During this visit, the team presented the weekly average attendance data for all Network elementary schools, which highlighted Cypress’s significant progress. The staff at Cypress were asked to reflect on the systems, structures, and practices that might explain their school’s success. Network leaders and other district support staff had the opportunity to ask questions, with the goal of uncovering root causes and learning information to support the design of interventions and improvement efforts at other Network schools.
While a comprehensive analysis of what was learned from this visit is beyond the scope of this paper, the insights gained from Cypress’s approach to improving attendance offered valuable lessons for other schools within the Network. First, the arrival of new staff members in November 2022 played a crucial role in overseeing and improving attendance systems. Nolan, an Assistant Principal, and Peyton, a BSAP PSA, were fully onboarded and took charge of attendance-related responsibilities. These responsibilities included codifying daily and weekly practices for using attendance data and for real-time response when students were marked absent. The combination of competent, dedicated personnel and clear processes allowed for a more focused and systematic approach to managing attendance, freeing up other staff members to concentrate on additional priorities, which helped to explain the marked increase in attendance in November 2022. In addition to the strengthened leadership team, Cypress implemented a web of incentive structures that motivated students and teachers to prioritize attendance. These incentives included individual student rewards for regular attendance that allowed students to buy goods from the school store, class-based incentives for collective attendance, and even teacher incentives such as personalized coffee deliveries. These efforts were supported by public celebrations of attendance milestones, which further reinforced the importance of regular attendance among the student body. Moreover, a full-time nurse at Cypress played a significant role in maintaining high attendance rates. The nurse provided immediate healthcare support, which reassured parents and allowed many students who might have otherwise stayed home to attend school. The combination of dedicated staff, strategic incentives, and robust support systems highlights the multifaceted nature of effective attendance interventions.
While this study did not follow the design and enactment of interventions based on the learning and reflections inspired by the Cypress focus group, Network leaders excitedly shared their plans to continue to use both the data visualizations and the insight from Cypress more widely across the network. As Carter shared, “A next step for us is to understand what and how other schools can learn from Cypress, to build things like interventions that are based on what we’ve learned, and to really do a better job of following what impact that has over time.” This focus group was not the end of the inquiry efforts; rather, it was the beginning of a new phase of learning and improvement work that focused on understanding how Cypress’s improvement trajectory and innovation might be scaled and supported across other schools in the network.
Discussion
At the outset of this paper, we introduced a challenge: to build the capacity for genuine and sustainable improvement, educators need methods that enable them to use data effectively and understand their systems. We wondered how improvement science thinking, aided by time series visualization, could help to build this capacity and to explore this question, we engaged education leaders with methods that enabled them to detect variations and outliers in attendance data, identify the biases in their view of the system and individual actors, and gain new insights for improvement. In this section, we discuss how these methods helped build local capability. We first recap the learning challenges that leaders faced, and the connection between our findings and what sensemaking and attribution theory posit on this challenge. We then explore how the attendance partnership evidences a synergistic and complementary nature of improvement science and the capability approach.
Using data for improvement: struggles and supports
Sensemaking and attribution theories suggest that leaders’ mental models, prior experience, and cognitive frames can constrain well-intentioned efforts to use data for improvement (Bertrand and Marsh, 2015; Weick, 1995). Our study underscored this challenge. At the outset of this engagement, Network leaders struggled to interpret system performance data effectively. Their reliance on constructs like “Joyful Learning” and “Strong, Consistent Leadership” as predictive indicators of attendance needed greater learning to better understand how to recognize, operationalize, and measure these valuable outcomes.Their initial predictions were significantly misaligned with the attendance patterns revealed in time-series data, underscoring a gap between their mental models and the realities of system performance. This misalignment highlights a broader challenge in educational leadership: the difficulty of grounding theories of improvement in empirical, data-driven insights. This study did not attempt to trace the origins of this misalignment. However, it became clear that leaders’ interpretations of attendance patterns were shaped by prior assumptions rather than iterative data analysis. These findings align with research suggesting that educators tend to confirm existing beliefs when analyzing data rather than using data to challenge or refine their mental models (Coburn, 2001; Bertrand and Marsh, 2015).
It was also clear that part of the misalignment stemmed from how data was traditionally presented to the leaders. Attendance data had typically been aggregated into static snapshots, providing little opportunity to explore variation over time or across contexts. This limited Network leaders’ ability to see how attendance fluctuated, how specific interventions affected performance, or which schools excelled despite systemic challenges. As a result, they were left with an incomplete view of their system, unable to diagnose the root causes of poor attendance accurately or to iteratively test theories of improvement. These shortcomings yielded weaker theories for explaining attendance performance, like “joyful learning.” To be clear, it is not that learning should not be “joyful.” But what constitutes “joyful learning”? What are the infrastructure and mechanisms for increasing joyful learning and its impact on attendance? Do these mechanisms vary by particular student groups?
By introducing improvement science methods—particularly time-series visualizations—leaders were able to confront the limitations of their prior data use practices. The principles of improvement science emphasize “Variation in performance is the core problem to address” and “See the system that produces the current outcomes” (Bryk et al., 2015). The use of run charts to visualize and analyze time series data provided the artifacts to help leaders apply these principles to attendance data, which catalyzed a fundamental shift in leaders’ engagement with the system. Instead of relying on general beliefs about what “should” drive attendance, leaders began using empirical variation as a foundation for inquiry. By enabling them to see variation in attendance rates across schools and over time, run charts offered leaders a clearer picture of what was happening within the system.
A key element of the leaders’ experience with improvement science was the role of surprise in fostering learning. The discrepancies between their initial predictions and the actual performance of schools like Cypress provided moments of surprise that prompted deeper inquiry and reflection. These surprises challenged Network leaders’ preconceptions and encouraged them to adopt a more inquisitive, data-driven mindset. As they explored why their predictions had been wrong, they began to ask more critical questions about their system and develop new theories of improvement. This process encouraged them to rethink their initial assumptions about what factors drive attendance, moving from generalized, qualitative judgments to more data-driven insights. For instance, the visualizations revealed that Cypress’s attendance rates were higher than predicted and had improved significantly over the school year. This unexpected finding prompted the leaders to explore factors such as school size, community engagement, and personalized interventions that might explain Cypress’s success. In doing so, they began to appreciate the role of contextual factors—such as the dedication of specific staff members and the implementation of targeted incentives—in driving positive outcomes. The presence of more robust data provided a more substantial basis for seeing routines that leveraged improved attendance.
Despite the benefits of using improvement methods, leaders encountered several challenges along the way. One key difficulty was shifting from a focus on chronic absenteeism to a broader understanding of average daily attendance (ADA). The district’s accountability stsructures were heavily focused on chronic absenteeism to metrics focused on, which was typically portrayed in static snapshots. Most chronic absenteeism measures focus on relatively few students in any building. On the other hand, when leaders examined ADA through the lens of time series data, they realized that it provided a more responsive and actionable view of learning to improve school-wide attendance. This view allowed them to see patterns and trends that chronic absenteeism data obscured. This shift in focus required the leaders to rethink how they approached attendance improvement. Instead of concentrating solely on reducing chronic absenteeism through individualized interventions, they began to consider broader, system-wide changes that could influence daily attendance trends. This transition, while challenging, ultimately helped the leaders develop a more nuanced and holistic approach to improving attendance outcomes.
Building capability through improvement
The case we have presented in this paper is more than an instance of data-driven inquiry, improvement science, or an attendance-focused partnership between researchers and educational leaders. By embedding improvement science within a framework of capability-building, this partnership positioned leaders not just to improve attendance outcomes, but to expand their agency in defining, pursuing, and sustaining improvement efforts that align with their values and local needs. We believe the case we have described illustrates how improvement sciences and the capability approach can complement each other.
To fully appreciate this connection, it is useful to first revisit the capability approach. This theoretical lens emphasizes developing human wellbeing by expanding individuals’ freedoms and opportunities to achieve outcomes they value (Sen, 1999; Nussbaum, 2006). The capability approach differentiates between three key concepts. Functionings are the actual achievements of individuals or systems—what people or institutions are doing or have accomplished. Capabilities are the real opportunities or freedoms available to individuals or systems—the range of choices they have to achieve valued outcomes. Agency refers to the ability of individuals or collectives to act on those capabilities, making decisions that align with their goals and values.
Within the context of this study, the functionings included the development of more refined attendance theories, the ability to see the variation in attendance patterns, and the exploration of context-specific strategies based on insights gained from Cypress Elementary’s success. These achievements reflect what the leaders were able to do with the new tools and insights gained through improvement science. However, the process of engaging with time-series data, outlier analysis, and improvement science methods expanded leaders’ capabilities. Prior to the partnership, leaders had a narrow set of analytic tools (e.g., static chronic absenteeism data) and a limited ability to diagnose variation over time. Through the inquiry, their capability to see, interpret, and act on system patterns increased—not just in attendance but in their general capacity for data-driven improvement. Specific examples of capabilities that were cultivated included, (1) the capability to detect emerging attendance issues and intervene proactively, rather than reacting after chronic absenteeism rates had already escalated, and (2) the capability to design targeted, equitable interventions that foster school-wide engagement and attendance.
The agency of these leaders was expressed in their ability to shape the direction of their improvement efforts, both in the goals they set for improvement at the outset of the partnership and in the questions they defined and pursued throughout ongoing data analysis. Rather than passively receiving directives from district policies or third-party improvement partners, this group of leaders redefined their focus, generated new theories of action, and initiated early inquiry that aligned with the unique needs of their schools. This highlights a core tenet of the capability approach: improvement should be designed to expand the real freedoms leaders have to pursue locally meaningful solutions.
We believe the case we have described demonstrates the synergistic qualities of improvement science and the capabilities approach. When we ask, “How can we use the capability approach in school improvement?” improvement science can offer concrete strategies that help to translate the capability approach. Improvement science provides the operational mechanisms that enable capability-building by equipping educational leaders with structured routines, tools, and principles that allow them to diagnose system problems, test changes, and refine their practices iteratively. To illustrate this connection, we will describe a few ways in which improvement science helped to structure the pursuit of capability building within the attendance partnership.
First, a core tenet of both improvement science and the capability approach is that improvement must begin with problems that are meaningful to those experiencing them. If leaders and practitioners do not define problems in ways that align with their values and lived realities, improvement efforts risk being externally imposed, disconnected, or unsustainable. By centering the problem definition on local experiences and leadership priorities, Network leaders were able to take ownership of the improvement process, making it relevant and actionable within their own system. At the outset of the partnership, the Network leaders defined the problem they sought to understand and improve: lagging system-wide attendance. We, as the researchers, served the role of creating the conditions for meaningful inquiry on the part of these leaders. Rather than telling Network leaders how to proceed, we used the tools and principles of improvement science to create conditions for learning from variation. Throughout the inquiry, the leaders asked questions that were meaningful to them, which led them to plan a learning venture at Cypress Elementary. Here, the principle of agency is clear. In making the problem-specific and user-centered, improvement science-informed inquiry can create the fertile ground for local actors to demonstrate agency in defining what, for them, is meaningful and worthwhile of pursuit.
Within the context of school attendance, the capability approach offers a way to reframe improvement efforts—not merely as a means to achieve higher attendance rates but as a strategy to empower students, educators, and leaders to address the root causes of attendance issues and create conditions for sustained engagement. Doing so requires learning, disciplined by a respect for variation and by a need to fully understand the system. Improvement science provides practical tools to operationalize this capability-building perspective. For instance, strategies like time-series visualizations and root-cause analyses can help educators identify patterns of attendance variation and determine the systemic factors driving those patterns.
Conclusion
This study places in relief the challenges educational leaders face when using data to inform improvement, exposing the limitations of relying on traditional data presentations and pre-existing beliefs. However, adopting improvement science tools and thinking gave the leaders in this study a more nuanced understanding of system variation, helping them shift from generalized assumptions to more data-driven insights. Moreover, the methods we employed built the capability of individual leaders and equipped them with the tools and mindsets necessary to foster system-wide improvement. By focusing on enabling conditions—such as a shared understanding of the system and collaborative learning—these methods positioned leaders to expand their impact, particularly in schools like Cypress, where the challenges of complex systems demand nuanced, context-sensitive solutions. The broader implication of this work is that building leadership capability is not just about technical proficiency but about creating the conditions for leaders to see, understand, and act on the systems they are responsible for improving. Taking actions of this sort resides at the nexus of improvement and capability-building, allowing leaders to take more holistic and system-centered approaches to positive change.
This study is a beginning of sorts. It highlights several opportunities for future research. This study did not follow how the partnership between researchers and Network leaders used the learnings and reflections to design and enact attendance interventions or how those interventions impacted attendance rates. Future research should explore how insights from this study translate into concrete interventions and whether those interventions lead to sustained improvements in attendance outcomes. While this study documented how network leaders refined their theories of attendance and identified positive outlier schools, further research is needed to examine how these insights inform specific policies and practices, as well as their long-term impact. Additionally, understanding the mechanisms through which improvement science fosters capability building among educational leaders remains a critical area for investigation. Future studies could explore how structured data inquiry influences leaders’ professional growth, shapes organizational learning, and sustains data-driven decision-making beyond attendance-focused initiatives. Moreover, research should examine how knowledge from positive outlier schools can be systematically leveraged to benefit other schools within a district or network, identifying the conditions necessary for scaling effective attendance strategies and the factors that enable sustained success over time. By addressing these gaps, future studies can deepen our understanding of how improvement science and time-series data analysis support meaningful and scalable change in educational systems.
Data availability statement
The raw data supporting the conclusions of this article will be made available by the authors without undue reservation.
Ethics statement
The studies involving humans were approved by University of California, Los Angeles Institutional Review Board. The studies were conducted in accordance with the local legislation and institutional requirements. The participants provided their written informed consent to participate in this study. Written informed consent was obtained from the individual(s) for the publication of any potentially identifiable images or data included in this article.
Author contributions
M-LL: Conceptualization, Formal analysis, Methodology, Project administration, Visualization, Writing – original draft, Writing – review & editing. LMG: Conceptualization, Supervision, Writing – original draft, Writing – review & editing.
Funding
The author(s) declare that no financial support was received for the research and/or publication of this article.
Conflict of interest
The authors declare that the research was conducted in the absence of any commercial or financial relationships that could be construed as a potential conflict of interest.
Generative AI statement
The authors declare that no Gen AI was used in the creation of this manuscript.
Publisher’s note
All claims expressed in this article are solely those of the authors and do not necessarily represent those of their affiliated organizations, or those of the publisher, the editors and the reviewers. Any product that may be evaluated in this article, or claim that may be made by its manufacturer, is not guaranteed or endorsed by the publisher.
References
Arnold, R. D., and Wade, J. P. (2015). A definition of systems thinking: a systems approach. Proc. Comput. Sci. 44, 669–678. doi: 10.1016/j.procs.2015.03.050
Balfanz, R., and Byrnes, V. (2012). Chronic absenteeism: Summarizing what we know from nationally available data. Baltimore: Johns Hopkins University Center for Social Organization of Schools.
Bertrand, M., and Marsh, J. A. (2015). Teachers’ sensemaking of data and implications for equity. Am. Educ. Res. J. 52, 861–893. doi: 10.3102/0002831215599251
Boudett, K. P., City, E. A., and Murnane, R. J. (Eds.) (2008). Data wise: a step-by-step guide to using assessment results to improve teaching and learning (sixth print). Cambridge, MA: Harvard Education Press.
Bryk, A. S., Gomez, L. M., Grunow, A., and LeMahieu, P. G. (2015). Learning to improve: how America’s schools can get better at getting better. Cambridge, MA: Harvard Education Press.
Chang, H. N., Bauer, L., and Byrnes, V. (2018). Data matters: using chronic absence to accelerate action for student success. Attendance works and everyone graduates center. Available at: http://www.attendanceworks.org/data-matters/ (Accessed December 18, 2024).
Chang, H. N., and Romero, M. (2008). Present, engaged, and accounted for: the critical importance of addressing chronic absence in the early grades. Report. New York: National Center for Children in Poverty.
Childs, J., and Grooms, A. A. (2017). “Reducing chronic absenteeism and promoting school success” in Improving educational outcomes of vulnerable children. eds. F. D. Beachum and F. Obiakor. (San Diego, CA: Plural Publishing), 145–168.
Coburn, C. E. (2001). Collective sensemaking about reading: how teachers mediate reading policy in their professional communities. Educ. Eval. Policy Anal. 23, 145–170. doi: 10.3102/01623737023002145
Darling-Aduana, J., Woodyard, H. T., Sass, T. R., and Barry, S. S. (2022). Learning-mode choice, student engagement, and achievement growth during the COVID-19 pandemic. AERA Open 8. doi: 10.1177/23328584221128035
Datnow, A., Park, V., and Kennedy-Lewis, B. (2012). High school teachers’ use of data to inform instruction. J. Educ. Stud. Placed Risk 17, 247–265. doi: 10.1080/10824669.2012.718944
Dolle, J. R., Gomez, L. M., Russell, J. L., and Bryk, A. S. (2013). More than a Network: Building Professional Communities for Educational Improvement. Teachers College Record: The Voice of Scholarship in Education, 115, 443–463. doi: 10.1177/016146811311501413
Durá, L., and Singhal, A. (2009). Utilizing a positive deviance approach to reduce girls’ trafficking in Indonesia: asset-based communicative acts that make a difference. J. Creative Commun. 4, 1–17. doi: 10.1177/097325861000400101
Eddy-Spicer, D., and Gomez, L. M. (2022). Accomplishing meaningful equity. In D. J. Peurach, J. L. Russell, L. Cohen-Vogel, and W. Penuel (Eds.), The foundational handbook on improvement research in education Rowman and Littlefield. 89–110.
Egger, H. L., Costello, E. J., and Angold, A. (2003). School refusal and psychiatric disorders: a community study. J. Am. Acad. Child Adolesc. Psychiatry 42, 797–807. doi: 10.1097/01.CHI.0000046865.56865.79
Flyvbjerg, B. (2011). “Case study” in The Sage handbook of qualitative research, eds. Norman K. Denzin and Yvonna S. Lincoln. Thousand Oaks, CA. 4, 301–316.
Gee, K. A. (2018). Minding the gaps in absenteeism: disparities in absenteeism by race/ethnicity, poverty and disability. J. Educ. Stud. Placed Risk (JESPAR) 23, 204–208. doi: 10.1080/10824669.2018.1428610
Gottfried, M. A. (2019). Chronic absenteeism in the classroom context: effects on achievement. Urban Educ. 54, 3–34. doi: 10.1177/0042085915618709
Grooms, A. A., and Bohorquez, D. G. (2022). What’s your excuse? Sensemaking about chronic absenteeism in a rural, Latinx high school. J. School Leadersh. 32, 384–405. doi: 10.1177/10526846211026260
Grunow, A., Park, S., and Bennett, B. (2024). Journey to improvement: a team guide to systems change in education, health care, and social welfare. Lanham, MD: Rowman & Littlefield.
Gutiérrez, K. D. (2016). Designing resilient ecologies: Social design experiments and a new social imagination. Educ. Res, 45, 187–196.
Hamilton, L., Halverson, R., Jackson, S. S., Mandinach, E. B., Supovitz, J. A., and Wayman, J. C. (2009). Using student achievement data to support instructional decision making. Washington, DC: What Works Clearinghouse, U.S. Department of Education.
Hinnant-Crawford, B. (2020). Improvement science in education: a primer. Gorham, ME: Myers Education Press.
Hofferth, S. L., Reid, L., and Mott, F. L. (2001). The effects of early childbearing on schooling over time. Fam. Plan. Perspect. 33, 259–267. doi: 10.2307/3030193
Holmes, B. J., Finegood, D. T., Riley, B. L., and Best, A. (2012). “Systems thinking in dissemination and implementation research” in Dissemination and implementation research in health: translating science to practice. eds. R. C. Brownson, G. A. Colditz, and E. K. Proctor (Oxford: New York, NY), 175–191.
Honig, M. I. (2012). District central office leadership as teaching: How central office administrators support principals’ development as instructional leaders. Educ Admin Quart, 48, 733–774. doi: 10.1177/0013161X12443258
Ikemoto, G. S., and Marsh, J. A. (2007). Cutting through the “data-driven” mantra: different conceptions of data-driven decision making. Teach. Coll. Rec. 109, 105–131. doi: 10.1177/016146810710901310
Jussim, L., and Harber, K. (2005). Teacher expectations and self-fulfilling prophecies: knowns and unknowns, resolved and unresolved controversies. Personal. Soc. Psychol. Rev. 9, 131–155. doi: 10.1207/s15327957pspr0902_3
Kearney, C. A. (2008). An interdisciplinary model of school absenteeism in youth to inform professional practice and public policy. Educ. Psychol. Rev. 20, 257–282. doi: 10.1007/s10648-008-9078-3
Kearney, C. A. (2021). Integrating systemic and analytic approaches to school attendance problems: synergistic frameworks for research and policy directions. Child Youth Care Forum 50, 701–742. doi: 10.1007/s10566-020-09591-0
Kearney, C. A., and Graczyk, P. (2014). A response to intervention model to promote school attendance and decrease school absenteeism. Child Youth Care Forum 43, 1–25. doi: 10.1007/s10566-013-9222-1
Koopmans, M. (2011). Time series in education: the analysis of daily attendance in two high schools. New Orleans, LA: Annual Convention of the American educational Research Association. 8–12. Online Submission.
Langley, G. J. (Ed.) (2009). The improvement guide: a practical approach to enhancing organizational performance. 2nd Edn. San Francisco, CA: Jossey-Bass.
Lewis, C. (2015). What is improvement science? Do we need it in education? Educ. Res. 44, 54–61. doi: 10.3102/0013189X15570388
LeMahieu, P. G., Edwards, A. R., and Gomez, L. M. (2015). At the Nexus of Improvement Science and Teaching: Introduction to a Special Section of the Journal of Teacher Education. J. Teach. Educ. 66, 446–449. doi: 10.1177/0022487115602125
Liu, J. (2022). Imperfect attendance: toward a fairer measure of student absenteeism. Washington DC: Thomas B. Fordham Institute.
Maitlis, S., and Christianson, M. (2014). Sensemaking in organizations: taking stock and moving forward. Acad. Manag. Ann. 8, 57–125. doi: 10.1080/19416520.2014.873177
Malouff, J. M., and Thorsteinsson, E. B. (2016). Bias in grading: a meta-analysis of experimental research findings. Aust. J. Educ. 60, 245–256. doi: 10.1177/0004944116664618
Marsh, J. A. (2012). Interventions promoting educators’ use of data: research insights and gaps. Teach. Coll. Rec. 8, 57–125. doi: 10.5465/19416520.2014.873177
Miles, M. B., Huberman, A. M., and Saldaña, J. (2014). Qualitative Data Analysis: A Methods Sourcebook (3rd ed.). SAGE Publications.
Monahan, K. C., VanDerhei, S., Bechtold, J., and Cauffman, E. (2014). From the school yard to the squad car: school discipline, truancy, and arrest. J. Youth Adolesc. 43, 1110–1122. doi: 10.1007/s10964-014-0103-1
Moonie, S. M., Sterling, D. A., Figgs, L. W., and Castro, M. (2008). The relationship between school absence, academic performance, and asthma status. J. Sch. Health 78, 140–148. doi: 10.1111/j.1746-1561.2007.00276.x
Musaddiq, T., Stange, K., Bacher-Hicks, A., and Goodman, J. (2022). The pandemic’s effect on demand for public schools, homeschooling, and private schools. J. Public Econ. 212:104710. doi: 10.1016/j.jpubeco.2022.104710
Nauer, K. (2016). Battling chronic absenteeism. Phi Delta Kappan 98, 28–34. doi: 10.1177/0031721716671903
Nussbaum, M. C. (2006). Frontiers of justice: disability, nationality, and species membership. Cambridge, MA: Harvard University Press.
Pascale, R. T., Sternin, J., and Sternin, M. (2010). The power of positive deviance: how unlikely innovators solve the world’s toughest problems. Boston, MA: Harvard Business Press.
Ready, D. D. (2010). Socioeconomic disadvantage, school attendance, and early cognitive development the differential effects of school exposure. Sociol. Educ. 83, 271–286. doi: 10.1177/0038040710383520
Santibañez, L., and Guarino, C. M. (2021). The effects of absenteeism on academic and social-emotional outcomes: lessons for COVID-19. Educ. Res. 50, 392–400. doi: 10.3102/0013189X21994488
Schildkamp, K., and Kuiper, W. (2010). Data-informed curriculum reform: which data, what purposes, and promoting and hindering factors. Teach. Teach. Educ. 26, 482–496. doi: 10.1016/j.tate.2009.06.007
Seifert, T. (2004). Understanding student motivation. Educ. Res. 46, 137–149. doi: 10.1080/0013188042000222421
Senge, P. M. (2006). The fifth discipline: the art and practice of the learning organization (rev. and updated). New York: Random House Business Books.
Shaked, H., and Schechter, C. (2014). Systems school leadership: exploring an emerging construct. J. Educ. Adm. 52, 792–811. doi: 10.1108/JEA-07-2013-0081
Smerek, R. E. (2011). Sensemaking and sensegiving: an exploratory study of the simultaneous “being and learning” of new college and university presidents. J. Leadersh. Org. Stud. 18, 80–94. doi: 10.1177/1548051810384268
Spillane, J. P., and Miele, D. B. (2007). Evidence in practice: a framing of the terrain. Teach. Coll. Rec. 109, 46–73. doi: 10.1177/016146810710901303
Spillane, J. P., Reiser, B. J., and Reimer, T. (2002). Policy implementation and cognition: reframing and refocusing implementation research. Rev. Educ. Res. 72, 387–431. doi: 10.3102/00346543072003387
Sterman, J. D. (2000). Business dynamics: systems thinking and modeling for a complex world. Boston, MA: McGraw-Hill.
Teasley, M. L. (2004). Absenteeism and truancy: risk, protection, and best practice implications for school social workers. Child. Sch. 26, 117–128. doi: 10.1093/cs/26.2.117
Tejeda, J., and Ferreira, S. (2014). Applying systems thinking to analyze wind energy sustainability. Proc. Comput. Sci. 28, 213–220. doi: 10.1016/j.procs.2014.03.027
Tichnor-Wagner, A., Wachen, J., Cannata, M., and Cohen-Vogel, L. (2017). Continuous improvement in the public school context: Understanding how educators respond to plan–do–study–act cycles. J. Educ. Change. 18, 465–494. doi: 10.1007/s10833-017-9301-4
Toson, A. L. M., Burrello, L. C., and Knollman, G. (2013). Educational justice for all: The capability approach and inclusive education leadership. Int. j. inclu.edu. 17, 490–506.
U.S. Department of Education, Office of Civil Rights (2016). Chronic absenteeism in the nation’s schools: a hidden educational crisis. Washington, DC: U.S. Department of Education, Office of Civil Rights.
Wang, M. T., and Dishion, T. J. (2012). The trajectories of adolescents’ perceptions of school climate, deviant peer affiliation, and behavioral problems during the middle school years. J. Res. Adolesc. 22, 40–53. doi: 10.1111/j.1532-7795.2011.00763.x
Wayman, J. C., Midgley, S., and Stringfield, S. (2017). “Leadership for data-based decision making: collaborative educator teams” in Learner-centered leadership (New York: Routledge), 189–206.
Yeager, D., Bryk, A., Muhich, J., Hausman, H., and Morales, L. (2013). Improvement research carried out through networked communities: accelerating learning about practices that support more productive student mindsets. Paper presented at the white house meeting on excellence in education: The importance of academic mindsets, Washington, DC. Available online at: http://cdn.carnegiefoundation.org/wp-content/uploads/2014/09/improvement_research_NICs_bryk-yeager.pdf (Accessed December 12, 2024).
Appendix A
Protocol for cypress elementary focus group
1. Ask for predictions:
a. How do you think Cypress compares to other schools? Why is that?
b. Reflect on attendance and its cadence over the course of the school year:
i. When do you think it peaks? Why?
ii. When do you think it dives? Why?
2. Present the data and ask for reflections/reactions:
a. What’s surprising?
b. Why do you think attendance drops when it does?
c. Why do you think attendance began to increase around November?
3. What guidance does the district provide to help monitor/improve attendance?
4. How, if at all, do you follow the district attendance guidance?
a. How do you not follow the district attendance guidance? In what ways do you adapt it to make it work for your context?
5. What do you think other schools can learn from Cypress and their attendance success?
a. Can you provide us with an example?
b. How can you see this in the data we examined?
6. Connecting activity to expanded capability:
a. Do you have attendance goals? If so, why are these goals important to you?
b. How might you use the conversation we had today to help you further those goals next year?
Keywords: improvement, attendance, improvement science, partnership, capability
Citation: Leger M-L and Gomez LM (2025) Helping school leaders see variation and build the capability to improve complex systems. Front. Educ. 10:1503871. doi: 10.3389/feduc.2025.1503871
Edited by:
Hajime Mitani, Rowan University, United StatesReviewed by:
Margaret Terry Orr, Fordham University, United StatesKathleen Kelly Wallace, Sacred Heart University, United States
Copyright © 2025 Leger and Gomez. This is an open-access article distributed under the terms of the Creative Commons Attribution License (CC BY). The use, distribution or reproduction in other forums is permitted, provided the original author(s) and the copyright owner(s) are credited and that the original publication in this journal is cited, in accordance with accepted academic practice. No use, distribution or reproduction is permitted which does not comply with these terms.
*Correspondence: Mary-Louise Leger, bWFyeWxvdWlzZWxlZ2VyQHVjbGEuZWR1