 María-Antonia Manassero-Mas1
 Ángel Vázquez-Alonso2*
- 1Department of Psychology, University of the Balearic Islands, Palma, Spain
- 2Institute for Educational Research and Innovation, University of the Balearic Islands, Palma, Spain
Introduction: The increasing strategic, economic, social and personal value of scientific, technological, engineering and mathematical (STEM) knowledge in current societies highlights the need for STEM professionals. However, the enrolment rates in STEM careers are decreasing, particularly for some STEM specialties, women, and minorities. This lack of STEM vocation has led to worldwide concern, warranting its research, as many factors may influence career decisions. This study analyses the relationships between students’ perceptions of several characteristics of secondary school science classes and their intentions to enroll in STEM careers. It develops a gender perspective on the issue.
Methods: The quantitative methodology surveys thousands of Spanish 15-year-old students who completed the Relevance of Science Education Second (ROSES-Q) questionnaire from 2021 to 2023. Some items about vocational intentions and school science classes were drawn from the ROSES-Q to explore the abovementioned relationships through linear regression analysis.
Results: The results show that students’ intentions to pursue STEM careers approximately amount to one-third of the sample, and boys’ rates are significantly higher than girls’ rates. The items of school science classes reached their agreement peak in “science is interesting,” “increased my curiosity” and “the importance of science for our way of life,” whereas “becoming more critical and skeptical” obtained the lowest score. Most gender differences in these items were not statistically significant. Six school science class items significantly predicted the students’ degree of STEM vocation by sharing 46.1% of their common variance. In decreasing order of prediction power, the six significant predictors are “liking school science better than most other subjects,” “helping to understand sustainability solutions,” “becoming more critical and skeptical,” “importance of science for our way of life,” “difficulty of school science,” and “opening my eyes to new and exciting jobs.”
Discusion: The implications of this study for promoting STEM vocations suggest that teachers carefully cultivate those relevant characteristics of school science classes through appropriate pedagogies and inclusive and equitable contexts for all, especially for girls.
1 Introduction
At the end of the twentieth century, the emergence of information and communication technologies (ICTs) expanded the STEM field, and in the twenty-first century, artificial intelligence and its associated technologies have created new challenges and demands on the economy, industry, employment, jobs, training and education (Chaurasia and Juang, 2022).
For years, governments (European Commission, 2004), researchers (Blickenstaff, 2005; Caspi et al., 2020; Palmer et al., 2017) and organizations (OECD, 2016b) have followed up on the decreasing rates of STEM enrolment due to its importance for economic and social progress. The development of students’ STEM vocations has now become a common concern of authorities, employers and science educators.
Furthermore, gender studies underline females’ lower participation in STEM and the negative consequences of discarding many capable and valuable women for unjustifiable social, educational and psychologically discriminatory reasons (Danielsson et al., 2023).
Among the multiple factors that influence the choice of a STEM career, this study aims to explore the students’ perceptions of school science classes for several reasons. First, school science classes are currently the most institutional, regulated, systematic, perdurable, and high-quality form of contact with STEM for the vast majority of students, as school science used to be a compulsory subject in school curricula from childhood to youth. Hence, analysing the influence of science lessons on the development of students’ STEM vocations is relevant. Second, school factors fostering STEM vocations can be controlled through designing educational interventions, pedagogies and methodologies. Third, earlier studies revealed that the characteristics of school science classes were empirically more important than other science-related attitudinal factors (Vázquez-Alonso and Manassero-Mas, 2009a,c).
Overall, this study aims to determine Spanish students’ current STEM career aspiration rates, their perception of school science classes, the specific characteristics of school science classes that may influence their STEM vocation, and their variability by gender. Thus, this study is expected to pinpoint the characteristics of school science that may significantly contribute to fostering STEM vocations in youth by strengthening them in science teaching characteristics.
2 Literature review
Current knowledge societies and their personal, job and social challenges are deeply rooted in STEM knowledge. For example, perennial environmental problems run deep, and the COVID-19 pandemic, although the last challenge, is not the least important and pervasive. International organizations such as the OECD (2019) and the European Union (European Commission, 2004), look closely at education, particularly STEM education, because STEM literacy plays a key role in countries’ economic and social development and in the personal, job, cultural and democratic aims of participatory and literate citizenship.
During the 21st century, large-scale international educational evaluations, trends in international mathematics and science studies (TIMSS, Mullis et al., 2021), and the Program for International Student Assessment (PISA; OECD, 2019) presented a striking paradox: the highest-scoring students tended to show low interest and poor attitudes toward science (OECD, 2016a,b). These affective obstacles harm personal and social interests in the long term. In contrast, positive attitudes toward STEM contribute to improved learning and many other affective and social features, such as STEM vocations (Fensham, 2009). López Rupérez et al. (2019) analysed Spanish 2015 PISA data, reporting that the rate of the expectation to land a STEM job at age 30 is 15.3% in Spain and 14.5% in the region of the Balearic Islands.
This literature review involves the main issues of this study, namely, the presentation of the current rates of STEM participation in Spain, the STEM vocation in science education research, the gender gap in STEM, and the relevance of science education project.
2.1 Current STEM participation in Spain
The Spanish educational system presents students with the first important decision to choose study specialties at the end of compulsory secondary education (CSE;10th grade), where they must choose between high school or vocational educational training (VET). For both alternatives, students can choose a science modality in high school or a STEM family of VET (or drop-out). Two years later, the students may access the university, and at this point, they can again choose a STEM career. The current numbers of both selections and their gender differences are computed from the raw data of the official educational statistics of Spain to establish the quantitative frame of STEM choices (Table 1).
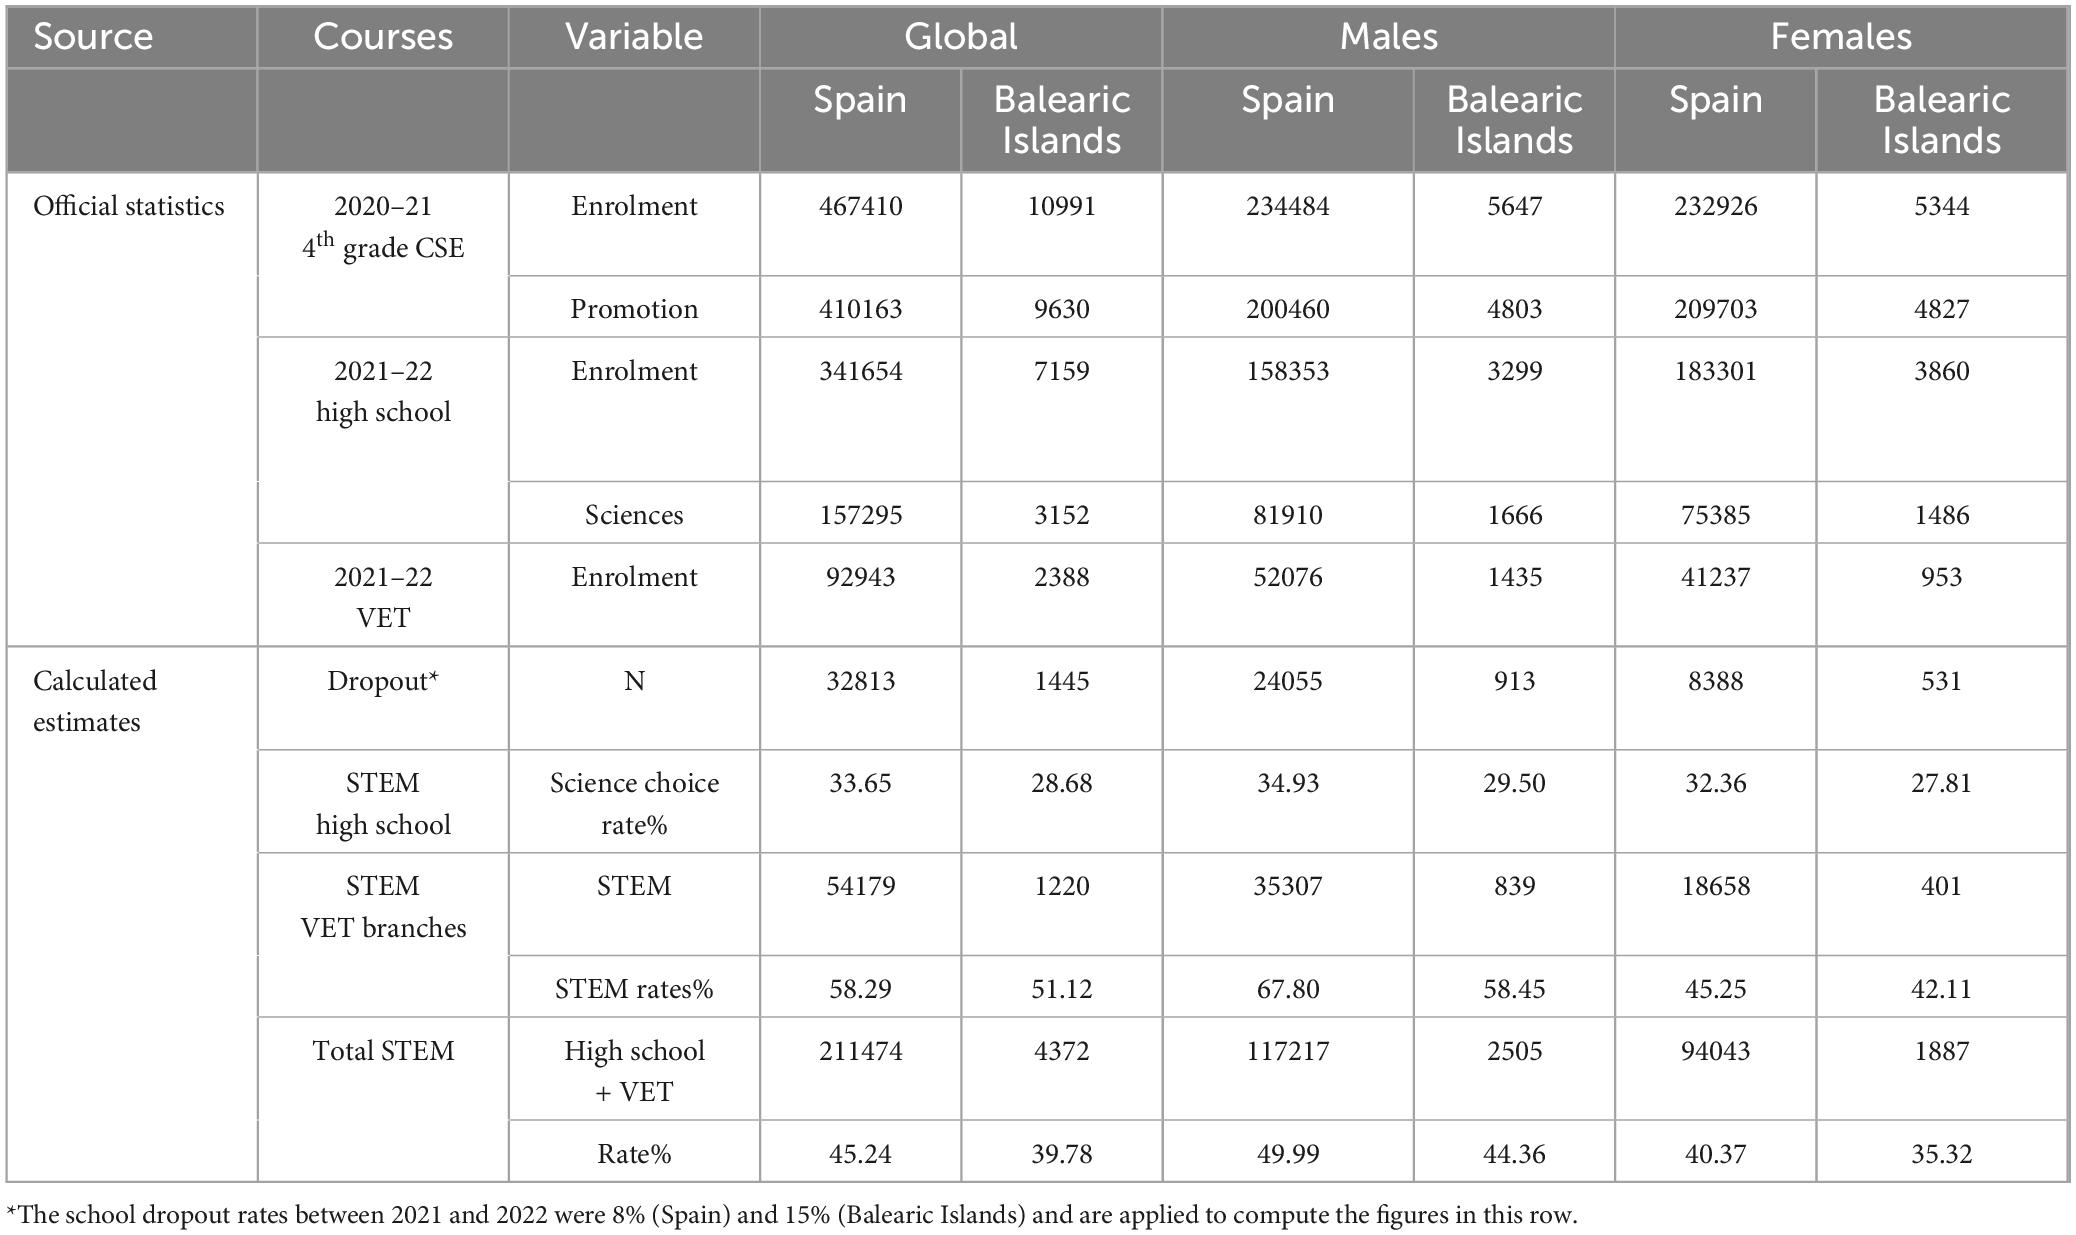
Table 1. Elaboration analysis of the official statistical data to estimate the choice rate of STEM studies by males and females aged 16 years in the transition from the 4th grade of CSE to the post-CSE year (high school or vocational educational training).
The first-choice rate compares the CSE (10th grade) cohort in 2020-21 and the same cohort the next year, 2021–2022 (Ministry of Education, 2023). Students’ dropout rate is estimated by applying the average dropout rate of Spain from Zancajo and Bueno (2023). The results show that roughly one-third of the students choose high school science (Balearic Islands 29% – Spain 34%), and over half choose STEM in VET (51%–58%). Thus, the total cohort displays a mean STEM orientation (40%–45%) with significant gender differences. Overall, the percentage of students who chose STEM studies (high school science and STEM VET) in the Balearic Islands was 38.78% (males 44.36%; females 35.32%).
The figures of the 2021–22 academic year for higher education show the rate of Spanish STEM choices (Ministry of Universities, 2023). The women’s rate is higher than the men’s rate in undergraduate studies of health sciences (71.8%), education (70%), arts and humanities (62.7%) and social and legal sciences (60.3%). The overall percentage of women in science is balanced (50.8%), lowers in engineering, architecture, science and health is (38.79%), and a minority in engineering and architecture (26.5%), and computer science, industry and construction (15%).
The Survey of Social Perception of Science and Technology [Fundación Española para la Ciencia y la Tecnología (FECYT), 2023] shows that fewer younger people (15–24 years) believe the scientific profession (45%) is attractive than the overall sample. However, youth consider more personal compensation (58%) and also some negative characteristics, such as low pay (51%) and no job stability (56%), so, satisfaction, salary or stability do not seem to be the causes of the scientific profession’s low attraction for young people.
Most 15–18-year-old Spanish students (77%) expressed attraction toward STEM careers and professions despite finding them difficult to learn, but only 33% chose STEM studies. Moreover, some negative gender models related to technologies and engineering were detected (EVERIS, 2012). Gender and sociocultural level are key for choosing STEM studies, as 44% of high-sociocultural level students chose STEM, whereas only 24% of low-sociocultural students chose STEM. In addition, 51% of the boys from high sociocultural backgrounds choose STEM, contrasting with 38% of the girls, and 20% of girls from low-sociocultural backgrounds who choose STEM.
2.2 STEM vocation in science education research
According to 2022 European statistics, the number of people employed in STEM (52% women) has increased by 2.5% compared to 2021. Scientists and engineers of the European Union constitute 23.7% of the total professional category, which also increased by 3.6% compared to 2021. Female scientists and engineers were underrepresented (41% in 2022), but their figures grew by almost 50% the next year1. The European panel data (2013–2018) showed that there were twice as many male STEM graduates as females (Gaweł and Krstić, 2021).
For years, the few students who chose STEM contrasted with the high demand for STEM professionals generated by techno-scientific development. This gap is a cause for international concern due to its social (employability and social mobility), economic (development and competitiveness), cultural (participatory citizenship), labor (employment), educational (literacy) and personal (health) implications (Archer Ker et al., 2013; Bøe et al., 2011; Holmegaard et al., 2014).
The key issue in the analysis of STEM vocation decisions in specialized literature is their multiple influencing factors (sex, age, education, family, social factors, ability, identity, etc.), which have been extensively explored through professional surveys and inventories in many scholarly studies aimed at understanding and explaining the reasons underlying the decisions to pursue STEM fields (e.g., Caspi et al., 2020; Lyons et al., 2012; Palmer et al., 2017; Vázquez-Alonso et al., 2013).
Career choice decisions have long been studied from the psychological, educational and social perspectives (McClelland, 1987), where the social cognitive theory (Bandura, 1997), the self-determination theory (Ryan and Deci, 2000), the vocational personality theory (Holland, 1997) and the gender role theory (Eccles, 2014) are the key theoretical frameworks that inspire the understanding and interpretation of adolescents’ expectations and job choices, as well as their gender and generational differences. Job choice is a dynamic process that develops from birth to working age, along with the complex fit and interactions among individuals’ identities, self-concepts, skills, cognitions, attitudes, interests, expectations, aspirations and needs, and that parallels their perceptions of work, family, society and their mutual relationships.
The STEM career choice model of the ASPIRES project involves multiple factors in three areas: education (schools, teachers, school science and educational guidance), social representations of science (male science, science for intelligent people, etc.) and capital-related inequalities (scientific capital, specific inequalities and risks, and other passions and capitals). The complex interaction between these factors and students’ personal identities and aspirations leads to decisions of recognition, achievement and continuity in STEM (Archer Ker et al., 2013), which recall the motivational needs proposed by McClelland (1987) and Ryan and Deci (2000).
More than 80% of the young people surveyed by Archer Ker et al. (2013) agreed that “scientists are brainy,” and this social representation of scientists and scientific careers discourages many young people, who do not consider themselves intelligent enough, and conclude that STEM careers are not for them (Jenkins and Nelson, 2010). In the same vein, the image of STEM careers concerning gender (male), ethnicity (white) or social class (elitist) projects a problem of inequalities because women, some races and some social classes perceive themselves as misfits in STEM. This is a particular case of a global issue within work and organizational psychology, which highlights the importance of the (real or perceived) (mis)match between jobs and actors’ personal competencies (i.e., sense of self-efficacy) (Kjćrnsli and Lie, 2011; Robbins and Judge, 2016).
Various agencies (schools, teachers, peers, family, etc.) also shape people’s vocational choices. For example, families strongly influence the STEM aspirations of 14-year-old students through the family’s scientific capital, which is based on family members’ STEM qualifications, understanding, knowledge (of science and how it works), interest, and social contacts (e.g., acquaintances who have a STEM job). Students from families with medium or high scientific capital are more likely to study STEM after age 16 (Archer et al., 2015; Archer et al., 2010). The research of Archer et al. (2015) implements the concept of science capital across eight dimensions, namely, scientific literacy; science-related attitudes; values and dispositions; knowledge about the transferability of science; participation in out-of-school science learning contexts; science media consumption; family science skills; knowledge and qualifications; knowing people in science-related roles; and talking about science in everyday life (DeWitt et al., 2013; Moote et al., 2020, 2021).
Other studies underline the key role of the psychological adjustment between identity, personal aspirations, and STEM image as a determining factor in choices. Taconis and Kessels (2009) reported that academic choices can be predicted by students’ perceived similarity with prototypical images of studies. Even when controlling for some traits (consistently related to the inclination toward science), students’ academic choices still depend on their perception of their similarity with their prototype of a science person. Furthermore, many students do not choose STEM because they perceive the field as too rigid, stable and fixed, thus making it too narrow a way to develop and build desirable personal identities. In the case of women, the masculine and brainy image of STEM conflicts with many women’s individual identities (Holmegaard et al., 2014).
The vocational literature also focuses on academic and career guidance to help students make the best career choices. Educational counselors consider that the one-size-fits-all approach does not work (Bondie et al., 2019). Therefore, individuals need different levels and kinds of support at various stages of their schooling (Blenkinsop et al., 2006). Although quality counseling and guidance benefit young people in building on their aspirations, this perspective tends to be cautious and non-specific, as it uses case studies. Hence, some researchers consider that vocational guidance is scarce and tardy, causing young people to have a narrow vision of tasks and professions and limiting their opportunities to imagine themselves as STEM professionals (Archer Ker et al., 2013). In this context, guiding and increasing personal awareness of the variety of STEM careers and professions and the multiplicity of opportunities that can unfold from STEM studies requires offering a broader and more equitable image of science. Personalization requires developing an individual’s capacity to imagine the professional future within STEM and challenging the potential mismatch between one’s identity and the image of STEM professionals (DeWitt et al., 2013; Osborne and Dillon, 2008).
Science education pays special attention to and highlights the influence of educational factors on STEM vocations (e.g., Archer Ker et al., 2013; Vázquez-Alonso and Manassero-Mas, 2008b). This view usually proposes adaptations and adjustments to the form and contents of science courses to meet the interests of those who choose science (and those who do not) to improve their job expectations and aspirations (Holmegaard et al., 2014; Vázquez-Alonso and Manassero-Mas, 2009a), as well as to adequately situate career decision-making in each cultural context (Bøe et al., 2011). From this view, this study aims to analyse students’ choices based on their perceptions of and experiences in school science classes.
2.3 STEM and the gender gap
Inclusion is key to addressing social justice, the lack of diversity in STEM classrooms, and the consequent gaps in different groups of students’ STEM engagement and attainment. The literature widely shows that girls, disabled youth, and students from some ethnic or disadvantaged backgrounds are underrepresented in school STEM education. Gender differences in STEM are the most discouraging findings because they negatively impact the equity, inclusion and social justice of STEM learning and recruitment (Archer Ker et al., 2013; Carlone and Johnson, 2007).
The low proportion of girls in STEM careers and occupations is a major concern in many countries because female talent is lost for negligeable reasons, which contradicts the widely accepted social commitment to gender equity. The report of the World Economic Forum (2017) revealed that, on average, men are underrepresented in the fields of education, and health and wellness, whereas women are underrepresented in STEM fields. The Spanish education system divides studies into vocational studies and high school, with the latter encompassing a majority of girls (53.5%). Subsequently, university students are divided into STEM careers and non-STEM careers, with the former accounting for 52.7% of the girls. Although Spanish global statistics do not reveal any visible gender gap, it is concealed in some STEM careers (physics, engineering or computer science), where women’s rates are very low (see Section 2.1).
Women’s underrepresentation in STEM careers has been heavily researched, and two meta-analyses stand out. Blickenstaff (2005) analysed the gender gap (1970–1991) and proposed nine causal factors: biological differences, academic preparation, attitudes toward STEM, lack of role models, curriculum, pedagogy, “cold” climate in STEM classes, socialization of gender roles, and epistemological differences. Kanny et al. (2014) investigated the STEM gender gap over four decades (1970–2010) and identified the following predominant explanations: individual background, structural barriers in education, psychological factors, values and preferences, family influences and expectations, and perceptions of STEM fields.
The low proportion of women transmits a stereotypical male image and supremacy in STEM, which decreases (increases) the choices of young women (men), leading to the mutual reinforcement of stereotypes and gender gaps in interest in STEM and career-related choices. Penner (2015) grouped the empirically relevant factors of the STEM gender gap along an individual category (psychological and personal preferences, neutral materials, anxiety, self-efficacy, etc.) and a social category (stereotypes, families, teachers, etc.), although the two categories interact with each other (Olmedo-Torre et al., 2018). Furthermore, Cheryan et al. (2017) suggested a three-category model: the stereotypical male image of STEM; the deficit of women’s prior experiences in computer science, engineering and physics; and women’s lower perception of self-efficacy.
The persistent action of the male STEM stereotype has been widely proven because students—especially very interested men and women who are less identified—continue to perceive STEM as a male domain despite the increase in the number of women. This stereotype hinders women’s identification with STEM subjects and studies, negatively affects their self-concept and interests, and impedes their pursuit of a STEM career. Makarova et al. (2019) show that stereotypes drive aspirations for STEM careers, as female and male secondary students perceive mathematics, physics, and chemistry as male subjects,(in decreasing order of masculinity). Furthermore, secondary school females perceive all three subjects as a male domain much more strongly than males do. Women who chose STEM careers as their higher education career perceived the three subjects as less masculine than women who chose other careers did. In sum, a strong male image decreases the likelihood of women choosing a college STEM major.
In summary, the above research reveals the multifaceted complexity and mutual overlap of the factors influencing young people’s STEM choices. For example, in addition to their teaching role, science teachers may jointly perform as social role models of trained scientists and advisers in STEM. A tentative four-category taxonomy may account for factor complexity based on the factors’ main affinity.
• Personal category: interest and enjoyment, academic ability, self-efficacy and confidence, sex, age, identity, etc.
• Social category: role models and mentors; family and peer influence; and social and real-world authenticity, value and relevance.
• Educational category: the quality of STEM education, experiential learning opportunities, career exploration and guidance and teacher influence.
• Contextual category: cultural and societal factors, exposure to STEM extracurricular activities, cultural stereotypes (gender, race and minorities) and economic factors.
Most STEM vocational literature (i.e., Moote et al., 2020; Carlone and Johnson, 2007) is qualitative and oriented to STEM social inequities, whereas factors intrinsic to STEM education are often overlooked in research. This study empirically researches the impact of science classes on STEM vocation.
2.4 The relevance of science education
At the beginning of the twenty-first century, the Relevance of Science Education project (hereinafter referred to as the Rose-2002) gave voice to students worldwide to express their attitudes toward STEM. Young people in Western countries have expressed a general pattern of disappointment with STEM and shown many gender differences, with a dramatic gap in STEM careers, as few Western adolescents, especially very few girls, want to become scientists or technologists (Schreiner and Sjøberg, 2019; Sjøberg and Schreiner, 2019).
In particular, the profile of responses to items about “science classes in school” revealed that school science was less interesting than other school subjects, with a strong pattern of gender differences (girls from developed countries were far less interested than boys were). The claim that “science has opened my eyes to new and exciting jobs” showed the lowest proportion of agreement in developed countries and large gender differences. Three statements about school science learning (how to take care of my health, increasing my curiosity and showing the importance of STEM for our way of life) showed that in most European countries less than half of the respondents agreed (Schreiner and Sjøberg, 2019; Sjøberg and Schreiner, 2019). This lack of relevance of school science undermines aspiration and interest in STEM, and in the long term, it also harms society. Thus, teaching positive attitudes toward STEM should be an important learning objective, as it is worthwhile for educational, personal, job and social welfare (Fensham, 2009).
Spanish adolescents did not conform to the previous pattern. For example, Spanish gender differences are the lowest in Western countries (Vázquez and Manassero, 2007). Vázquez and Manassero, 2008a; Vázquez-Alonso and Manassero-Mas, 2009b analysed the prediction of students’ STEM choices across some attitudinal factors, gender and type of education, finding that school science attitudes are the most influential factors because they are significant predictors across all subgroups of students.
A replication of the ROSE-2002, called ROSE Second (ROSES-2020), was launched to update the evidence on young people’s attitudes toward STEM worldwide (Jidesjö et al., 2021; Oskarsson et al., 2019). In a renewed, updated and evidence-based framework, the ROSES-2020 project gives voice to students to empirically collect the attitudinal aspects and contexts of their school science. The emphasis on students’ voices means they have a in their education, and the literature on students’ voices recommends paying attention to their opinions and commitments to motivation and learning (Quaglia and Corso, 2014).
The innovation of the ROSES-2020 project shifts from conventional cognitive knowledge (such as the TIMSS and PISA) to the affective and attitudinal criteria for success in education (interest, positive attitudes, willingness to become involved in STEM issues, understanding their importance for personal, job and social goals, appraising their impact on well-being, culture, the environment, etc.). This attitudinal shift in science education is closely linked to fostering sustainable, long-lasting, lifelong outcomes in STEM learning; improving literacy, motivation, and participation in STEM (school subjects, careers and jobs); and increasing gender diversity in STEM teaching.
Aschim et al. (2021) presented some previous results from the ROSES-2020 in school science in Norway. The proportion of Norwegian students who agreed that school science is interesting was high (68%), and the proportion of students who liked school science better than most other subjects increased from 33% (ROSE-2002) to 41% (ROSES-2020). However, other items hardly changed (school science opens one’s eyes to new and exciting job, and school science is useful in daily life). Norwegian boys’ and girls’ perceptions of school science were both nuanced and interesting, as gender differences decreased considerably and even reversed in some respects (school science is useful in daily life and has opened my eyes to new and exciting job).
This study draws on ROSES-2020 Spanish data to explore students’ perceptions of school science classes, their gender differences, and their STEM vocation choices taking into account the previous literature review on STEM participation in Spain, STEM vocations, and the gender gap. The research questions of this study are as follows:
• What are the current aspiration rates of Spanish students regarding future STEM studies?
• How do students perceive some characteristics of their school science classes?
• Which are the best and worst perceived characteristics by gender?
• How does the perception of school science classes influence future STEM vocation?
• What school science characteristics are the strongest predictors of STEM vocation by gender and future choices?
3 Materials and methods
This section displays the sample of Spanish participants, the ROSES-2020 research instrument and the procedures and statistics developed in this study.
3.1 Participants
The target group of the ROSES was 15-year-old students (the same as the PISA) because they had just finished their compulsory education and were beginning their choices of future academic trajectories. A convenience, random sample of 2154 students anonymously completed the ROSES-2020 questionnaire (ROSES-Q). They were informed about their freedom to leave questions unanswered, the anonymity of their answers to the survey, and their voluntary participation.
The responses were refined according to various quality criteria described in the Procedures section to eliminate invalid responses. After refinement, the valid sample of this study consisted of 1909 students (959 girls, 868 boys and 82 who preferred not to respond), with a mean age of 14.9 years (Table 2). As the students could leave items unanswered, the sample with complete data was smaller: 1696 students (837 girls, 786 boys and 73 unidentified), with a mean age of 15.0 years (Table 3).
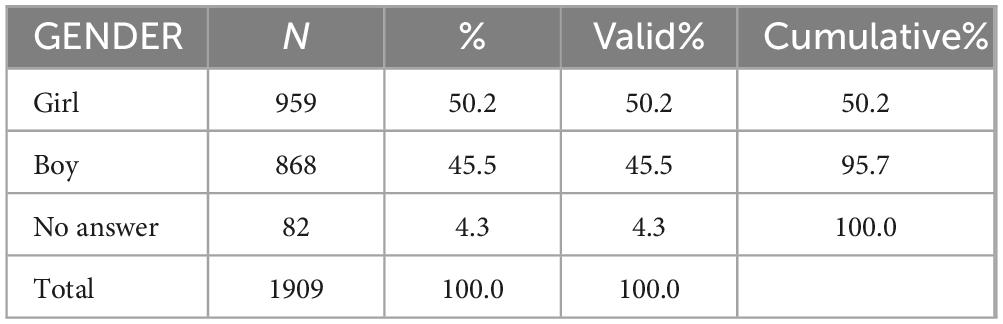
Table 2. Distribution of the total valid sample by sex.
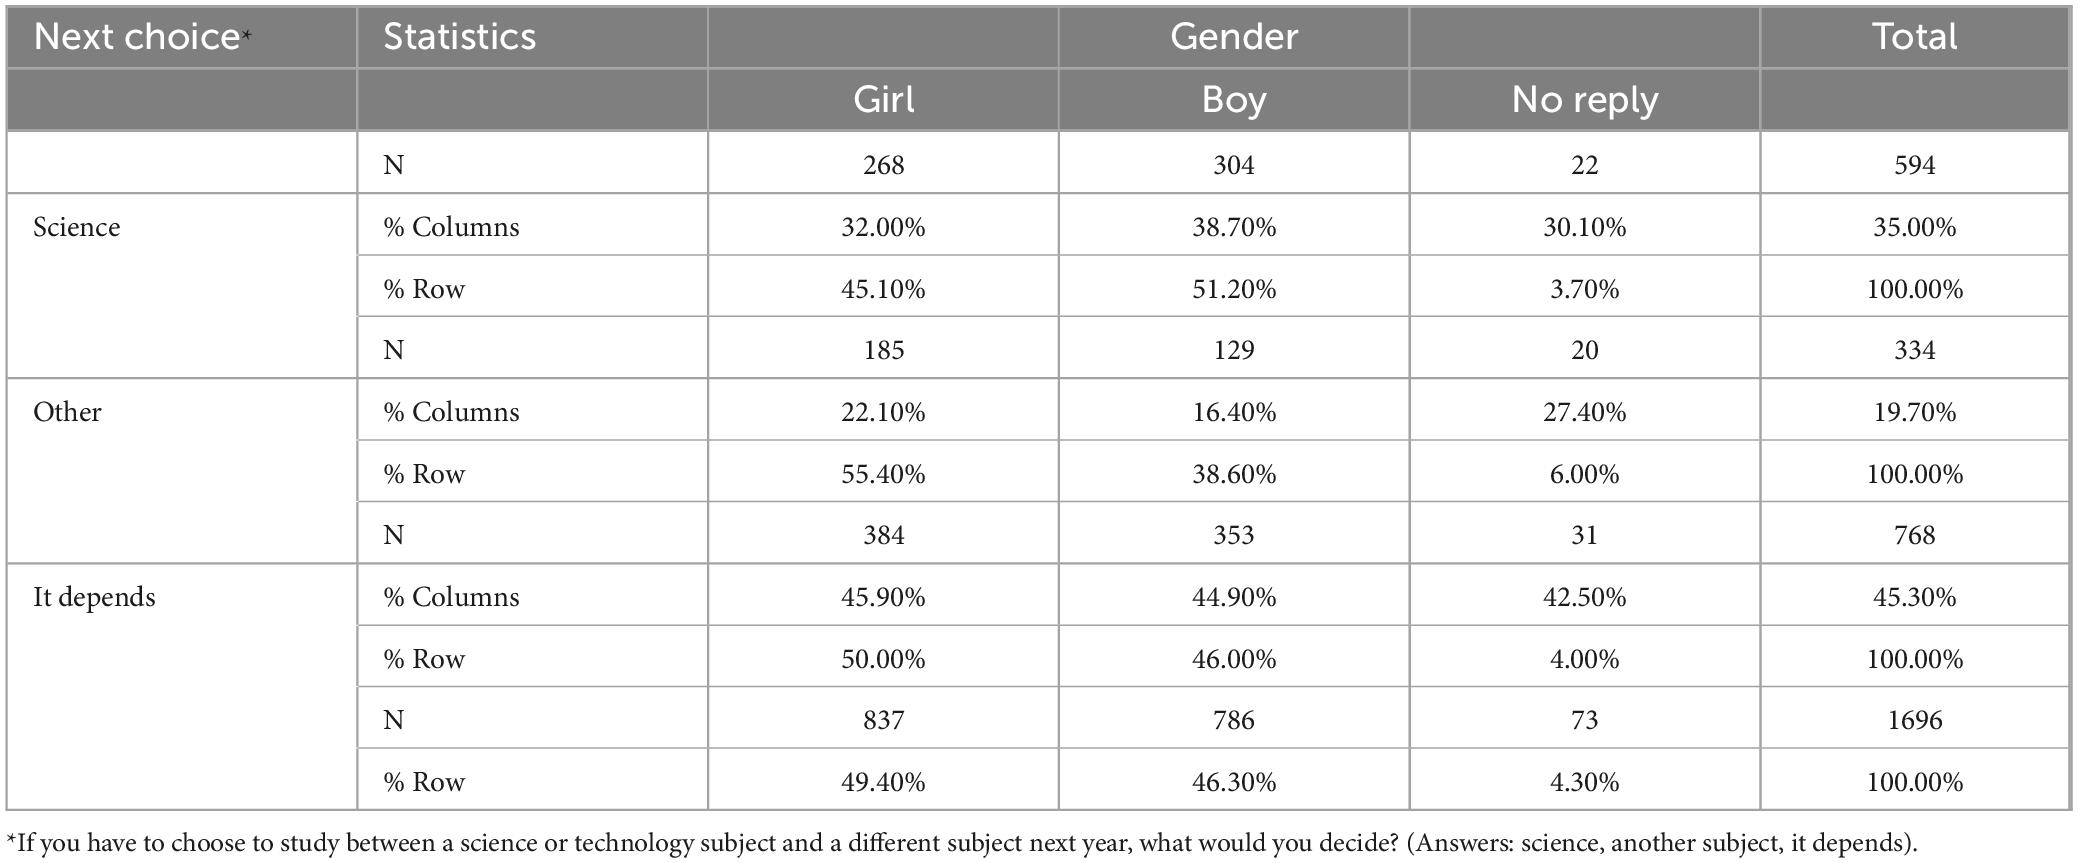
Table 3. Distribution of the total valid sample as a function of the next choice variable by gender.
The surveyed students attended 23 secondary schools (14 public and 9 private) throughout the geography of the island of Mallorca (Spain). According to official Spanish statistics of education (Ministry of Education, 2023), the population involves 23,127 students, and the proportion of students enrolled in public schools is 61.95%. This proportion in our sample is 61.80%, almost the same; furthermore, when computed in the most unfavorable conditions (p = q = 0.50), the sampling error is ± 2.1%. These indicators support the representativeness of the sample concerning the population.
3.2 Materials and instruments
The ROSES-2020 research instrument (ROSES-Q) is an anonymous survey developed by an international team of experts in science education to empirically collect diverse students’ affective data (attitudes, opinions, perceptions and preferences) on their experiences related to STEM education during their compulsory education both within (classes, curricular issues, use of technologies, etc.) and outside the school (future work, extracurricular activities, vocation, etc.) (Jidesjö et al., 2020). The ROSES-Q also collects some personal background variables (e.g., sex, age and future choice of STEM school subjects). Jidesjö et al. (2020) justified the development of the RoseS-Q on the basis of the statistical and validation analysis of a previous version (Sjøberg and Schreiner, 2019) and a piloting of the new version in four countries. RoseS-Q presents 167 Likert-type items considered key for the relevance of science education and grouped by thematic affinity into seven categories.
Each of these experiences is developed in the questionnaire through a specialized scale, which includes interest in curricular content (scales A, C, E), priorities and motivations for a future job (B), views on environmental challenges (D), school science classes (F), perceptions of the role of STEM in society (G), use of ICT at home and in school (H), participation in STEM-related extracurricular experiences (I) and two short open essays. The scale “My science class” asks students, “To what extent do you agree with the following statements?” It then presents ten statements that depict various features of science classes at school. The students’ responses to them show their attitudes and perceptions toward school science and are used in this study (Table 4).
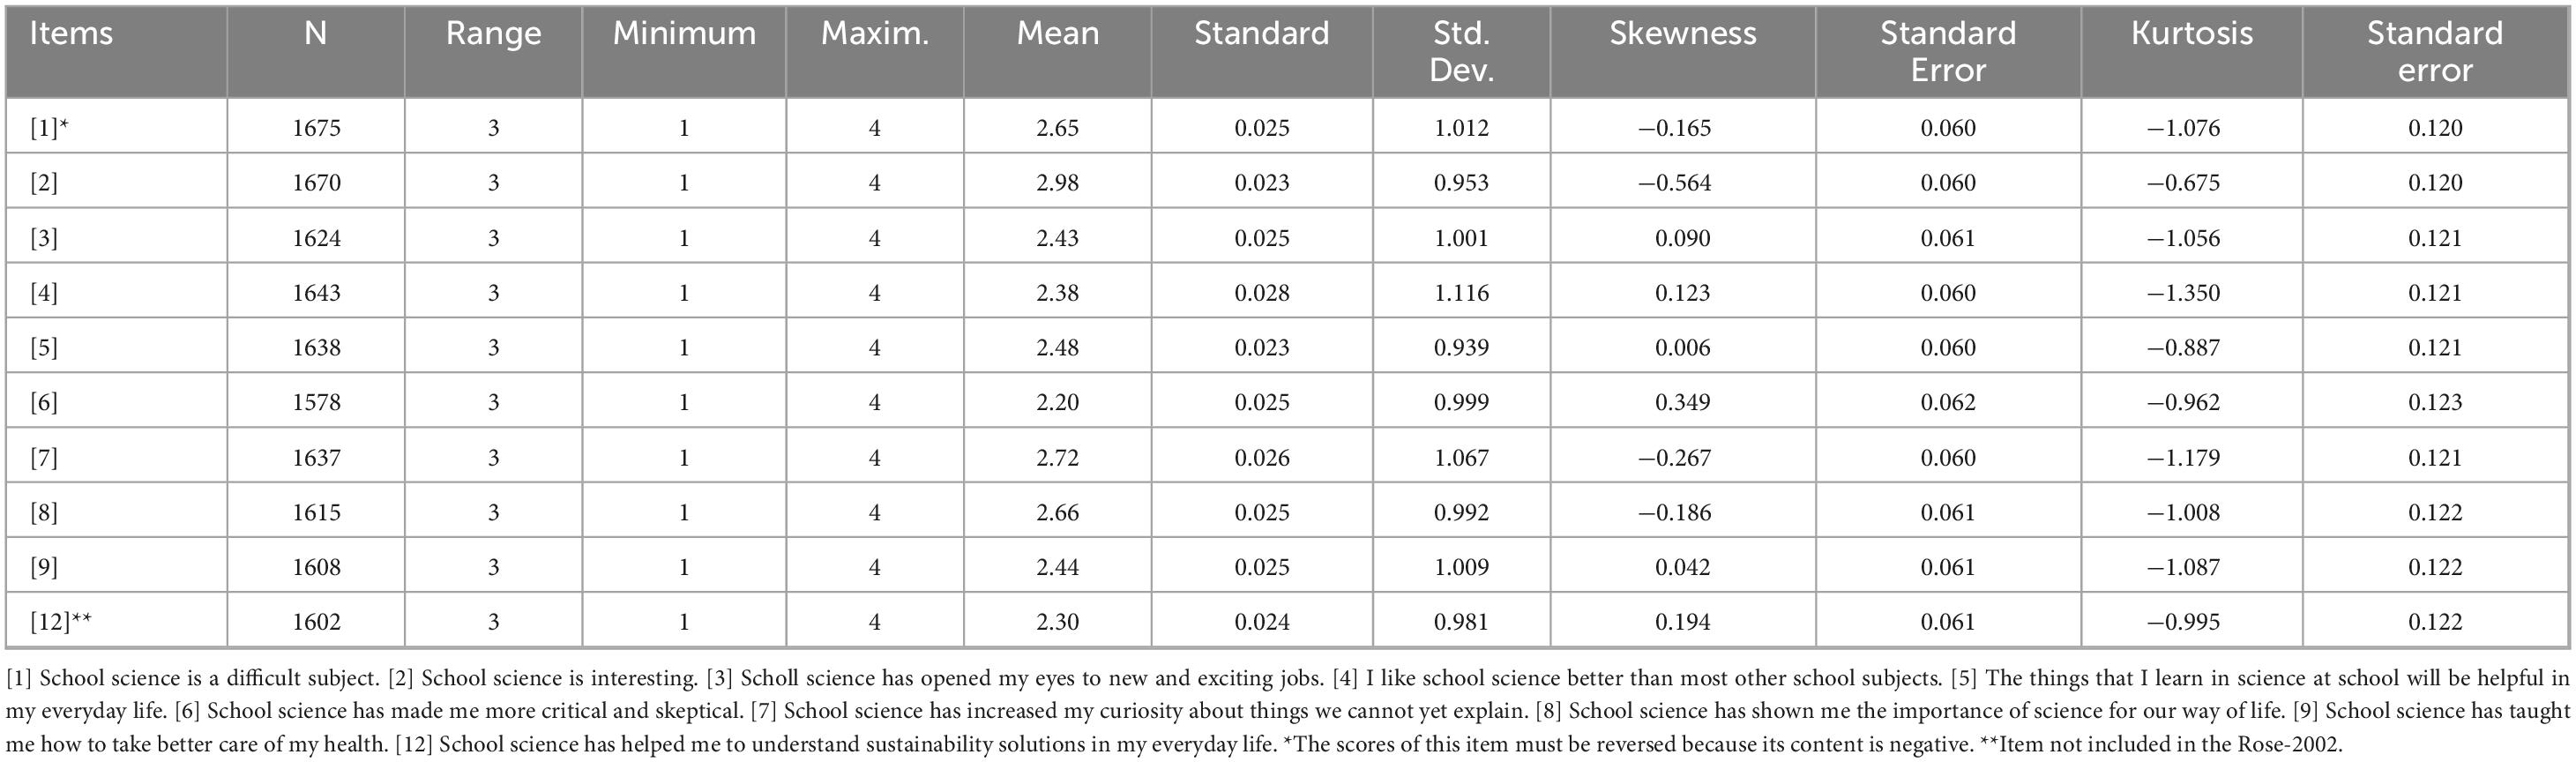
Table 4. Descriptive statistics of the responses to the items of the “My Science Class” scale.
The wording of the items is direct, simple and brief, and the responses are rated on a four-point Likert scale (disagree 1-2-3-4 agree). Students mark the number that best represents their attitude in each item. Note that the first sentence (“School science is a difficult subject”) has a negative connotation, as it is a negative perception (difficulty) of school science. The inclusion of phrases with negative content is a common practice in the construction of rating scales to compensate for respondents’ acquiescence bias, which hinders the validity and reliability of the instruments (Suárez-Alvarez et al., 2018). Evaluating negative sentences requires reversing the interpretation of the scores to reach the same meaning and value for positive and negative items.
3.3 Procedures
Data collection was carried out in 2021 and 2022 digitally, anonymously and online. The teachers of each participating school applied the ROSES-Q to their students through online links as a class assignment, all using the same application protocol and with the researchers support and collaboration to clarify doubts and to ensure quality and consistency during the survey process.
The researchers cleaned the database by eliminating individual registers that fit the following criteria: registers with very few or isolated responses (199); humorous, jocose or offensive responses (43); homogeneous response patterns (38); or inconsistent (random) responses (86).
Students’ responses to the My Science Class scale constitute the basic data for this study, whose valid responses were analysed with the SPSS26 package to establish the descriptive parameters of the variables and the statistical significance of the group differences, as well as to perform linear regression and other analyses. Furthermore, the xFactor12.01.02 program develops structural equation models that combine exploratory and confirmatory analysis, applies the Solomon method that splits the sample in two equivalent subsamples for computations, estimates the asymptotic covariance/variance matrix by using bootstrap sampling, determines the number of dimensions through the optimal implementation of parallel analysis (PA), applies the Robust Unweighted Least Squares (RULS) method for factor extraction, and robust Promin rotation to achieve factor simplicity, and assess several indices of reliability. The computations are based on polychoric correlations, which are appropriate for ordinal scores that may violate normality (Ferrando and Lorenzo-Seva, 2017, 2018; Lorenzo-Seva and Ferrando, 2019).
Group comparisons were assessed with the probability of statistical significance for hypothesis testing and the statistical effect size (d, eta-squared) to measure the relevance of group differences. The differences are relevant when Cohen’s d is greater than 0.4 (large differences, d > 0.8) and the eta-squared value is greater than.04 (large differences, η2 > 0.14), although, in education, differences slightly lower than the previous cut-off points are often considered relevant.
4 Results
This section displays the descriptive statistics of the three variables that define scientific vocation and the ten aspects of science classes. Next, group differences in these variables and the empirical correlations between scientific vocation and various aspects of science classes are analysed.
4.1 The STEM vocation
To represent STEM vocation, a new variable (STEM_VOCATION), which is based on three items of the ROSES-Q that embody students’ direct behavioral intentions toward STEM studies, was created. The first two items ask students to indicate their degree of agreement (on a 1–4 Likert scale) with the phrases “I would like to become a scientist” and “I would like to get a job in technology.” The third item asks students about their choice between a science/technology subject and another subject (choice scoring: science/technology, 4 points; another subject, 1 point; it depends, 2 points).
The STEM_VOCATION variable is defined as the sum of the scores of these three variables, so it has a nine-point range (3–12). The highest score (12) corresponds to a profile of maximum STEM vocation, involving the highest score in all three components (choice of the science subject, maximum agreement with the intention of becoming a scientist, and working in technology). The opposite is true for the lowest score (3) and proportionally for the intermediate scores (Table 5).
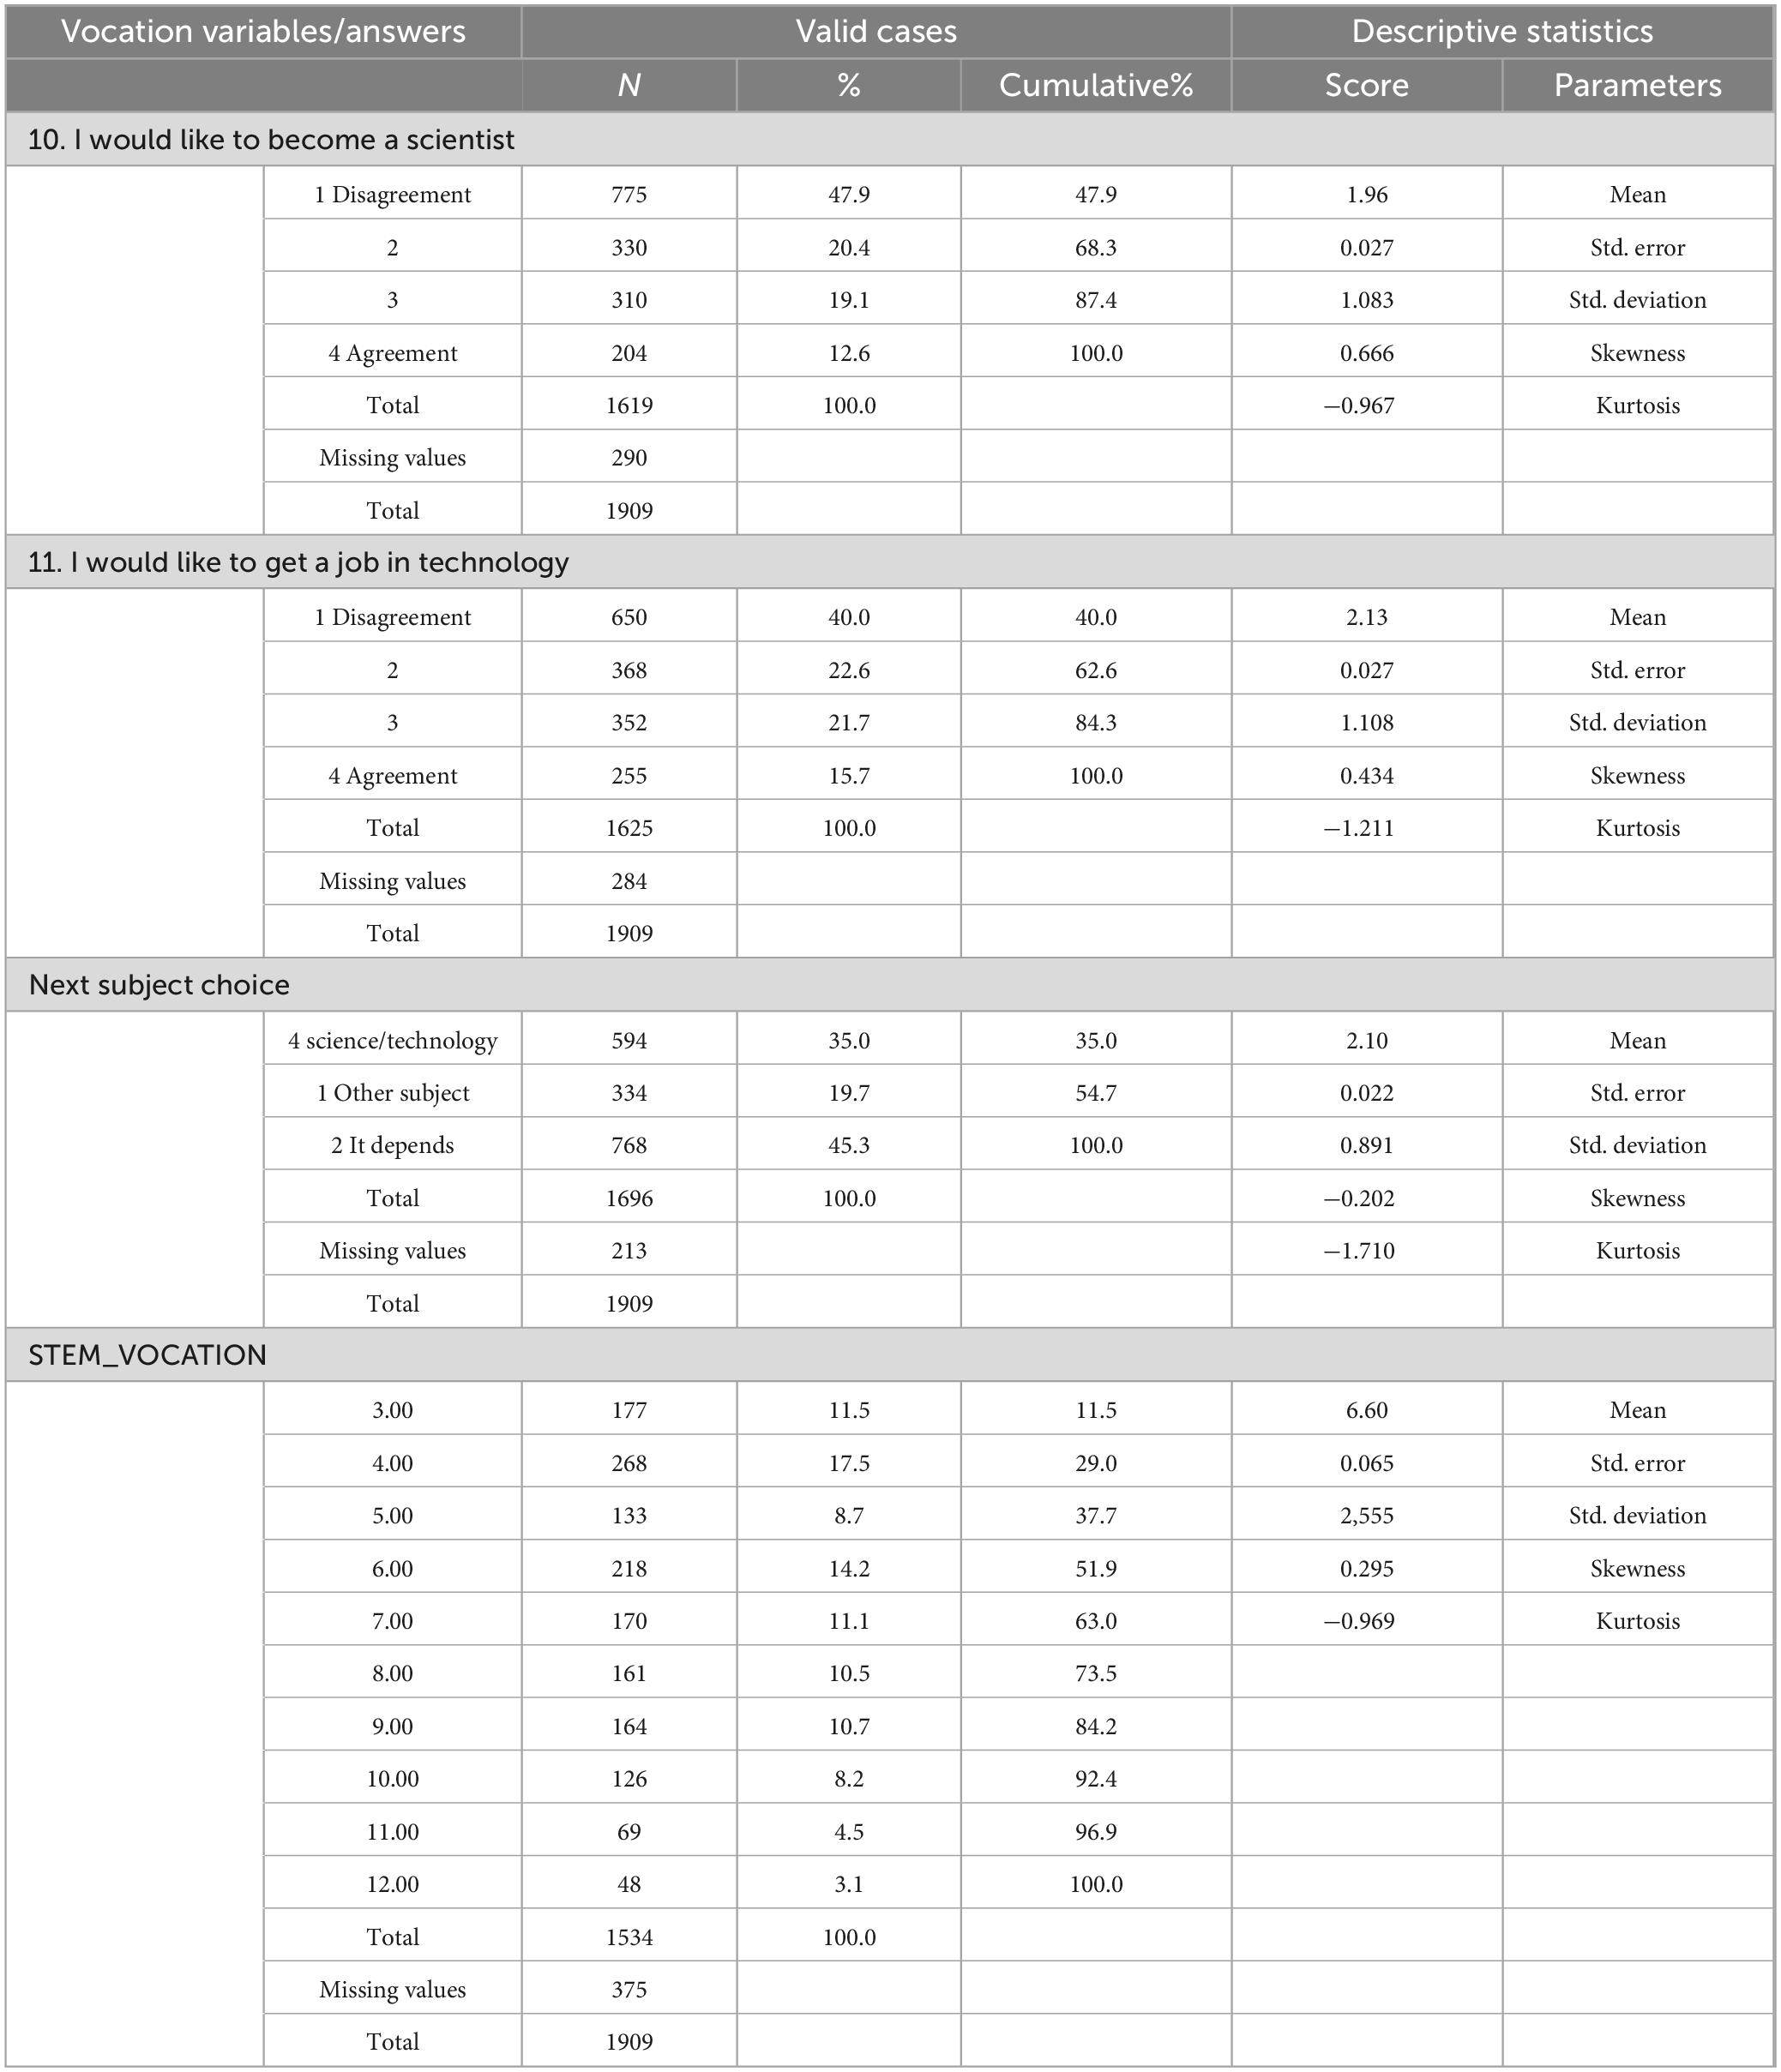
Table 5. Descriptive statistics of the three variables (10, 11 and next choice) that form the STEM_VOCATION variable (proportion of the direct responses and some central parameters).
The descriptive statistics of the behavioral variables toward a STEM vocation in the sample of students show that a minority of students intend to become scientists, as only 31.7% responded with one of the two agreement options (3–4) on the Likert scale (Table 5). This means that most students (68.3%) would not like to become scientists. Concerning the expectation of getting a job in technology, 37.4% of the students responded with one of the two agreement options on the Likert scale (3–4), whereas 62.6% disagreed. Regarding the choice between a science subject and other subjects, 35% of the students stated that they would choose the science subject, whereas 19.7% indicated that they would choose the other (non-science) subject, and 45.3% suspended their decision (“it depends” on the nature of the non-science subject).
The profile of the composite STEM vocation variable shows that 63% of the students would score in the lower half of this variable’s scale and, complementarily, 37% would fall within the highest scores of its range (8–12). Overall, these results indicate that indicate that 31.7%–37.4% of Spanish 15-year-old students intend to pursue STEM studies.
The above percentage figures can also be expressed in weighted average scores, which synthesize the position of the variables on a single global centralizing parameter within the range of each variable (Table 5, right column). The weighted average of the intention to be a scientist in ROSES-2020 is approximately the same as that in ROSE-2002, but the expectation of a job in technology has significantly increased, and the effect size of the difference was not negligible (d = 0.21).
Table 4 presents the descriptive statistics of the My Science Class scale items in the sample of students, including their weighted averages. The items that achieve the highest average agreement are “School science is interesting” (2), “School science has increased my curiosity about things we cannot yet explain” (7) and “School science has shown me the importance of science for our way of life” (8). On the other hand, the item that obtained the lowest average agreement is “School science has made me more critical and skeptical” (6).
4.2 Comparison with previous results of the ROSE-2002
The average results of the ROSES-2020 were compared with the results obtained in the previous wave (ROSE-2002) across the nine shared items, whose wording was the same in both studies (Figure 1). The main characteristic shows that the profiles of the nine-item averages at the two time points are approximately parallel, despite the insignificant crossings of the two lines. Furthermore, both profiles present the relative maximums and minimums on the same items, showing that the students’ attitudinal patterns across the nine items are quite similar in both waves.
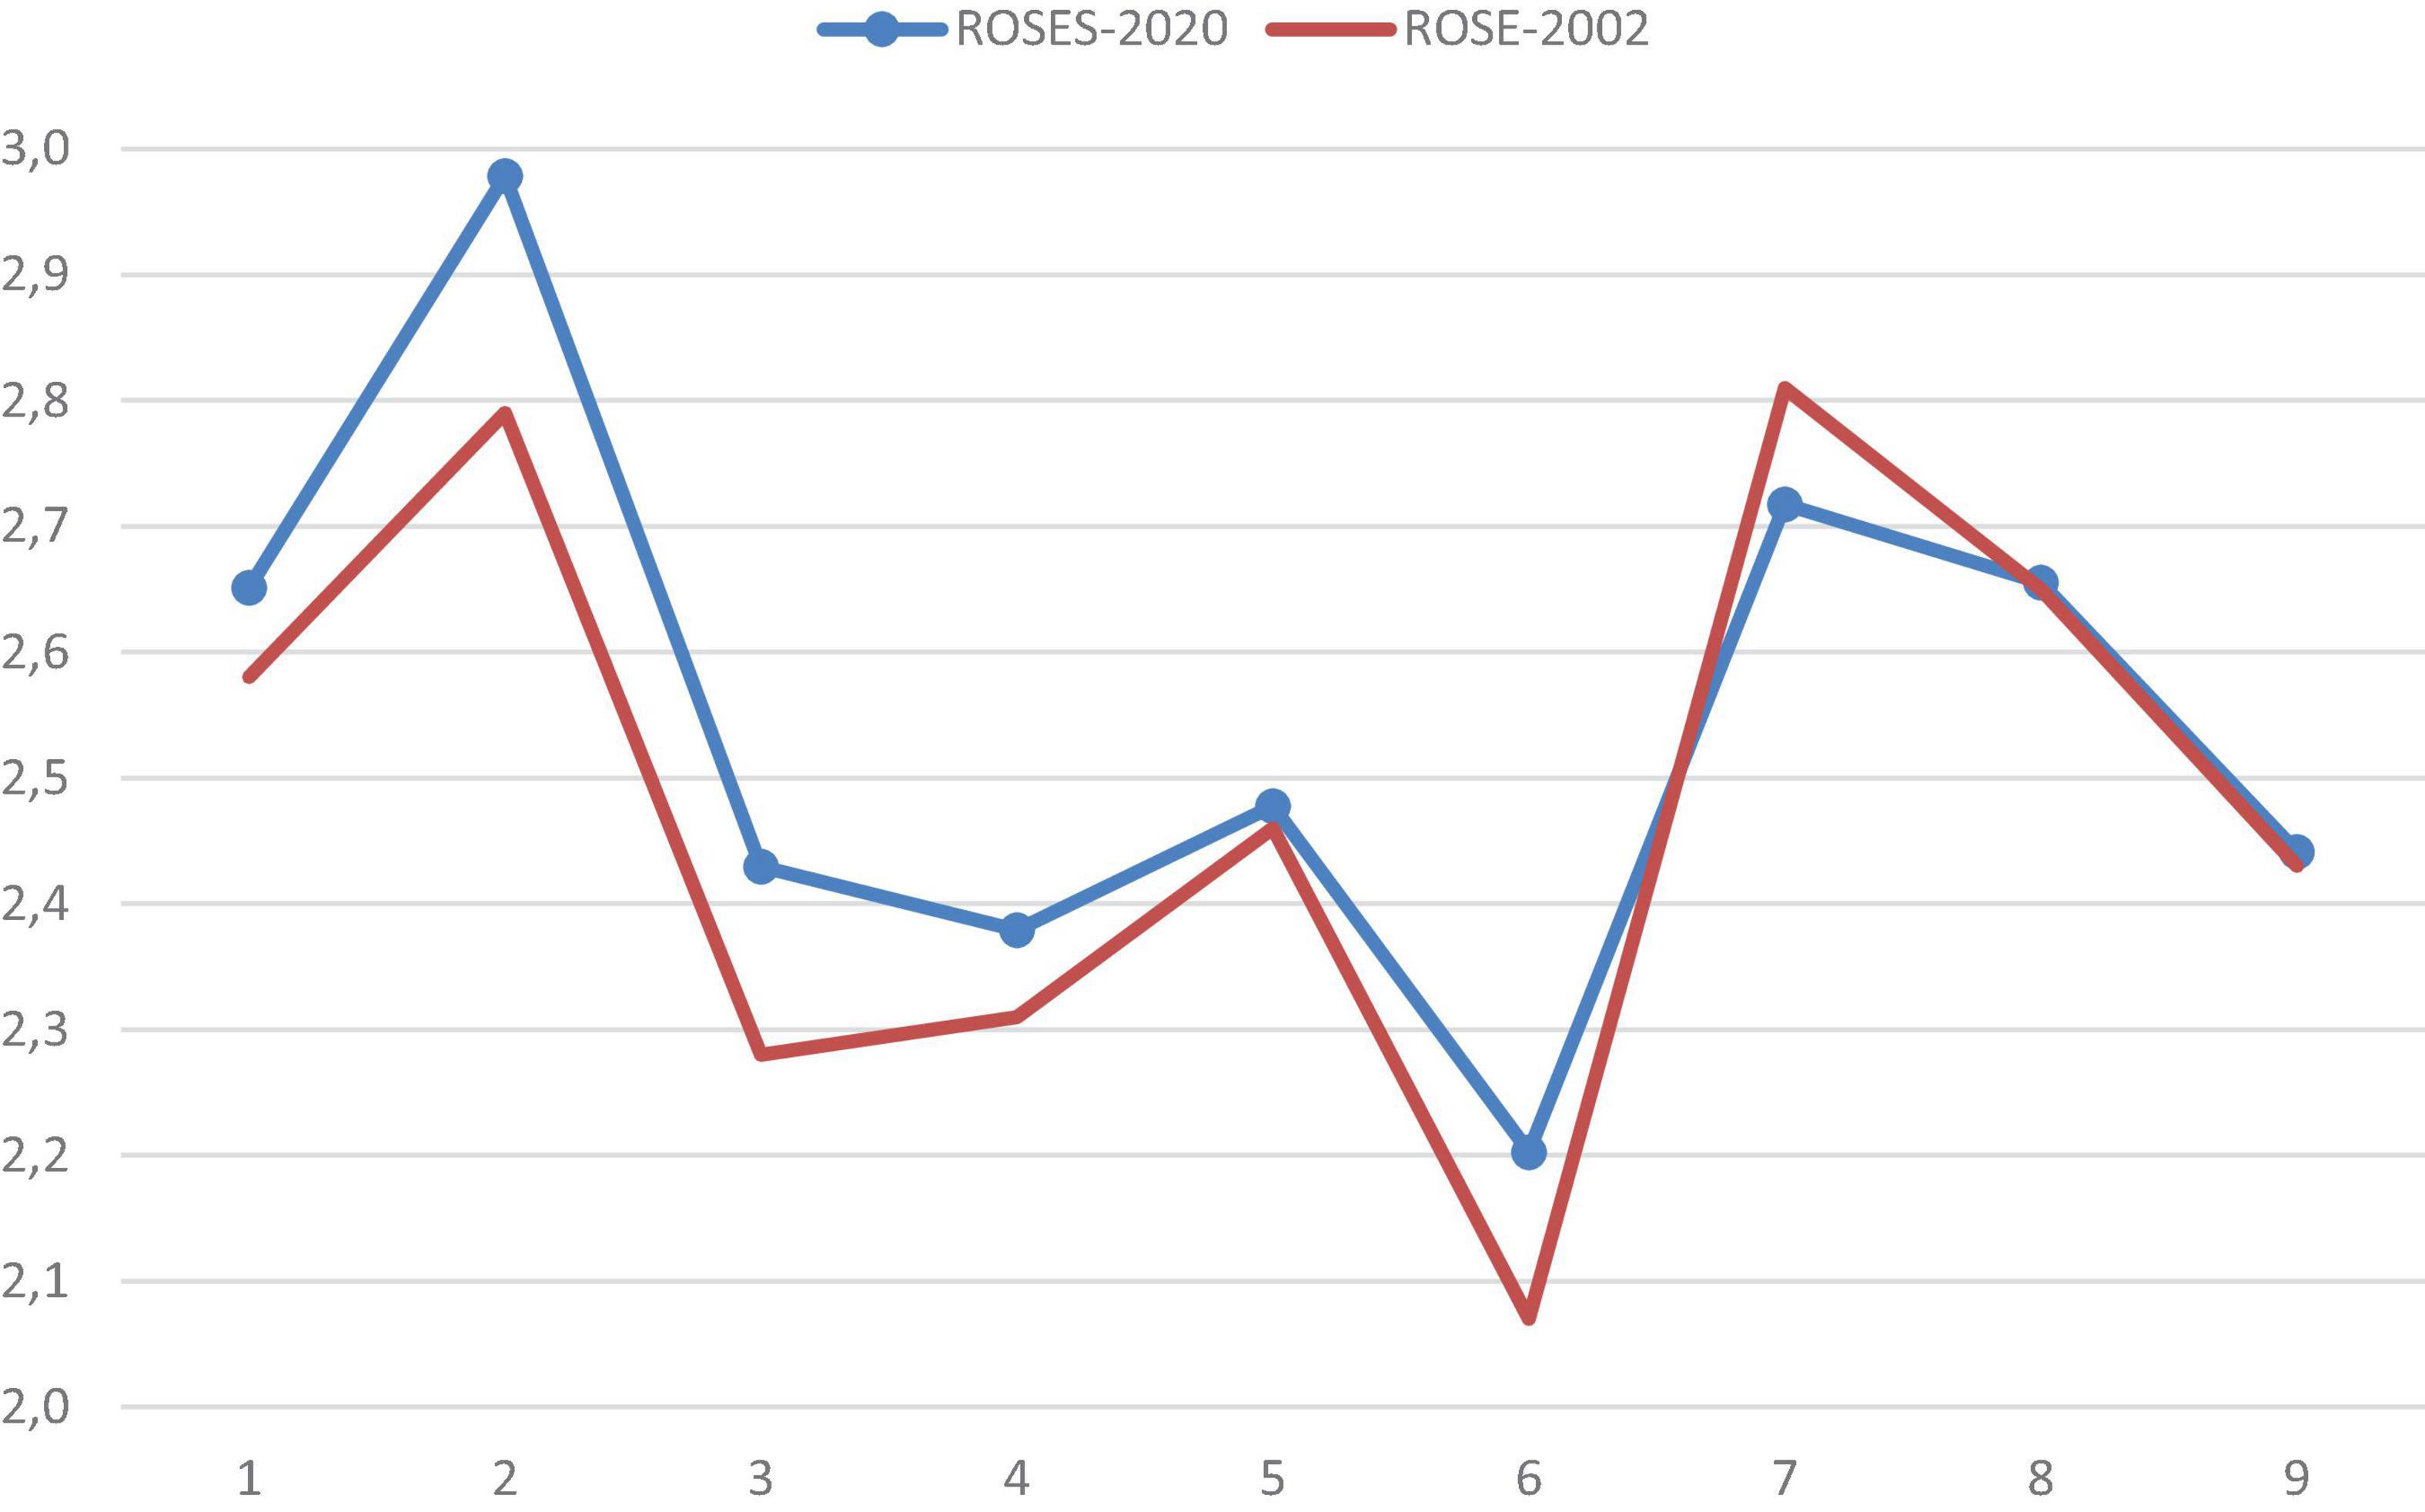
Figure 1. Profiles of the weighted averages across the nine shared items between ROSES-2020 and ROSE-2002. Source: authors’ elaboration.
In addition to the overall similarity between the two profiles, Figure 1 also shows that the average scores of ROSES-2020 tend to be higher (higher degree of agreement) than those of their ROSE-2002 counterparts, confirming a slight improvement over the ROSE-2002 results. However, no difference was relevant as the effect size was small (d < 0.20), even in the three items that presented the highest differences (Item 2 “Interesting,” Item 3 “New jobs” and Item 6 “Critical/skeptical”). The only exceptions to this improvement trend were Items 7 (“Curiosity”) and 1 (“Difficulty”), the latter owing to the reversed interpretation of scores for this negatively worded item, yet both show close-to-zero differences.
4.3 Gender differences
The comparison between boys and girls across the items of science classes yields some significant findings (Figure 2). Overall, boys’ means tend to be higher than girls’ means, as in most items (7 out of 10 items), boys score higher than girls. This trend also includes Item 1 (difficulty of science) because, when considering its negative formulation, boys disagreed more than girls about the difficulty of science; that is, boys considered science easier than girls.
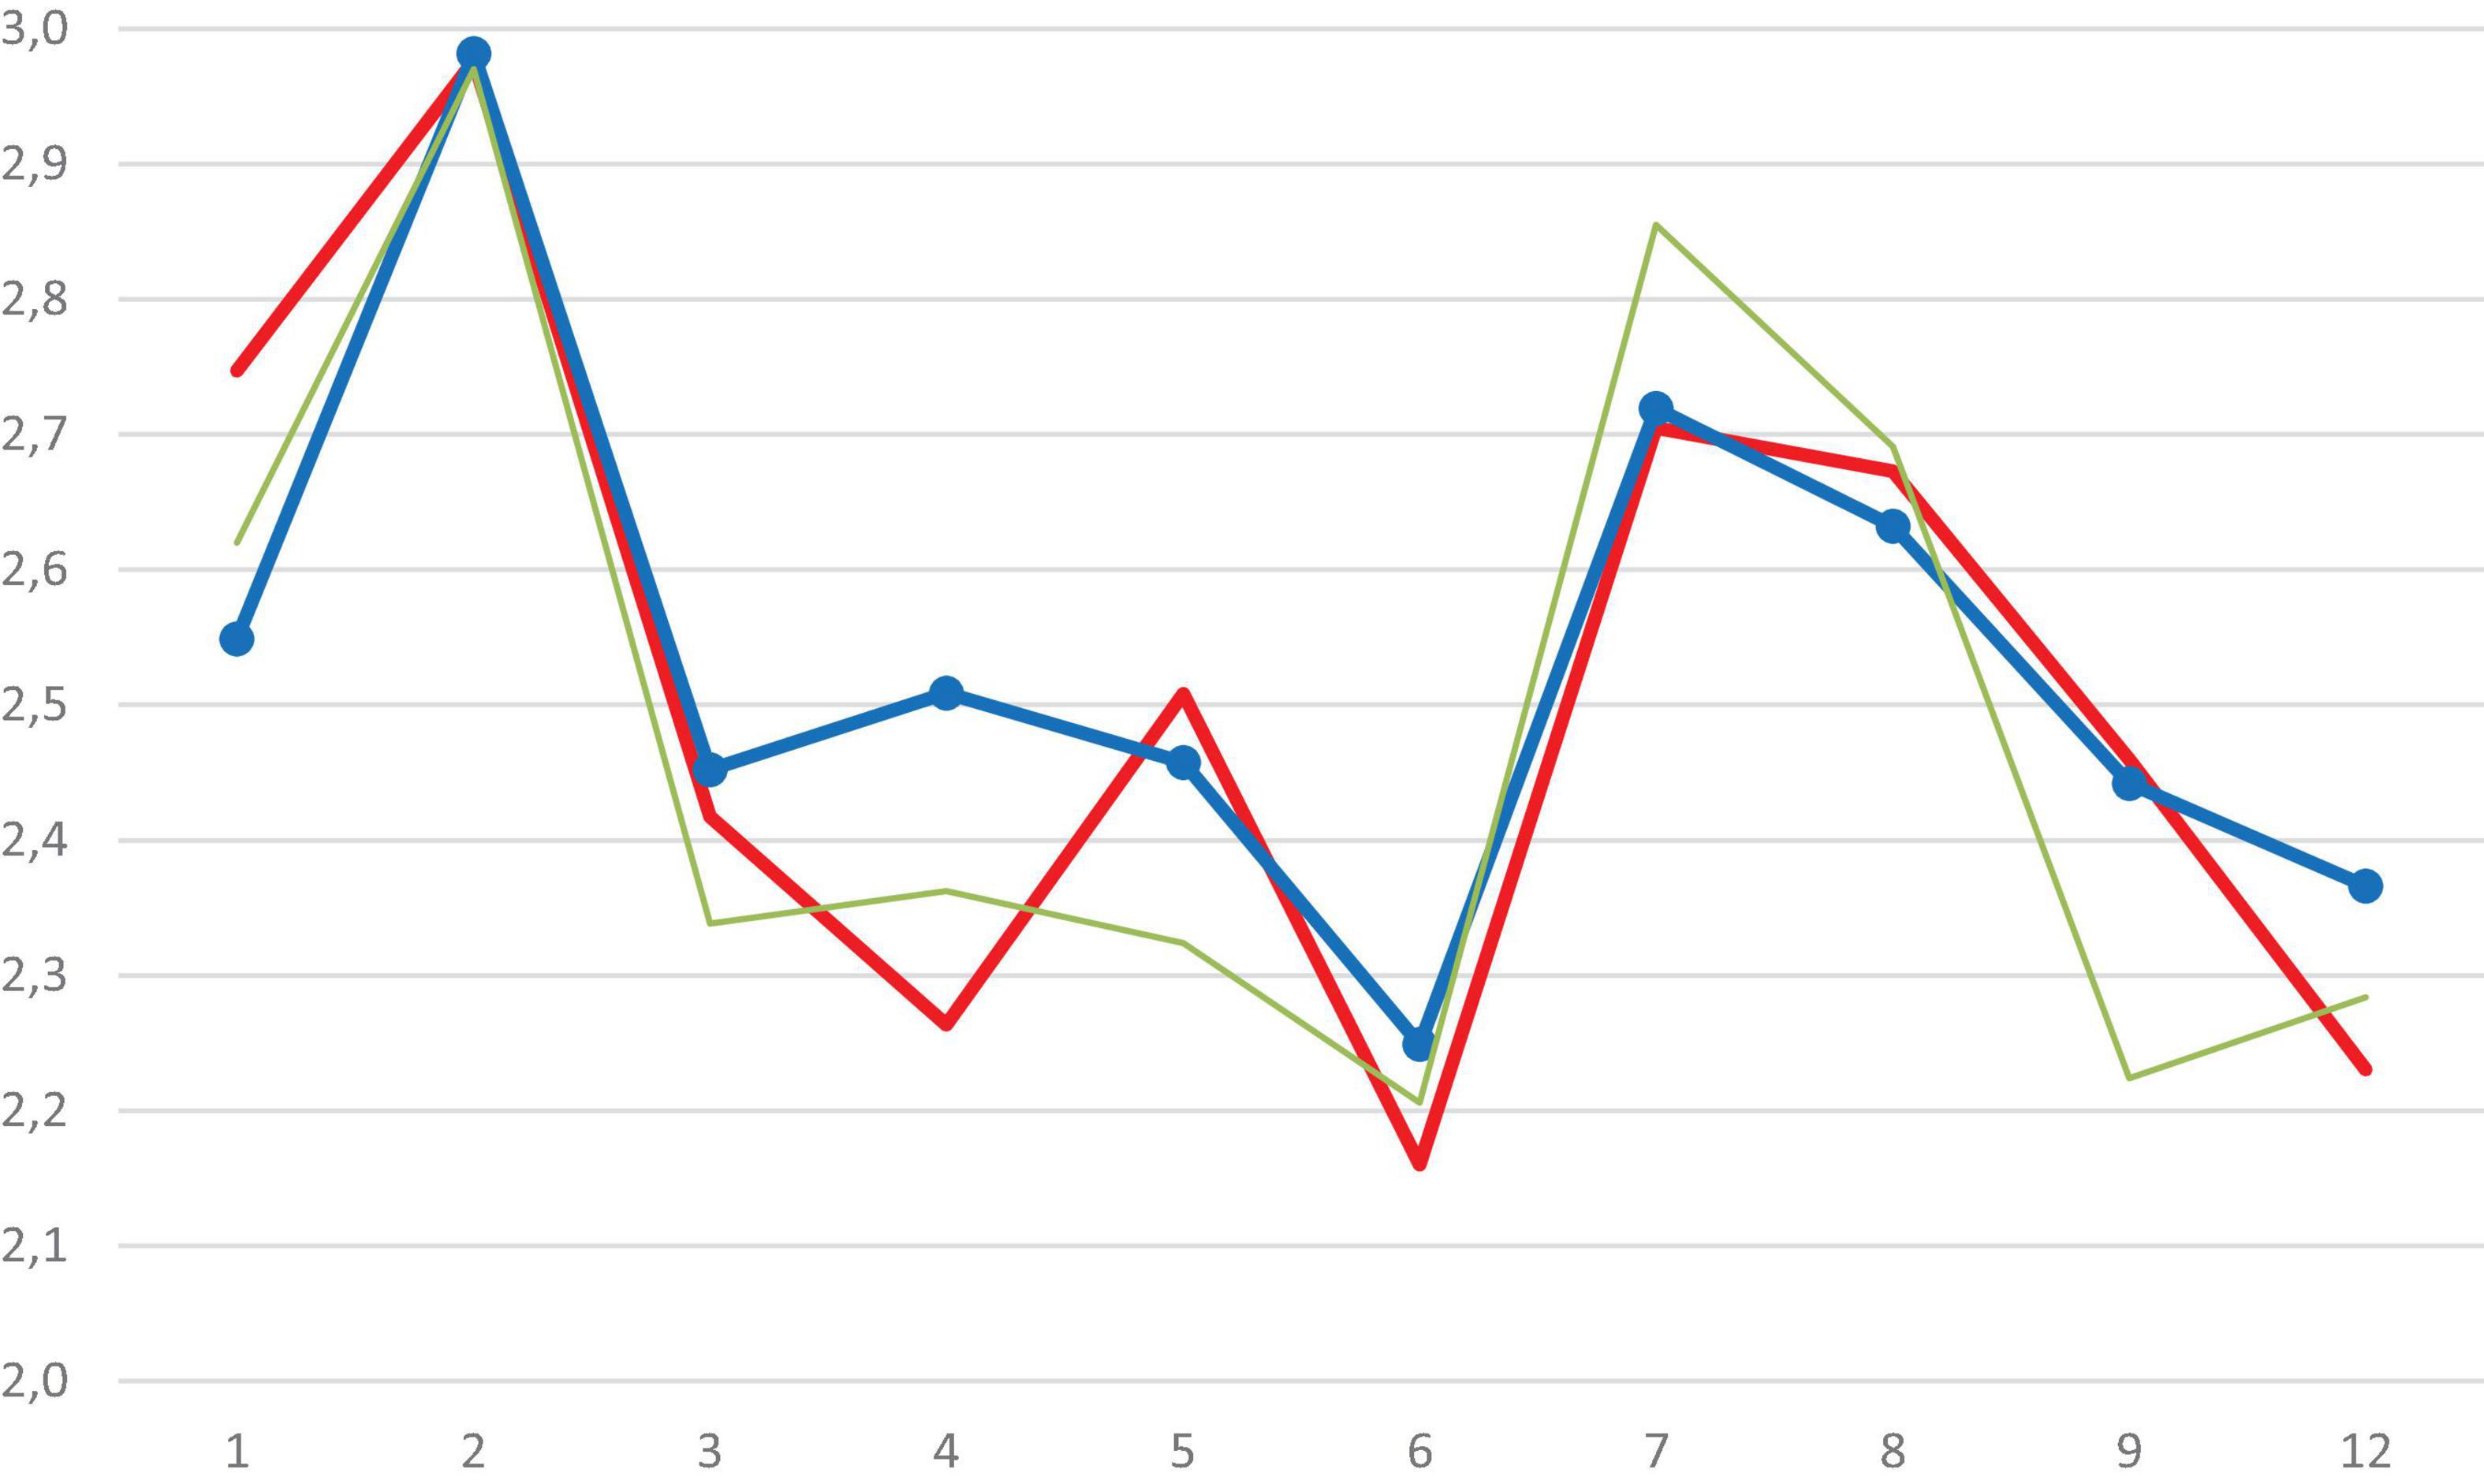
Figure 2. Weighted means of the items of the “My Science Class” scale for girls (red line), boys (blue) and the group that did not reveal their gender (green). Source: authors’ elaboration.
Most gender differences are not statistically significant, although a few items display statistically significant main gender effects, such as Item 1 (Difficulty of science, F(2, 1672) = 7.781, p = 0.000, η2 = 0.020), Item 4 (I like school science better than most other subjects, F(2, 1640) = 9.564, p = 0.000, η2 = 0.023) and Item 12 (Sustainable solutions for life, F(2, 1599) = 3.690, p = 0.025, η2 = 0.013). However, the small effect size of the differences (η2 < 0.05) suggests that these statistically significant differences cannot be considered relevant.
Finally, the three items in which the girls scored higher than the boys also showed negligible differences. These three items are: “Things I learn in science classes will be helpful in my everyday life,” “School science has shown me the importance of science for our way of life” and “School science has taught me how to take better care of my health.”
4.3.1 Gender differences in vocation variables
This study operationalizes the new STEM vocation variable as the sum of the scores of the three items that embody students’ direct behavioral intentions toward a STEM vocation (“I would like to become a scientist,” “I would like to get a job in technology” and choose between a science subject and another subject’). This section analyses the gender differences in these four variables, which represent behavioral intentions toward a STEM vocation (Table 6).
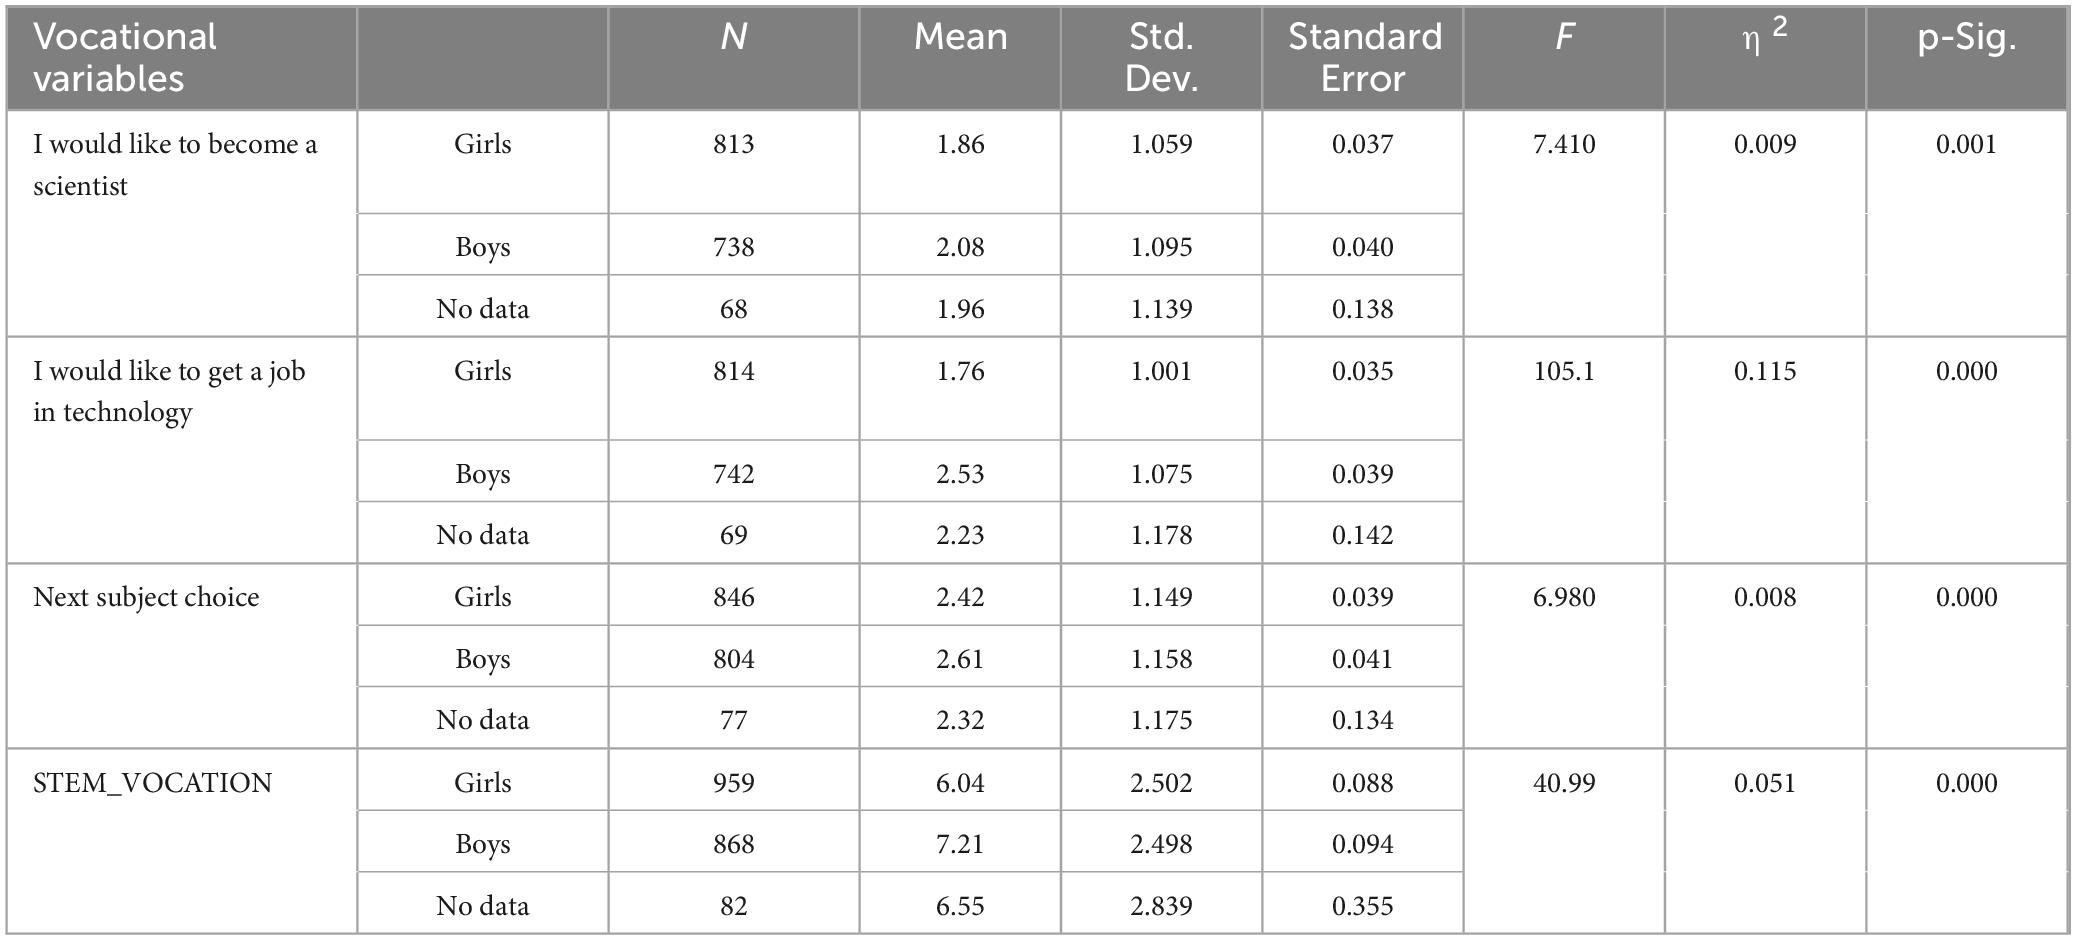
Table 6. Gender differences in the variables of behavioral intentions toward STEM and STEM vocation.
The ANOVA of the behavioral intention and STEM vocation variables among the gender groups revealed statistically significant main effects between the three gender groups (girls, boys and undeclared gender) for the three behavioral intention items and the STEM vocation variable (p < 0.001). Boys score higher than girls in all four variables,
The exploration of the differences between pairs of the three gender groups indicates that the differences between boys and girls are significant for all four variables. Furthermore, the differences between boys (p < 0.001) and the undeclared gender group (NR) are also significant for the STEM vocation variable. The choice variable includes boys with the highest mean score, the undeclared gender group with the lowest score, and girls with an intermediate score. However, the girl-boy differences are still significant (p < 0.01), albeit irrelevant (negligible effect size). The effect size of the gender differences is large only in the expectation of obtaining a technology job (η2 = 0.115), moderate in the STEM vocation variable (η2 = 0.051), and irrelevant in the case of the aspiration to be a scientist or choosing the school subject variables (η2 < 0.05).
4.4 Correlational analysis of STEM vocation
Some previous analyses of the correlations between the items of scientific vocation and all the items of the Roses-Q showed that the items of the My Science Class scale had the highest correlations with the STEM vocation items compared to the remaining Roses-Q items. This confirms the general intuition that STEM vocation may be deeply forged in science classes and supports this study’s decision to restrict the analyses to science class items.
This section empirically analyses the relationships between STEM vocation and the items of science classes as potential predictors of vocation. The mutual correlations between the science class items and their factor analysis results are presented. The relationships between the STEM vocation and the science class items are subsequently studied in depth through linear regression (Table 7).
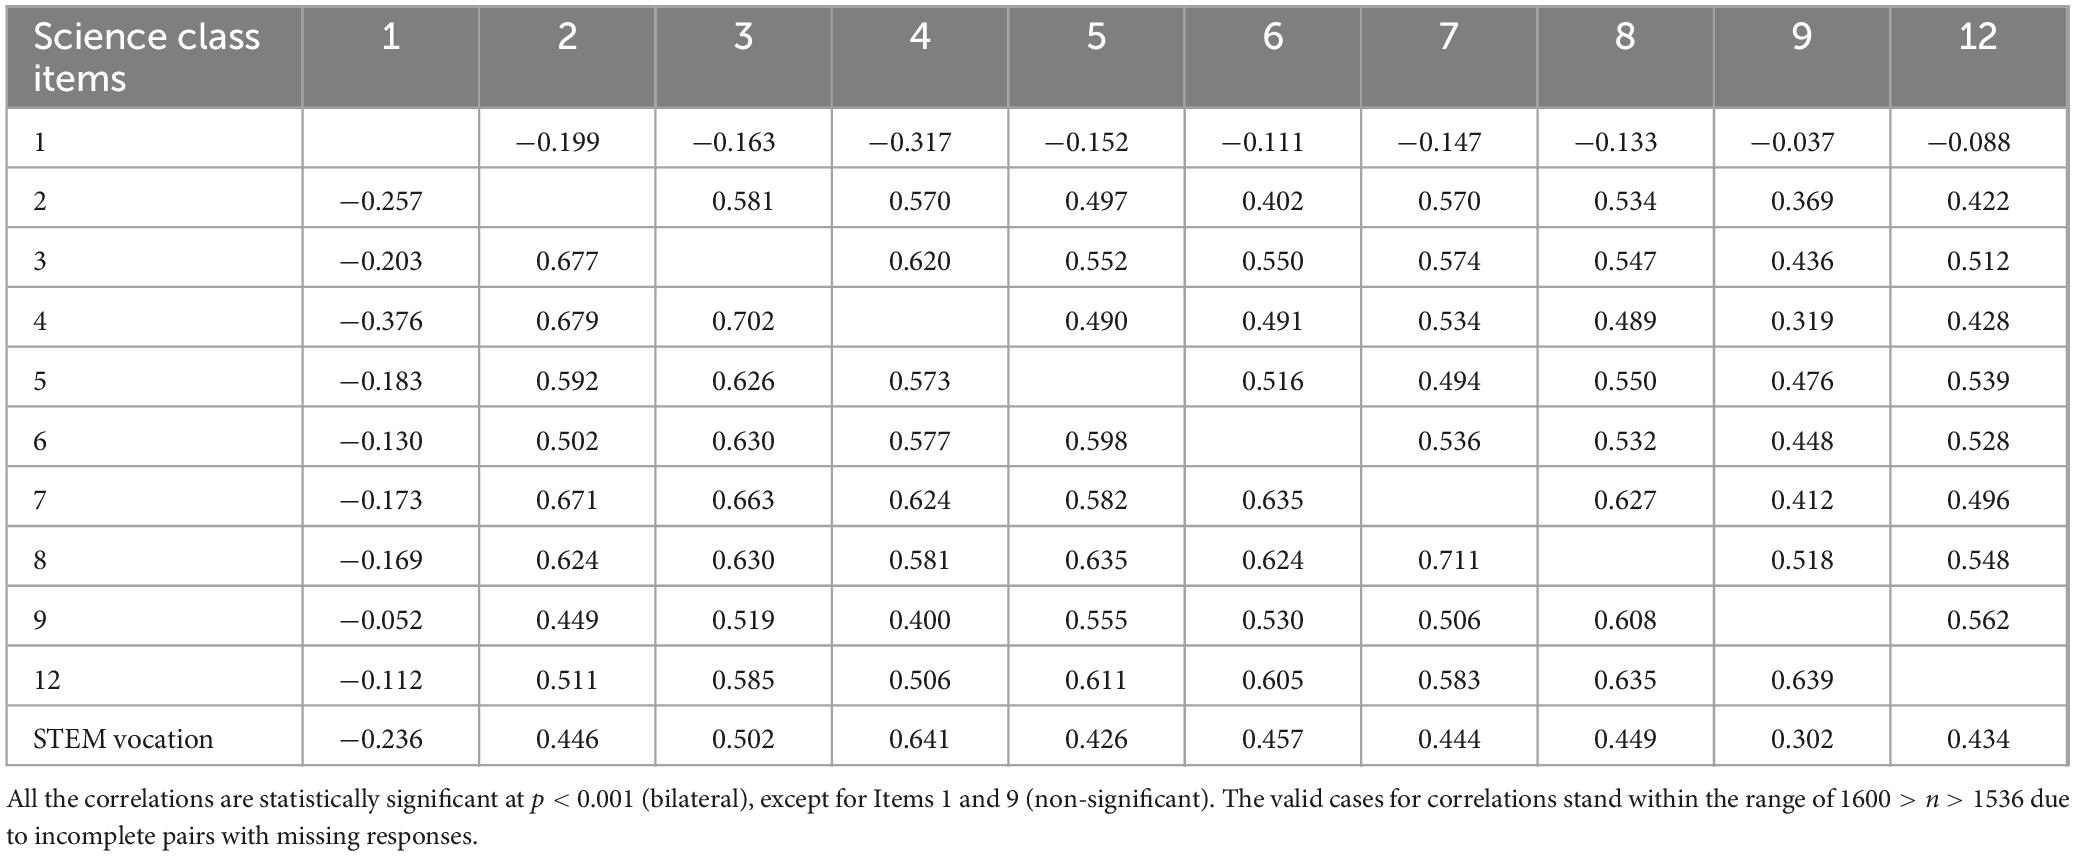
Table 7. Correlations between science class items (Pearson coefficients in the upper triangle and polychoric coefficients in the lower triangle); the last row presents Pearson’s coefficients between science class items and STEM vocation.
The most significant finding of the correlations between the science class items is that all correlations are statistically significant (p < 0.001 bilateral), except for the correlation between Items 1 (“Difficult subject”) and 9 (“Learning to take care of health”). The highest correlations (r > 0.70; e.g., between Items 3–4 and 7–8) indicate a high proportion of shared variance (r2 ≅0.50) between these items. At the other extreme, Item 1 (“Difficult subject”) displays the lowest correlations with the remaining items, which are also negative, as can be anticipated from the negative formulation of Item 1.
These overall high correlation coefficients suggest reducing the factors of the science class items. The Kaiser-Meyer-Olkin (KMO) sampling adequacy test (0.933) and Bartlett’s sphericity test (p = 0) yielded excellent scores to perform factor analysis. xFactor applied the Solomon method that splits the sample in two equivalent subsamples (Ratio Communality Index of subsample equivalence 0.997) and the sampling adequacy indices (MSA) for the ten science class items are excellent (nine MSA > 0.9) suggesting all items measure the same domain and none should be removed (MSA < 0.50).
The eigenvalues of the correlation matrix showed a dominant eigenvalue (5.83) and a second eigenvalue close to 1, which suggests a solution of one single empirical factor that explains a significant proportion of variance (0.583) (Table 8). The parallel analysis based on minimum rank factor analysis advises the number of dimensions to one and the closeness to unidimensionality assessment suggest that data can be treated as essentially unidimensional as the mean of item residual absolute loadings (0.215 < 0.30), the explained common variance (0.895 > 0.85), and the confidence interval (0.916, 0.958) of the unidimensional congruence (0.932) includes the thereshold (>0.95). As these parameters acceptably satisfy the one-dimensional criteria, the My Science Class scale can essentially be treated like a unidimensional scale.
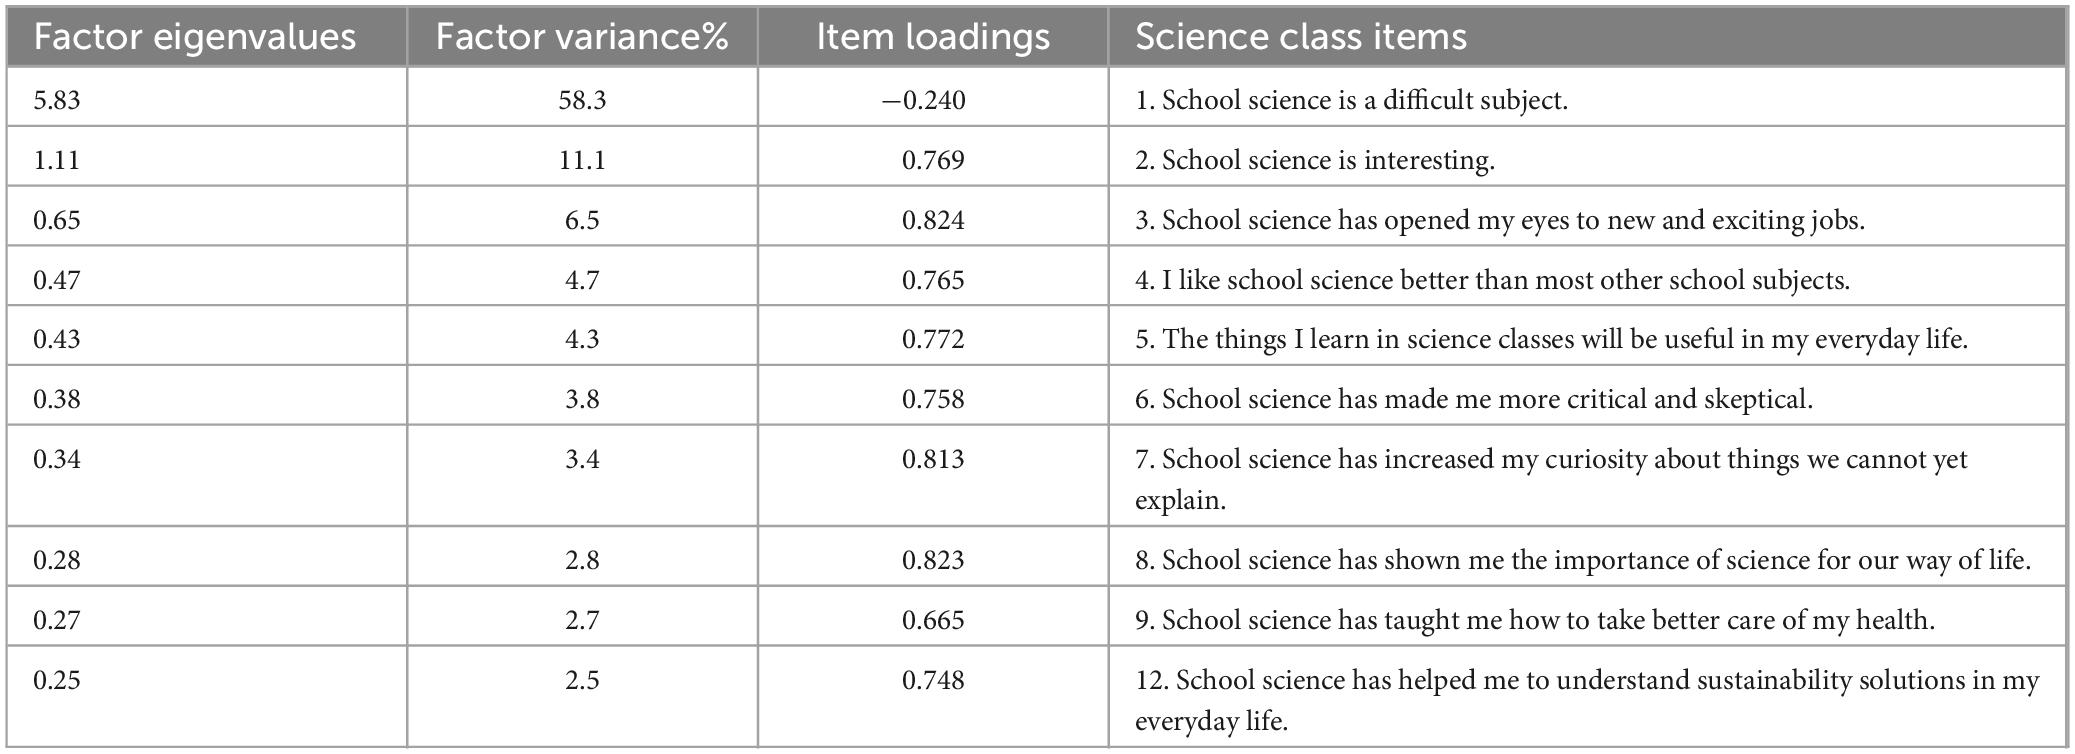
Table 8. Parameters of factor analysis of the ten science class items through RULS method of xFactor.
The robust goodness-of-fit statistics indicate that the robustness of the single-factor model is good, as the parameters that are independent of the sample size are very good and above the usual criteria (>0.95): normed fit index (NFI = 0.973), comparative fit index (CFI = 0.979), and goodness-of-fit index (GFI = 0.992). The statistics that depend on sample size are acceptable, albeit moderate, and are likely influenced by the large sample size (χ2 = 219.43, p = 0.00001), root mean square error of approximation (RMSEA = 0.089 close to threshold < 0.08), and χ2/df = 6.3 (close to threshold < 5). Some residual parameters are also considered appropriate to support the model’s goodness of fit: the weighted root mean square residual (WRMR = 0.0599; criterion < 1.0) and the root mean square residual (RMSR = 0.0583, acceptable if close to 0.026).
The ten items of the My Science Class scale reveal excellent scale consistency through different reliability indices: standardized Cronbach’s alpha (α = 0.913), McDonald’s omega (ω = 0.919) and the expected a posteriori reliability (0.933).
4.4.1 Regression analysis of STEM vocation
The correlational analysis revealed that the items of the science classes were significantly correlated, forming a one-dimensional construct. To study their relationships with scientific vocation, the correlations of the science class items with the STEM vocation variable were computed (last row of Table 7). All these correlations were significant (p < 0.001) and positive, except for Item 1 (difficult subject), which was negative because of its negative formulation and presented the lowest correlation.
The linear regression analysis discriminates the most significant items for predicting a dependent variable (in this case, the STEM vocation variable). The stepwise method eliminates those items whose contribution to the dependent variable is no longer significant (p > 0.05), and allows us to identify the most significant predictors of a scientific vocation. Table 9 shows the results of this analysis, with STEM vocation as the dependent variable, the ten items about science classes as predictors and the stepwise method to introduce the variables.
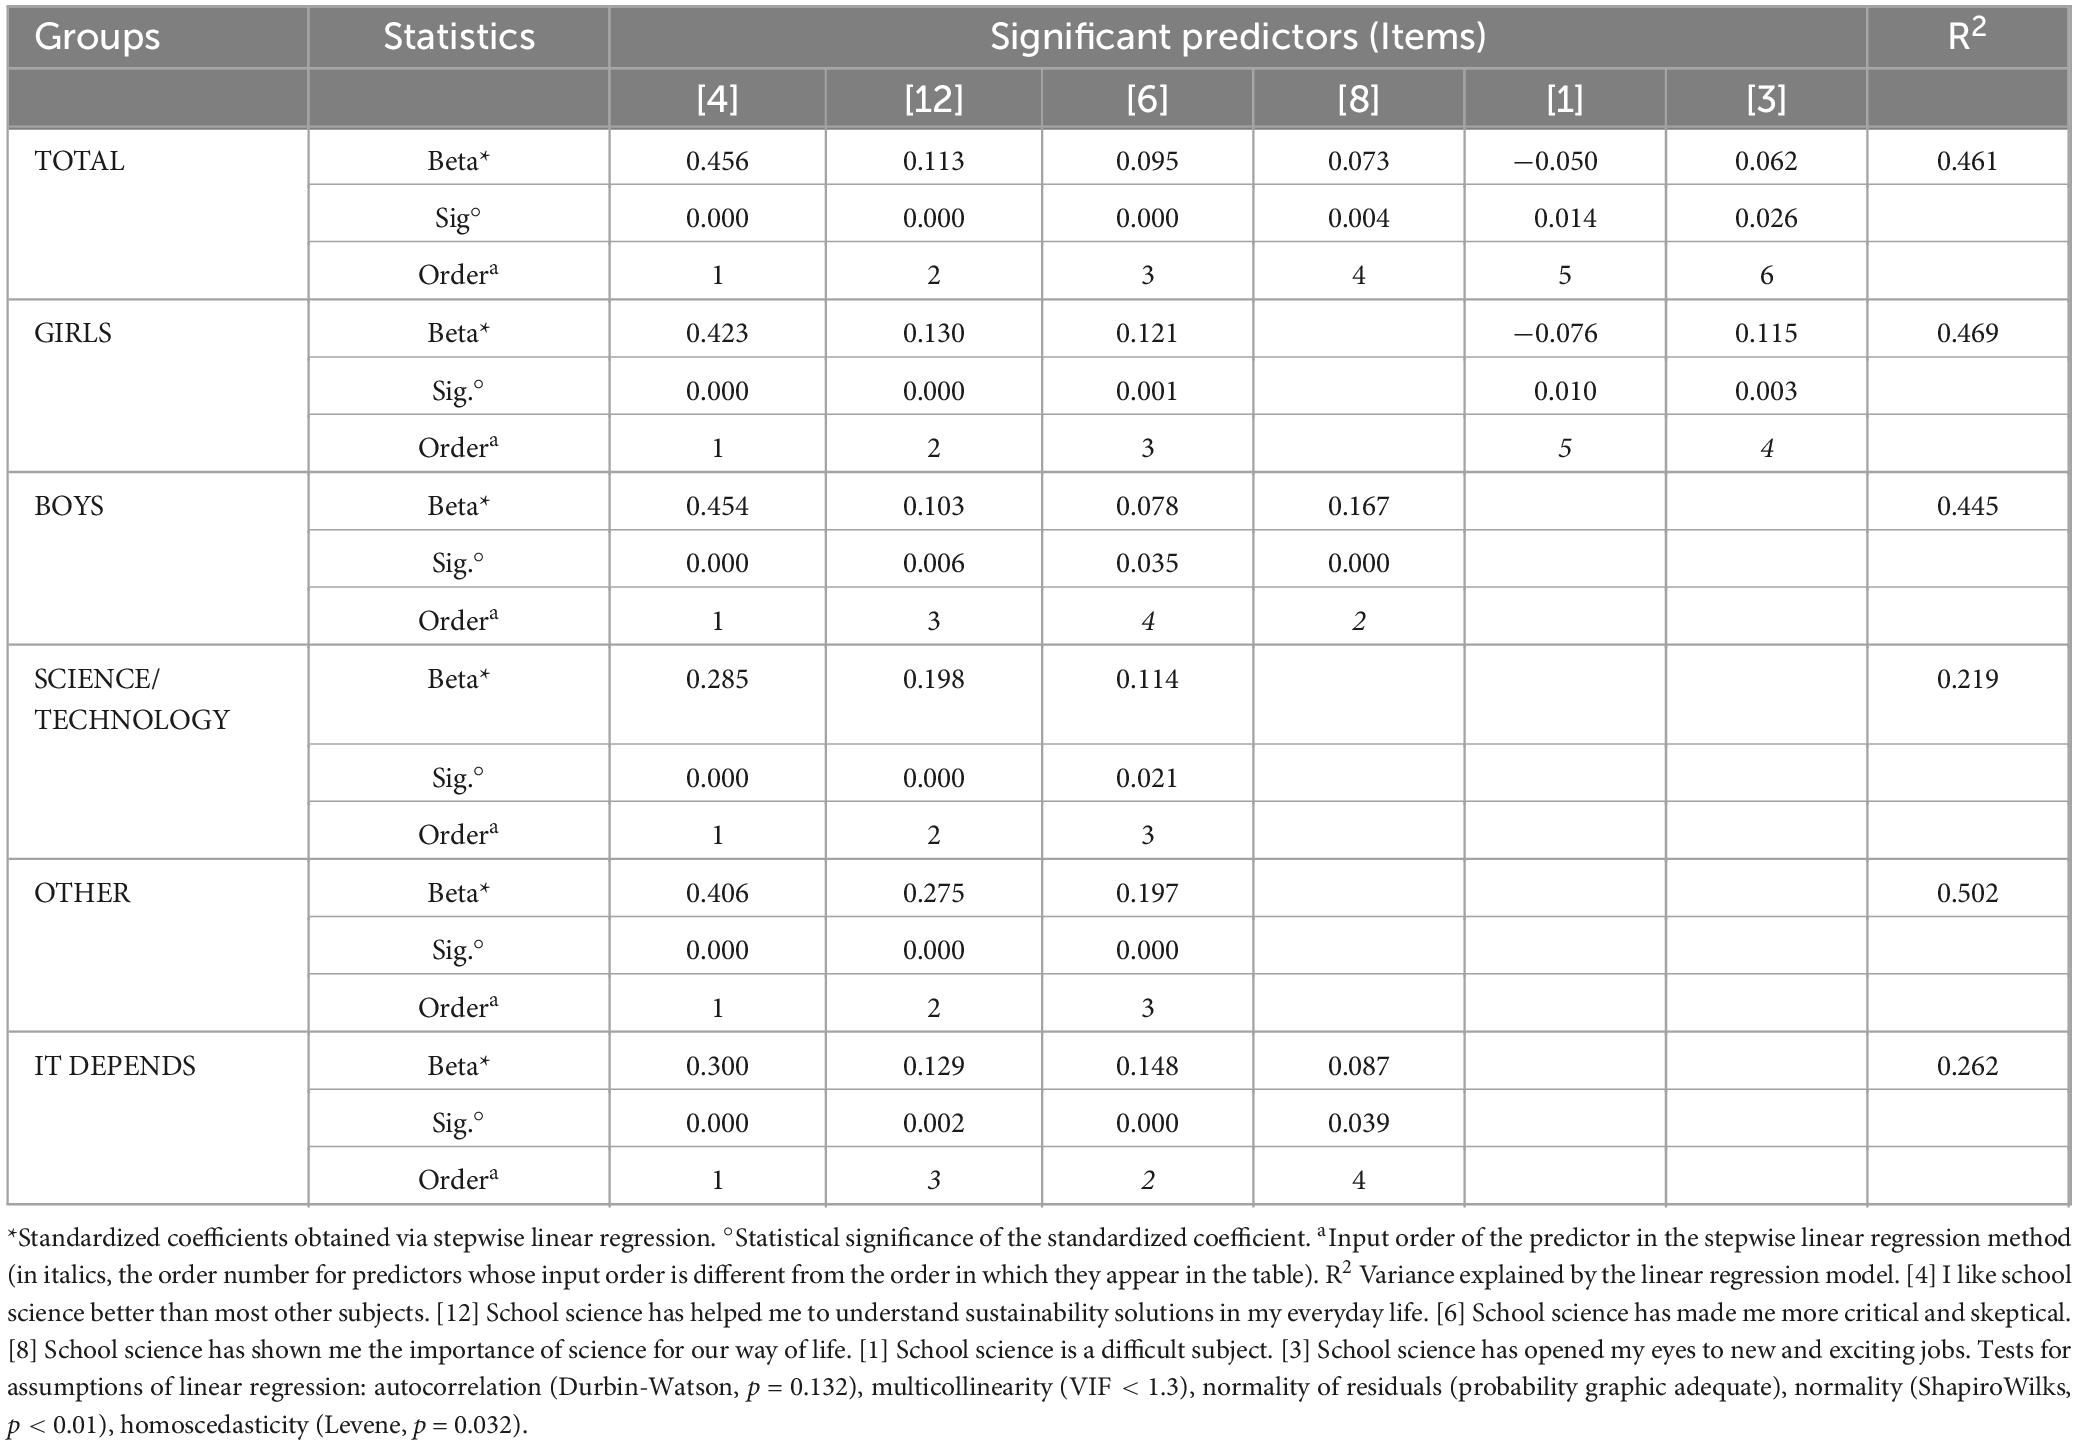
Table 9. Results of the linear regression analysis with STEM vocation as the dependent variable and the ten items about science classes as the independent variables (predictors) for the total sample, the gender groups (girls, boys) and the subject choice groups (science, other, it depends).
The results of the linear regression analysis for the total sample reveal a model with six significant predictors that explain almost half of the variance in STEM vocation (R2 = 0.461). The standardized linear regression coefficients indicate that the most important predictor is “I like school science better than most other subjects” (4), as it has a standardized regression coefficient over four times greater than the remaining predictors. This predictor accounts for only half of the explained variance in this regression model, with its 6 significant predictors. In order of decreasing significance, the remaining significant predictors, are sustainable solutions, critical and skeptical, the importance of science for our way of life, the difficulty of the science subject, and opening eyes to new and exciting jobs. The equation of the linear regression model is (non-standardized coefficients):
Additional linear regression models were similarly calculated for the groups of boys and girls, yielding two different models. The linear regression model for predicting girls’ STEM vocation is analogous to the model of the total sample, as it explains a similar amount of variance (0.469) with practically the same significant predictors, except for the “importance of science classes for our way of life,” which does not enter into the linear regression model for girls’ STEM vocation. The boys’ model is comparable to the general linear model because the total variance of the regression is very similar (R2 = 0.445), and the first four predictors are also the same ones. However, some predictors (“difficult subject” and “new and exciting jobs”) do not enter, and the order of importance slightly changes.
Comparing boys’ and girls’ linear regression models, both models share the most powerful predictors of the general model (the first three predictors: liking the subject, sustainable solutions, and critical and skeptical). However, the following predictors are different: the rest of the girls’ significant predictors were “science as a difficult subject” and “new and exciting jobs.” These predictors do not appear in the boys’ model, which includes “the importance of science for our way of life” (non-significant in the girls’ model).
Furthermore, some linear regression models were computed for the three groups of the variable of choosing between a science subject and another subject (choose science, choose another subject and choose depending on the other subject). The results indicated that the predictive models of these three groups hardly presented any differences in their structure: all three groups shared the three main predictors of the total sample (“I like school science better than most other subjects,” “sustainable solutions” and “critical and skeptical”). The only difference was the addition of a fourth significant predictor (“the importance of science for our way of life”) in the “it depends” group, which was not significant in the other two groups.
The most important difference in predicting STEM vocation among the three groups of the variable of choosing a subject is quantitative, as the magnitude of the explained common variance in STEM vocation was quite different among the groups. The “choose another subject” group reaches the maximum explained variance of its STEM vocation (R2 = 0.502), whereas the common explained variance in the other two groups (science and “it depends”) is much lower (R2 = 0.219 −0.262), amounting to half of the common variance explained in the other regression models (0.461 −0.502).
This result seems counterintuitive because it indicates that the three most powerful science class predictors of STEM vocation display the weakest predictive power in the two groups that could choose science (“science” and “it depends”). Conversely, a stronger predictive power was found in the “choose another subject” group (whose behavioral intention manifestly rejects STEM studies) because the explained variance of the STEM vocation in this non-science group is twice the explained variance in the other two groups. However, these two groups (“science” and “it depends”) display the greatest behavioral intention for STEM. Therefore, the relative weakness of the STEM vocation prediction in these groups leaves room for the influence of other significant factors (outside of the science class) on the students with greater behavioral intentions toward STEM.
5 Discussion
This study analyses the relationship between students’ perceptions of science classes and their future expectations about STEM careers and courses within the framework of a gender-equitable perspective. In this context, this study addresses the ten items that comprise the My Science Class scale, which involves educational (e.g., Blickenstaff, 2005; Kanny et al., 2014), social (e.g., Archer Ker et al., 2013) and cultural factors (e.g., Blickenstaff, 2005) related to STEM vocation.
5.1 Findings
The rates of students’ behavioral intentions toward STEM show that the intention to become a scientist is low (31.7%), the expectation of obtaining a job in technology is slightly higher (37.4%), and the choice of a science subject stands in between (35%). The profile of the STEM vocation variable shows that approximately 37% of the students obtain upper-half scores. Thus, these survey data suggest that the intention of 15-year-old Spanish students to pursue STEM studies ranges from 31%–37%. On the other hand, the statistical enrolment rate in STEM (39.78%, Table 1) of the 10th–grade CSE students of the Balearic Islands is consistent with the surveyed data presented above. Furthermore, these results concerning Spanish students’ intentions toward future STEM studies (31%–38%) are consistent with those of several previous studies (EVERIS, 2012). Still, they are much higher than those reported by the PISA 2015 for Spain (López Rupérez et al., 2019).
The analysis of the gender differences across the four STEM vocation variables reveals that the differences between boys (usually the highest-scoring group) and girls (usually the lowest-scoring group) are significant. The effect size scores are large for the expectation of obtaining a technology job (η2 = 0.115), moderate for the STEM vocation variable (η2 = 0.051), and irrelevant for the expectation of becoming a scientist or choosing a science subject (η2 < 0.05). In sum, boys obtain better STEM participation rates than girls; however, the results confirm the small science gender gap among Spanish students, as reported years ago (Vázquez and Manassero, 2007). Furthermore, the observed variability of students’ answers to items describing different forms of participation in STEM advocates avoiding a single question to assess STEM vocation because it is unreliable, as the answer depends on the kind of question.
Concerning the second research question, the best and worst aspects of school science classes have been identified. The items “school science is interesting,” “increases curiosity” and “shows the importance of science for our way of life” achieve the highest mean agreement. The lowest mean agreement appears for the item “School science has made me more critical and skeptical.” Overall, students perceive their experiences in school science positively because most items have mean scores near or above the midpoint of the agreement scale. These results mirror similar outcomes reported for the ROSE-2002, as the profiles of the average of school science class items in 2002 and 2020 are similar, although the mean scores in the ROSES-2020 tend to be slightly higher than those in the ROSE-2002 (Vázquez and Manassero, 2007). However, the differences are not relevant for any item because the effect size is small (d < 0.20).
Most gender differences in the perceptions of science classes are not statistically significant, and only a few items display statistically significant main effects in favor of boys (higher agreement), such as “science is difficult,” (reversed) “I like school science better than most other subjects” and “sustainable solutions for life.” However, the differences are not relevant because of their low effect size.
Another finding of this study is the good psychometric properties, validity and reliability of the ten-item My Science Class scale. The internal consistency is excellent (alpha = 0.913), and the goodness-of-fit statistics and the residuals support the robustness of the empirical single-factor model of the scale. However, the RMSEA and chi-square statistics that depend on sample size are acceptable albeit moderate because they may be impaired by a large sample size (Ferrando and Lorenzo-Seva, 2017). The whole scale can be considered unidimensional, as the parameters of closeness to one-dimension support this trait.
Furthermore, the main objective of this study is the correlational analysis of the items of school science classes in terms of their predictive power for students’ STEM vocation. The linear regression analysis of STEM vocation establishes a global model in which six significant predictors explain 46.1% of the STEM vocation. This large and unusual amount of common variance between the STEM vocation and school science predictors reveals important findings. The most powerful predictor is “I like school science better than most other subjects,” which accounts for half of the common variance of STEM vocation. Other significant predictors are “sustainable,” “critical and skeptical,” “importance of science for our way of life,” “difficulty of the science subject” (negative relationship) and “opens my eyes to new and exciting jobs.”
The linear regression models for predicting the STEM vocation of boys and girls are slightly different. The girls’ model is similar to the global model, as only one significant predictor of the global model is non-significant for girls (“the importance of science classes for our way of life”). However, the boys’ model excludes two predictors (“difficult subject” and “new and exciting jobs”). Thus, the prediction models of the STEM vocation of boys and girls share three main predictors, yet they differ in the role of the remaining three predictors. Again, this reveals some gender differences in STEM vocation (Archer Ker et al., 2013; Carlone and Johnson, 2007).
The linear regression models for the three groups of subject-choice variables are simpler than the previous ones and hardly show qualitative differences in the predictor structure. That is, the three groups share the three main predictors of the global model, and only the “it-depends” group adds a fourth predictor. The main difference between the three groups of subject-choice is quantitative: the explained variance of the STEM vocation of the group choosing non-scientific subjects is greater than 50%, whereas the other two groups (choosing “science” or “it depends”) represent half this percentage. The finding shows the highest predictive power of STEM vocation for the group of students who do not choose science, whereas the predictive power is much weaker for the other two groups (choosing “science” and “it depends”), which is similar to that obtained by Bøe et al. (2011) when comparing students who choose science or humanities. A tentative interpretation of this finding regarding STEM vocation suggests that school science classes are more deterrent for those who do not choose STEM than they are persuasive for those who choose STEM.
5.2 Practical implications
The results of this research have a clear implication for school science education. The significant predictors identified in this study should be integrated into the overall design of school science education to address the scarcity of STEM careers. The strongest predictor is “I like school science better than most other subjects.” The extensive literature on students’ interest in scientific topics is undoubtedly concerned with students’ appraisal of school science subjects (Dierks et al., 2014). Thus, science teaching should be preferentially oriented toward increasing students’ interest in science issues, namely, making them enjoying the classes, feel comfortable and satisfied in science classrooms, instead of rejecting science learning as dull or boring. These elements (enjoyment, comfort, and satisfaction) may contribute to maintaining students’ future career prospects (Kang et al., 2019; Palmer et al., 2017).
The second significant predictor of STEM vocation is “school science has helped to understand sustainable solutions,” and the consequences for practice also seem direct and immediate in reinforcing the sustainability content of this predictor. This implies being in tune with the proposals of the United Nations, the Decade (2005–2014) of Education for Sustainable Development (ESD) and, subsequently, the 2030 Agenda (United Nations, 2015), which prioritized 17 Sustainable Development Goals (SDGs) for the next years. Our study further demonstrates that ESD is a powerful predictor of STEM vocation and, therefore, provides an additional reason to reinforce the UN’s universal proposal within the pedagogy of school science education. However, teaching sustainable solutions means practical and functional ESD, perhaps not as focused on teaching specific and monographic topics on sustainability as on developing the ESD theme across all school science education, transversally and interdisciplinary (Bencze et al., 2020; Zoller, 2011). Certainly, some topics (e.g., energy) are closer to sustainability than others, but our proposal permeates all school science subjects (physics, chemistry or biology) with sustainable solutions (Wan and Bi, 2020).
The item “making me more critical and skeptical” is another significant predictor of a STEM vocation. The prescription here seems clear: students in science education should be trained to think critically and skeptically. Although critical thinking and skepticism are not common or comfortable aspects of school curricula or school science, research on the nature of science and the application of thinking skills (argumentation, reasoning, problem-solving, decision-making and creativity) within science classrooms has recommended making science classes more critical and skeptical for years. The main reason for encouraging this orientation arises from the very nature of science as a continuous process of confirming and falsifying hypotheses based on evidence and previous knowledge and, thus, validating better knowledge (Kampourakis and McCain, 2019; Mcintyre, 2019). This goal would require a large innovation and pedagogical change to move from a dogmatic content-based science education to a more epistemic one based on scientific and critical thinking (MacRitchie, 2018; Osborne et al., 2004; Schmaltz et al., 2017).
The predictor of “opening students’ eyes to new and exciting jobs” is rarely considered in science classes; therefore, addressing it is innovative. Specifically, school science classes should contribute to showing students the potential of STEM studies for their educational, professional and job development. This means giving students opportunities to learn about STEM-related careers and jobs, showing them the work of scientists, presenting scientists to talk about their job, attending scientific public events, considering the value of science as a job, etc., (Blenkinsop et al., 2006). Furthermore, special attention should be given to female and minority scientists to address the mismatch between women’s or misrepresented groups’ identities and the image of STEM and professionals (DeWitt et al., 2013; Osborne and Dillon, 2008).
The “difficulty of school science” is another significant and negative predictor (the greater the perceived difficulty, the more rejection and fewer vocations). The difficulty of science is externally reflected in school grades that are more demanding in some subjects (e.g., Physics or Chemistry), which, consequently, are not much chosen by students (Kjćrnsli and Lie, 2011; Lyons and Quinn, 2010). Overwhelmingly, difficulty lowers the perception of competence and self-efficacy in school tasks. According to the self-determination theory (Ryan and Deci, 2000), difficulty demotivates students because it deteriorates their perception of competence and disengages them from science. Thus, difficulty contradicts the original aim of implementing school science as a proactive and engaging school subject (e.g., engaging in learning and attracting more scientists). In fact, it contributes to disengaging many students from science. The construct scientific literacy for all has contributed to making science simple and valuable for learners, and has been deployed in many investigations, adopted by curriculum designers in many countries and taken up by the PISA (OECD, 2019) and TIMSS (Mullis et al., 2021). However, innovations to foster literacy and lower differences should persist (National Academies of Sciences, Engineering, and Medicine, 2016).
5.3 Conclusion
Certainly, STEM vocations are a worldwide concern, and all the efforts carried out through many non-formal and informal initiatives developed by various organizations (research centers, companies, foundations, institutions, educational authorities, universities, etc.) to cover the multifactor origin of STEM vocation are welcome (e.g., DeWitt et al., 2013). These initiatives usually assume that students’ participation in STEM-embedded activities will positively affect their achievement, attitudes and confidence in STEM careers and courses, but not much confirmatory evidence has been gathered (Mujtaba et al., 2018). In summary, the main finding of this study confirms the importance of school science education for STEM vocations. which invites to recentre the efforts to foster the quality of school science education. The main finding of this study is the sound predictive power (close to 50%) of six school science factors for STEM vocation. As students spend most of their time in school, this confirms the importance of school science education for STEM vocations. Schools should be reframed as powerful STEM vocation promoters and recentre their efforts to improve the quality of school science education, aligning with the significant predictors identified here.
Other findings of this study indicate some significant gender differences across STEM vocations and their predictors. The insufficient attention to diversity in school science classrooms and curricula denies many students the opportunity to learn science, which, in turn, has harmful consequences for the economy and society. The challenge is to adopt an inclusive pedagogy and language and overcome stereotypes and bias in school science classrooms, making STEM relevant and significant for the future of all students (Makarova et al., 2019; Penner, 2015; World Economic Forum, 2017).
The implications of the overall findings are twofold: for STEM-related activities and STEM vocational research. The former implies that school science education should promote the significant factors and address the professional aspects of science as unavoidable commitments for science teachers to increase the relevance of science education for all students within their science classes. Likewise, the same recommendation is also transferable to a myriad of non-formal STEM programs (science centers, museums, zoos, science organizations, etc.), which aim to improve the relevance of science education but lack any evaluation of their impact (Mujtaba et al., 2018). The significant predictors identified here may inspire program and assessment criteria designs to improve program’s efficacy in promoting STEM vocations and STEM vocational research.
Overall, the findings presented here indicate specific factors that may significantly influence youngsters’ STEM aspirations. Thus, both formal school science education and non-formal programs should be planned accordingly to enhance their relevance and impact and to assess their effectiveness in students’ STEM participation and vocations.
5.4 Limitations and future directions
The main limitation of this study is the format of the ROSES-Q instrument used to assess the ten items of school science classes and the students’ STEM intentions and STEM vocation, as well as the Likert response format. A different list of scientific features and other response formats could undoubtedly expand and verify these results and even improve them. It is also worth noting that the STEM vocation variable meets the linear regression assumptions, except for normality, although the analysis of its histogram indicates that this is due just to a single value in the variable range that deviates from the profile of the normal curve, so a review of the scores could renormalize this limitation.
The future directions for research on STEM are a consequence of the significant factors found here and the high amount of common variance with STEM vocation, which establish qualitative and quantitative benchmarks for future research. The quantitative nature of the significant factors may help researchers plan new guidelines and directions for future research, for example, to clarify the authentic efficacy of the many factors influencing STEM vocations suggested in the literature (Cheryan et al., 2017; Holmegaard et al., 2014; Kanny et al., 2014; Makarova et al., 2019; Moote et al., 2020, 2021; Penner, 2015).
Data availability statement
The raw data supporting the conclusions of this article will be made available by the authors, without undue reservation.
Ethics statement
The studies involving humans were approved by the Ethics Committee of the Ministry of Science and Innovation of Spain (MCIN). The studies were conducted in accordance with the local legislation and institutional requirements. The ethics committee/institutional review board waived the requirement of written informed consent for participation from the participants or the participants’ legal guardians/next of kin in accordance with the local legislation and institutional requirements.
Author contributions
M-AM-M: Conceptualization, Data curation, Formal Analysis, Funding acquisition, Investigation, Methodology, Project administration, Resources, Software, Supervision, Validation, Visualization, Writing – original draft, Writing – review and editing. ÁV-A: Conceptualization, Data curation, Formal Analysis, Investigation, Methodology, Software, Supervision, Validation, Visualization, Writing – original draft, Writing – review and editing.
Funding
The author(s) declare that financial support was received for the research and/or publication of this article. Grant PID2020-114191RB-I00 was funded by MICIU/AEI/10.13039/501100011033.
Conflict of interest
The authors declare that the research was conducted in the absence of any commercial or financial relationships that could be construed as a potential conflict of interest.
Generative AI statement
The authors declare that no Generative AI was used in the creation of this manuscript.
Publisher’s note
All claims expressed in this article are solely those of the authors and do not necessarily represent those of their affiliated organizations, or those of the publisher, the editors and the reviewers. Any product that may be evaluated in this article, or claim that may be made by its manufacturer, is not guaranteed or endorsed by the publisher.
Footnotes
References
Archer Ker, L., DeWitt, J., Osborne, J. F., Dillon, J. S., Wong, B., and Willis, B. (2013). ASPIRES report: young people’s science and career aspirations, age 10 –14. London: King’s College London.
Archer, L., Dawson, E., DeWitt, J., Seakins, A., and Wong, B. (2015). ‘Science capital’: A conceptual, methodological, and empirical argument for extending Bourdieusian notions of capital beyond the arts. J. Res Sci. Teach. 52, 922–948. doi: 10.1002/tea.21227
Archer, L., DeWitt, J., Osborne, J., Dillon, J., Willis, B., and Wong, B. (2010). ‘Doing’ science versus ‘being’ a scientist: Examining 10/11-year-old schoolchildren’s constructions of science through the lens of identity. Sci. Educ. 94, 617–639. doi: 10.1002/sce.20399
Aschim, E. L., Bjar, H., and Aae, R. (2021). “Changes in norwegian students’ interest in science, technology and environment,” in proceedings of the IOSTE conference 2020, (Daegu).
Bencze, L., Pouliot, C., Pedretti, E., Simonneaux, L., Simonneaux, J., and Zeidler, D. (2020). SAQ, SSI and STSE education: Defending and extending ‘science-in-context.’. Cult. Stud. Sci. Educ. 15, 825–851. doi: 10.1007/s11422-019-09962-7
Blenkinsop, S., Mccrone, T., Wade, P., and Morris, M. (2006). How Do Young People Make Choices at 14 and 16?. Heslington, NY: National Foundation for Educational Research (NFER).
Blickenstaff, J. C. (2005). Women and science careers: Leaky pipeline or gender filter? Gender Educ. 17, 369–386. doi: 10.1080/09540250500145072
Bøe, M. V., Henriksen, E. K., Lyons, T., and Schreiner, C. (2011). Participation in science and technology: Young people’s achievement-related choices in late-modern societies. Stud. Sci. Educ. 47, 37–72. doi: 10.1080/03057267.2011.549621
Bondie, R. S., Dahnke, C., and Zusho, A. (2019). How does changing ‘one-size-fits-all’ to differentiated instruction affect teaching? Rev. Res. Educ. 43, 336–362. doi: 10.3102/0091732X18821130
Carlone, H. B., and Johnson, A. (2007). Understanding the science experiences of successful women of color: Science identity as an analytic lens. J. Res. Sci. Teach. 44, 1187–1218. doi: 10.1002/TEA.20237
Caspi, A., Gorsky, P., Nitzani-Hendel, R., Zacharia, Z. C., Rosenfeld, S., Berman, S., et al. (2020). Children’s perceptions of the factors that led to their enrolment in advanced, middle-school science programmes. Int. J. Sci. Educ. 42, 1915–1939. doi: 10.1080/09500693.2020.1802083
Chaurasia, M. A., and Juang, C.-F. (2022). Emerging IT/ICT and AI technologies affecting society. Berlin: Springer.
Cheryan, S., Ziegler, S. A., Montoya, A. K., and Jiang, L. (2017). Why are some STEM fields more gender-balanced than others? Psychol. Bull. 143, 1–35. doi: 10.1037/bul0000052
Danielsson, A., Avraamidou, L., and Gonsalves, A. (2023). “Gender matters,” in Handbook of research on science education, eds N. G. Lederman, D. L. Zeidler, and J. S. Lederman (London: Routledge), 263–290.
DeWitt, J., Archer, L., and Osborne, J. (2013). Nerdy, brainy and normal: Children’s and parents’ constructions of those who are highly engaged with science. Res. Sci. Educ. 43, 1455–1476. doi: 10.1007/s11165-012-9315-0
Dierks, P. O., Höffler, T. N., and Parchmann, I. (2014). Profiling interest of students in science: Learning in school and beyond. Res. Sci. Technol. Educ. 32, 37–41. doi: 10.1080/02635143.2014.895712
Eccles, J. S. (2014). Gendered socialization of STEM interests in the family. Int. J. Gender Sci. Technol. 7, 116–132.
European Commission (2004). Europe needs more scientists. Luxembourg: Office for Official Publications of European Communities.
EVERIS (2012). Factores influyentes en la elección de estudios científicos, tecnológicos y matemáticos. Visión de los estudiantes de °y °de ESO y Bachillerato [Influencing factors in the choice of scientific, technological and mathematical studies. Vision of the students in the 3rd and 4th years of ESO and Baccalaureate. Bloomington, IN: Author.
Fensham, P. J. (2009). Real world contexts in PISA science: Implications for context-based science education. J. Res. Sci. Teach. 46, 884–896. doi: 10.1002/TEA.20334
Ferrando, P. J., and Lorenzo-Seva, U. (2017). Program FACTOR at 10: Origins, development and future directions. Psicothema 29, 236–240. doi: 10.7334/psicothema2016.304
Ferrando, P. J., and Lorenzo-Seva, U. (2018). Assessing the quality and appropriateness of factor solutions and factor score estimates in exploratory item factor analysis. Educ. Psychol. Meas. 78, 762–780. doi: 10.1177/0013164417719308
Fundación Española para la Ciencia y la Tecnología (FECYT). (2023) Encuesta de percepción social de la ciencia y la tecnología en España 2022 [Survey of social perception of science and technology in Spain 2022]. Available online at: https://www.fecyt.es/es/noticia/encuestas-de-percepcion-social-de-la-ciencia-y-la-tecnologia-en-espana (accessed February 8, 2023).
Gaweł, A., and Krstić, M. (2021). Gender gaps in entrepreneurship and education levels from the perspective of clusters of European countries. J. Developmental Entrepreneurship 26, 2150024. doi: 10.1142/S1084946721500242
Holland, J. L. (1997). Making vocational choices: a theory of vocational personalities and work environments, 3rd Edn. Lutz, FL: Psychological Assessment Resources.
Holmegaard, H. T., Madsen, L. M., and Ulriksen, L. (2014). To choose or not to choose science: Constructions of desirable identities among young people considering a STEM higher education programme. Int. J. Sci. Educ. 36, 186–215. doi: 10.1080/09500693.2012.749362
Jenkins, E. W., and Nelson, N. W. (2010). Important but not for me: Students’ attitudes towards secondary school science in England. Res. Sci. Technol. Educ. 23, 41–57. doi: 10.1080/02635140500068435
Jidesjö, A., Oskarsson, M., and Westman, A. (2021). “Trends in student’s interest in science and technology: Developments and results from the relevance of science education second (Roses) study,” in Proceedings of the IOSTE Conference 2020, (Daegu).
Jidesjö, A., Oskarsson, M., and Westman, A.-K. (2020). ROSES handbook: introduction, guidelines and underlying ideas. Utbildningsvetenskapliga studier 2020:1. Östersund: Mid Sweden University.
Kampourakis, K., and McCain, K. (2019). Uncertainty: how it makes science advance. Oxford: Oxford University Press.
Kang, J., Hense, J., Scheersoi, A., and Keinonen, T. (2019). Gender study on the relationships between science interest and future career perspectives. Int. J. Sci. Educ. 41, 80–101. doi: 10.1080/09500693.2018.1534021
Kanny, M. A., Sax, L. J., and Riggers-Piehl, T. A. (2014). Investigating forty years of STEM research: How explanations for the gender gap have evolved over time. J. Women Minorities Sci. Eng. 20, 127–148. doi: 10.1615/jwomenminorscieneng.2014007246
Kjćrnsli, M., and Lie, S. (2011). Students ’ preference for science careers: International comparisons based on PISA 2006. August. Milton Park: Taylor and Francis, 37–41. doi: 10.1080/09500693.2011.518642
López Rupérez, F., García García, I., and Expósito Casas, E. (2019). Performance in science, epistemic conceptions, and STEM vocations in Spain’s autonomous communities: Evidence from PISA 2015, improvement policies, and practices. Rev. Española Pedagogía 77, 5–27. doi: 10.22550/REP77-1-2019-09
Lorenzo-Seva, U., and Ferrando, P. J. (2019). Robust promin: A method for diagonally weighted factor rotation. LIBERABIT Rev. Peruana Psicol. 25, 99–106. doi: 10.24265/liberabit.2019.v25n1.08
Lyons, T., and Quinn, F. (2010). Choosing science. Understanding the declines in senior high school science enrolments. Biddeford: University of New England.
Lyons, T., Quinn, F., Rizk, N., Anderson, N., Hubber, P., Kenny, J., et al. (2012). Starting out in STEM. Biddeford: SiMERR National Research Centre, University of New England.
MacRitchie, F. (2018). The need for critical thinking and the scientific method. Boca Raton, FL: CRC Press, doi: 10.1201/9781351255875
Makarova, E., Aeschlimann, B., and Herzog, W. (2019). The gender gap in STEM fields: The impact of the gender stereotype of math and science on secondary students’ career aspirations. Front. Educ. 4:60. doi: 10.3389/FEDUC.2019.00060/BIBTEX
Mcintyre, L. (2019). The scientific attitude. Defending science from denial, fraud, and pseudoscience. Cambridge, MA: The MIT Press.
Ministry of Education, (2023). Statistics of education. Available online at: https://www.educacionyfp.gob.es/servicios-al-ciudadano/estadisticas.html (accessed February 2, 2025).
Ministry of Universities (2023). Datos y cifras del sistema universitario español. [Data and figures of the Spanish university system]. Madrid: Secretaría General Técnica del Ministerio de Universidades. Spanish.
Moote, J., Archer, L., DeWitt, J., and MacLeod, E. (2020). Science capital or STEM capital? Exploring relationships between science capital and technology, engineering, and maths aspirations and attitudes among young people aged 17/18. J. Res. Sci. Teach. 57, 228–1249. doi: 10.1002/tea.21628
Moote, J., Archer, L., DeWitt, J., and MacLeod, E. (2021). Who has high science capital? An exploration of emerging patterns of science capital among students aged 17/18 in England. Res. Papers Educ. 36, 402–422. doi: 10.1080/02671522.2019.1678062
Mujtaba, T., Lawrence, M., Oliver, M., and Reiss, M. J. (2018). Learning and engagement through natural history museums*. Stud. Sci. Educ. 54, 41–67. doi: 10.1080/03057267.2018.1442820
Mullis, I. V. S., Martin, M. O., and von Davier, M. (2021). TIMSS 2023 assessment framework. Massachusetts: Boston College.
National Academies of Sciences, Engineering, and Medicine. (2016). Science literacy: concepts, contexts, and consequences. Washington, DC: The National Academies Press, doi: 10.17226/23595
OECD (2016a). PISA 2015 results (Volume I): excellence and equity in education. Paris: PISA OECD Publishing.
OECD (2016b). PISA 2015 results (Volume II): policies and practices for successful schools. Paris: PISA OECD Publishing.
Olmedo-Torre, N., Sánchez Carracedo, F., López, D., Perez-Poch, A., and López-Beltrán, M. (2018). Do female motives for enrolling vary according to STEM profile? IEEE Transactions on Education 61, 289–297. doi: 10.1109/TE.2018.2820643
Osborne, J., and Dillon, J. (2008). Science education in Europe: Critical reflections. A report to the Nuffield Foundation. London: Nuffield Foundation.
Osborne, J., Erduran, S., and Simon, S. (2004). Enhancing the quality of argumentation in school science. J. Res. Sci. Teach. 41, 994–1020. doi: 10.1002/tea.20035
Oskarsson, M., Westman, A.-K., and Jidesjö, A. (2019). ROSES - The Relevance of Science Education Second. Paper presented at the ESERA’19. Bologna.
Palmer, T. A., Burke, P. F., and Aubusson, P. (2017). Why school students choose and reject science: A study of the factors that students consider when selecting subjects. Int. J. Sci. Educ. 39, 645–662. doi: 10.1080/09500693.2017.1299949
Penner, A. M. (2015). Gender inequality in science. Science 347, 234–235. doi: 10.1126/Science.aaa3781
Quaglia, R., and Corso, M. (2014). Student voice: the instrument of change. Thousand Oaks, CA: Corwin press.
Robbins, S., and Judge, T. (2016). Organisational behavior. Hoboken, NJ: Financial Times Prentice Hall.
Ryan, R. M., and Deci, E. L. (2000). Self-determination theory and the facilitation of intrinsic motivation, social development, and well-being. Am. Psychol. 55, 68–78. doi: 10.1037/0003-066X.55.1.68
Schmaltz, R. M., Jansen, E., and Wenckowski, N. (2017). Redefining critical thinking: Teaching students to think like scientists. Front. Psychol. 8:459. doi: 10.3389/FPSYG.2017.00459
Schreiner, C., and Sjøberg, S. (2019). ROSE (The relevance of science education), Western youth and science. final rose report part 2. Olso: University of Oslo.
Sjøberg, S., and Schreiner, C. (2019). ROSE (The relevance of science education.) The development, key findings and impacts of an international low-cost comparative project. ROSE final report, part 1. Oslo: University of Oslo.
Suárez-Alvarez, J., Pedrosa, I., Lozano, L. M., García-Cueto, E., Cuesta, M., and Muñiz, J. (2018). Using reversed items in Likert scales: A questionable practice. Psicothema 30, 149–158. doi: 10.7334/PSICOTHEMA2018.33
Taconis, R., and Kessels, U. (2009). How choosing science depends on students’ individual fit to ‘science culture.’. Int. J. Sci. Educ. 31, 1115–1132. doi: 10.1080/09500690802050876
United Nations (2015). Transforming our world: the 2030 agenda for sustainable development. New York: United Nations.
Vázquez, A., and Manassero, M. A. (2007). La relevancia de la educación científica [The relevance of science education]. Palma: Universitat de les Illes Balears.
Vázquez, A., and Manassero, M. A. (2008a). El declive de las actitudes hacia la ciencia de los estudiantes: un indicador inquietante para la educación científica [The decline of students’ attitudes toward science: A disturbing indicator for science education]. Rev. Eureka Sobre Enseñanza Divulgación Ciencias 5, 274–292. doi: 10.25267/REV_EUREKA_ENSEN_DIVULG_CIENC.2008.V5.I3.03
Vázquez-Alonso, Á, and Manassero-Mas, M.-A. (2008b). La vocación científica y tecnológica de las chicas en secundaria y la educación diferenciada [The scientific and technological vocation of girls in secondary school and single-sex education]. Bordón. Rev. Pedagogía 60, 149–163.
Vázquez-Alonso, Á, and Manassero-Mas, M. A. (2009a). Factores actitudinales determinantes de la vocación científica y tecnológica en secundaria [Attitudinal factors determining the scientific and technological vocation in secondary education]. Cult. Educ. 21, 319–330. doi: 10.1174/113564009789052280
Vázquez-Alonso, Á, and Manassero-Mas, M. A. (2009b). Expectations for a future job and scientific vocations in secondary education students. Rev. Electrónica Invest. Educ. 11, 1–20.
Vázquez-Alonso, Á, and Manassero-Mas, M. A. (2009c). Patrones actitudinales de la vocación científica y tecnológica en chicas y chicos de secundaria [Attitudinal patterns of scientific and technological vocation in high school girls and boys]. Rev. Iberoamericana Educ. 50, 1–15. doi: 10.35362/RIE5041879
Vázquez-Alonso, Á, Montesano De Talavera, M., and Austin, I. (2013). Factores que influyen sobre la elección de estudios superiores de ciencias y tecnología [Factors influencing the choice of higher education in science and technology]. Enseñanza de las Ciencias, Núm. Extra, 3642–3648.
Wan, Y., and Bi, H. (2020). What major ‘socioscientific topics’ should the science curriculum focus on? A Delphi study of the expert community in China. Int. J. Sci. Math. Educ. 18, 16–77. doi: 10.1007/s10763-018-09947-y
Zancajo, A., and Bueno, C. (2023). L’abandonament a 4t d’ESO: les desigualtats en la transició a l’educació postobligatòria [Dropping out in 4th year of ESO: inequalities in the transition to postcompulsory education]. Barcelona: Fundació Jaume Bofill.
Keywords: science education, attitudes toward science, participation in science, gender and science, regression analysis, vocational profiles
Citation: Manassero-Mas M-A and Vázquez-Alonso Á (2025) A predictive analysis of STEM vocation through students’ attitudes to school science classes. Front. Educ. 10:1506038. doi: 10.3389/feduc.2025.1506038
Received: 04 October 2024; Accepted: 10 July 2025;
Published: 13 August 2025.
Edited by:
Subramaniam Ramanathan, Independent Scholar, Singapore, SingaporeReviewed by:
Tamirirofa Chirikure, University of Botswana, BotswanaMiloš Krstić, University of Niš, Serbia
Copyright © 2025 Manassero-Mas and Vázquez-Alonso. This is an open-access article distributed under the terms of the Creative Commons Attribution License (CC BY). The use, distribution or reproduction in other forums is permitted, provided the original author(s) and the copyright owner(s) are credited and that the original publication in this journal is cited, in accordance with accepted academic practice. No use, distribution or reproduction is permitted which does not comply with these terms.
*Correspondence: Ángel Vázquez-Alonso, YW5nZWwudmF6cXVlekB1aWIuZXM=