 Ulrich Ludewig
 Laura Becher
 Nele McElvany
- Center for Research on Education and School Development (IFS), Technical University Dortmund, Dortmund, Germany
Large-scale assessments (LSAs) significantly influence educational policy and perceptions of inequality, extending their impact beyond researchers to educators. LSAs predominantly utilize standard deviation units, supplemented by interpretation aids to enhance result comprehension. This pre-registered research delves into the utility of interpretation aids for teachers and their potential to influence result interpretation. The study used an experimental study design with N = 75 in teachers evaluating the usefulness and perceived relevance of several LSA reporting vignettes. Findings indicate that while all interpretation aids surpass standard deviation units in perceived usefulness, they also slightly alter the perceived magnitude of differences. The study underscores the importance of portraying interpretation aids as supplementary tools for context and reference, rather than replacements for statistics. Effective communication strategies should integrate interpretation aids to enrich understanding without overshadowing statistical significance. This approach ensures educators can leverage LSAs for informed decision-making while maintaining fidelity to statistical rigor.
Introduction
It is important to communicate the findings of educational research to teachers and practitioners (e.g., Klieme, 2012) because research findings provide a basis for evidence-based thinking and action (Bauer and Kollar, 2023). In this context, research findings deepen the understanding of educational phenomena and spark innovative ideas for teaching that are more likely to be effective (Hinzke et al., 2021; Visscher and Coe, 2003; Rochnia et al., 2023).
Large-scale assessments (LSAs) are among the most influential sources of evidence shaping our understanding of phenomena in education systems. They raise awareness about the state of education, highlight areas in need of improvement, and draw attention to critical issues such as inequalities among students of different backgrounds (Ludewig et al., 2025). Although large-scale assessments do not provide information for refining lesson planning for teachers or for evaluating the effectiveness of teaching methods (Seidel et al., 2017), they often serve as a catalyst for political action and administrative reforms within education systems (Groß-Ophoff et al., 2023). However, teachers, who represent the largest group of stakeholders, play a central role in implementing and sustaining reforms. Administrative and political personnel within education systems are frequently drawn from the teaching profession itself. Therefore, both current administrators and practicing teachers must be informed about, adhere to, and critically evaluate evidence-based decisions based on LSA results in order to actively engage in the process of educational change.
Although teachers show positive attitudes toward evidence-based teaching and learning about findings from educational research, they find it challenging to translate research evidence into their teaching practice (Georgiou et al., 2023). Moreover, teachers frequently express doubts about the transferability of research findings to their work (Joram et al., 2020), and if teachers consult evidence, it is primarily when the practical applications of the research to their own practice are highly evident (Cain, 2016). This presents a hurdle to integrating current evidence into teacher education and teaching practices.
Data and research literacy play a central role in this issue. First, data literacy can help teachers develop the necessary competencies to interpret students’ learning data and make evidence-informed decisions about their teaching and individual student support at the classroom level (Lee et al., 2024). Second, improved data and research literacy broaden the scope of what they believe is relevant for their practice and provide them with ways to link research findings to their prior knowledge (e.g., Schmidt et al., 2023; Filderman et al., 2022).
On the other hand, researchers can try to present and communicate their research findings in a way that helps teachers relate the findings to their own practice and thus understand their implications. For example, press releases, clearinghouse websites (Slavin, 2020), and infographics share the aim of making research findings more accessible for non-researchers. However, these approaches to scholarly communication face the challenge of rephrasing and presenting statistical results in a manner that allows non-researchers to correctly interpret them without losing any meaning to the greatest extent possible.
Theoretical background
Presenting statistical results to non-researchers goes along with different challenges, such as communicating the size of statistical effects, the certainty of findings, and their importance for practice. One very important aspect of presenting statistical results in a way that makes them relatable and useful for teachers is the units of measurement. In education research, intervention studies typically report in standard deviation units (e.g., Cohen’s d; see Kraft, 2020). These units of standard deviation have several methodological advantages (McGraw and Wong, 1992) in the research context but are not very relatable for non-researchers because they are abstract mathematical concepts (Lortie-Forgues et al., 2021). Therefore, there are different ways of translating such statistics into other forms that aid interpretation. Many interpretation aids have been proposed (e.g., Lipsey et al., 2012), but to date, there is no consensus about the metric best suited for communication with practitioners (Lortie-Forgues et al., 2021; Kühlwein et al., 2025).
Communicating results in LSA
Additionally, most previous research on communicating research findings to practitioners has focused on the effectiveness of interventions (Kraft, 2020; Lipsey et al., 2012; Lortie-Forgues et al., 2021; Schmidt et al., 2023). Another very important source of evidence for building an evidence-based understanding of education systems is the results from international large-scale assessments (ILSAs). ILSAs such as the Progress in International Reading Literacy Study (PIRLS), Programme for International Student Assessment (PISA), and Trends In International Mathematics And Science Study (TIMSS) are used to describe differences in student achievement between cohorts in a country over time (trends) and between countries within a year (cross-country comparisons), as well as between groups of students (disparities) over time and between countries.
In general, quantitative research findings can be characterized as (a) statistically significant, (b) quantified with a certain statistical magnitude, and (c) contextualized as practically relevant (Bakker et al., 2019; McCartney and Rosenthal, 2000). (a) Statistical significance is set at a threshold level and qualifies a finding as unlikely to be the result of random variation. The meaning of statistically significant: “not by chance” differs from the colloquial meaning of “significant”: important, substantial, or relevant. In LSA reporting, statistical significance is usually explicitly stated or visually signified. Statistical significance in LSA is conceptually equivalent to statistical significance in other contexts. (b) Statistical magnitude quantifies a finding using a specific unit of measurement. In most research contexts, statistical magnitudes are communicated using standardized effect sizes such as Cohen’s d (or Hedges’ g). Most basically, effect sizes are a measure of differences in means between two subgroups divided by the standard deviation of the measure of interest (Lipsey et al., 2012).
In ILSAs, the statistical magnitudes are “points” that represent one-hundredth of one standard deviation on a normed scale (Mullis et al., 2023). A normalized scale represents test results in terms of their distance from the mean of a reference group. The mean of the reference group is set to 500 and its standard deviation to 100. For example, one point on the PIRLS scale is one hundredth of a standard deviation for the reference group of countries that participated in PIRLS 2001. Thus, it is abstract and not very relatable. Generally, the statistical magnitude has no clear relation to statistical significance. There may be relatively large point differences that are not statistically significant due to low-precision estimates, and small point differences that are statistically significant due to high-precision estimates. Teachers are not always able to disentangle the terms statistical “significance” and statistical magnitude (Schmidt et al., 2023). However, for ILSAs, the precision is often high enough that even small differences are likely to be statistically significant. (c) Quantitative findings can be interpreted as practically relevant if their statistical magnitude relates to ordinary life experience, known findings, or prior knowledge (Funder and Ozer, 2019).
Teachers pay attention to research if its practical relevance is evident. Statistically significant is less of an issue in LSA compared to other contexts because LSA has great statistical power. Thus, translating the ILSA results into more relatable units than “points” of standard deviation and enabling teachers to understand their relevance is a crucial issue for LSA reporting. Interpretation aids help non-researchers better connect the statistical magnitude to their prior knowledge and real-world experience by presenting more relatable units (Lortie-Forgues et al., 2021).
Interpretation aids
The driving purpose of interpretation aids is to increase the usefulness of results. However, the transformation of results into the form of interpretation aids could generate new interpretation problems by leading, for instance, to misinterpretation, inflating or deflating the perceived magnitude of an achievement difference. Additionally, interpretation aids can lead to inconsistencies in the communication of results because assumptions or translations are not obvious to the recipient. Both could cause faulty decision-making or a biased perception of differences (Baird and Pane, 2019). Therefore, we discuss the potential, advantages, and risks related to interpretation aids and use reading comprehension differences in elementary school as an example.
Months of learning
A popular interpretation aid is to convert results into years (or months, weeks, days) of learning. The average gain in students’ achievement over subsequent grades provides an important means of comparison (Brunner et al., 2023; Hill et al., 2008). Student achievement is the result of long-term, cumulative domain-specific processes of knowledge and skill acquisition (e.g., Baumert et al., 2009). Teachers have real-world experience seeing their students grow and learn over time; therefore, they often perceive years of learning comparisons as useful (e.g., Lipsey et al., 2012).
Baird and Pane (2019) criticize learning-year equivalent calculations for several reasons. Among other things, learning year equivalents invite overinterpretation: The weaker student group should go to school for X additional months to catch up with the stronger student group. Group differences can have many causes, and average achievement growth describes how much students typically learn in a year, which includes maturational processes, out-of-school learning, and in-school learning. Learning-year equivalents invite attributing differences to differences in in-school learning, which is not necessarily backed by the presented evidence. Baird and Pane (2019) also describe the problem that years of learning effects get smaller in higher grades. Thus, very small years of learning effects could inflate the magnitude of group differences. Additionally, there are different learning-year estimations available, such that the difference between girls and boys in reading in first grade (d = 0.14) can be between four months (0.14/0.40 = 0.35 ≈ 4 months; Hill et al., 2008) and 6 months depending on the source of the year of learning calculation (0.14/0.29 = 0.54 ≈ 6 months; Ditton and Krüsken, 2009). Therefore, different researchers or different publications may use different years of learning effects and, therefore, produce inconsistent results even though the underlying effects are the same.
Proportion below a content-based threshold
Another very common approach is to choose an informative threshold on the norm distribution and describe the difference in proficiency by the proportion of each group that falls below (or above) this threshold (see, e.g., Lipsey et al., 2012). Most ILSAs describe each group using proficiency level descriptors, which represent specific requirements necessary to solve a task at a given proficiency level (Durda et al., 2020). In PIRLS and TIMSS, these thresholds are called international benchmarks (Mullis et al., 2023) in PISA Proficiency Levels (Mang et al., 2019).
For PIRLS 2021, the lower threshold for Proficiency Level III is 475 points (i.e., 0.25 SD below the international mean of 2001). Proficiency Level III is considered a minimum standard for reading achievement at the end of fourth grade in many countries. For instance, applied to German trend results, this means that 14% of students in 2006 and 25% of students in 2021 did not reach the minimum standard for reading achievement in the fourth grade.
The difference between these two percentages can be interpreted and summarized further. Two common ways of doing this are (1) percentage point differences and (2) relative risk. From the example, it can be concluded that children in 2021 are 12 percentage points more likely to fail to meet the minimum standards and that they have almost twice the relative risk of failing to meet the minimum standards.
Results presented as percentages are often considered useful because they represent a concrete entity (e.g., 26 of 100 or 1 of 4) and are used in many other areas of life (e.g., discounts). However, thresholds of proficiency levels invite recipients to make incorrect interpretations: Many more students “cannot read” today compared to prior years. Competences are continuous, quantitative constructs that are normally distributed; thus, while more students fall under the threshold today, it is not possible to divide students cleanly into those who “can” and “cannot” read. Additionally, thresholds are usually study-specific and therefore produce inconsistent results between studies, even if the underlying differences are the same. Moreover, a percentage point difference can result in different values depending on the relative position of the compared groups to the threshold. Therefore, percentage point differences should not be compared between studies (Hollingshead and Childs, 2011). For instance, the magnitudes of trends over time and gaps between groups depend on the selection of this cut-off score (Ho, 2009).
Relative risks are often considered useful in reporting results because they express differences as multiplicative factors. However, when based on thresholded outcomes such as proficiency levels, relative risks may invite similar misinterpretations as percentage score differences and introduce additional challenges. First, relative risks provide no information about the baseline rate, which is essential for understanding the practical significance of an effect. Second, relative risks can appear dramatic even when absolute differences are small, particularly when the overall prevalence of the outcome is low. While concerns about misleading interpretations of relative risks have been widely discussed in fields such as epidemiology (Novelli et al., 2021) and criminology—where absolute risks are often very low—international large-scale assessments (ILSAs) typically examine outcomes that are more prevalent. Nevertheless, it remains crucial to interpret relative risks in conjunction with absolute risk levels to avoid overstating the magnitude or relevance of observed group differences.
The present study
Communicating differences in achievement to practitioners in education is an important goal of empirical education research. For methodological reasons, LSAs use units of standard deviation as their main statistical magnitude. Interpretation aids aim to make results more accessible and easier to understand for educational practitioners. However, interpretation aids could potentially change the denotation of the result by inflating or reducing the perceived magnitude of differences. Thus, our pre-registered research questions (RQ) and hypotheses (H) are the following:
• RQ1: Do teachers actually perceive interpretation aids as useful?
• H1: Teachers perceived the interpretation aids to be more useful than the points of standard deviation.
We assume that months of learning, percentage points, and relative risk factors improve the perceived usefulness of study results because they enable teachers to relate their real-world experiences with the statistical magnitudes and to associate a more concrete concept with the results.
• RQ2: How does the interpretation aid influence the perceived magnitude of a group difference?
• H2: There is a difference in teachers’ perceived magnitude of differences between interpretation aids.
The numerical values of the interpretation aid, as well as the numerical distances between the reported LSA results, differ. Therefore, there is a risk that the interpretation aids may alter the perceived magnitude of the group differences.
Methods
Participants
The sample comprised N = 75 in-service teachers with diverse demographic characteristics. The average age of the teachers in the sample was M = 40.76 years, with a standard deviation of SD = 12.64 and a range from 22 to 67 years. In terms of gender, 86.67% of the teachers identified as female. The average number of years the teachers have been in the profession is M = 12.24, with a standard deviation of SD = 9.93. The range of teaching experience extends from 0 to 40 years. Zero years means participants have been working in a school for less than a year. The sample includes teachers from different school levels. Specifically, 34.67% of the teachers worked at the primary level, 33.33% at the lower secondary level, and 32.00% at the upper secondary level (including schools with a vocational orientation). The participating teachers rated their familiarity with statistical concepts as rather low, with a mean of 2.40 on a scale of 1–5 (SD = 0.85). Among the interpretation aids, teachers ranked grade-level comparisons first (most familiar), percentage point change second, differences on standardized scales third, and relative risk fourth (least familiar). Please find a detailed description of the teacher familiarity ratings in Appendix C.
The participants in this study were recruited mostly through social media platforms [e.g., X (formerly Twitter), Facebook] and email lists. Potential participants were informed about the study and given the opportunity to voluntarily participate. To incentivize participation, participants who completed the study could voluntarily enter into a drawing where a selected number of winners would receive 20€. We did not reach the target number of 200 teachers because it was much harder than expected to motivate in-service teachers to participate in the study. We decided to end the data collection after expanding the data collection timeframe (12/2022–05/2023) and exploiting available resources. The study was approved by the (University) ethics committee (reference # GEKTUDO_2022_52).
Vignettes
In the study, teachers were presented with vignettes describing a difference between student groups in reading comprehension with an interpretation aid or in terms of units of standard deviation. Each vignette consisted of one of four group differences and one of four presentation formats (three interpretation aids + units of standard deviation) for a total of 4 * 4 = 16 vignettes. Presentation formats were (1) units of standard deviation, (2) months of learning, (3) percentage points, and (4) risk ratio. The group differences were (1) gender (male versus female; d = −0.16), trend (2016 versus 2021; d = −0.25), (2) language spoken at home (always or almost always speaking German at home versus always or almost always speaking a language other than German at home; d = −0.35), (3) socio-economic background as indicated by the number of books at home (less than 100 versus 100 or more; d = −0.53). The results were artificially created based on the following premises: (1) the standard deviation was equal in all groups and (2) the effect size was plausible for the group difference it describes (e.g., Frey et al., 2023). Please find the underlying group differences in Appendix A.
The vignettes were phrased in a standardized way to ensure comparability between the different interpretation aids (see Table 1). The formulation of each vignette consisted of an introductory phrase (e.g., “The average reading proficiency of students at the end of fourth grade is,” plain text), a phrase to clarify the specific group difference (e.g., “for boys compared to girls,” italic) and the interpretation aid used (e.g., “14 points lower on the reading proficiency scale,” underlined).
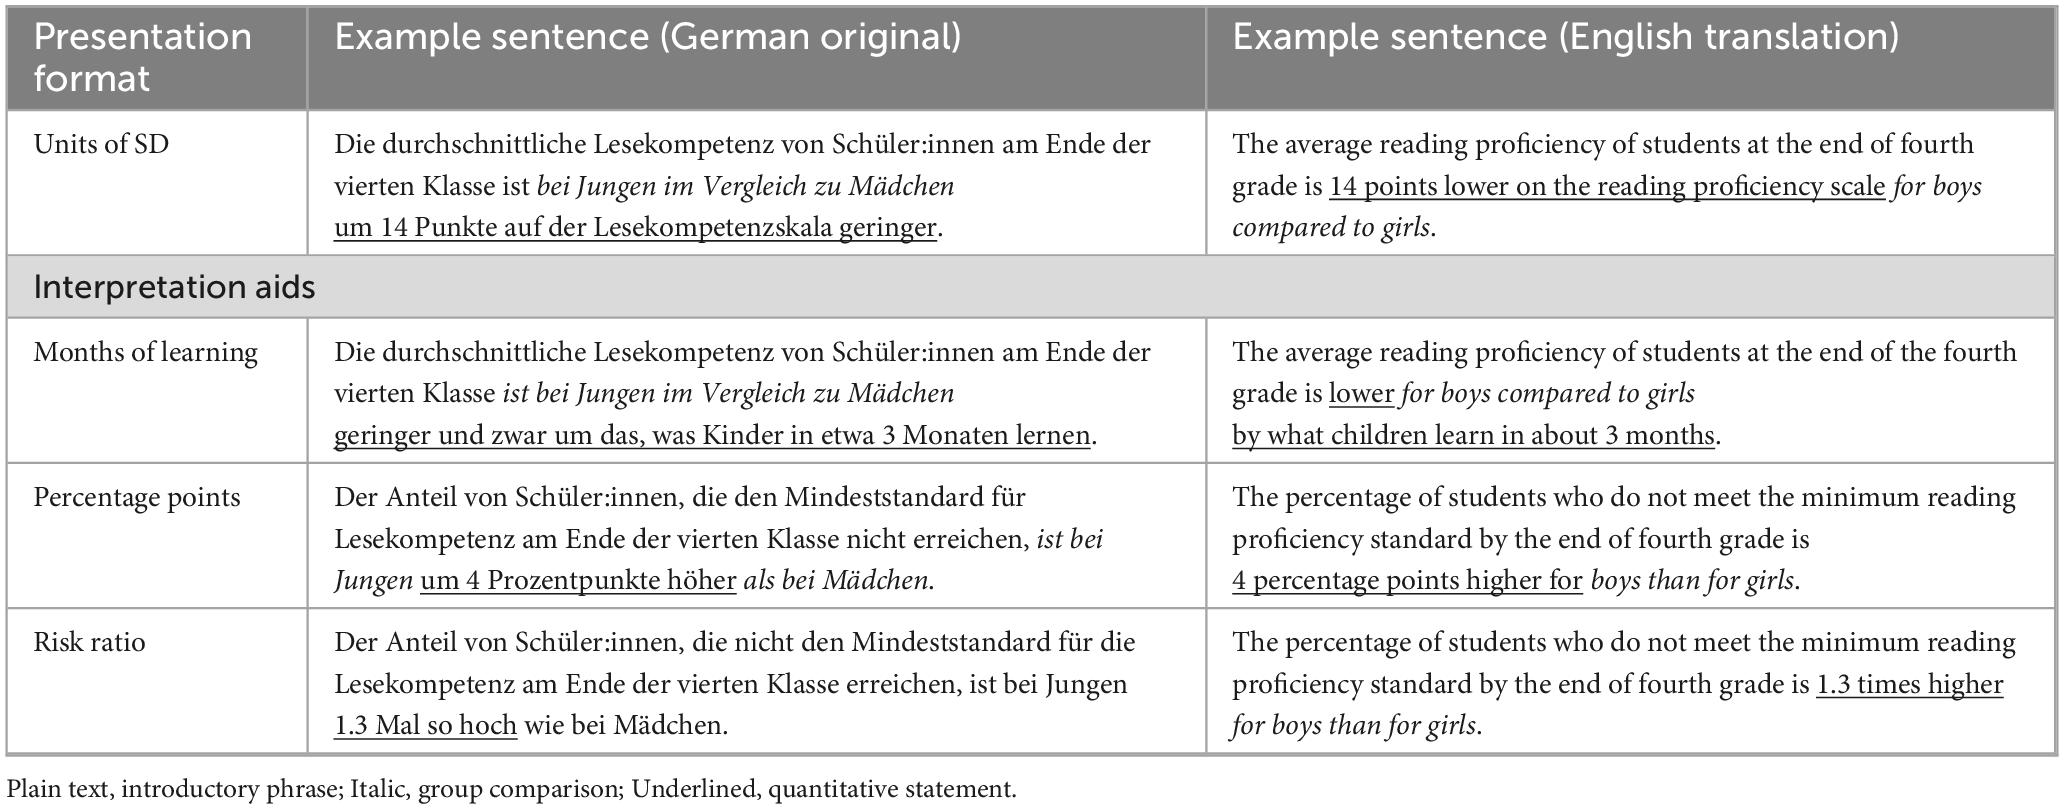
Table 1. Example vignettes for gender difference.
Procedure
To answer the research questions above, we used a within-person experimental design in an onlinebriefly introduced to LSA (140 words) and why it is important to be aware of disparities in education, ly introduced to LSA (140 words) and why it is important to be aware of disparities in education and answered a few demographic questions. Specifically, they were informed of the fact that all the presented results are statistically significant and representative. However, participants were not informed that each vignette about a difference describes the same degree of impact, i.e., that the effect sizes for group differences are identical between information aids.
Second, participants answered on a seven-point semantic differential to what extent they rate the vignette to be (1) informative and (2) comprehensible, and to what extent they think the difference is (3) negligibly small or seriously large. The questions and rating were adopted from Lortie-Forgues et al. (2021). Each participant had to assess each of the 16 vignettes regarding these three aspects. The presentation order of the vignettes was randomized for each participant. At the end of the survey, participants rated their familiarity with different statistical concepts.
Analysis
Our analysis plan was preregistered prior to data collection and can be inspected, along with the survey questionnaire, analysis code, and data at https://osf.io/yr2fv/?view_only=e85db5416bb94c0399fc242334196a25. We used the same model for both research questions. Perceived usefulness was derived from the average between the ratings of the comprehensibility and informativeness of a statement. The pre-registered hypotheses were tested by comparing a baseline model with a model that additionally included a factor for the interpretation aid. The baseline model was a linear mixed-effects model with a random effect for the teacher and a fixed effect for group difference (factor). The analysis used RStudio (R Core Team, 2023), specifically the lmer function from the lme4 package (Bates et al., 2015). Additionally, we report the coefficient of the model to indicate the strength and direction of the effects. All means and standard deviations of the ratings per vignette can be found in Appendix B.
Results
Are there differences in usefulness (RQ1) and perceived magnitude (RQ2) between interpretation aids?
The factor interpretation aids had a statistically significant effect on explaining the usefulness ratings of the vignettes, χ2Δ(3) = 55.82, p < 0.001, and perceived magnitude of the group difference, χ2Δ(3) = 21.95, p < 0.001. This supports the hypotheses (H1) that there are differences in teachers’ perceived usefulness of different types of interpretation aids and (H2) that there are differences in teachers’ estimates of the size and magnitude of the difference between interpretation aids. The model results are displayed in Table 2 and expected ratings in Figure 1.
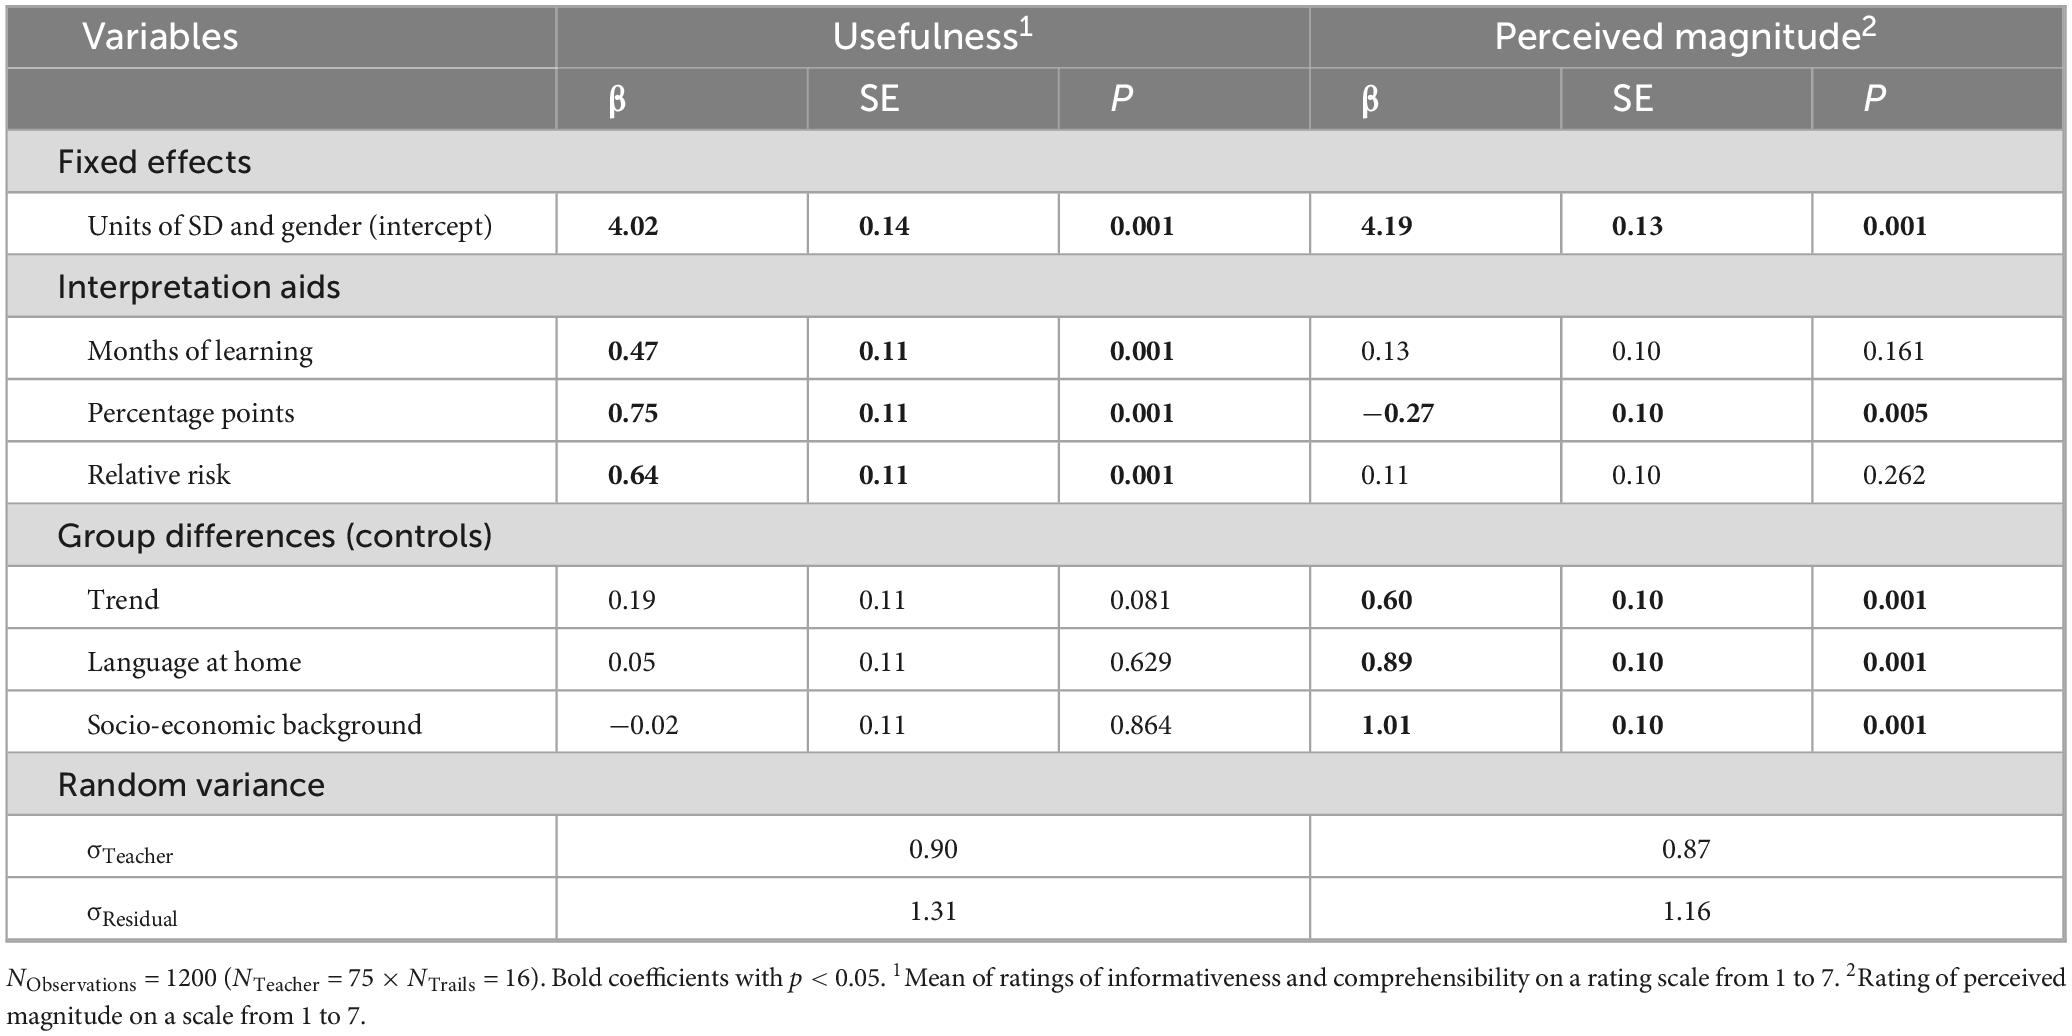
Table 2. Results on the effect of interpretation aid on perceived usefulness and magnitude.
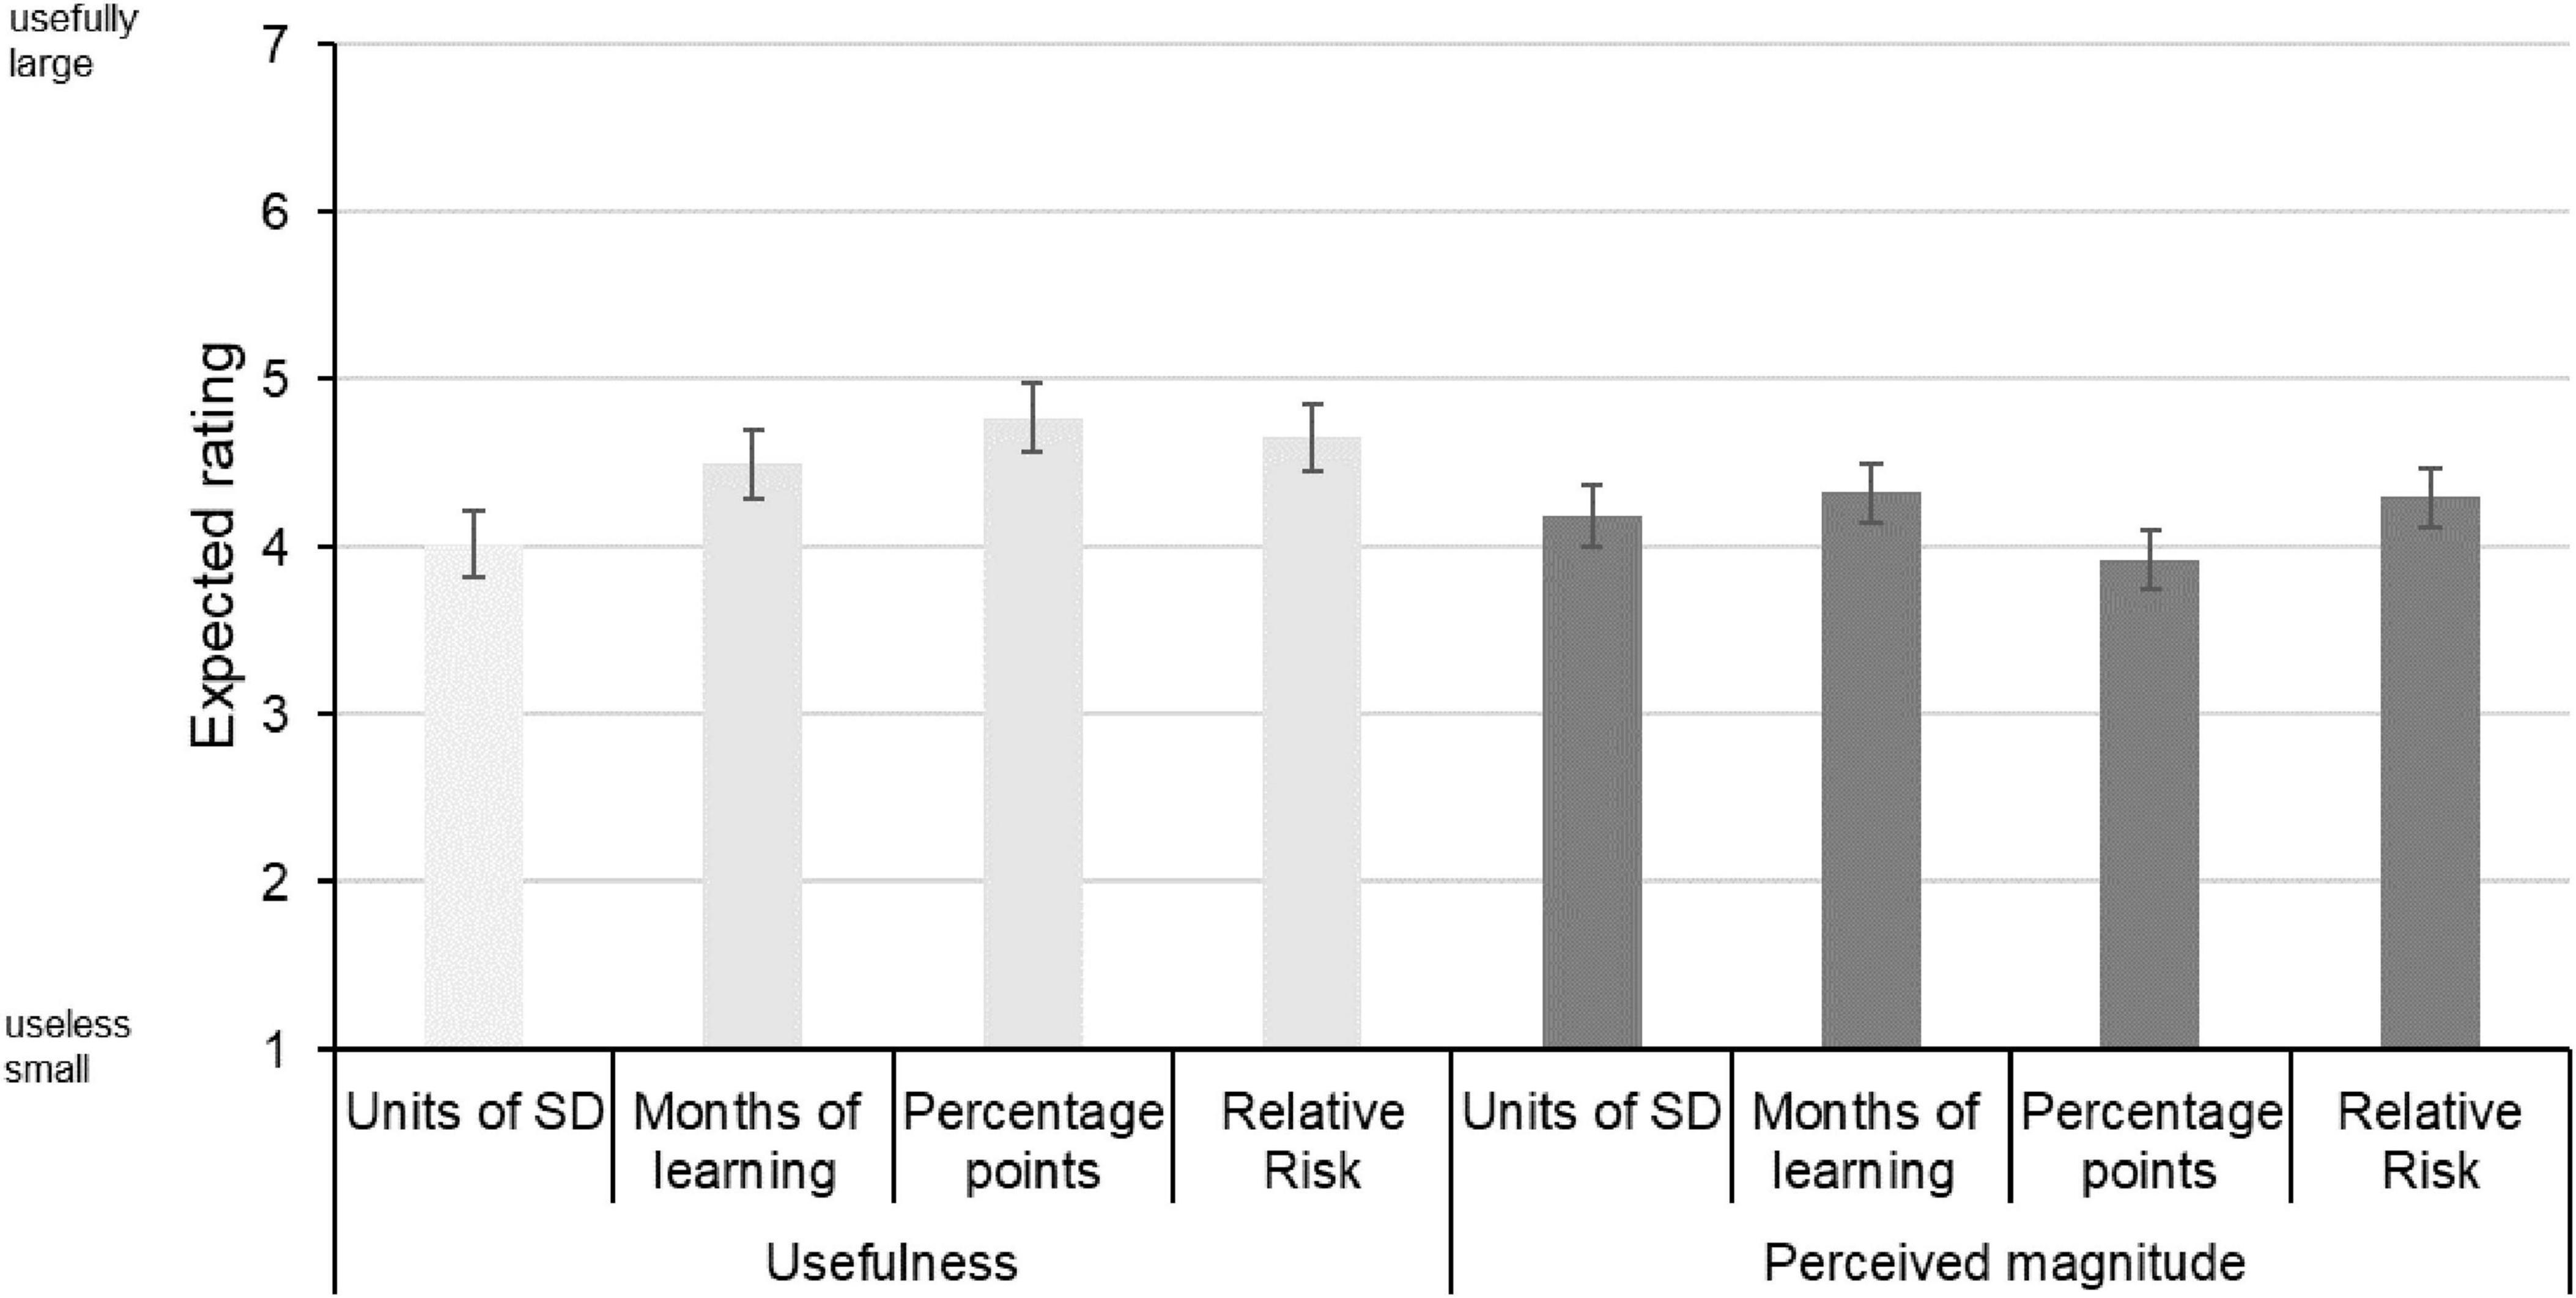
Figure 1. Ratings of usefulness and perceived magnitude. Usefulness: units of standard deviation < months of learning, percentage points and relative risk, months of learning < percentage points. Perceived magnitude: units of standard deviation > percentage points, months of learning > percentage points, percentage points < units of standard deviation, months of learning and relative risk, relative risk > percentage points. Error bars represent the 83.43% confidence interval. Overlap between 83.43% confidence intervals, approximate test for statistically significant difference, p < 0.05 (Knol et al., 2011). The model indicates that all interpretation aids were rated statistically significantly more useful than the units of standard deviation (Table 2).
In more detail, we found that in terms of usefulness, units of standard deviation were inferior to months of learning (β = 0.47, t = 4.43, p < 0.001), percentage points (β = 0.75, t = 7.03, p < 0.001), and relative risk (β = 0.64, t = 5.94, p < 0.001). Additionally, percentage points were superior to months of learning (β = 0.28, t = −2.60, p = 0.011). In terms of perceived magnitude, the percentage points were perceived to be smaller in magnitude than units of standard deviation (β = −0.27, t = 2.81, p = 0.007), months of learning (β = −0.40, t = 4.21, p < 0.001), and relative risk (β = −0.37, t = 3.93, p < 0.001).
Discussion
The study examined the perceived usefulness and magnitude of LSA reports. LSAs use units of standard deviation to communicate results. These units of standard deviation have methodological advantages but are abstract and difficult to interpret for non-researchers. Interpretation aids such as months of progress equivalents, change in percentage meeting a threshold, and risk ratios for falling below a threshold aim at improving the usefulness of reports but should not change the perceived magnitude of differences and their denotation. Therefore, we analyzed data from N = 75 in-service teachers who rated several vignettes in a within-person experimental study. The vignettes reported group differences with varying magnitudes (trends, gender, language at home, and books at home) common in LSA reports.
Our results showed that all interpretation aids were perceived to be more useful than the units of standard deviations. Thus, the results support the notion that teachers do value interpretation aids and find them more relatable than units of standard deviation. Thus, interpretation aids would play a significant role in increasing the perceived utility value of educational research for teachers (Zeeb and Voss, 2025). This finding is consistent with findings about interpretation aids for intervention studies (Lortie-Forgues et al., 2021). Notably, we found that teachers preferred percentage points over months of learning. Given the many limitations of months of learning equivalence (Baird and Pane, 2019) and the relatively few limitations of percentage change (Hollingshead and Childs, 2011), conveying the results of LSA via percentage changes may be the better interpretation aid.
However, the perceived magnitude of the results was also impacted in a statistically significant way by the interpretation aids. Specifically, the percentage change was rated as weaker in magnitude than the units of standard deviation, whereas months of learning and risk ratios tended to have a higher perceived magnitude. The finding that interpretation aids using the difference in percentage points meeting a threshold decreased the perceived magnitude is contradictory to results about interpretation aids when reporting on the effectiveness of interventions (Lortie-Forgues et al., 2021). Notably, Lortie-Forgues et al. (2021) described the percentage falling below a threshold in the two groups, whereas in this study, we described the differences in percentage points meeting or exceeding the threshold. Thus, the percentage meeting a threshold within a particular group might be an important reference for teachers. Additionally, the tendency for months of learning to inflate the perceived magnitude of a result is consistent with interpretation aids reporting on the effectiveness of interventions (Lortie-Forgues et al., 2021). However, the inflationary effect is heavily dependent on the annual growth estimate used to determine the months of learning (Baird and Pane, 2019). The vignettes were about elementary students with relatively large annual growth estimates; thus, the months of learning equivalent have only a modest potential to inflate the perceived magnitude.
Implications
Results from LSAs play an important role in informing educational policy. Teachers, as the primary agents responsible for implementing these policies in practice, play a central role in translating them into classroom action. Overcoming practical, scientific, and political barriers in education to move toward a stronger evidence orientation is an important developmental goal of the education sector (Bauer and Kollar, 2023). It is therefore essential that teachers’ beliefs and understandings of educational inequality and the broader education system are grounded in empirical evidence. Communicators’ decisions about how to report their research findings are likely to influence the extent to which teachers will use results to refine their beliefs and ideas about inequality and the education system.
Our study suggests that communicators who want to maximize teacher engagement with research should consider emphasizing the relevance of outcomes through interpretation aids, such as months of progress equivalents, differences in percentage points meeting a threshold, and risk ratios for falling below a threshold; reporting only units of standard deviation may result in lower engagement. Research findings have the characteristics of (a) being statistically significant, (b) being quantified with a certain statistical magnitude, and (c) being contextualized as practically relevant (Bakker et al., 2019). Interpretation aids are superior in emphasizing the third aspect, contextualizing the practical relevance; however, they have stronger limitations with regard to the second aspect, quantifying the statistical magnitude, than units of standard deviation. Findings presented in terms of percentage change seem to slightly weaken the perceived magnitude of the effect. Additionally, we have already discussed the limitations of interpretation aids when viewed as statistics. For instance, (i) relative risk can dramatically inflate the reported magnitude of the effect if the denominator is very small (Trevena et al., 2013), (ii) the percentage change can be misleading depending on the position of the cut-off value relative to the pivot point of the normal distribution (Hollingshead and Childs, 2011), and (iii) months of progress can generate implausible results if the average annual progress estimate is small (Baird and Pane, 2019). The use of interpretation aids should be accompanied by a note emphasizing their character as an interpretation aid and not as a statistic upon which statistical significance is determined or a quantity with optimal measurement properties, but rather as an indication or contextualization of a result.
Limitations and outlook
The study investigates perception using results from large-scale assessments; however, this scope reflects only a small segment of the broader evidence-based orientation that teachers need. For a more comprehensive understanding, it is likely far more relevant for teachers to be informed about educational theories that reflect the current state of evidence in educational science (Renkl, 2022). Nevertheless, increasing the accessibility of theoretical knowledge in the teacher population requires significantly more effort than optimizing interpretation aids. Enhancing interpretation aids typically involves only minor adjustments to LSA reporting formats and outputs. Therefore, interpretation aids remain highly relevant for increasing the value of large-scale assessment results for teachers.
We only found that percentage points are more useful than months of learning regarding the differences between interpretation aids in usefulness. Therefore, we can make only a few specific recommendations in favor of a particular interpretation aid. A larger sample size would make it possible to identify smaller effects as statistically significant. However, the differences found are already relatively small, at around 0.5 on a scale of 1–7, meaning that much smaller effects may no longer be practically relevant. Additionally, the teachers were employed at different types of schools that do not serve students in the age range to which the years-of-learning interpretation aids referred. This possibly limited the perceived usefulness of these aids. A larger, more targeted sample from specific school types would have been preferable.
Lastly, the vignettes provide relatively little context about the results. Most reports would provide a theoretical background or motivation for the specific comparison and verbal contextualization. The vignettes mimic sentences in press releases or an executive summary. Additionally, the nature of the interpretations requires somewhat different phrasing of the sentences. Future work should examine the communication of results with more context and scenarios that are more authentic and with a variety of differently phrased sentences.
Data availability statement
The datasets presented in this study can be found in online repositories. The names of the repository/repositories and accession number(s) can be found in the article/Supplementary material.
Ethics statement
The studies involving humans were approved by Ethikkommission der TU Dortmund Fakultät Erziehungswissenschaft, Psychologie und Bildungsforschung (12). The studies were conducted in accordance with the local legislation and institutional requirements. The participants provided their written informed consent to participate in this study.
Author contributions
UL: Conceptualization, Formal analysis, Methodology, Project administration, Supervision, Writing – original draft, Writing – review & editing. LB: Conceptualization, Data curation, Project administration, Validation, Writing – review & editing. NM: Funding acquisition, Resources, Supervision, Writing – review & editing.
Funding
The author(s) declare that financial support was received for the research and/or publication of this article. Funding was provided by the Federal Ministry of Education and Research (BMBF) as well as the Standing Conference of the Ministers of Education and Cultural Affairs (KMK).
Conflict of interest
The authors declare that the research was conducted in the absence of any commercial or financial relationships that could be construed as a potential conflict of interest.
Generative AI statement
The authors declare that no Generative AI was used in the creation of this manuscript.
Any alternative text (alt text) provided alongside figures in this article has been generated by Frontiers with the support of artificial intelligence and reasonable efforts have been made to ensure accuracy, including review by the authors wherever possible. If you identify any issues, please contact us.
Publisher’s note
All claims expressed in this article are solely those of the authors and do not necessarily represent those of their affiliated organizations, or those of the publisher, the editors and the reviewers. Any product that may be evaluated in this article, or claim that may be made by its manufacturer, is not guaranteed or endorsed by the publisher.
Supplementary material
The Supplementary Material for this article can be found online at: https://www.frontiersin.org/articles/10.3389/feduc.2025.1515281/full#supplementary-material
References
Baird, M. D., and Pane, J. F. (2019). Translating standardized effects of education programs into more interpretable metrics. Educ. Res. 48, 217–228. doi: 10.3102/0013189x19848729
Bakker, A., Cai, J., English, L., Kaiser, G., Mesa, V., and Van Dooren, W. (2019). Beyond small, medium, or large: Points of consideration when interpreting effect sizes. Educ. Stud. Mathemat. 102, 1–8. doi: 10.1007/s10649-019-09908-4
Bates, D. M., Mächler, M., Bolker, B. M., and Walker, S. C. (2015). Fitting linear mixed-effects models using LME4. J. Statist. Softw. 67, 1–48. doi: 10.18637/jss.v067.i01
Bauer, J., and Kollar, I. (2023). (Wie) kann die Nutzung bildungswissenschaftlicher Evidenz Lehren und Lernen verbessern? Thesen und Fragen zur Diskussion um evidenzorientiertes Denken und Handeln von Lehrkräften. [(How) can the use of educational evidence improve teaching and learning? Theses and questions for the discussion on evidence-based thinking and action among teachers]. Unterrichtswissenschaft 51, 123–147. doi: 10.1007/s42010-023-00166-1 German
Baumert, J., Lüdtke, O., Trautwein, U., and Brunner, M. (2009). Large-scale student assessment studies measure the results of processes of knowledge acquisition: Evidence in support of the distinction between intelligence and student achievement. Educ. Res. Rev. 4, 165–176. doi: 10.1016/j.edurev.2009.04.002
Brunner, M., Stallasch, S. E., and Lüdtke, O. (2023). Empirical benchmarks to interpret intervention effects on student achievement in elementary and secondary school: Meta-analytic results from Germany. J. Res. Educ. Effect. 17, 119–157. doi: 10.1080/19345747.2023.2175753
Cain, T. (2016). Research utilisation and the struggle for the teacher’s soul: A narrative review. Eur. J. Teach. Educ. 39, 616–629. doi: 10.1080/02619768.2016.1252912
Ditton, H., and Krüsken, J. (2009). Denn wer hat, dem wird gegeben werden? Eine Längsschnittstudie zur Entwicklung schulischer Leistungen und den Effekten der sozialen Herkunft in der Grundschulzeit [For he who has, to him shall be given? A longitudinal study on the development of academic performance and the effects of social background in primary school]. J. Educ. Res. Online 1, 33–61. doi: 10.25656/014555 German
Durda, T., Artelt, C., Lechner, C. M., Rammstedt, B., and Wicht, A. (2020). Proficiency level descriptors for low reading proficiency: An integrative process model. Int. Rev. Educ. 66, 211–233. doi: 10.1007/s11159-020-09834-1
Filderman, M. J., Toste, J. R., Didion, L., and Peng, P. (2022). Data literacy training for K–12 teachers: A meta-analysis of the effects on teacher outcomes. Remed. Special Educ. 43, 328–343. doi: 10.1177/074193252110542
Frey, A., Ludewig, U., König, C., Krampen, D., Lorenz, R., and Bos, W. (2023). “IGLU 2021: Lesekompetenzen von Viertklässlerinnen und Viertklässlern im internationalen Vergleich: 20 Jahre-trend [IGLU 2021. [Reading achievement of fourth graders in international comparison: 20-year trend.],” in IGLU 2021 – Lesekompetenz von Grundschulkindern im internationalen Vergleich und im Trend über 20 Jahre, eds N. McElvany, R. Lorenz, A. Frey, F. Goldhammer, A. Schilcher, and T. Stubbe (Ohio: Waxmann). German
Funder, D. C., and Ozer, D. J. (2019). Evaluating effect size in psychological research: Sense and nonsense. Adv. Methods Pract. Psychol. Sci. 2, 156–168. doi: 10.1177/2515245919847202
Georgiou, D., Diery, A., Mok, S. Y., Fischer, F., and Seidel, T. (2023). Turning research evidence into teaching action: Teacher educators’ attitudes toward evidence-based teaching. Int. J. Educ. Res. Open 4:100240. doi: 10.1016/j.ijedro.2023.100240
Groß-Ophoff, J., Brown, C., and Helm, C. (2023). Do pupils at research-informed schools actually perform better? Findings from a study at English schools. Front. Educ. 7:1011241. doi: 10.3389/feduc.2022.1011241
Hill, C. J., Bloom, H. S., Black, A. R., and Lipsey, M. W. (2008). Empirical benchmarks for interpreting effect sizes in research. Child Dev. Perspect. 2, 172–177. doi: 10.1111/j.1750-8606.2008.00061.x
Hinzke, J. H., Gesang, J., and Besa, K. S. (2021). Ungewissheit im unterrichtlichen Handeln von lehrpersonen. zur erfahrung von ungewissheit zwischen norm, theorie und habitus. [Uncertainty in teachers’ teaching practices: On the experience of uncertainty between norm, theory, and habitus]. ZISU–Zeitschrift Interpretat. Schul-und Unterrichtsforschung 10, 56–69. doi: 10.3224/zisu.v10i1.04 German
Ho, A. D. (2009). A nonparametric framework for comparing trends and gaps across tests. J. Educ. Behav. Statis. 34, 201–228. doi: 10.3102/1076998609332755
Hollingshead, L., and Childs, R. A. (2011). Reporting the percentage of students above a cut score: The effect of group size. Educ. Measurem. Issues Pract. 30, 36–43. doi: 10.1111/j.1745-3992.2010.00198.x
Joram, E., Gabriele, A. J., and Walton, K. (2020). What influences teachers’ “buy-in” of research? Teachers’ beliefs about the applicability of educational research to their practice. Teach. Teach. Educ. 88:102980. doi: 10.1016/j.tate.2019.102980
Klieme, E. (2012). “The role of large-scale assessments in research on educational effectiveness and school development,” in The role of international large-scale assessments: Perspectives from technology, economy, and educational research, eds M. von Davier, E. Gonzalez, I. Kirsch, and K. Yamamoto (Berlin: Springer), 115–147. doi: 10.1007/978-94-007-4629-9_7
Knol, M. J., Pestman, W. R., and Grobbee, D. E. (2011). The (mis)use of overlap of confidence intervals to assess effect modification. Eur. J. Epidemiol. 26, 253–254. doi: 10.1007/s10654-011-9563-8
Kraft, M. A. (2020). Interpreting effect sizes of education interventions. Educ. Res. 49, 241–253. doi: 10.3102/0013189x20912798
Kühlwein, F., Merk, S., Schneider, J., and Schmidt, K. (2025). Effektstärken verständlich an Lehrpersonen kommunizieren [Symposium: Förderung evidenzinformierter Entscheidungen von Lehrkräften]. Communicating effect sizes clearly to teachers [Symposium: Promoting evidence-informed decisions by teachers]. Mannheim: Universität Mannheim. German
Lee, J., Alonzo, D., Beswick, K., Abril, J. M. V., Chew, A. W., Oo, C. Z., et al. (2024). Dimensions of teachers’ data literacy: A systematic review of literature from 1990 to 2021. Educ. Asse. Eval. Acc. 36, 145–200. doi: 10.1007/s11092-024-09435-8
Lipsey, M. W., Puzio, K., Yun, C., Hebert, M. D., Steinka-Fry, K., Cole, M. W., et al. (2012). Translating the statistical representation of the effects of education interventions into more readily interpretable forms. Washington, DC: National Center for Special Education Research.
Lortie-Forgues, H., Sio, U. N., and Inglis, M. (2021). How should educational effects be communicated to teachers? Educ. Res. 50, 345–354. doi: 10.3102/0013189X20987856
Ludewig, U., Strietholt, R., and McElvany, N. (2025). Reading literacy decline in Europe: Disentangling school closures and out-of-school learning conditions during the COVID-19 pandemic. Learn. Instruct. 98:102150. doi: 10.1016/j.learninstruc.2025.102150
Mang, J., Wagner, S., Gomolka, J., Schäfer, A., Meinck, S., and Reiss, K. (2019). Technische Hintergrundinformationen PISA 2018. [Technical background information PISA 2018]. Münster. German
McCartney, K., and Rosenthal, R. (2000). Effect size, practical importance, and social policy for children. Child Dev. 71, 173–180. doi: 10.1111/1467-8624.00131
McGraw, K. O., and Wong, S. P. (1992). A common language effect size statistic. Psychol. Bull. 111, 361–365. doi: 10.1037/0033-2909.111.2.361
Mullis, I. V. S., von Davier, M., Foy, P., Fishbein, B., Reynolds, K. A., and Wry, E. (2023). PIRLS 2021 International Results in Reading. Washington, DC: Boston College, TIMSS & PIRLS International Study Center, doi: 10.6017/lse.tpisc.tr2103.kb5342
Novelli, M., Antognini, A. B., Boffetta, P., Ioannidis, J. P., Spatari, G., and Violante, F. S. (2021). Reporting only relative effect measures was potentially misleading: Some good practices for improving the soundness of epidemiological results. J. Clin. Epidemiol. 137, 195–199. doi: 10.1016/j.jclinepi.2021.04.006
R Core Team (2023). R: A language and environment for statistical computing. Vienna: R Foundation for Statistical Computing.
Renkl, A. (2022). Meta-analyses as a privileged information source for informing teachers’ practice? Zeitschrift Pädagogische Psychol. 36, 217–231. doi: 10.1024/1010-0652/a000345
Rochnia, M., Radisch, F., and Kastens, C. (2023). Theory application in school and meaning-oriented learning opportunities at university—resources for teaching quality. Educ. Sci. 13:381. doi: 10.3390/educsci13040381
Schmidt, K., Edelsbrunner, P. A., Rosman, T., Cramer, C., and Merk, S. (2023). When perceived informativity is not enough. How teachers perceive and interpret statistical results of educational research. Teach. Teach. Educ. 130:104134. doi: 10.1016/j.tate.2023.104134
Seidel, T., Mok, S. Y., Hetmanek, A., and Knogler, M. (2017). Meta-analyses on teaching effectiveness and their contribution to the realization of a Clearing House Unterricht for teacher education. Zeitschrift Bildungsforschung 7, 311–325. doi: 10.1007/s35834-017-0191-6
Slavin, R. E. (2020). How evidence-based reform will transform research and practice in education. Educ. Psychol. 55, 21–31. doi: 10.1080/00461520.2019.1611432
Trevena, L. J., Zikmund-Fisher, B. J., Edwards, A., Gaissmaier, W., Galesic, M., Han, P. K., et al. (2013). Presenting quantitative information about decision outcomes: A risk communication primer for patient decision aid developers. BMC Med. Inform. Decis. Making 13:S7. doi: 10.1186/1472-6947-13-S2-S7
Visscher, A. J., and Coe, R. (2003). School performance feedback systems: Conceptualisation, analysis, and reflection. Sch. Effect. Sch. Improvem. 14, 321–349. doi: 10.1076/sesi.14.3.321.15842
Keywords: large-scale assessment (LSA), reading literacy, teacher education, data literacy, science communication
Citation: Ludewig U, Becher L and McElvany N (2025) How useful are interpretation aids for communicating large-scale assessment results to teachers? Front. Educ. 10:1515281. doi: 10.3389/feduc.2025.1515281
Received: 22 October 2024; Accepted: 21 October 2025;
Published: 12 November 2025.
Edited by:
Michael Grosche, University of Wuppertal, GermanyReviewed by:
Michael Rochnia, University of Wuppertal, GermanyNina Jude, Heidelberg University, Germany
Copyright © 2025 Ludewig, Becher and McElvany. This is an open-access article distributed under the terms of the Creative Commons Attribution License (CC BY). The use, distribution or reproduction in other forums is permitted, provided the original author(s) and the copyright owner(s) are credited and that the original publication in this journal is cited, in accordance with accepted academic practice. No use, distribution or reproduction is permitted which does not comply with these terms.
*Correspondence: Ulrich Ludewig, bHVkZXdpZy51bHJpY2hAZ21haWwuY29t