 Clarissa Reyes1
 Amy Wagler
- 1Department of Mathematical Sciences, The University of Texas at El Paso, El Paso, TX, United States
- 2Department of Public Health Sciences, The University of Texas at El Paso, El Paso, TX, United States
- 3Research, Evaluation, Assessment Services, The University of Texas at El Paso, El Paso, TX, United States
Introduction: This manuscript explores the development of key academic indicators among underrepresented minority students engaged in biomedical research training. Focusing on research trainees at a minority-majority Hispanic-Serving Institution (HSI), the study examines the structural changes and co-variation in student reported measures of science identity, research self-efficacy, and academic self-concept over two time points, spanning the begining and conclusion of research training in biomedical sciences.
Methods: Using Exploratory Graph Analysis (EGA) models, the analysis obtained from biomedical research trainees models changes in the associations between these indicators. The study also investigates how network structure varies by gender and ethnicity, in order to examine any differences in the experiences of male, female, Hispanic, and non-Hispanic students undergoing biomedical research training at an HSI.
Results: The analysis reveals important differences in the experiences of male, female, Hispanic, and non-Hispanic students undergoing research training at an HSI. The findings underscore the importance of these constructs in shaping student success, particularly noting the positive relationship between research self-efficacy and science identity.
Discussion: The findings offer insights for fostering minority student retention and success in STEMM fields by highlighting the role of science identity and research self-efficacy.
1 Introduction
This study hypothesized that understanding the experiences and development of undergraduate students engaged in biomedical research training is essential for promoting equity and inclusion among underrepresented populations in STEMM fields. Despite an increase in doctoral degree attainment by underrepresented minorities from 2011 to 2020, representation in STEMM remains disproportionate to the overall population (NCSES, 2023). Notably, only 26% of these degrees are awarded to underrepresented minorities, with Hispanic/Latinx students comprising just 9%.
Key indicators of biomedical inclusion, which include science identity, research self-efficacy, and academic self-concept, play a critical role in shaping retention and advancement. However, underrepresented students consistently report lower levels of these indicators, contributing to reduced persistence in STEMM majors and fewer pathways to advanced graduate study (Estrada et al., 2018). The development and interplay of these constructs over time remain insufficiently understood, particularly for underrepresented populations.
This research investigates how students’ perceived levels of science identity, research self-efficacy, and academic self-concept evolve during biomedical research training. Focusing on participants in a rigorous biomedical research program at a large research-intensive HSI, this study analyzes changes in these constructs at two key time points—program onset and conclusion. The findings will clarify how these indicators co-develop structurally over time and explore variations of these structural relationships by gender and ethnicity. Ultimately, the results of this study will provide critical insights into fostering more inclusive and equitable biomedical education environments.
2 Literature review
Research self-efficacy and science identity are two related constructs that are frequently utilized to examine students’ development in STEMM majors and research training. Researchers have studied different models of research self-efficacy highlighting the ways in which self-efficacy and science identity serve as mediators for science achievement (Alhadabi, 2021). Adedokun et al. (2013), for example, found that research self-efficacy predicts student aspirations and desire to persist in science fields, suggesting that self-efficacy mediates research skills. A more recent study examined the relationship of science identity and gender, ethnicity, home science support, parental education, and experiencing science talk in the home and found a strong relationship between those indicators and, in particular, gender and home support (Dou and Cian, 2022). Another study examined the relationship between science identity and sources of self-efficacy among minority undergraduate STEM majors (Flowers and Banda, 2016). They found that students who identified strongly as scientists were more likely to have high levels of research self-efficacy, suggesting that science identity plays an important role in the development of research self-efficacy.
In a related study, Chemers et al. (2011), students described their science support experiences (i.e., research experience, mentoring, and community involvement), psychological variables (i.e., science self-efficacy, leadership/teamwork self-efficacy and identity as a scientist), and commitment to pursue a career in science research. They found that research self-efficacy and identity as a scientist mediated the effects of science support experiences and predicted their commitment to pursue a career in science research. Similarly, science self-efficacy and identity as a scientist mediate the association between support programs and students’ commitment to STEM careers (Chen et al., 2020; Syed et al., 2019). Another study found that research experience during the fall of the first year of undergraduate predicted higher science identity during their second year and was mediated by science self-efficacy during spring of the first year of undergraduate studies (Robnett et al., 2015). In addition, undergraduate research experiences have been shown to influence minority students’ career ambitions (Carpi et al., 2017). On a related note, there have been studies that show the importance of undergraduate research experiences and research mentoring on these key indicators. For example, Apriceno et al. (2020), found that students who had a research mentor during the first year in college reported higher academic self-efficacy by the end of the year, compared to those without a mentor. Another study, Endo and Harpel (1982), investigated the effect of student-faculty interactions on student educational outcomes after 4 years. They found that frequency of formal and informal interaction, quality of faculty advising, and helpfulness of faculty had positive effects on intellectual and social outcomes of college students. Betz et al. (2021) found that undergraduate research opportunities promote recruitment, retention, and inclusion of students from underrepresented groups in STEM (rather than STEMM) disciplines, in particular, the key indicators of identity and academic self-concept. Collectively, the literature supports that these three indicators are salient factors in developing a high propensity toward pursuing a STEMM major and career.
Note that none of these studies investigated concurrent changes in these key measures and, additionally, did not consider the impact of structural or latent changes in constructs while students undergo research training as undergraduate students. By latent or structural changes, we refer to changes in the dependency structure of the items at both the item level (individual questions belonging to a particular scale) and at the construct level (cohesive constructs informed by individual items or questions). This is necessary to emphasize, since the structure of these commonly used scales is assumed to hold over time and across subpopulations (Cobian et al., 2024). Past research has presumed this assumption holds and made conclusions based on it. In contrast, this study takes a broader perspective and investigates the associations between these constructs and studies structural or latent changes simultaneously, with keen attention to important subpopulations of student research trainees. In summary, this study will examine the relationship among the key indicators for students undergoing STEMM research mentoring and examine important structural changes that occur across the entire participant sample, as well as gender and ethnicity subpopulations.
The research questions examined in the study are the following:
RQ1: Is there structural change in the academic self-concept, science self-efficacy, and science identity over time of biomedical research trainees?
RQ2: Is there structural change in the academic self-concept, science self-efficacy, and science identity across gender and ethnic subpopulations for biomedical research trainees?
RQ3: Is there a high-order positive relationship between change in science self-efficacy and science identity when accounting for the item structure in the aggregate population of biomedical research trainees?
3 Materials and methods
The focus of the analysis is to explore the change in the latent structures of research self-efficacy, science identity, and academic self-concept over time and across subpopulations. In the following, we summarize the measures used in the study.
3.1 Setting
El Paso, Texas, and Ciudad Juarez, Mexico, are neighboring cities located along the western Texas border with Mexico. This region, predominantly inhabited by bilingual Spanish and English-speaking households, forms one of North America’s largest bilingual and bicultural metropolitan areas. El Paso itself has a predominantly Hispanic population, accounting for 83% of its residents. However, despite its cultural richness, the area faces significant socioeconomic challenges, with 21% of families living below the poverty line, higher than both the state of Texas (14%) and the national average (11.5%). The median household income in El Paso County is notably lower than state and national averages, standing at $55,417 compared to $73,035 and $75,149, respectively. Additionally, educational attainment levels are lower in El Paso County, with only 25% of citizens holding a bachelor’s degree or higher, compared to 32.3% in Texas and 34.3% nationally.
The University of Texas at El Paso (UTEP) mirrors the demographic composition of its surrounding community, with approximately 84% of its population being Hispanic. UTEP stands out as a leading research university serving an underrepresented demographic in the 21st century, with almost half of it’s over 23,000 students being the first in their families to attend college. These characteristics underscore the pressing need for effective educational interventions in this community. Moreover, successful interventions here can serve as valuable models for addressing educational challenges in other settings, benefiting students from minoritized racial/ethnic groups and marginalized socioeconomic backgrounds.
3.2 Procedure
Data was collected between 2016 and 2019 on students participating in a biomedical research training program titled BUILDing SCHOLARS (BUILD) at a Carnegie-classified R1 HSI research institution in the Southwestern United States. The BUILD program aims to provide educational development, professional development, and financial support to recipients enrolled in a biomedical major, as classified by the National Institutes of Health (NIH) at UTEP, and through these means increase the presence of minorities in research. This study analyzes the responses to surveys intended to measure students’ self-perceived levels of research self-efficacy, science identity, and academic self-concept. Students are asked to take a survey every year they participate in the program, and our goal is to characterize the changes in survey response structure as students advance in their studies while enrolled in the BUILD program. The data collected was part of the Mentored Research survey, which is administered in May at the end of every academic year to all current BUILD fellows and students enrolled in a free, 0-credit research course. Students at UTEP are asked to enroll in this free, 0-credit course by their respective professors/mentors as a way of documenting their participation in research on their transcripts. The survey is administered 1 week before the semester ends and is kept open for up to 2 weeks after finals to allow for optimum response rates. This survey is administered each year, but we pulled data from the years spanning 2016–2019, a period with consistent data collection and intact cohorts of trainees.
The data pre-processing took the following approach: all data available between the years 2015–2020 were collected and stored in an online shared folder. The data was combined in a statistical software package. Student scores and demographics were extracted where there were two matched time points that were at least 2 years apart—the first time point having come from either the freshman or sophomore year and the second time point coming from either the junior or senior year of their undergraduate degree.
3.3 Measures
The data collected from students undergoing intensive research training in the biomedical sciences at UTEP included a tracker identification number for each student, the year the survey was taken, income level, ethnicity, gender, and a binary indicator for disability. Additionally, research self-efficacy (Hu et al., 2022), science identity (Flowers and Banda, 2016), and academic self-concept (Guo et al., 2022) scales measure student attributes as described in Table 1.
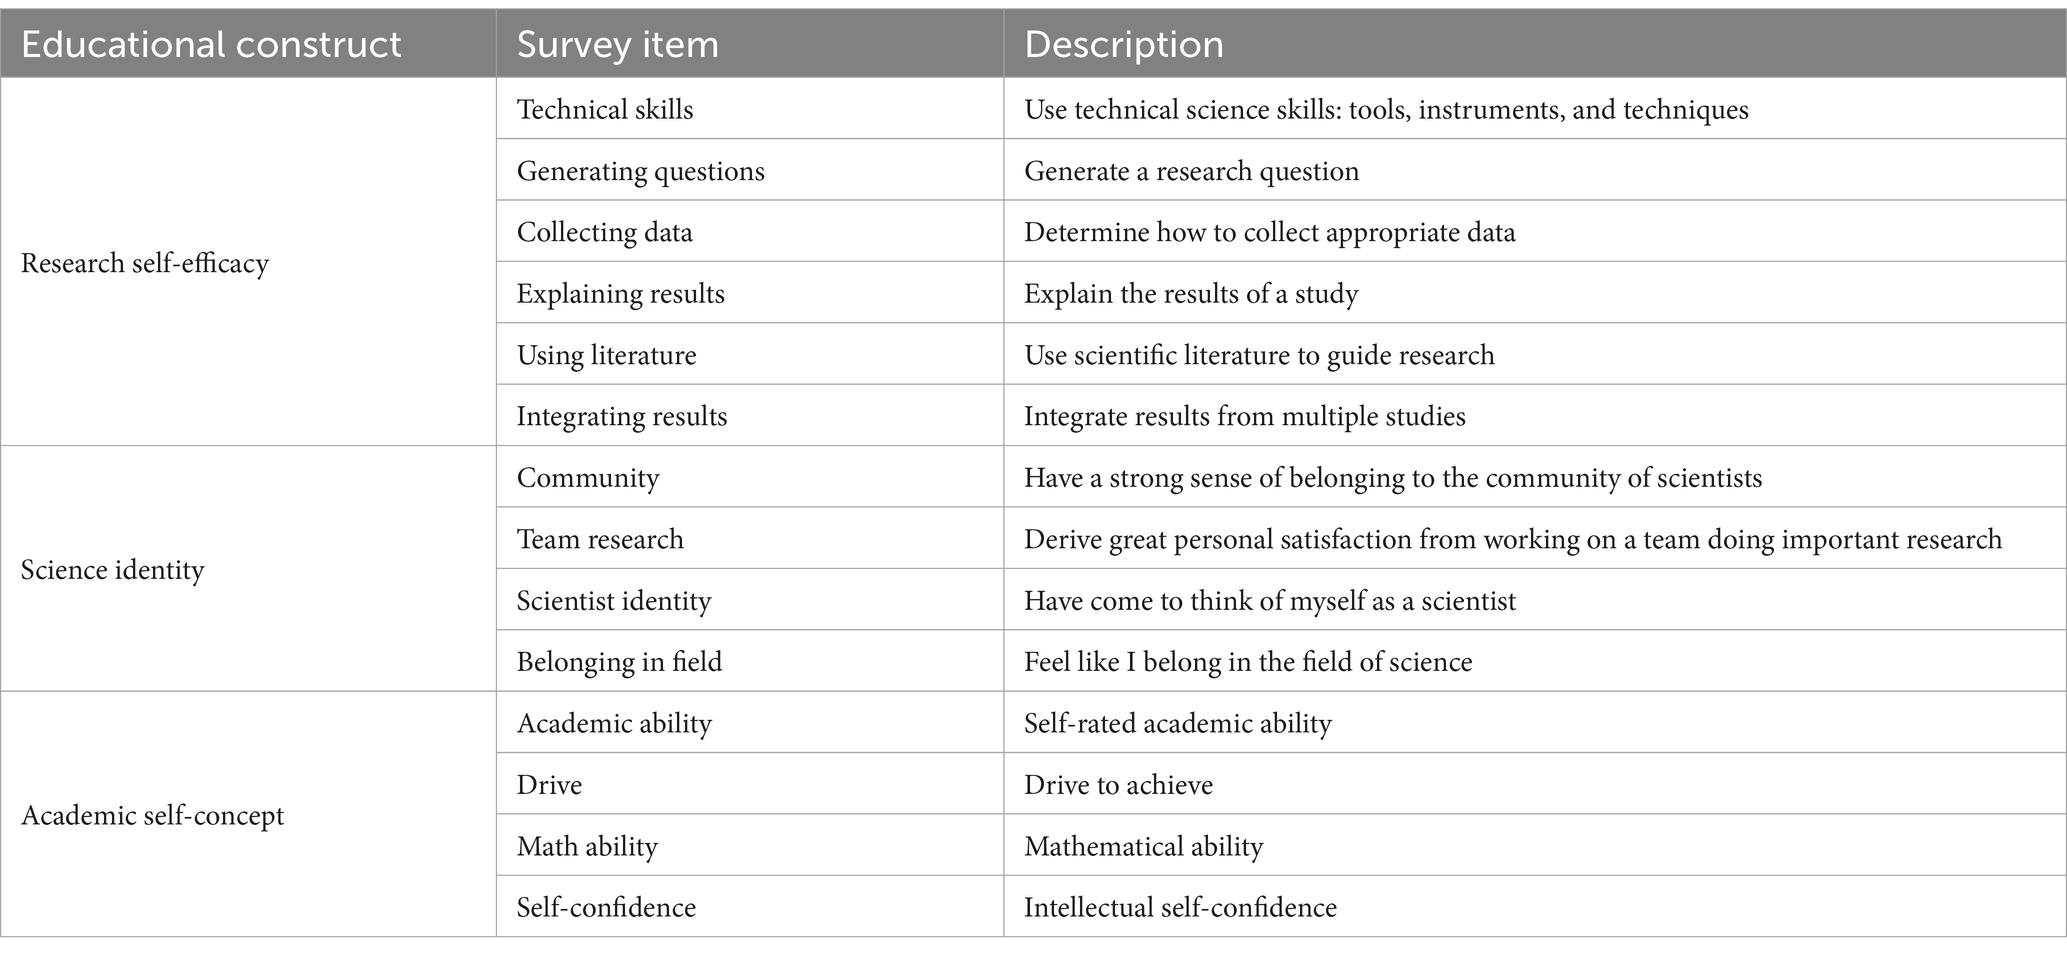
Table 1. Survey item descriptions by educational construct.
3.4 Statistical analysis
Although factor analysis is often used in psychological research to identify the underlying structure of a set of variables, there are limitations to this approach. Exploratory factor analysis (EFA) assumes the scores can be linear combinations of the items included. However, with many psychological constructs, a non-linear relationship is more likely to exist. In contrast, an exploratory graph analysis (EGA) framework estimates symmetric graphical networks, which identify the structure of the associations present among survey items, and the number of dimensions present in the data (Golino and Christensen, 2023). This does not require linear combinations of the items to extract factor scores but allows a more flexible parameterization. Network models are effective at depicting the relationships present among a set of objects and the EGA framework is an attractive approach to use for estimating the number of dimensions present in psychological multivariate data. Unlike EGA, factor analysis compares the fit of structural models, which are systems of linear equations, with different numbers of factors, then determines the optimal number of factors based on a predetermined index (Golino and Epskamp, 2017). This is limiting and can result in spurious identification of latent constructs. Moreover, EGA has been shown to out-perform factor analysis in latent structure estimation (Golino and Epskamp, 2017), due to its ability to handle non-linear systems of equations. EGA offers not only the estimated number of dimensions, but also a predicted item membership corresponding to these dimensions.
The EGA model, once estimated, identifies the association structure among a set of covariates. Then, capitalizing on the estimated association structure, a community detection algorithm can be applied to identify latent structures (scales) of the responses arising from the three scales of interest, science identity, research self-efficacy and academic self-concept (Golino et al., 2020). The results provide information about the construct validity of the scales for the research trainee cohort, much as a factor analytic model would. As mentioned previously, the EGA model is shown to be more accurate in identifying latent structures in data than traditional factor analytic approaches and provides additional information regarding the association between the latent constructs (Golino and Epskamp, 2017).
Regarding detection of community structure, several algorithms should be applied and compared. This provides multiple views of the exploratory community structures among the items. In particular when clustering results are theorized a priori, as in this study, multiple algorithms should be applied to determine which method is consistent with the theorized structure (Christensen et al., 2020). For this study, the Walktrap algorithm is employed for community detection since it results in the highest modularity as criteria for determining the clustering method and incorporates the leading eigenvalue algorithm for assessing unidimensionality. Two other community detection algorithms, Leiden and Louvain, were also applied to the graphical model. While the Louvain algorithm produced similar clustering results as the Walktrap algorithm, the Leiden algorithm failed to find an optimal clustering result and did not produce an identifiable structure. We analyzed the community structures reported for any poor attributes, such as a subnetwork that is not well-connected (Traag et al., 2019) and found no issues with network connectedness.
3.4.1 Methods for detecting network and subnetwork change
With focus on assessing structural changes in the networks and subnetworks (latent structures), we will investigate changes in associations among survey questions and latent structures over time and across subpopulations. A preliminary approach to make these network comparisons is by computing descriptive measures of the networks and making direct comparisons between the values or by computing statistical measures for detecting network change. Table 2 summarizes the network statistics and attributes of interest that are directly obtained from the estimated graph models. These values will be provided in the results section as an exploratory summary of changes in models across time and population.
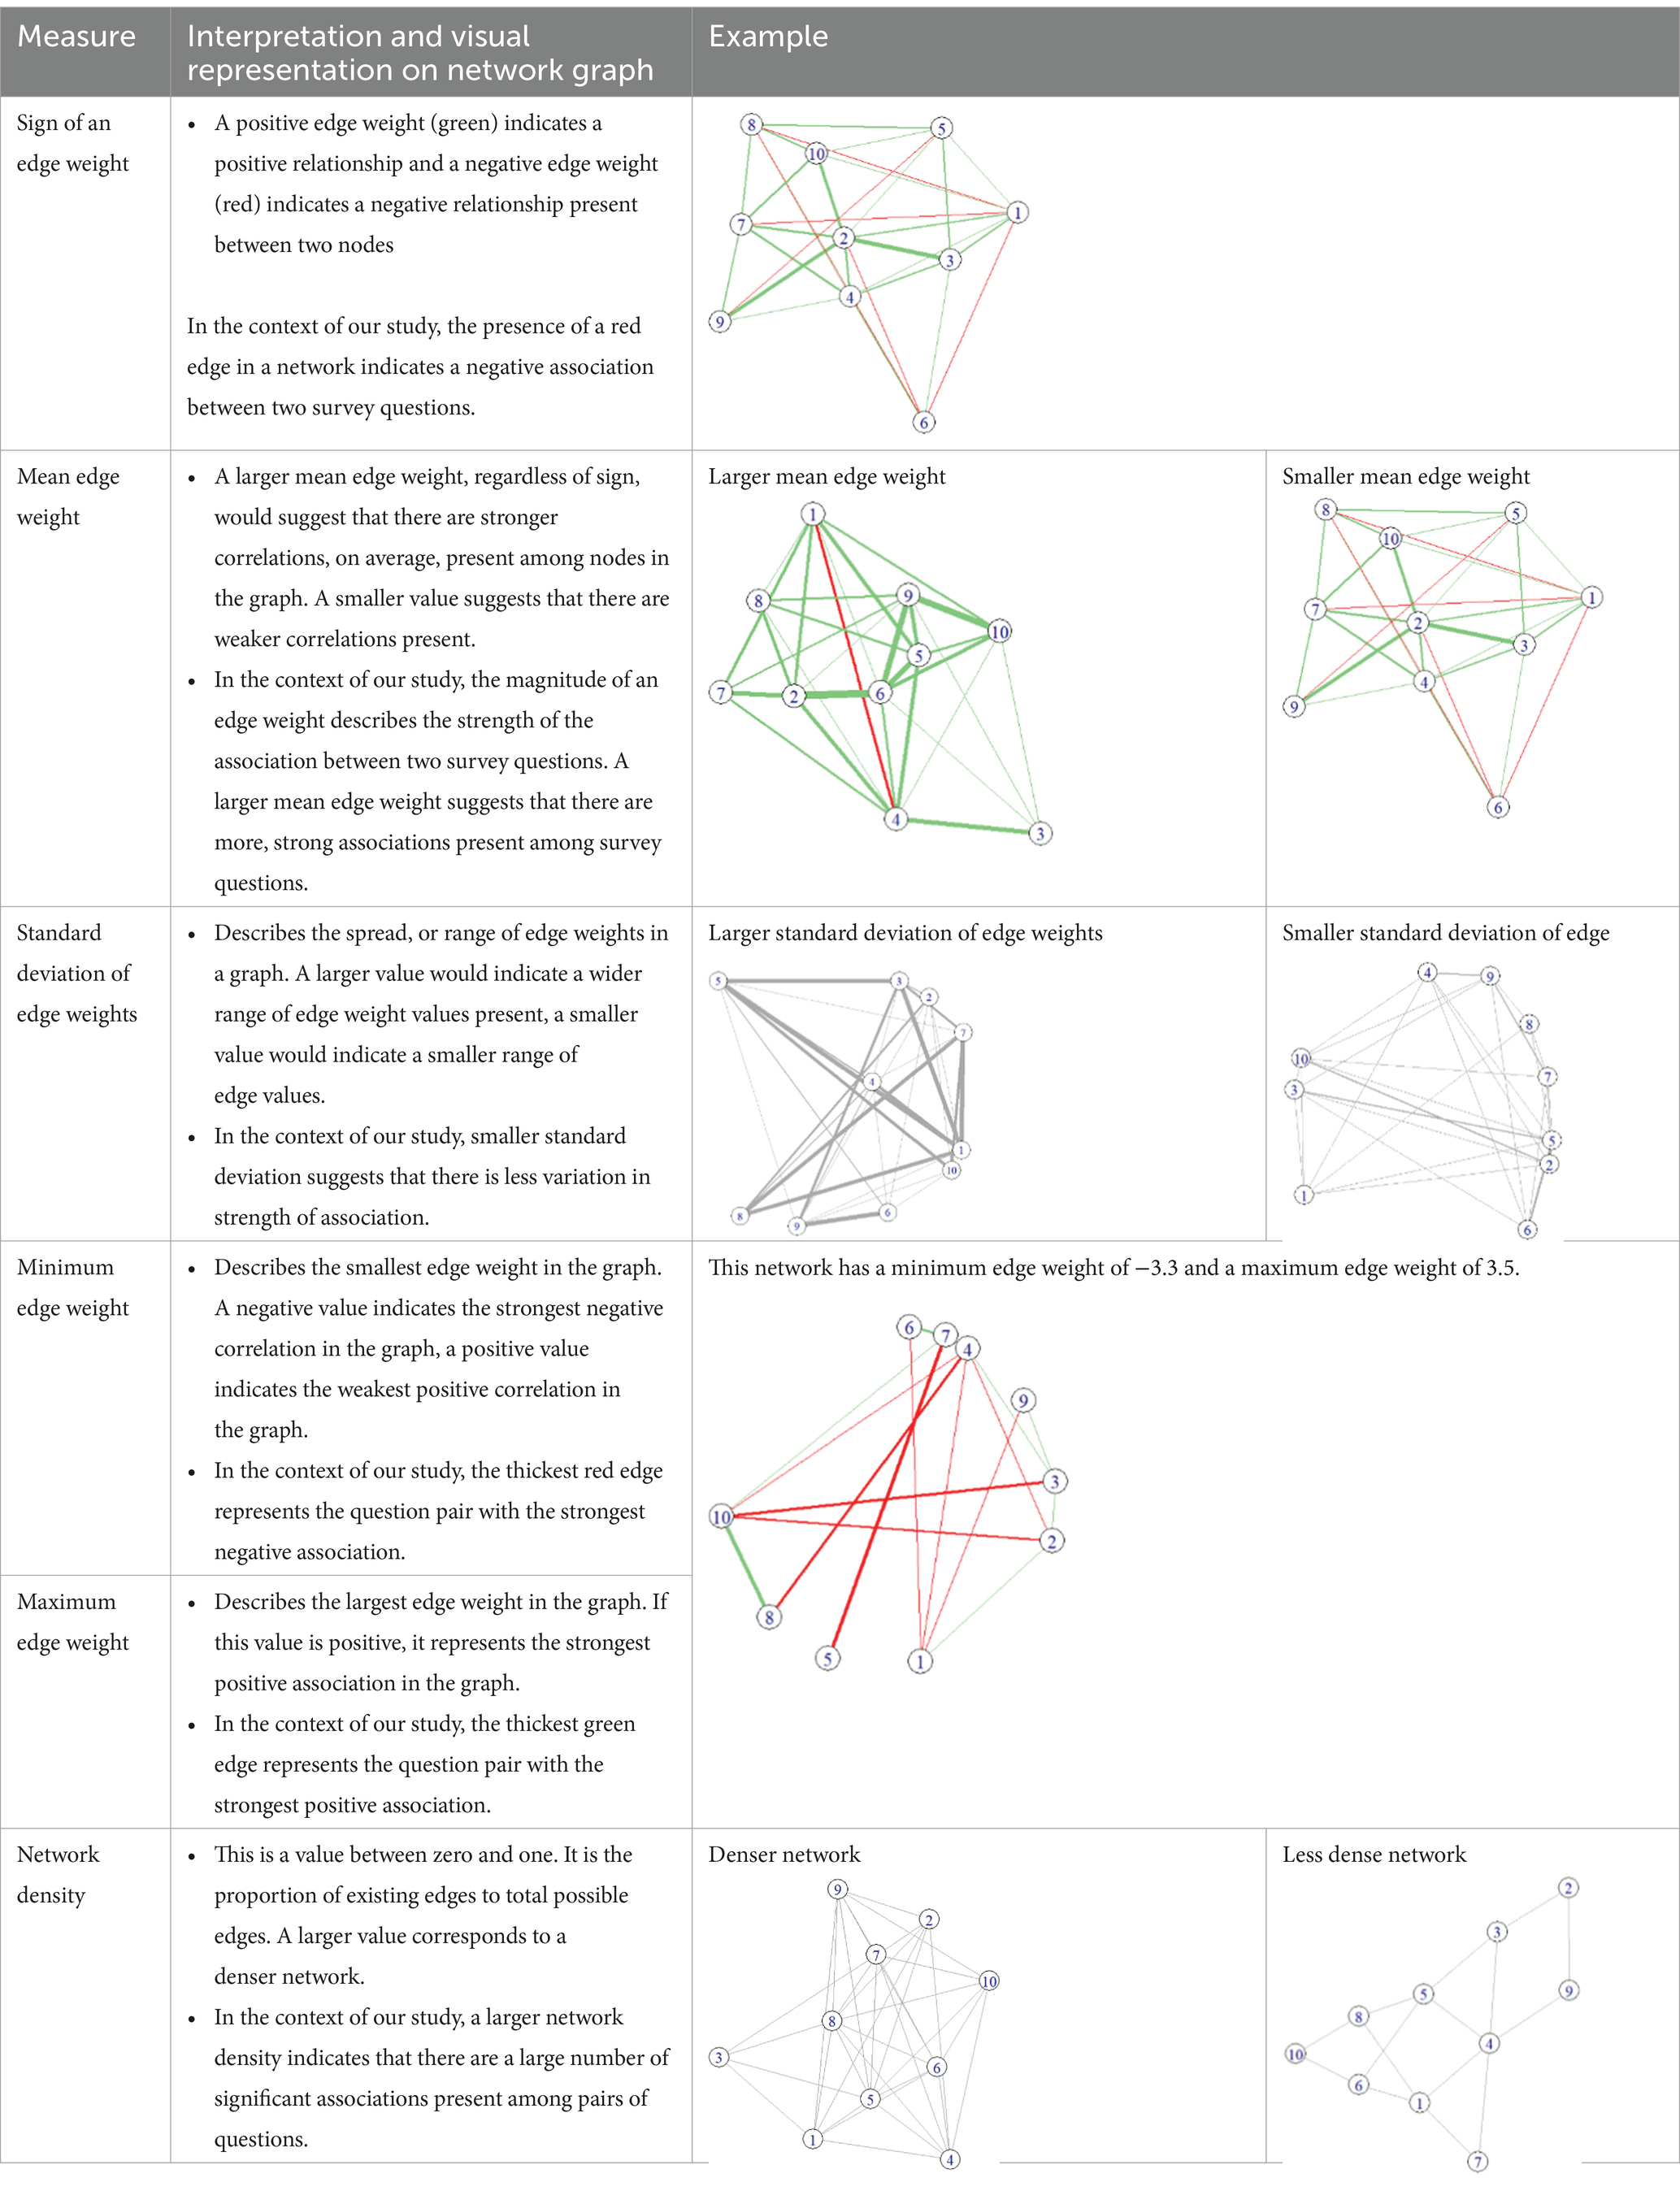
Table 2. Graph characteristics characterizing differences across networks.
3.4.2 Comparison of networks with known-node correspondence metrics
Though side-by-side comparisons for network descriptive measures, as those described in Table 2, may provide a preliminary overview of these structural changes, a formal mechanism for assessing network change is ideal. Thus, heuristic measures that allow us to obtain a general summary of the changes from the early-stage network to the later stage are a starting point, which is exploratory in nature, and will be followed up by measuring more specific changes in graph model structure. To compare networks directly, we employed known-node correspondence (KNC) measures (Tantardini et al., 2019; Wills and Meyer, 2020). KNC methods assume that the networks utilize the same node set and that the pairwise correspondence between nodes is known. Of the available KNC measures, we employed the cut distance (Liu et al., 2018), Deltacon, and weighted Hamming distance metrics for quantifying changes in the predefined constructs of science identity, research self-efficacy, and academic self-concepts from the early checkpoint to the later checkpoint as well as across subpopulations. These three metrics are a reasonable choice because they each provide information about varieties of network change. For example, Deltacon measures are sensitive to not only simple edge changes in the network, but also changes involving 3, 4, or more edge changes. This is intuitive since connected nodes are part of a latent construct with other corresponding nodes in the subgraph. We also included cut distance since it is particularly sensitive to community detection changes. Finally, we also include the Hamming distance because it is a standard method that provides overall feedback of any change in the network (not particularly sensitive to k-step changes as is Deltacon or community detection as cut distance).
3.4.3 Rank score characteristic function for KNC metric summary
Consider that the three KNC scores for networks each have a particular perspective or frame for detecting network change. The three KNC scores are like three “judges” of network change that can differ but should ultimately show alignment. In essence, each KNC measure assigns a score that reflects from a particular perspective network differences. However, there can be disagreement among these scores that a simple mean score does not accurately reflect. For example, two networks could have mean scores of the same value but different levels of dispersion. If networks 1 and 2 both have a mean of 3 for KNC scores, with one set of scores being 1, 3, and 5 and the other set being 3, 3, 3, these are very different results. To address this issue among the KNC metrics and provide a cohesive way to interpret these scores, we employ a known method called the rank score characteristic (RSC) function (Hsu et al., 2019; Conover and Iman, 1981). The RSC function provides a mechanism to take all three metrics into account simultaneously and devise a ranking of change among the populations or subgraph units. Conover and Iman (1981) describe the rank transformations as a mechanism linking parametric and non-parametric statistics. For network change metrics, it is a cohesive summary of all three metrics into one non-parametric statistic. This will allow us to determine which groups of students and which constructs show evidence of the least and most change across research training. This approach is non-parametric and generalizable to any scenario where multiple scores are given to units and a summary is desired.
3.4.4 Hierarchical EGA
To visualize the changes seen among constructs with a focus on lower-order and higher-order network changes, we implement the hierarchical EGA method (Samo et al., 2023), which uses the network loadings from the lower-order measures to estimate network scores. Then, these lower-order network scores are used to estimate the higher order network. The higher-order network reflects the underlying structure, or latent construct, of the three constructs of interest in this study—science identity, research self-efficacy, and academic self-concept. The difference between this approach and the previous modeling with the community detection algorithm is that the hierarchical EGA allows us to focus on the associations at the higher-order, between the three latent constructs, in a way that is informed by the association structure at the item-level. This is a more cohesive way to assess the high-order associations between these constructs and permits inference at the construct level. For example, using the hierarchical EGA we can investigate the association between science identity and research self-efficacy as constructs and build a network model at this higher-level of measurement. Typically, this would be done using sum scores or means, but hierarchical EGA approach allows the association analysis at the higher-order dimension to be conducted in a manner consistent with the empirically validated identification of the latent construct. Once the higher-order edges are calculated, we will be able to see the associations more clearly between the three primary constructs. We explore these associations using the difference scores for the early stage and late stage timepoints. This is consistent with a paired data approach. This is the preferred approach for this setting because we are focused on our research hypothesis that research self-efficacy changes are positively associated with science identity changes. The hierarchical EGA allows us to test this hypothesis, by using the difference between early and late-stage data to build the model. We note that since the implementation of the hierEGA function in the EGAnet package in R (R Core Team, 2024) is still in the experimental phase, it is important to note that the function itself and the results may be seeing change until the output of the function is thoroughly corroborated (Golino and Christensen, 2023).
4 Results
4.1 Descriptive network statistics
The data set contained information from 1,111 students and included seven descriptive variables and 14 ordinal numerical variables that contained the scores for each of the survey items being studied. The responses retained were those where the student had two time points (pre and post), which excluded 837 students who only answered one or the other survey and included 235 respondents. There was missing data for gender and ethnicity classifications such that 111 of the 235 respondents did not indicate a gender, 9 indicated something other than male or female for gender, and 99 responses for ethnicity were missing. Due to the large proportion missing, we did not feel it warranted to perform an imputation to replace the missing values with gender or ethnicity classifications. Hence, the lack of response on these two measures may introduce a non-response bias. A big-picture summary of our sample, 235 matched pairs with at least a two-year gap between responses, can be seen in Table 3. Due to the paired structure of the data, naturally, the number of students matches at the early to late-stage checkpoints. To characterize the behavior of the responses recorded in this survey, we reported three descriptive statistics for construct scores for each of the three constructs: mean, standard deviation, and interquartile range (IQR). We can see that for the full sample, academic self-concept is the construct with the largest mean response and science identity has the largest standard deviation in responses. We can also see that across most demographics, science identity and academic self-concept have a higher IQR than research self-efficacy. We can see differences among subpopulations, for example, females report lower average scores than males for all three constructs at both early and late checkpoints. Additionally, while non-Hispanics report higher average scores than Hispanics in research self-efficacy (at both early and late stage), the opposite is true for academic self-concept.
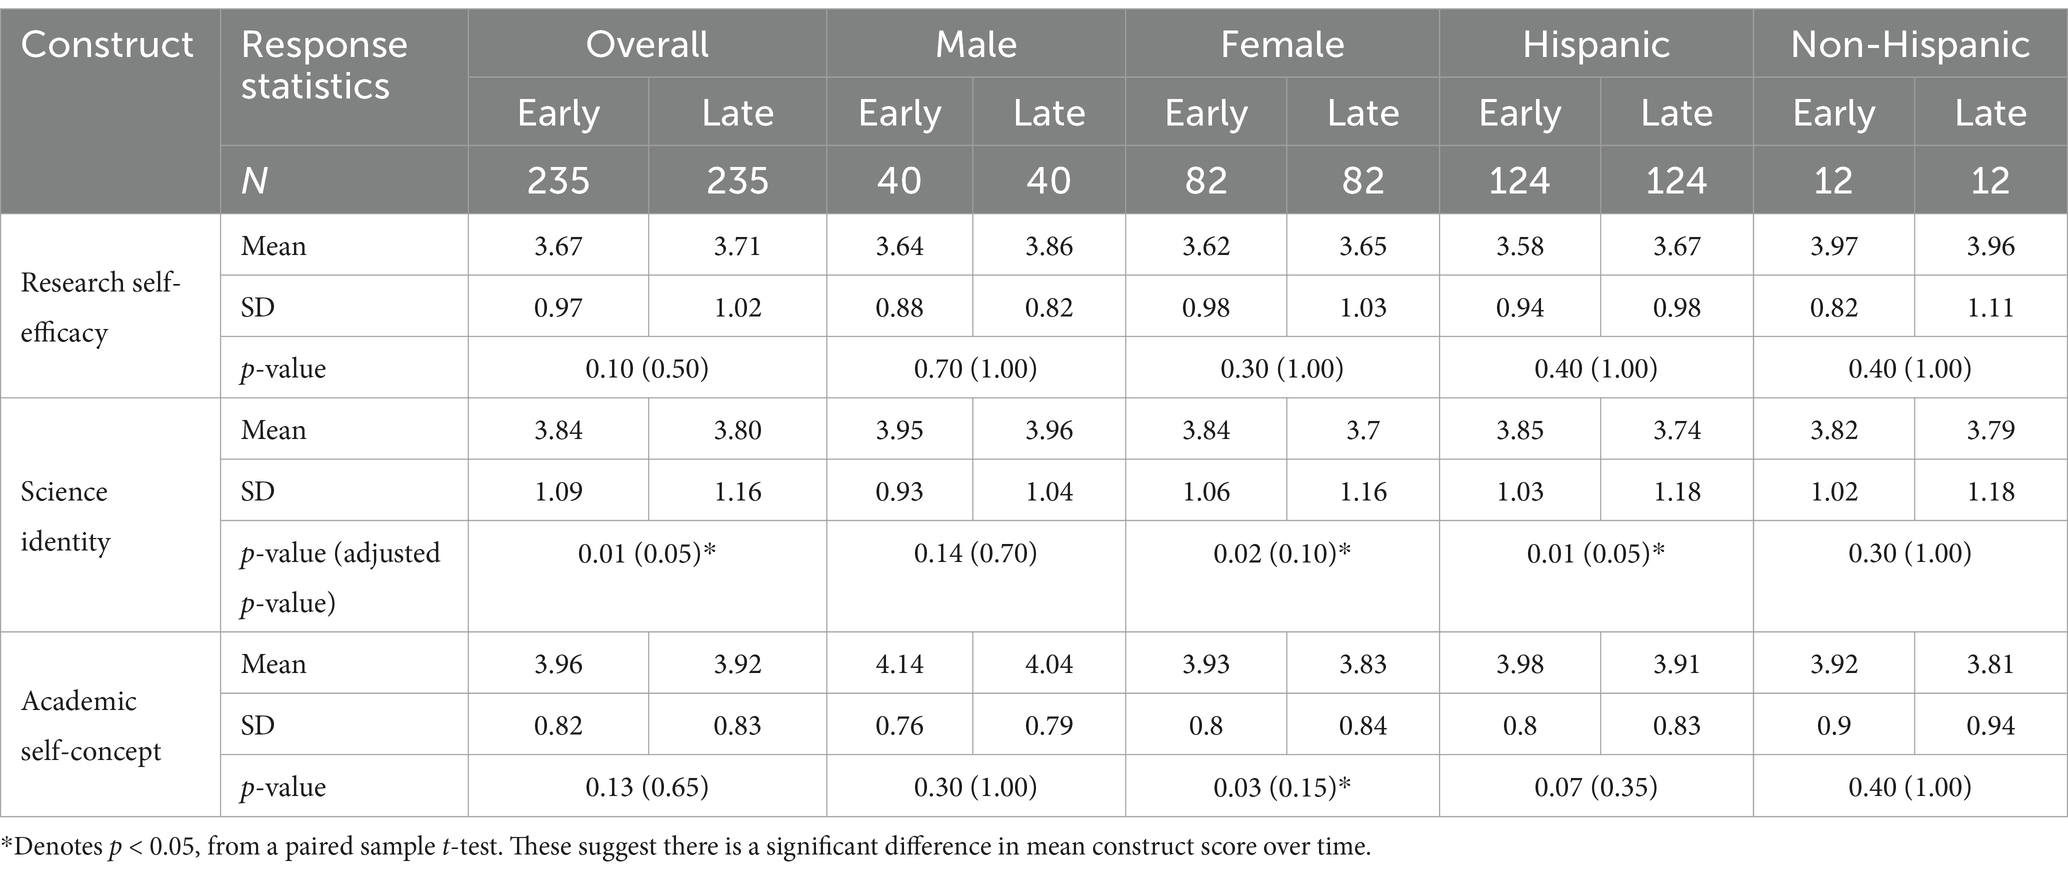
Table 3. Overall and subpopulation participant characteristics for early to late research stage.
Paired sample t-tests were conducted to identify significant differences in construct mean scores over time for the full sample, each binary gender, and binary ethnicity. These tests allow us to determine which of the changes in mean score seen in the table are noteworthy. Pairwise and Bonferroni corrected p-values are provided in the table, with the pairwise p-value leading and the Bonferroni corrected value in parentheses. In Table 3, there is no significant change in mean research self-efficacy scores from the early to the late checkpoint, for the full sample or any of the four subpopulations of interest. The full sample does, however, show a significant pairwise difference in mean science identity score over time, which is only marginally significant with the Bonferroni correction. Significant differences in mean scores can also be seen in female science identity and research self-efficacy, as well as Hispanic science identity. However, with the multiplicity correction, only Hispanic populations show some evidence of change in science identity. It is important to note that in all other analyses, we will be measuring changes in network structure, which is entirely different from assessing changes in the mean score values themselves. As detailed in the methodology section, assessing changes in network structure will entail using KNC measures and applying an RSC function.
4.2 Overall early vs. late results
Figure 1 portrays the pair of networks generated for the entire population of research trainees. As a result of the community detection algorithm, the survey items are in fact correctly grouped by educational construct. Research self-efficacy is shown in orange, science identity is shown in blue, and academic self-concept is shown in yellow in both network plots. Although survey items have consistent groupings in the early and late stages, a visual inspection indicates that some of the associations among survey items change in strength from one network to another. A change in strength of association between two survey items would be visually detected by a change in the thickness of the line (edge) connecting them. For example, the edge between scientist identity and belonging in field—in the science identity construct—positively increases in association for early to late-stage research trainees. This indicates that the association between these two items increases over time, meaning that students were more likely to report having a stronger sense of belonging in their field if they had strong science identity late state research trainees. While this association is present in early-stage trainees, it is not quite as prominent as it is at the later stage. Also, trainees’ connection between scientist identity and community weakens over the early to late stages. We can see other notable changes in association by studying the graph. For example, the association between team research and community (also in the science identity cluster) becomes weaker from the early to late stage. Also, while the association between explaining results and technical skills in the research self-efficacy cluster is lost, an association between integrating results and collecting data is formed.
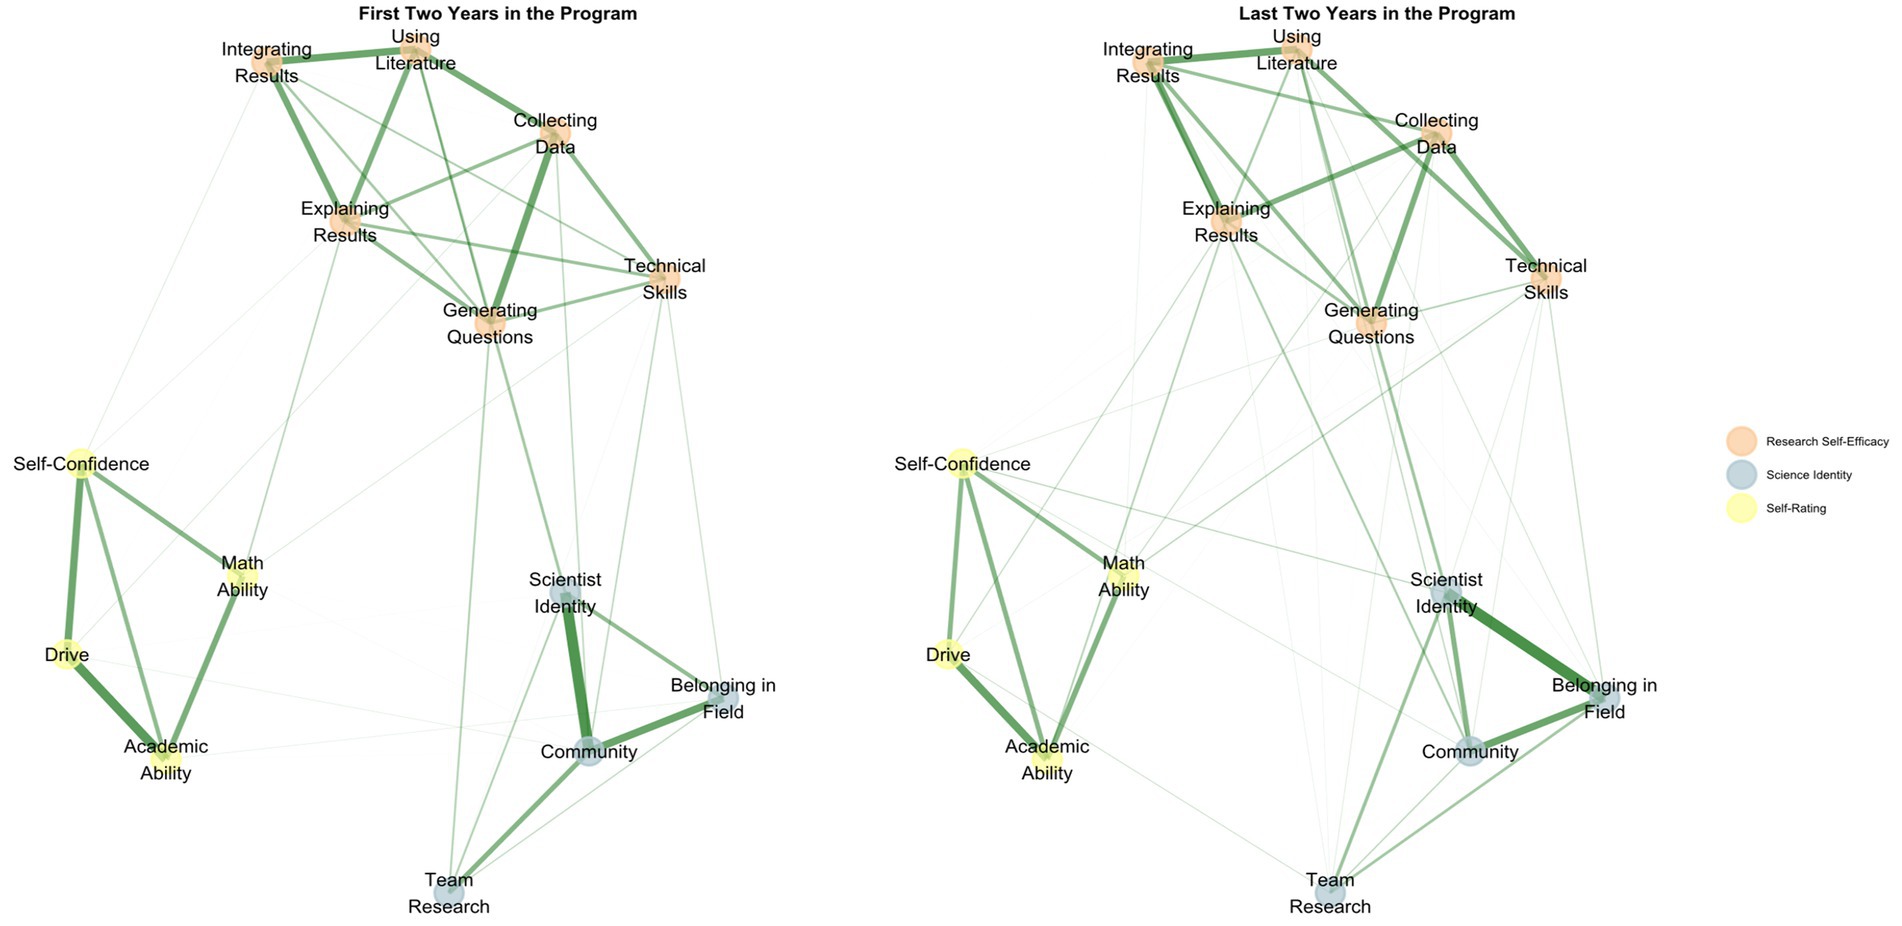
Figure 1. Illustration of early and late networks for biomedical research trainees.
To quantify all the changes seen in strength of association, a side-by-side comparison of network descriptive measures is shown in Table 4. It provides an initial summary of structural changes across both early and late networks. For example, we can see that there is a slight decrease in average edge weight and standard deviation from the early to the late network, but there is an increase in maximum edge weight. This might be due to the increased number of weak associations (represented by thin edges) that are present in the late network but not in the early network.
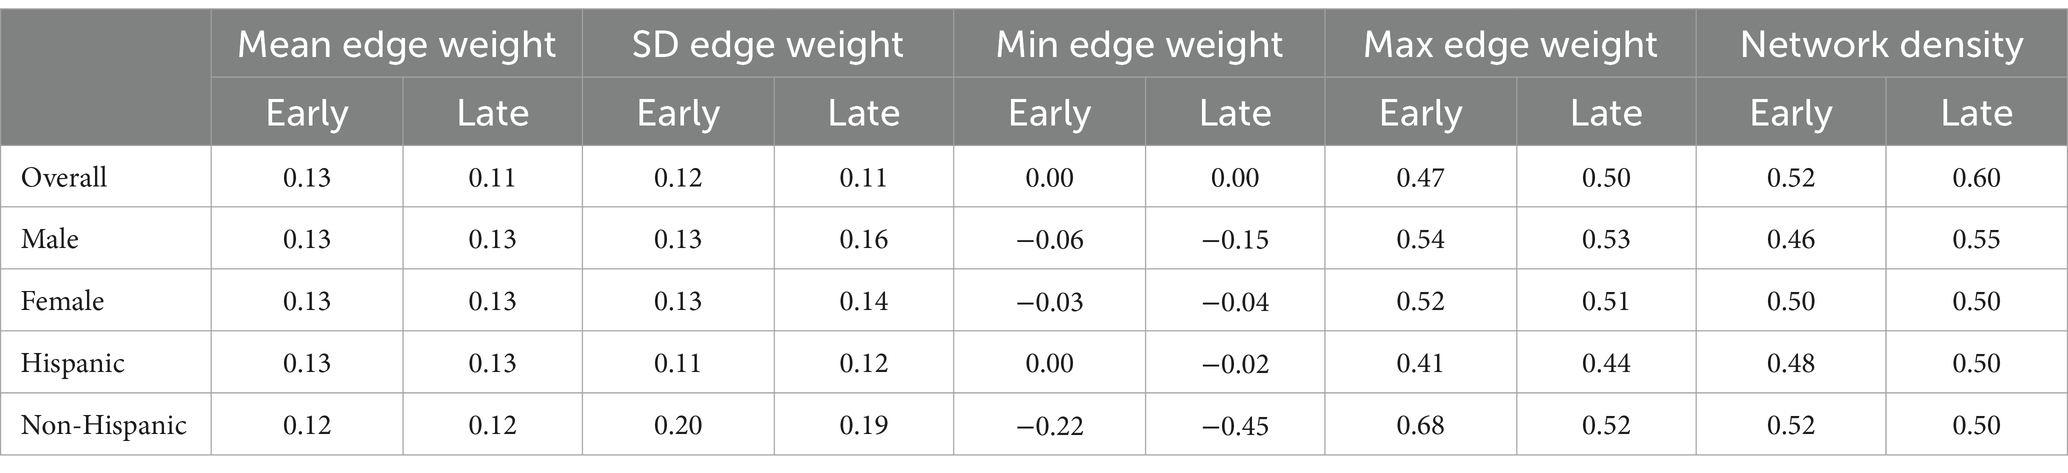
Table 4. Overall and subpopulation network characteristics for biomedical research trainees.
4.2.1 Results for subpopulations early vs. late-stage research trainees
Network comparisons were also made across gender and race for the three constructs of interest in this study. At an initial glance, the descriptive metrics also in Table 4 appear to show little evidence of change across subpopulations regarding mean edge weight, standard deviation of edge weights, or network density. However, minimum and maximum edge weight indicate noticeable differences across groups. For example, for the late-stage male network, the minimum edge weight is −0.15, which is more than triple the minimum edge weights for the late-stage female network. Additionally, the minimum edge weight for the early-stage Hispanic network is zero, meaning that there are no negative associations present in this network, which is not the case for either of the non-Hispanic networks. It also appears that the non-Hispanic networks have larger maximum edge weights than the corresponding Hispanic networks at both early and late stages. These differences within and across subpopulations indicate potential construct changes across these populations and over time. This will be further explored in the following section.
Illustrating how these heuristics appear as changes between networks, consider Figure 2, depicting a side-by-side comparison of early and late-stage networks by subpopulation. By means of this visual representation, two glaring differences are evident. First, the late-stage female network has two identifiable subclusters related to research self-efficacy. While all six of these skills belong to the research-self efficacy construct, collecting data and technical skills represent research skills of lower complexity, using literature and integrating results represent research skills of higher complexity. The female subpopulation may be picking up on what may be a difference between research-oriented skills versus technical skills needed for research. Here, we define research-oriented skills to be those that belong to the research-self efficacy cluster but require a higher level of cognitive complexity, while technical skills are those that entail exercising procedural abilities or knowledge. Another prominent difference in networks is the strong negative association between team research and math ability that is present in the late-stage non-Hispanic network, but not in the early-stage network. This is distinct to this cohort and not present in any other subpopulation. In a general sense, multiple negative edge weights appear in the subpopulations for male and non-Hispanic students that are not present in either female or Hispanic populations. These negative associations tend to be more frequently attached to the nodes corresponding to math ability and team research.
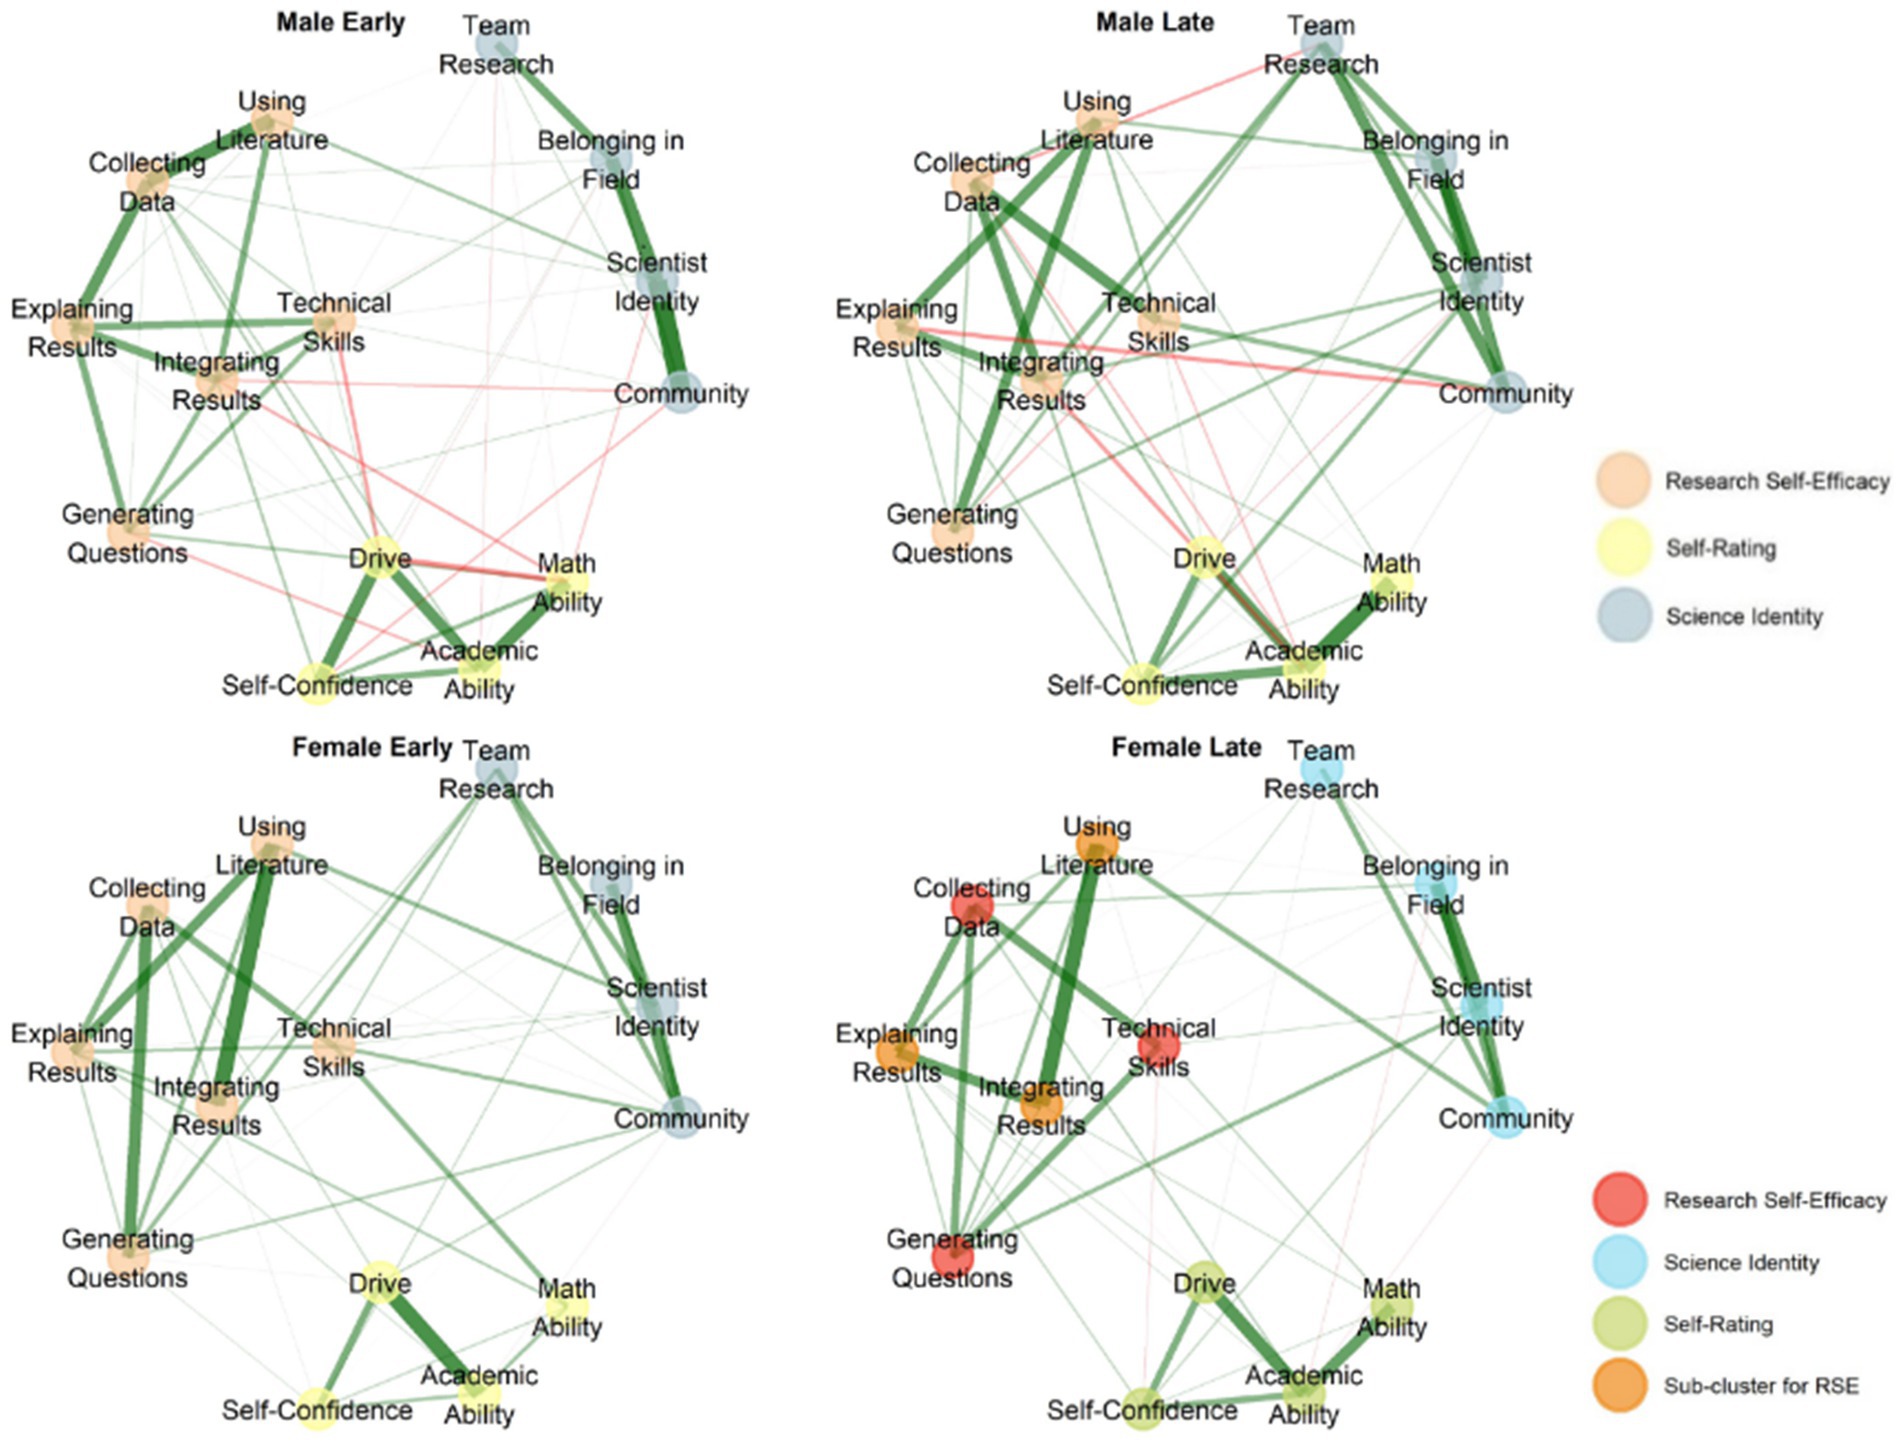
Figure 2. EGA network comparison by gender.
4.2.2 Formal comparison across subpopulation networks
To better quantify the overall level of change seen across subpopulation networks we calculate KNC metrics, and to determine which subpopulations saw the most and least amount of change we use the RSC function. Recall that KNC measures are those that quantify the magnitude of change from one network to another, when node correspondence is known across networks. In Table 5, three KNC metrics provide evidence that the male and non-Hispanic networks saw the highest levels of change across time, while the Hispanic networks saw the least amount of change. Additionally, since all three KNC metrics agree in their rankings, the overall similarity rank column – shows the same rankings as those produced by each of the KNC measures (shown in parenthesis).
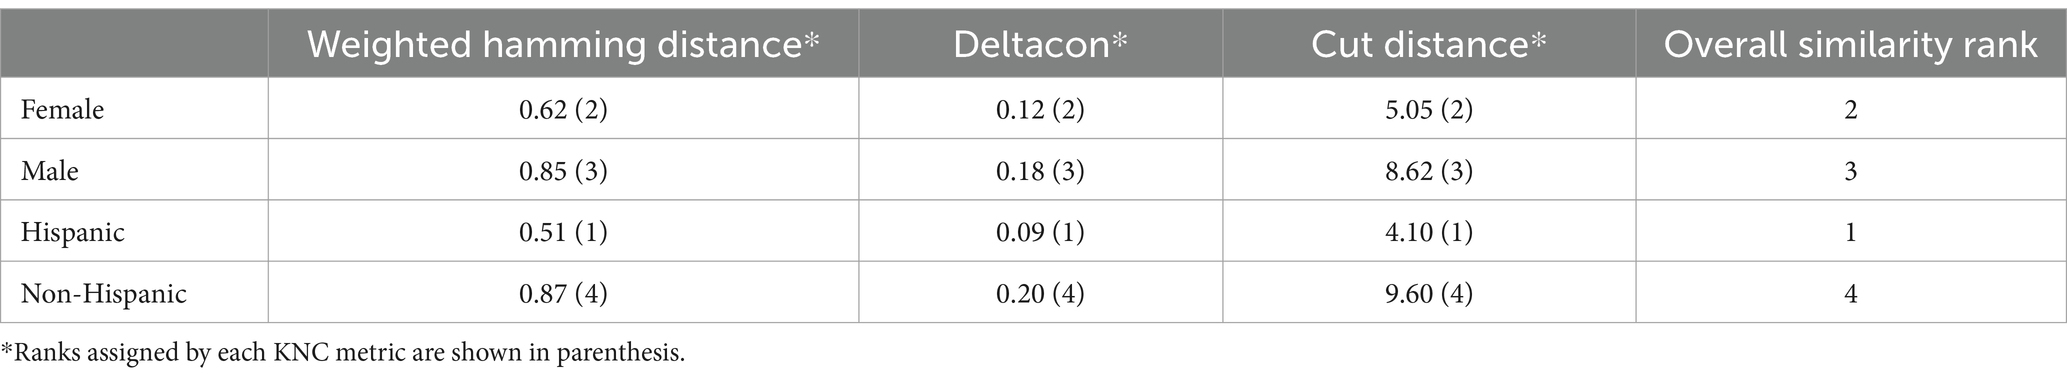
Table 5. Rank sum scores for combined network change metrics for comparing early to late networks across subpopulations.
4.2.3 Results for changes in constructs during research training
We generated early and late networks for each of the three hallmarks (science identity, research self-efficacy, and academic self-concept), then the same KNC measure and RSC function process was used to determine which of the constructs showed more change than the others over research training. Table 6 provides a summary of the three KNC network change statistics for each subnetwork (latent structure). These rankings indicate that the structure of the academic self-concept networks saw the least change across time, while the structure of the research self-efficacy networks saw the most change.
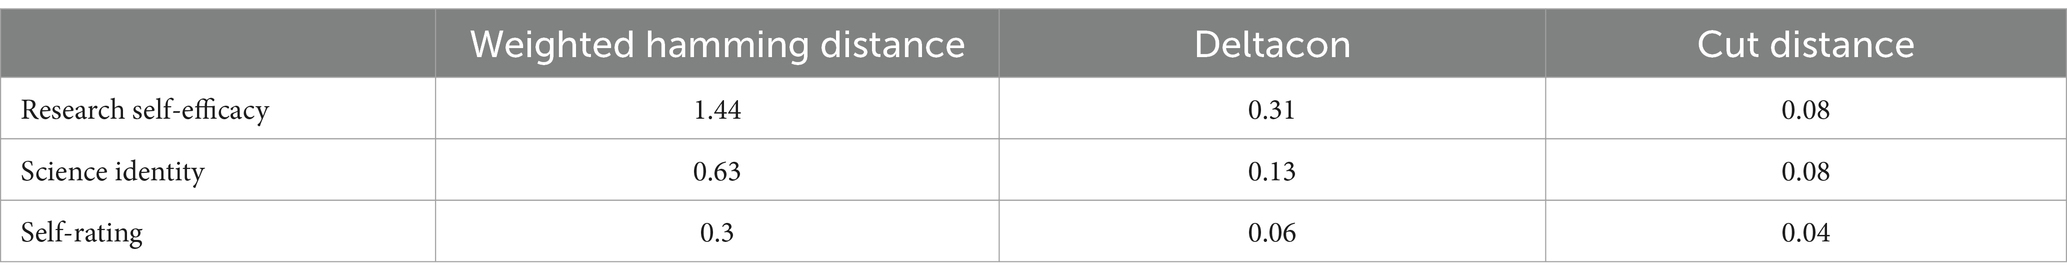
Table 6. KNC metrics for comparison of early and late stage biomedical research trainee networks by educational construct.
4.2.4 Hierarchical EGA results comparing early and late stage
The hierarchical EGA model, which was fit using the differences between the early and late-stage scores, reflects the true latent structure of the survey items. Recall that the use of differences between the early and late stage groups are more relevant here since we are testing the hypothesis that there is a positive relationship between change in research self-efficacy and science identity. The three factors identified in the higher-order network correspond to science identity, research self-efficacy, and academic self-concept. Additionally, the survey items in the lower-order network are accurately clustered by educational construct. In Figure 3 we see that there is a thick green edge connecting nodes 1 and 2 in the higher-order network. This suggests that, over time, an increase in research self-efficacy scores is associated with a strong increase in science identity and vice versa. Although the edges connecting science identity to academic self-concept and research self-efficacy to academic self-concept are also positive, they are thinner which means that an increase in academic self-concept is associated with a slight increase in science identity and research self-efficacy. Looking at the lower-order network we see that, naturally, survey items in the same cluster are also strongly positively associated. This indicates that an increase in score response over time for a survey item is associated with a strong increase in score response for survey items that belong to the same educational construct. It is also interesting to see that the edges that cross between clusters (those that connect survey items that belong to different constructs) are not very thick in comparison. This demonstrates a clear, definite identification of the latent structure (Figure 4).
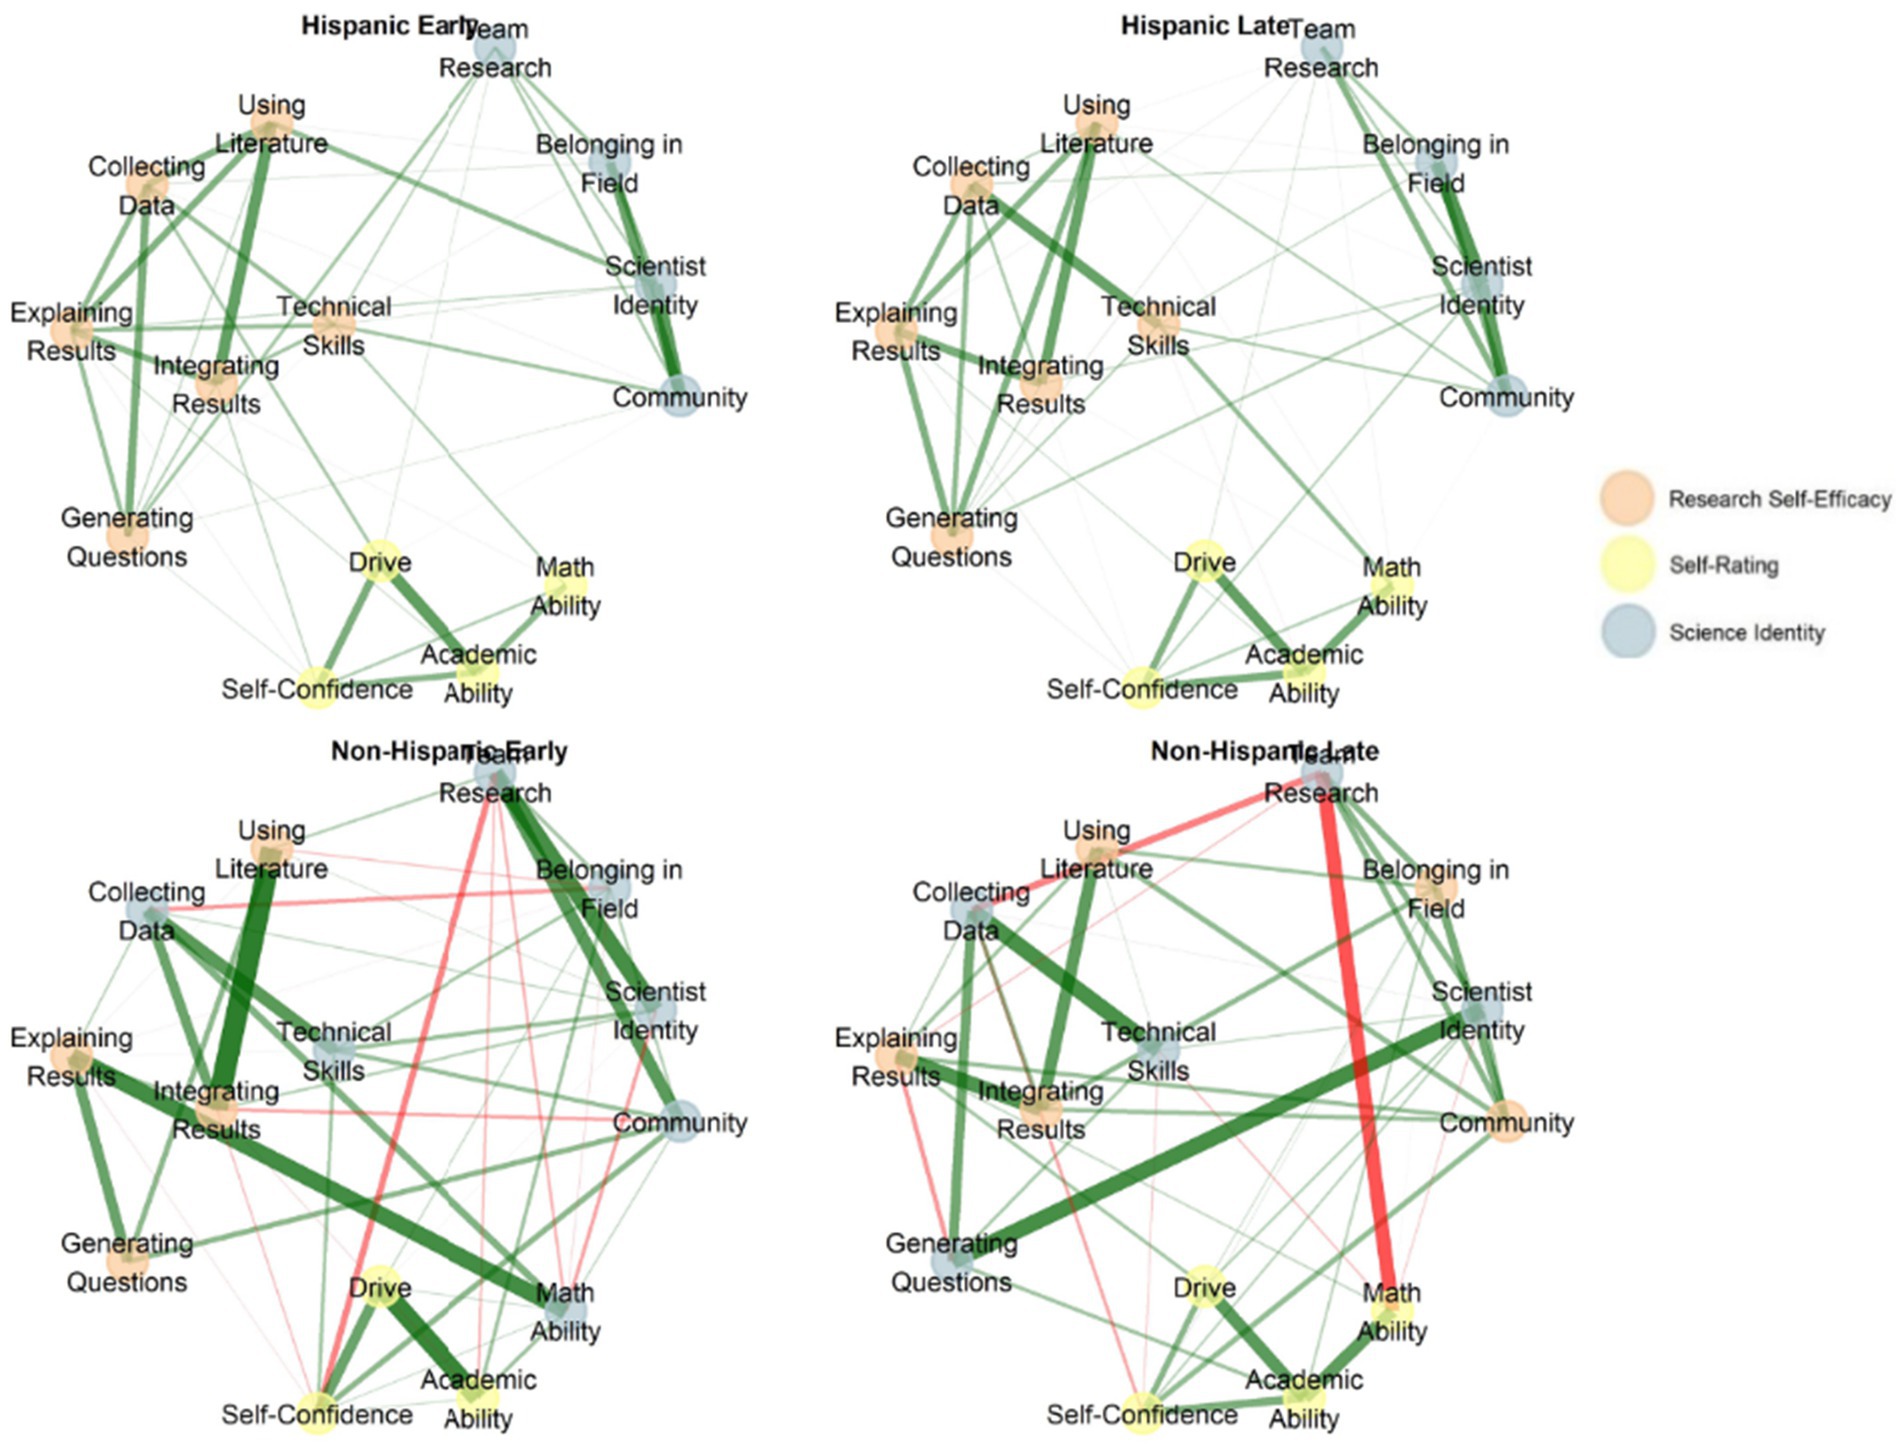
Figure 3. EGA network comparison by ethnicity.
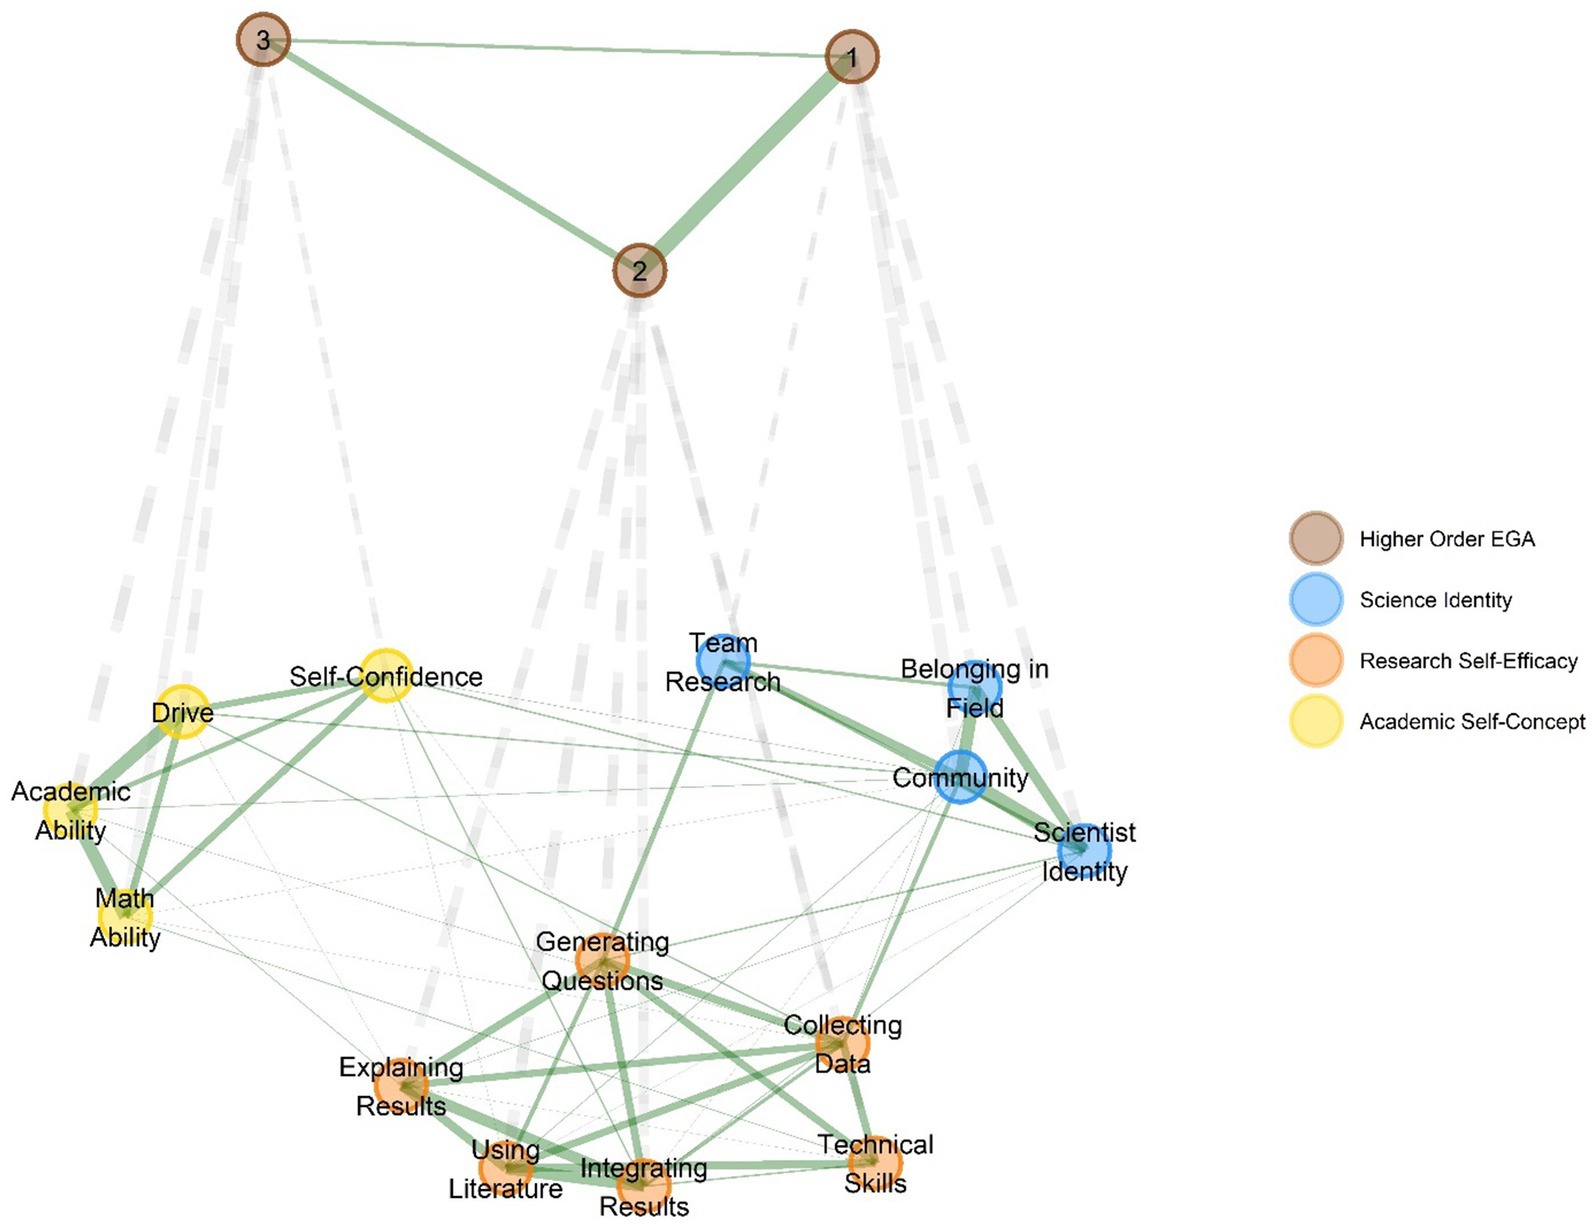
Figure 4. Hierarchical EGA results using the difference between early and late-stage data.
5 Discussion
This study aims to understand the experiences and development of undergraduate students undergoing biomedical research training in key research training outcomes. By making use of EGA models, we can identify the latent structure present in the survey items and measure the level of change in the constructs of research self-efficacy, science identity, and academic self-concept over the course of 2 years.
RQ1: Quantifying level of change over time
Previous studies have found that research-self efficacy, in particular, increases in minority students when they participate in undergraduate research (Carpi et al., 2017). Using KNC measures to better quantify the overall level of change seen across subpopulation networks and the RSC function to determine which subpopulations saw the most and least amount of change, allowed us to develop and implement a reproducible framework to reach consensus between multiple scores. Using this method, we noted that research self-efficacy saw the greatest change in network structure over the course of 2 years of participating in an undergraduate research program, while academic self-concept saw the least amount of structural change. This was the observed pattern for the aggregated data as well as for the subpopulations of Hispanic vs. non-Hispanic and male vs. female.
RQ2: Differences in network structure among gender and ethnic subpopulations
There is a need to study the development of student minorities in STEMM, with respect to educational construct hallmarks, since minorities are disproportionally underrepresented in research professions (Carpi et al., 2017; Tellhed et al., 2017). Due to this, we suspect that underrepresented populations may develop research training outcomes in a different fashion than majority counterparts. In this study, we were able to examine specific changes in associations among subpopulations, for example the negative associations that develop only in male and non-Hispanic groups and the division of survey items in the research self-efficacy cluster for female students. Although previous literature has found that there were insignificant differences in mediation models with respect to ethnicity and gender (Carlone and Johnson, 2007), we found that there were in fact noteworthy differences in construct structure for the graphical networks produced by our student sample. Recall that this study is examining the structural characteristics of the scales while the Chemers et al. (2011) manuscript examined summary scores for these metrics.
RQ3: The effect of increased research self-efficacy scores on science identity
Previous studies have investigated the effect of science support experiences and undergraduate research experiences on the development of science identity in students Chemers et al. (2011) and Robnett et al. (2015). More specifically, they note that science identity can be developed by exposing students to research activities that develop their self-efficacy (Flowers and Banda, 2016). We found that this was corroborated in our study as well, as a strong positive association between research self-efficacy and science identity change scores is present in the hierarchical EGA model for undergraduate students undergoing biomedical research training. While we do not know the direction of this relationship, we can confirm that there is a strong positive association between changes in research self-efficacy and science identity.
5.1 Limitations
The study included only 235 responses out of the full 1,111 responses available due to our restriction to having full matched pairs. This excluded 876 participants who only answered one or the other survey. This may introduce a non-response bias to the data if there is a systematic difference between students who answered both survey versus just one. Following pre-processing, Due to small sample sizes in the non-Hispanic population at the university (approximately 16% of students and even fewer of students engaged in research training), we did not have large numbers of non-Hispanic students and so those results may lack statistical power. Given the nature of the university as a Hispanic-serving institution, the results of our study may not generalize to non-HSI or non-MSI settings, due to our ongoing existing programming focused on research training interventions designed for our student population.
5.2 Future research
The results of this study provide evidence about the structural composition of three major student attributes commonly reported in studies that measure the impact of research training on undergraduates and is an essential first step in identifying the true structure of these attributes, with a focus on research training in biomedical sciences for underrepresented students. While the study provides valuable insights about how the structure changes over time, future research could focus on using directional graph models to investigate change in these important student attributes over time.
Data availability statement
The original contributions presented in the study are included in the article/supplementary material, further inquiries can be directed to the corresponding author.
Author contributions
CR: Conceptualization, Formal analysis, Visualization, Writing – original draft. AW: Conceptualization, Data curation, Formal analysis, Funding acquisition, Investigation, Methodology, Project administration, Resources, Software, Supervision, Validation, Visualization, Writing – original draft, Writing – review & editing. AM: Writing – original draft, Writing – review & editing.
Funding
The author(s) declare that financial support was received for the research and/or publication of this article. The research training program highlighted in this study has been supported by awards from the National Institute of General Medical Sciences of the National Institutes of Health (Award no. RL5GM118969).
Acknowledgments
The Research Evaluation and Assessment Services unit at The University of Texas at El Paso is acknowledged for their contributions to data collection that made this study possible. The authors wish to thank Julio Solis for reading the final version of this manuscript.
Conflict of interest
The authors declare that the research was conducted in the absence of any commercial or financial relationships that could be construed as a potential conflict of interest.
Generative AI statement
The author(s) declare that no Gen AI was used in the creation of this manuscript.
Publisher’s note
All claims expressed in this article are solely those of the authors and do not necessarily represent those of their affiliated organizations, or those of the publisher, the editors and the reviewers. Any product that may be evaluated in this article, or claim that may be made by its manufacturer, is not guaranteed or endorsed by the publisher.
References
Adedokun, O. A., Bessenbacher, A., Parker, L. C., Kirkham, L. L., and Burgess, W. D. (2013). Research skills and STEM undergraduate research students’ aspirations for research careers: mediating effects of research self-efficacy. J. Res. Sci. Teach. 50, 940–951. doi: 10.1002/tea.21102
Alhadabi, A. (2021). Science interest, utility, self-efficacy, identity, and science achievement among high school students: an application of SEM tree. Front. Psychol. 12:634120. doi: 10.3389/fpsyg.2021.634120
Apriceno, M., Levy, S. R., and London, B. (2020). Mentorship during college transition predicts academic self-efficacy and sense of belonging among STEM students. J. Coll. Stud. Dev. 61, 643–648. doi: 10.1353/csd.2020.0061
Betz, A. R., King, B., Grauer, B., Montelone, B., Wiley, Z., and Thurston, L. (2021). Improving academic self-concept and STEM identity through a research immersion: pathways to STEM summer program. Front. Educ. 6:674817. doi: 10.3389/feduc.2021.674817
Carlone, H. B., and Johnson, A. (2007). Understanding the science experiences of successful women of color: science identity as an analytic lens. J. Res. Sci. Teach. 44, 1187–1218. doi: 10.1002/tea.20237
Carpi, A., Ronan, D. M., Falconer, H. M., and Lents, N. H. (2017). Cultivating minority scientists: undergraduate research increases self-efficacy and career ambitions for underrepresented students in STEM. J. Res. Sci. Teach. 54, 169–194. doi: 10.1002/tea.21341
Chemers, M. M., Zurbriggen, E. L., Syed, M., Goza, B. K., and Bearman, S. (2011). The role of efficacy and identity in science career commitment among underrepresented minority students. J. Soc. Issues 67, 469–491. doi: 10.1111/j.1540-4560.2011.01710.x
Chen, S., Binning, K. R., Manke, K. J., Brady, S. T., McGreevy, E. M., Betancur, L., et al. (2020). Am I a science person? A strong science identity bolsters minority students’ sense of belonging and performance in college. Personal. Soc. Psychol. Bull. 47, 593–606. doi: 10.1177/0146167220936480
Christensen, A. P., Garrido, L. E., Guerra-Peña, K., and Golino, H. (2020). Comparing community detection algorithms in psychological data: A Monte Carlo simulation. Behav. Res. Methods 56, 1485–1505. doi: 10.3758/s13428-023-02106-4
Cobian, K. P., Hurtado, S., Romero, A. L., and Gutzwa, J. A. (2024). Enacting inclusive science: culturally responsive higher education practices in science, technology, engineering, mathematics, and medicine (STEMM). PLoS One 19:e0293953. doi: 10.1371/journal.pone.0293953
Conover, W. J., and Iman, R. L. (1981). Rank transformations as a bridge between parametric and nonparametric statistics. Am. Stat. 35, 124–129.
Dou, R., and Cian, H. (2022). Constructing STEM identity: an expanded structural model for STEM identity research. J. Res. Sci. Teach. 59, 458–490. doi: 10.1002/tea.21734
Endo, J. J., and Harpel, R. L. (1982). The effect of student-faculty interaction on students’ educational outcomes. Res. High. Educ. 16, 115–138. doi: 10.1007/BF00973505
Estrada, M., Hernandez, P. R., and Schultz, P. W. (2018). A longitudinal study of how quality mentorship and research experience integrate underrepresented minorities into STEM careers. CBE—Life Sci. Educ. 17:ar9. doi: 10.1187/cbe.17-04-0066
Flowers, A. M. III, and Banda, R. (2016). Cultivating science identity through sources of self-efficacy. J. Multicultural Educ. 10, 405–417. doi: 10.1108/JME-01-2016-0014
Golino, H., and Christensen, A. P., (2023). EGAnet: exploratory graph analysis – a framework for estimating the number of dimensions in multivariate data using network psychometrics. R package version. Available at: https://r-ega.net
Golino, H. F., and Epskamp, S. (2017). Exploratory graph analysis: a new approach for estimating the number of dimensions in psychological research. PLoS One 12:e0174035. doi: 10.1371/journal.pone.0174035
Golino, H., Shi, D., Christensen, A. P., Garrido, L. E., Nieto, M. D., Sadana, R., et al. (2020). Investigating the performance of exploratory graph analysis and traditional techniques to identify the number of latent factors: a simulation and tutorial. Psychol. Methods 25, 292–308. doi: 10.1037/met0000255
Guo, J. P., Yang, L. Y., and Zhang, J. (2022). Academic self-concept, perceptions of the learning environment, engagement, and learning outcomes of university students: relationships and causal ordering. High. Educ. 83, 809–828. doi: 10.1007/s10734-021-00705-8
Hsu, D. F., Kristal, B. S., Hao, Y., and Schweikert, C. (2019). Cognitive diversity: a measurement of dissimilarity between multiple scoring systems. J. Interconnection Netw. 19:1940001. doi: 10.1142/S0219265919400012
Hu, X., Jiang, Y., and Bi, H. (2022). Measuring science self-efficacy with a focus on the perceived competence dimension: using mixed methods to develop an instrument and explore changes through cross-sectional and longitudinal analyses in high school. Int. J. STEM Educ. 9:363. doi: 10.1186/s40594-022-00363-x
Liu, Q., Dong, Z., and Wang, E. (2018). Cut based method for comparing complex networks. Sci. Rep. 8:5134. doi: 10.1038/s41598-018-21532-5
NCSES (2023). Diversity and STEM: Women, minorities, and persons with disabilities 2023Special report NSF 23–315. Alexandria, VA: National Science Foundation.
R Core Team (2024). R: A language and environment for statistical computing. Vienna: R Foundation for Statistical Computing.
Robnett, R. D., Chemers, M. M., and Zurbriggen, E. L. (2015). Longitudinal associations among undergraduates’ research experience, self-efficacy, and identity. J. Res. Sci. Teach. 52, 847–867. doi: 10.1002/tea.21221
Samo, A., Christensen, A. P., Abad, F. J., Garrido, L. E., Jiménez, M., and Garcia-Garzon, E. (2023). Building the structure of personality from the bottom-up using hierarchical exploratory graph analysis. Available at: https://osf.io/zx7tc/download (Accessed May 2024).
Syed, M., Zurbriggen, E. L., Chemers, M. M., Goza, B. K., Bearman, S., Crosby, F. J., et al. (2019). The role of self-efficacy and identity in mediating the effects of STEM support experiences. Anal. Soc. Issues Public Policy 19, 7–49. doi: 10.1111/asap.12170
Tantardini, M., Ieva, F., Tajoli, L., and Piccardi, C. (2019). Comparing methods for comparing networks. Sci. Rep. 9:17557. doi: 10.1038/s41598-019-53708-y
Tellhed, U., Bäckström, M., and Björklund, F. (2017). Will I fit in and do well? The importance of social belongingness and self-efficacy for explaining gender differences in interest in STEM and HEED majors. Sex Roles 77, 86–96. doi: 10.1007/s11199-016-0694-y
Traag, V. A., Waltman, L., and Van Eck, N. J. (2019). From Louvain to Leiden: guaranteeing well-connected communities. Sci. Rep. 9:5233. doi: 10.1038/s41598-019-41695-z
Wills, P., and Meyer, F. G. (2020). Metrics for graph comparison: a practitioner’s guide. PLoS One 15:e0228728. doi: 10.1371/journal.pone.0228728
Appendix
We employ a configural invariance method to validate the stability of the factor structure in our EGA models across time. First, to establish configural invariance, the data is collapsed across time checkpoints and a common EGA structure is calculated. Variables with replication >0.7 in their assigned dimension are considered stable and invariant, those that are not dropped and the process is repeated until all remaining variables are invariant. Metric invariance values are obtained by subtracting the assigned loadings for each group. To obtain p-values, group memberships are permuted and loadings recalculated at each iteration to produce a null distribution of values. The loading differences for each of our four demographics are shown in the Figure.
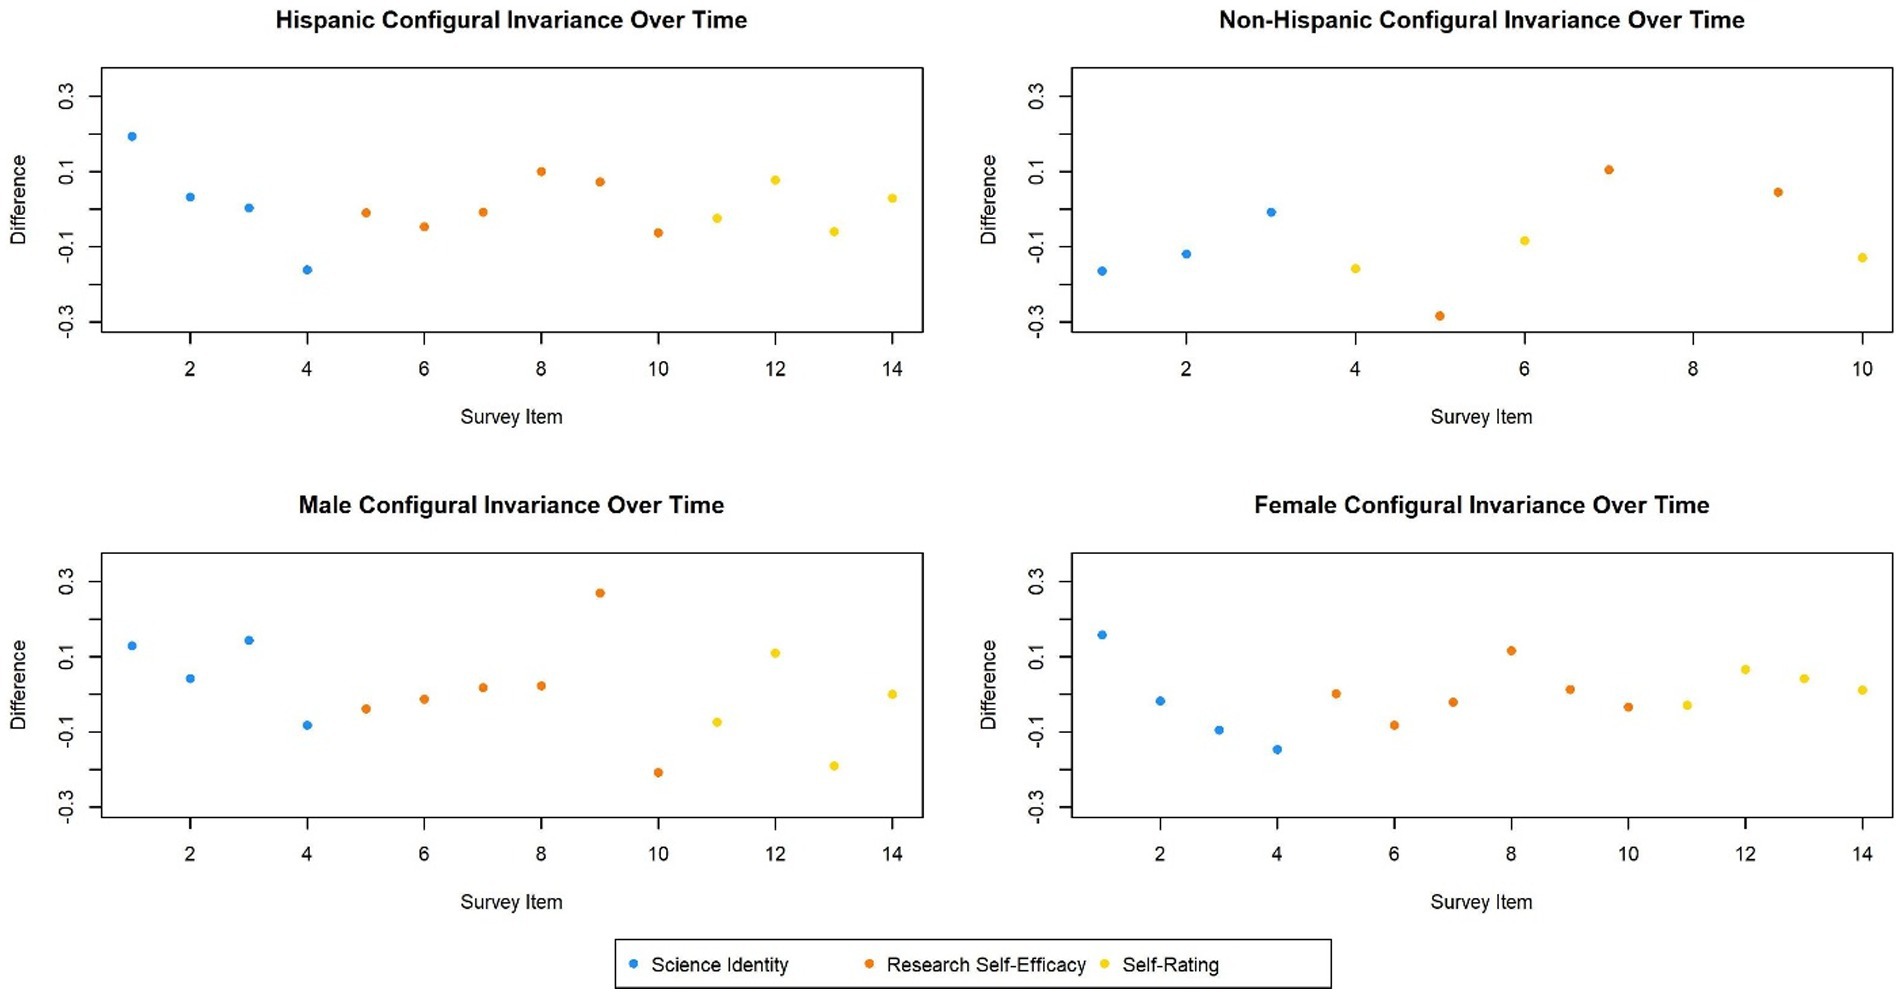
Figure A1. Configural invariance plots.
Keywords: undergraduate students, minority students, undergraduate research, pursuing graduate/professional school, biomedical
Citation: Reyes C, Wagler A and Monarrez A (2025) Longitudinal changes in science identity, research self-efficacy, and academic self-concept for biomedical research trainees at a Hispanic-serving institution. Front. Educ. 10:1518726. doi: 10.3389/feduc.2025.1518726
Edited by:
Patsie Polly, University of New South Wales, AustraliaReviewed by:
Renee J. Chosed, University of South Carolina, United StatesCarolina Mehaffy, Colorado State University, United States
William Burton, Albert Einstein College of Medicine, United States
Copyright © 2025 Reyes, Wagler and Monarrez. This is an open-access article distributed under the terms of the Creative Commons Attribution License (CC BY). The use, distribution or reproduction in other forums is permitted, provided the original author(s) and the copyright owner(s) are credited and that the original publication in this journal is cited, in accordance with accepted academic practice. No use, distribution or reproduction is permitted which does not comply with these terms.
*Correspondence: Amy Wagler, YXdhZ2xlcjJAdXRlcC5lZHU=