 Noha Abdelaziz
 Mohammed Farghally
 Mostafa Mohammed3
- 1Faculty of Computers and Information, Assiut University, Assiut, Egypt
- 2Department of Computer Science, Virginia Tech, Blacksburg, VA, United States
- 3Department of Computer Science and Engineering, The State University of New York at Buffalo, Buffalo, NY, United States
Data are a crucial asset for organizations, making it essential for database designers to effectively organize and manage data using DataBase Management Systems (DBMS). DataBase design Concepts (DBCs) are central to computer and information sciences curricula, focusing on teaching students how to conceptually and logically design database systems to manage data through the DBMS. Key concepts such as conceptual data modeling and mapping models to relational schemas are fundamental to effective database design. However, students often struggle to grasp these concepts despite existing efforts to improve students' learning. Research is limited to identifying and addressing common misconceptions of students related to the DBCs. In this study, our aim is to fill in this research gap by identifying students' difficulties and challenges in comprehending DBCs, exploring their root causes, and proposing a pedagogical intervention to address these challenges early in the learning process. The primary goal is to gain a deeper understanding of how students learn and apply DBCs, formulate a clear list of students' DBC misconceptions, and finally create an online interactive visual tool aimed at addressing database design learning difficulties and misconceptions through visual presentations.
1 Introduction
Database courses are crucial for all undergraduate university students majoring in computer science and related fields, focusing on both theoretical concepts and practical skills in developing database applications (Shebaro, 2018). According to Goldweber et al. (2022), when students have to take a database course, they should learn the fundamentals of database design. Many students who relied on traditional learning techniques encountered difficulties in grasping the fundamentals or concepts of databases. Hamzah et al. (2019) argue that database learning is abstract and highly challenging to comprehend. Successfully teaching a subject depends on recognizing students' mistakes, their misconceptions about this subject, and gaining an understanding of the nature of these errors (Taipalus, 2020).
Accordingly, many efforts have been made to improve the teaching of DBCs to enhance the students' learning outcomes. Previous efforts have taken two forms: either detecting common students' DBCs misconceptions as in Rashkovits and Lavy (2021), Batra and Antony (1994), Imbulpitiya et al. (2021), Morien (2006), Hamzah et al. (2019), Chilton (2006), Jones and Song (2000), Vimala et al. (2013), and Rashkovits and Lavy (2020) or developing a pedagogical intervention to enhance the teaching process as shown in Hvalshagen et al. (2023), Suraweera and Mitrovic (2002), Mitrovic and Suraweera (2016), Ntshalintshali and Clariana (2020), Antony and Batra (2002), Cvetanovic et al. (2010), Dietrich et al. (2014), Goelman and Dietrich (2018), Murray and Guimaraes (2008), and Nagataki et al. (2013). To the best of our knowledge, no studies have formulated a list of students' misconceptions and built an intervention based on these misconceptions. Accordingly, there is a gap between the actual students' misconceptions and the proposed educational interventions. Some students' DBC misconceptions may still be out of focus.
This research aims to identify students' difficulties during the early database design phases and to compile a comprehensive list of DBCs' misconceptions related to database design that are typically encountered in undergraduate database courses, followed by proposing a novel educational intervention to address those students' misconceptions right from the beginning of their learning journey. Our proposed intervention involves an online visual interactive tool created using the JSAV framework (Karavirta and Shaffer, 2013), which offers the necessary libraries and components for developing a collection of online interactive visualizations. Our proposed tool combines high-quality textual explanations with visualizations that clearly illustrate DBCs and address common students' misconceptions in these concepts.
Based on this, the main research questions of this study are as follows:
RQ1: What is the set of common DBC misconceptions held by undergraduate students in a typical database course?
RQ2: How to develop an educational intervention that addresses all of the identified misconceptions?
In response to the research questions presented, the following contributions summarize the key outcomes and advancements of this study:
1. Define a clear and comprehensive list of undergraduate students' DBC misconceptions by analyzing the existing literature, and conducting our own extensive analysis of students' answers to exam questions.
2. Develop an educational intervention based on the idea of refuting and addressing the identified misconceptions that have been proven to positively affect students' learning.
This study is organized as follows. A review of previous efforts in identifying common students' misconceptions in database design, and improving the learning of core database design concepts is presented in Section 2. Section 3 shows our efforts to identify the list of students' DBC misconceptions and gives an overview of our proposed tool, showing some examples from the implemented visualizations and how it addresses the identified students' misconceptions. In Section 5, possible threats to validity are discussed. Finally, conclusions and future work are presented in Section 6.
2 Related work
Database systems education was explored from various perspectives throughout the years. These views often revolve around teaching and learning strategies (e.g., Lin, 2020; Shebaro, 2018), curriculum design (e.g., Adams et al., 2004), or the development of tools to assist instructors and students (Ishaq et al., 2023; Buraga et al., 2022). Few other approaches adopted the strategy of investigating DBC misconceptions or even the nature of questions used to assess student database information acquisition. Here, we will focus on research articles that have been published specifically addressing tools for improving teaching database systems courses and those that focus on student misconceptions in DBCs.
2.1 Students' misconceptions in DBCs
Rashkovits and Lavy (2021) conducted a study to examine data models produced by second-year academic students in the Information Systems (IS) department in a regional academic College, as a part of “Introduction to Database Management Systems” course. This study aims to identify the difficulties in understanding and implementing data models and explore the origins of these difficulties. This study also sheds light on the underlying reasons for the errors made during the design of the data model based on interviews conducted with a representative group of the study participants. They also suggest ways to improve novice designer's performances more effectively, so they can draw more accurate models. It was found that students face difficulties in exhibiting high levels of understanding regarding concepts such as non-binary relationships, weak entities, and hierarchies.
Batra and Antony (1994) conducted two experiments in their research to investigate the underlying causes of errors committed during conceptual database modeling. The end of the article includes recommendations to reduce the occurrence of errors. The nature of introductory undergraduate-level database modeling and design exams was investigated in the study by Imbulpitiya et al. (2021). To understand what style/type of questions were asked and which concepts were being tested, they classified 122 questions related to database design and modeling from 19 exams from six different institutions and four countries. As a result, they discovered that there was little variation between the different exams and highlighted the need for more research into the teaching and learning of data modeling and DBCs. Morien (2006) narrates his experience in teaching an introductory database course and DBCs students' misconceptions he faced during his teaching journey. He also presents a significant analysis of a number of database textbooks, highlighting the pedagogical problems that abound in them. The study by Hamzah et al. (2019) is a comprehensive review article highlighting several problems in teaching database principles in the literature. Chilton (2006) drew attention to some of the pitfalls novice students face when applying database concepts in an introductory database design course. He provided examples to illustrate these difficulties and a framework for reducing them.
Other attempts (Jones and Song, 2000; Vimala et al., 2013; Rashkovits and Lavy, 2020) shed light on the misconception of the equivalence of ternary relationships to multiple binaries. Jones and Song (2000) stated that a number of modeling notations and CASE tools do not allow for ternary relationships. Other approaches and alternatives to ternary relationship structures do not necessarily reflect the original semantics, logic, or constraints of a given situation. So their study identified which ternary relationships have true, fully equivalent, binary equivalents and those which do not. The authors also analyzed cardinality combinations found in ternary relationships to help practitioners deal with ternary relationships in conceptual modeling. According to Vimala et al. (2013), it is not possible to reconstruct the relations corresponding to the ternary relationship if the ternary relationship is represented using a set of binary relationships and then transformed into relations. A study examining the difficulties that database design students face when asked to provide a data model to address a given problem was done by Rashkovits and Lavy (2020). The authors presented two data modeling problems to 82 students who had completed an introductory database course to map these difficulties and their causes. One problem should be solved using a ternary relationship, while the other uses two binary relations. The solutions were classified according to the types of errors. After analyzing the results and conducting interviews with the students, the authors determined the reasons behind the students' erroneous decisions and suggested instructional modifications.
As noted above, these previous studies have identified some misconceptions related to DBCs, but these findings are scattered across different studies. To bring them together, Table 1 summarizes the misconceptions found in previous studies, as well as those discovered in this study through our misconception detection process, which we will discuss in detail in Section 3.1. By clearly organizing them, this comparison reveals the most common misconceptions and helps guide future research on how they affect students. This structured approach also makes it easier for educators to identify these misconceptions in their teaching.
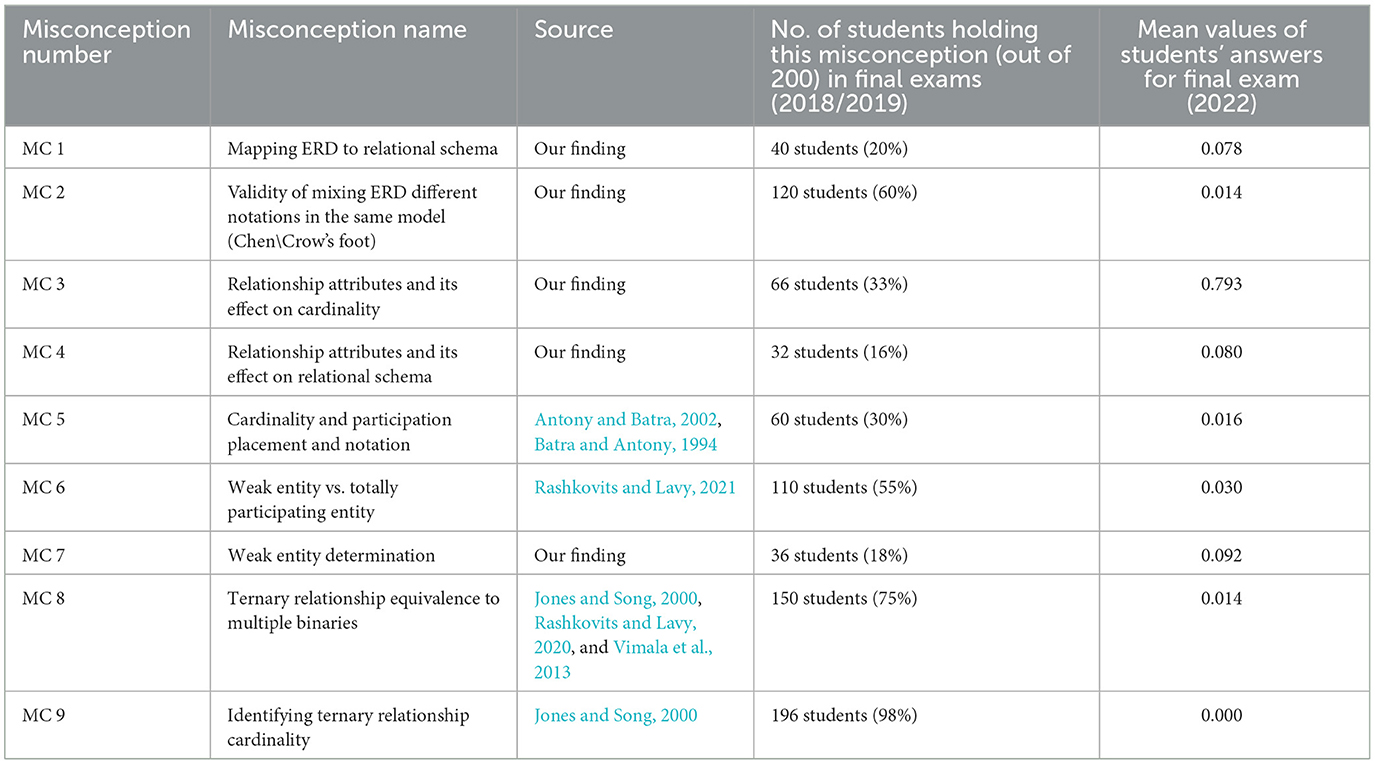
Table 1. Identified database design misconceptions.
2.2 DBCs education interventions
This study includes attempts to improve the learning of basic database systems concepts. Some were directed toward introducing different techniques as narratives (Hvalshagen et al., 2023), constraints-based learning techniques (Suraweera and Mitrovic, 2002; Mitrovic and Suraweera, 2016), or text refutation (Ntshalintshali and Clariana, 2020), other group focused on developing learning environments by which students learn the concepts through practice exercises (Antony and Batra, 2002; Cvetanovic et al., 2010; Buraga et al., 2022), and another group focused on developing animated tools (Dietrich et al., 2014; Goelman and Dietrich, 2018; Murray and Guimaraes, 2008; Nagataki et al., 2013).
A study by Hvalshagen et al. (2023) investigated data-oriented conceptual models paired with narrative texts, finding that storytelling significantly improved learners' understanding of cardinality constraints in conceptual modeling. KERMIT (Suraweera and Mitrovic, 2002), an intelligent tutoring system, uses Constraint-Based Modeling (CBM) to help students practice ER modeling, while its successor, EER-Tutor (Mitrovic and Suraweera, 2016), extends this approach to Enhanced Entity-Relationship modeling. Misconceptions in database education were examined by Ntshalintshali and Clariana (2020), who proposed refutation texts (RTs) as a method to explicitly correct common errors by contrasting them with correct concepts. Additionally, Dullea et al. (2003) developed a comprehensive set of decision rules to validate the structural correctness of ER diagrams, applicable to relationships of any degree. Saeed et al. (2011) suggest that group projects should be used as a tool to make learning subjects more effective. The research proposes a design of a (DBMS) course module, describes a pedagogical approach to teach that course, and then analyzes student feedback comments to gauge the effectiveness of the proposed teaching strategy. ENABLE is a framework proposed by Naik and Gajjar (2021), which adopts project-based learning methodology. It is a proprietary methodology developed to enable students to engage better with and appreciate the context of what they learn, and apply their learning more effectively. Experiment proved that ENABLE positively affects student learning.
To support learners in conceptual modeling, Antony and Batra (2002) introduced CODASYS, a prototype tool that assists in creating ER diagrams while reducing cognitive strain through error analysis. ADVICE (Cvetanovic et al., 2010), a web-based educational system, provides interactive lab exercises for conceptual modeling, SQL, and normalization with real-time feedback. Similarly, Kung and Kung (2013) created a web tool to reinforce the connection between relational models and ER diagrams, aiding in normalization comprehension.
To the best of our knowledge, fewer attempts have focused on developing animated tools to provide a better presentation of the concepts. Animated Database Courseware (ADbC) (Murray and Guimaraes, 2008) is an instructional animated software that can be incorporated into classrooms. Topics supported include database design, interactive SQL, stored procedures and triggers, transactions, and security. ADbC consists of about 70 animations or tutorials categorized into four main modules, further divided into sub-modules. Other studies (Nagataki et al., 2013; Goelman and Dietrich, 2018; Dietrich et al., 2014) offered different visualization tools with different capabilities, illustrating primitive database concepts for non-Computer Science major students.
Despite the availability of visualization tools, most of them focused primarily on teaching specific topics such as normalization and SQL. Tools such as ADbC (Murray and Guimaraes, 2008), which offer animations for certain database design concepts, still fall short in terms of detailed step-by-step illustrations. Additionally, they overlook some challenging topics.
Although numerous techniques and interventions exist, whether utilizing animations or not, aiming to enhance the understanding of database learning concepts, and despite the excess of research discussing misconceptions in these concepts, very few tools have been developed based on a well-defined, formalized list of these misconceptions, aiming at their resolution. Moreover, there is a lack of empirical studies to prove the clear illustration and resolution of these misconceptions among a substantial student population.
Based on the research gap illustrated in this section and the research questions given in the introduction, we propose the following hypotheses:
H1: Undergraduate students in a typical database course hold a set of common DBC misconceptions that can be systematically identified through literature analysis and exam answer evaluation. These misconceptions follow recurring patterns rather than occurring randomly.
H2: The proposed educational intervention, which addresses the identified misconceptions, will significantly improve students' learning outcomes.
These hypotheses will be addressed and validated in Sections 3, 4, respectively.
3 Methodology
As mentioned earlier, to the best of our knowledge, previous work has identified some DBCs' misconceptions, but no study to date provides a complete list. Most of the existing research also aims to improve the process of database learning and teaching in general, regardless of students' misconceptions.
This research is based on the belief that effective teaching depends on understanding students' errors and misconceptions, as well as delving into the underlying nature of these errors.
This research followed six different phases to identify misleading database concepts, define a clear list of students' misconceptions for each, and address H1. Subsection 3.1 discusses all these steps. The seventh step, described in Subsection 3.2, involves proposing a visualization tool to clearly illustrate and overcome these misconceptions, thereby addressing H2. The tool not only presents misleading topics but also covers all introductory database course topics and concepts to provide students with a complete and comprehensive resource for database learning. Figure 1 shows the seven steps followed in this research.
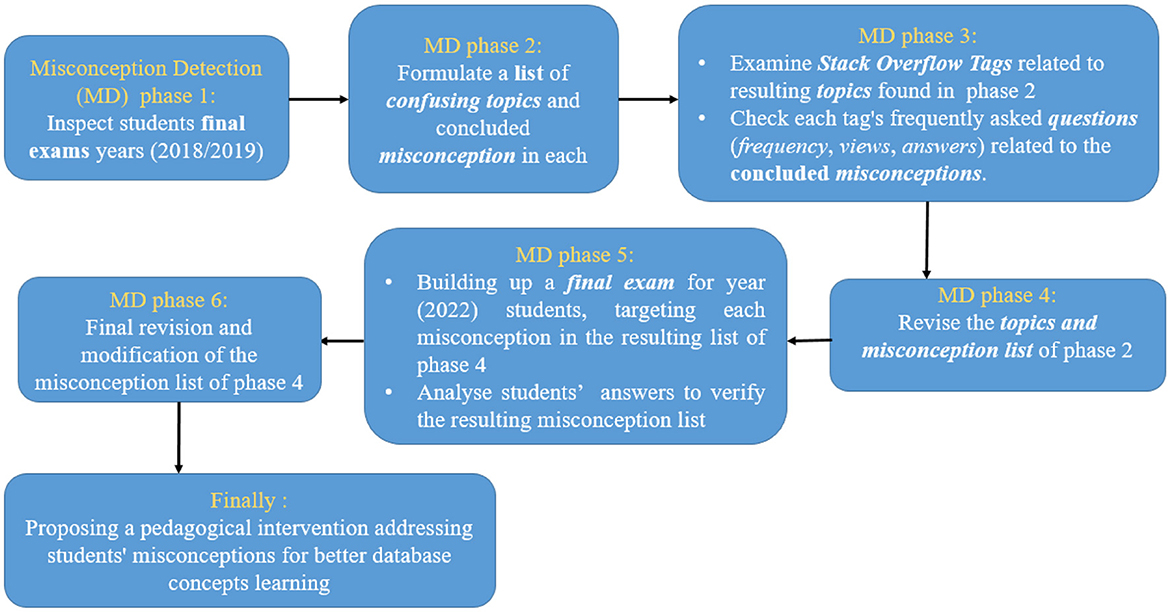
Figure 1. Flow chart showing all the steps followed throughout this research.
3.1 Identifying students' misconceptions in database design concepts (RQ1)
As shown in Figure 1, our study was initially aimed at identifying students' misconceptions in DBCs to address RQ1. This study was accomplished through three main phases of Misconception Detection (MD; phases 1, 3, and 5), each of which was followed by a phase of drafting or updating the DBC misconceptions list (phases 2, 4, and 6, respectively). As a result of these six phases, Table 1 shows the final list of students' misconceptions in DBCs, collectively compiled after completing all phases for the sake of summarization. This list includes nine different misconceptions in different DBCs. It is worth noting that some of the misconceptions listed in Table 1 have been previously documented, as discussed in Section 2.1. This study not only replicates these earlier findings but also confirms them through the misconception detection process discussed here. While prior studies helped identify these misconceptions, our observations and analyses reveal that they still exist in today's database education. This consistency enhances the reliability and relevance of our findings for current teaching practices. After illustrating the three main phases of the misconception detection process, the nine concluded misconceptions will be discussed in detail, at the end of this section, showing students' incorrect perceptions of basic DBCs.
The first main misconception detection phase (MD phase 1 in Figure 1) involved examining two groups of random samples of students' submissions to final course exams for two consecutive years (2018, 2019) in database fundamentals. A total of 200 students' answer sheets (i.e., 100 exam sheets from each year) were manually examined to identify students' misconceptions. Initially, through examination of the sheets, it was found that most of the difficulties faced by students were concentrated in five main concepts: ternary relationships, weak entities, relationship constraints, relationship attributes, and ERD to relational schema mapping, ranked from most to least difficult. The students' answers were then carefully re-examined to identify their misconceptions in each concept (e.g., one of the most common misconceptions found in the concept of ternary relation is that a ternary relationship is equivalent to multiple binary relations). Table 1 provides a list of nine identified misconceptions and the number of students (out of 200) holding each of these misconceptions, as indicated by their answers to exam questions.
Regardless of the dispute about the quality of the information provided by the user answers on StackOverflow (Lu et al., 2020), StackOverflow is still one of the most popular question-and-answer websites for programmers around the world (Mamykina et al., 2011). Therefore, the second main phase (MD phase 3 in Figure 1) was manually searching and inspecting StackOverflow questions related to the difficult concepts and misconceptions found through the previous phases. This phase was conducted to indicate whether the concluded misconceptions are locally related to students at our institution or may be generally found elsewhere and faced by other database beginners all over the world with different perspectives and backgrounds. To avoid the disagreement over StackOverflow's usefulness and to make use of its advantages, StackOverflow search capabilities, such as tags, filters, votes, and view counts, were used to maximize the benefits of search results. Tags, such as [database-schema], [database-design],[database], [erd], [er-diagram], [entity-relationship], [database-design], [data-modeling], [identifying-relationship], [weak-entity], and [ternary], and keywords, such as “Chen,” “Crow's foot,” “cardinality,” “participation,” “relational attribute,” and “relational schema mapping,” related to topics, concepts, and misconceptions found in main phase 1 were used as search criteria. These tags and keywords were used to reach most of the questions related to the same topics and misconceptions, if they exist, while votes, views, and answers were used to assess whether these questions are frequently asked or can be assumed as a knot for a large number of database learners. Tags, votes, and views were defined in Peruma et al. (2022) as follows.
Tags: As part of creating a question, the developer needs to associate the question with some tags, a word or phrase that describes the question during its creation. A developer can associate the question with one to five tags at most. Tags permit site users to access a particular set of questions that is of interest to them. Stack Overflow discourages the creation of arbitrary tags and instead recommends the use of predefined tags.
Votes: Associated with posts, this metric is based on the upvotes the post receives. The higher the value, the more useful the post is to the community.
View count: Associated with only questions, this metric corresponds to the number of times the post was viewed. Table 2 shows the number of StackOverflow discovered questions corresponding to each misconception found in main phase 1, along with the number of views, answers, and some example questions.
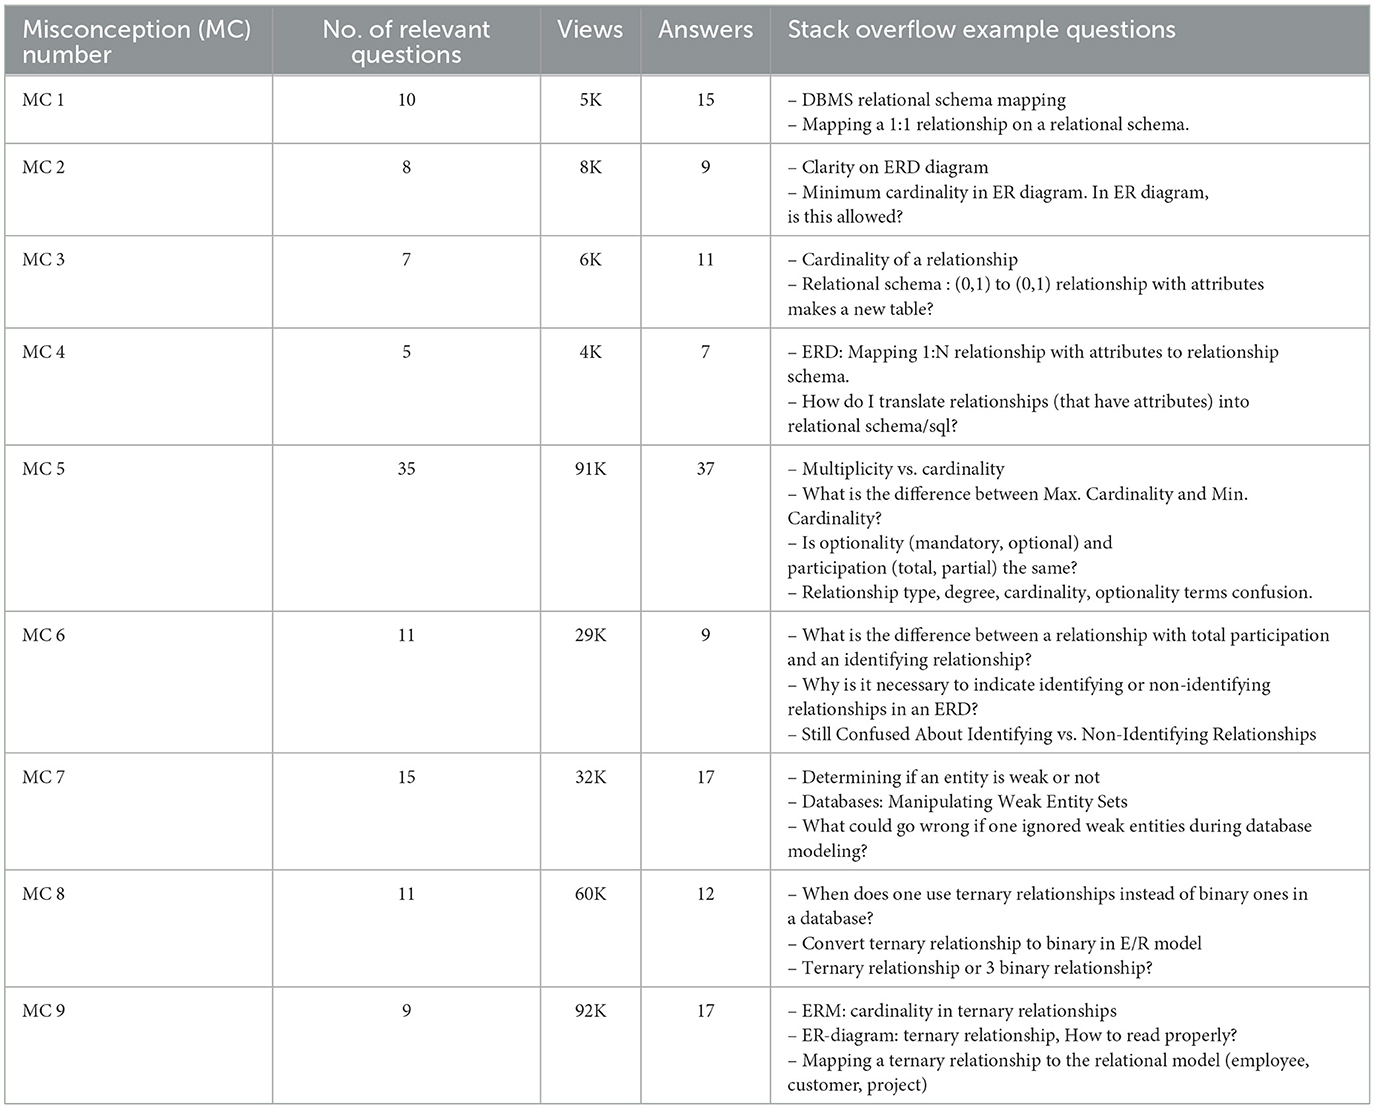
Table 2. Stack overflow analysis for the proposed misconceptions given in Table 1.
The third main phase of the misconception detection process (MD phase 5 in Figure 1) is formulating an exam targeting all misconceptions found and revised in phase 2 and phase 4, as a result of the first two main phases. The exam was given to second-year Information Systems major students at our institution during the Spring semester of 2022, as a Database Fundamentals final course exam. Each exam question is related to one of the nine misconceptions given in Table 1.
The second column of Table 1 represents the final list of misconceptions modified during phase 6 as a result of all previous phases of Figure 1. The remaining columns of Table 1 represent the outputs of the first and third main phases, respectively. Column 2 in Table 1 is the number of students (out of 200) who hold these misconceptions in exams years (2018 and 2019), inspected in the first main phase (MD phase 1 in Figure 1). The last column is the mean values of students who correctly answered each question given in the final 2022 year exam conducted during the third main phase (MD phase 5 in Figure 1). As a result of this strenuous analysis, some examples are given here to illustrate the meaning of each misconception found in Table 1. In the below examples, all incorrect answers were inferred from students' actual answers through attentive examination of their exams, as shown in the phases of Figure 1.
Misconception 1: “Mapping ERD to the corresponding relational schema”
Many examples exist, but one of the most common students' mistakes was found in the unary relationship, which is what role should the FK be referring to?
Example question: Let us suppose that we have an employee table. A manager supervises a subordinate. Every employee can have at most one boss. One employee may be the boss of many employees. Let us suppose that REPORTS_TO is a recursive relationship on the employee entity type where each employee plays two roles (supervisor – subordinate). Write the relational schema illustrating foreign keys.
Wrong answer: EMPLOYEE (EID, Ename, SubordinateID (FK))
Right answer: EMPLOYEE (EID, Ename, SupervisorID (FK))
Misconception 2: “Validity of mixing different ERD notations in one problem solution”
It is a very common mistake in which students do not stick to specific ERD notations (e.g., Chen or Crow's foot) in the same diagram, which leads to difficulty reading and interpreting the diagram.
Misconception 3 and 4: “Relationship attributes and their effect on cardinality and relational schema”
One of the major students' difficulties found was identifying relationship attributes, and to which entity it should be added, especially in non-N:M relations. E.g.: The 1:1 cardinality of the Manage relation between EMPLOYEE and DEPARTMENT entities differs in the case of the managerial position, which can be taken only once or more, through adding the start and end date of management.
Example question: At a given time, each department is managed by one manger and a manger can at most manage one department but the database should store the management history (i.e., we need to record all managers who managed each department at different time periods), assuming that a manager can take management position only once in his working life time. Determine the cardinality of the Manage relationship and then write the corresponding relational schema.
Wrong answer:
cardinality: 1:1
relational schema:
DEPARTMENT (Dno, Dname, MID (FK), management_period)
MANAGER (MID, Mname)
Right Answer:
cardinality: 1:M
relational schema:
DEPARTMENT (Dno, Dname)
MANAGER (MID, Mname, Dno (FK), management_period)
Although some students chose the correct 1:M cardinality, they mapped the relationship incorrectly and wrote the wrong relational schema.
Misconception 5: “Cardinality and Participation placement using different notations”
This difficulty arises due to the existence of many different notations (i.e., signs) and methods (e.g., min-max, crow's foot, Look-Here, and Look-Across) to express cardinality and participation. One of the common mistakes that students make is reversing the positions of the cardinality and participation signs and then (min–max) notation.
Example question:
Suppose we have EMPLOYEE and MANAGER entities related via the Supervise relationship. Every employee can have a supervisor except the CEO, and there can be at most one boss for each employee. One manager may be the boss of more than one employee. What are the Min. and Max. cardinalities of that relation?
Wrong answer:
EMPLOYEE (Min, Max) = (0, M)
MANAGER (Min, Max) = (1, 1)
Right answer:
EMPLOYEE (Min, Max) = (0, 1)
MANAGER (Min, Max) = (1, M)
Note: This solution is valid assuming that an employee, who is a manager, has an instance in each entity. The basic form for this relation is the unary relationship, but here we decomposed it into two separate entities (EMPLOYEE and MANAGER) for simplicity, so that we can focus on the concepts of participation and cardinality without confusion with any other concepts.
Misconception 6: “Weak entity vs. totally participating entity”
A weak entity must have a total participation with its identifying relationship, and one misconception is that considering every entity to participate totally in a relationship as a weak entity.
Example question:
There are two entities, one representing the IDENTIFICATION CARD and the other for CITIZEN. The IDENTIFICATION CARD entity totally participates in a “Have” relationship with the CITIZEN entity, because an identification card cannot exist without a relevant citizen. Is the IDENTIFICATION CARD a weak entity or a strong one?
Wrong answer:
Many students fall into the trap of considering it a weak entity.
Right answer:
IDENTIFICATION CARD is still a strong entity as its unique number is its primary key.
Misconception 7: “Weak entity determination”
The mistaken belief that the entities that we can get rid of in the ERD are the weak entities and vice versa.
Example question:
Suppose we have HOTEL and ROOM entities connected via the Has relationship. Is ROOM a weak entity or a strong one? And, how will be its relational schema diagram?
Wrong answer:
ROOM is a strong entity. Surprisingly, many students' justifications were that the existence of the ROOM entity is important in the ER diagram as a main construct, as there is no hotel without rooms.
So their resulting schema was ROOM (Rno, RCharacteristics), where room number (Rno) is the primary key. Ignoring two facts, the first is that room number (Rno) cannot uniquely identify rooms across different hotels, while the second is that deciding whether the entity is important. It is not an absolute decision, but its importance depends on the application requirement. So, using entity existence importance as a criterion in deciding whether the entity is weak is a very wrong misconception leading to lots of design mistakes.
Right answer:
ROOM is a weak entity as room numbers are repeated across different hotels. So, the ROOM entity has no primary key on its own. Room number (Rno) is just a partial key. So, the right schema is ROOM (Rno, Hno, RCharacteristics), where the primary key is the composite of (Rno, Hno).
Given below are two different problem statements for two different stores to illustrate the misconceptions numbers 8 and 9. These examples were inspired by the work done by Rashkovits and Lavy (2020).
Problem 1: “Store X has a lot of salespersons to sell their several commodities around the world. The store's policy states that each salesperson is allowed to sell the store's commodities in each region. Moreover, multiple salespersons are allowed to sell commodities in the same region. In this case, each salesperson can set a different price for each commodity type.”
Problem 2: “Store Y has a lot of salespersons to sell their several commodities around the world. The store's policy states that each region has only one salesperson who sells all the store's commodities exclusively. A salesperson is permitted to distribute in many regions. The price of each commodity is set differently for each region.”
Misconception 8: “Ternary relationship equivalence to multiple binaries”
Example question:
Assuming each entity has two attributes (name and ID), where ID is the primary key, for each store, draw the appropriate ERD.
Note: In this misconception (MC 8), students' wrong answers came in many forms mentioned below, but only an ERD of one of the wrong alternatives is shown for each store to save space.
Wrong answer:
Store X:
Using three or two N:M binary relations between REGION, SALESPERSON, and COMMODITY entities instead of one ternary relationship. Figure 2 shows store X's wrong ERD using three binary relations between the three entities.
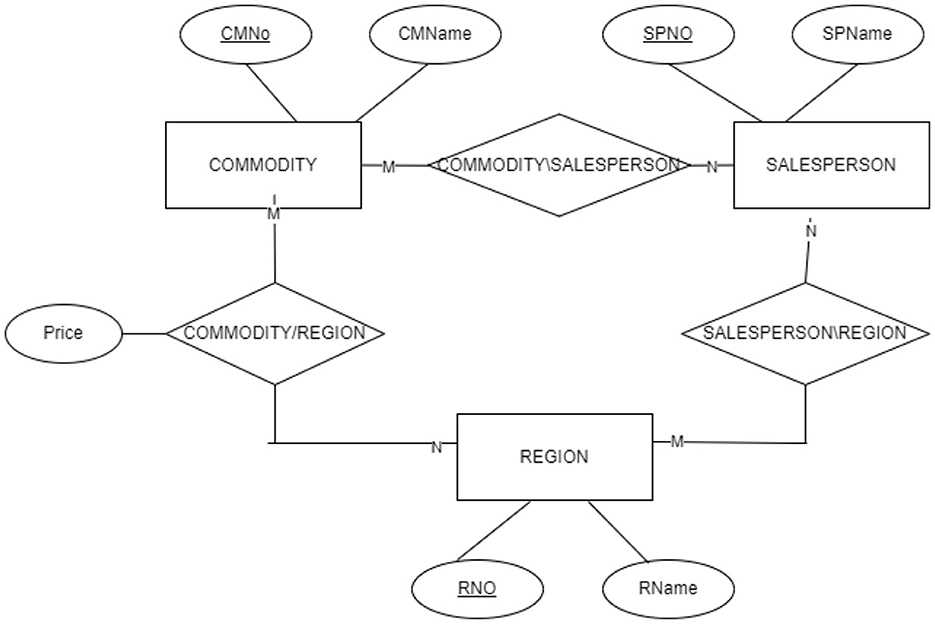
Figure 2. ER diagram illustrating student misconception (MC 8) which is using three binary relationships instead of only one ternary relation in designing solution for store X problem. This design solution does not fit the problem specifications and can not achieve store X requirements.
Store Y:
Alternative 1: Using 1:M:N ternary relation between REGION, SALESPERSON, and COMMODITY entities shown in Figure 3.
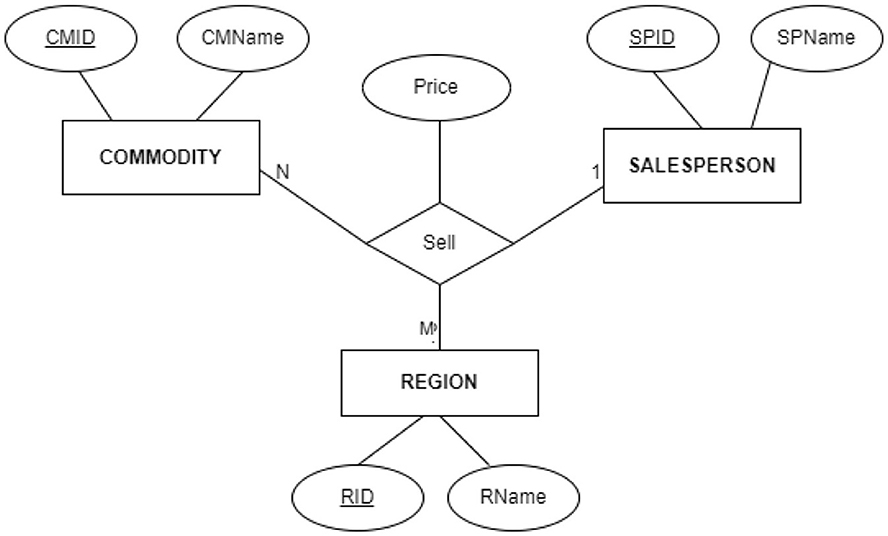
Figure 3. ER diagram illustrating student misconception (MC 8), this case is opposite to the case given in Figure 2, which is using one ternary relation instead of three binary relationships in designing solution for store Y problem. This solution can not achieve store Y requirements.
Alternative 2: Using three binary relations.
Alternative 3: Using only two binary relations, one is a N:M relation linking the SALESPERSON to the COMMODITY containing the price attribute and the other is a 1:M relation between the SALESPERSON and REGION.
Right answer:
Store X:
Using only one N:M:P ternary relationship with price as a relationship attribute, as shown in Figure 4.
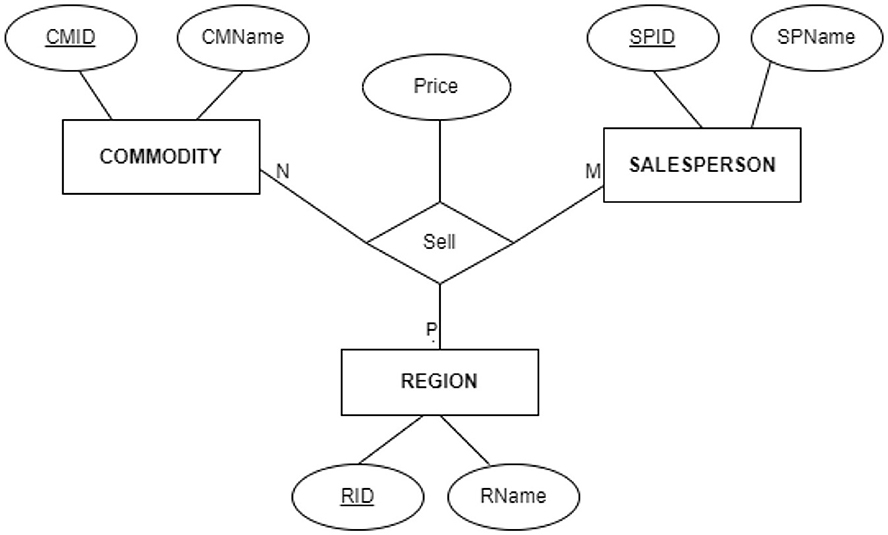
Figure 4. ER diagram showing that using one ternary relation is the correct solution for the store X problem that perfectly fulfills its requirements. This solution should be used in solving store X problem instead of the one given in Figure 2.
Store Y:
Using two binary relations, the first is a 1:M relation between SALESPERSON and REGION entities, and the second is an N:M relation between COMMODITY and REGION relations with price as a relational attribute as the price of the COMMODITY is set different for each REGION as shown in Figure 5.
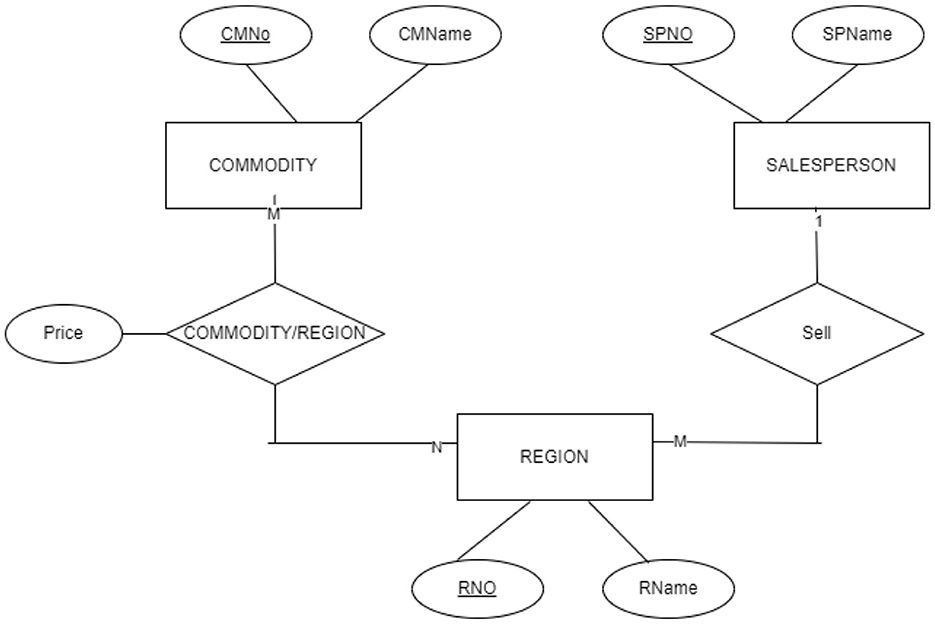
Figure 5. ER diagram showing that using two binary relationships is the correct solution for the store Y problem that perfectly fulfills its requirements. This solution should be used in solving store Y problem instead of the one given in Figure 3.
Misconception 9: “Identifying ternary relationship cardinality”
Students mostly consider any ternary relationship as N:M:P relation, as they do not know how the cardinality of an entity is calculated with respect to the other two entities, and how to map different relationship cardinalities to the corresponding relational schema.
Example question:
Write the correct relational schemas corresponding to stores' X and Y ERDs, illustrating primary and foreign keys.
Wrong answer:
Store X
Most of the students who gave the right ERD, which is N:M:P, translated it correctly to the corresponding relational schema. No errors or misunderstandings were found in this case.
Store Y
All students who considered store Y ERD design as a 1:N:M relation could not map it correctly to the corresponding relational schema.
Right answer:
Store X
SALESPERSON (SPID, SPname)
COMMODITY (CMNO, CMname)
REGION (RNO, Rname)
SELL (SPID, CMNO, RNO, price)
Store Y
SALESPERSON (SPID, SPname)
COMMODITY (CMNO, CMname)
REGION (RNO, Rname, SPID (FK))
COMMODITY/REGION (CMNO, RNO, price)
3.2 The proposed intervention for addressing the identified misconceptions (RQ2)
From our 10 years of experience teaching an introductory database course and our strenuous analysis of students' misconceptions discussed in the previous section, we have found that traditional teaching methods have not produced students who are sufficiently proficient in designing efficient databases. This is because when a student is asked to design a database for a specific problem, he initially tries to build an ER model as described in most traditional textbooks, as an abstract conceptual design according to the theoretical rules he has learned, ignoring some important facts. The first fact is that the traditional textbooks always present the correct solution for any given problem, while solving a real problem requires more consideration of alternative solutions until the most efficient solution is reached. The second fact is that the database model diagram used (e.g., ERD) should be designed to fit all possible data according to the problem specification, not data to fit the designed database model. Finally, to achieve this, the student should first imagine and trace how each piece of data is actually stored in the proposed design, which is the opposite of what the students learned, by being given the correct design where the design is populated with actual data in the final design phase (i.e., physical design not conceptual or logical design).
In response to our findings, the proposed visualization tool has some specific goals. These goals are increasing the DBCs learner's ability to imagine how data is actually stored when the designed ERD is converted to physical table, trace the consequences of the selected design, and focus on all student misconceptions by bringing student's attention to the nature of the potential error in each concept and its differentiation from the right one. These capabilities distinguish this tool from other available educational tools in the literature. The proposed tool was developed using the JavaScript Algorithm Visualization (JSAV) technology (Karavirta and Shaffer, 2013). JSAV is an open source educationally oriented algorithm visualization (AV) framework. JSAV is the first AV development system implemented in HTML5/JavaScript with support for both animated slideshows and engaging, automatically assessed exercises. It represents the collective experience of three major AV development groups: Aalto University, Virginia Tech, and the JHAVE community. Their differing perspectives have ensured that JSAV is able to support the needs of a broad community within a development environment of HTML5. The user interface of JSAV is all HTML, with the functionality implemented in JavaScript and the appearance specified with CSS. This makes integrating JSAV visualizations within hypertext simple and flexible. JSAV takes advantage of many existing, high-quality JavaScript libraries, such as jQuery, jQueryUI, and Raphael. One of its major advantages is that it supports all modern versions of Chrome, Firefox, and Safari browsers. The library should work in IE and Opera, Mobile Safari on iOS, and the default browser on Android. JSAV supports different types of visualizations on multiple engagement levels such as static images of data structures. JSAV allows easy generation of figures under programmatic control to illustrate learning material. The advantage of these images compared to other formats is the ease in changing visual appearance and the data presented. The second type of visualization is slideshows, which show a series of steps to animate the behavior of an algorithm. The student can not only view the AV but also can control the slideshow by moving a step backward or forward, to the beginning or the end. The speed of transition animations can also be changed. The building blocks used in creating JSAV visualizations are similar to many existing AV systems. Three types of objects, data structures, graphical primitives, and code, exist in JSAV. Our tool depends on a multidimensional array as a main data structure, representing datasets and physical data tables. JSAV array structures support operations, such as set/get values of array elements used to simulate database insertion and deletion operations. There are also methods to change the visual appearance of parts of a structure. Calls to any operations that change the state or visual appearance of the objects are recorded and can be undone and redone by the student when in slideshow mode. The default visual appearance for all visual elements can also be specified using CSS. Finally, all data structures support the automatic layout of their elements and allow manual positioning. Our tool uses JSAV graphical primitives as text, line, circle, ellipse, rectangle, polygon, polyline, and a general path. JSAV includes many useful capabilities like combining multiple graphical primitives into a set, changing visual appearance through method calls on the objects, or specifying their default appearance using CSS, and also scaling, rotating, and moving the objects while recording all these changes to the animation.
The distinctive features of our proposed tool are summarized as follows. The tool is equipped with text, images, and visualizations. The content supported by the tool is divided into three modules that cover all basic introductory DBCs as shown in Table 3. All discovered misconceptions for each DBC, found in the literature or through our analysis given in Table 1, were addressed by our proposed visualizations. A special strategy was adopted in our visualizations for allowing students to imagine choosing a design as a dynamic process of repeatedly inserting real data covering all possible test cases to see whether the design fits all of these cases or will result in a physical or logical error. This strategy provides a more engaging way to understand DBCs so as to inspire students to build correct relationships in any database design easily. In contrast to the existing learning techniques, our proposed visualizations can motivate and boost students' thinking abilities.
Table 3. Visualization tool modules and content.
Here is an example of how visualizations were built upon students' common misconceptions. This example is targeting one of the major misconceptions that we have found in our research. It is misconception number eight (MC8) in Tables 1, 2, which is the “equivalence of a ternary relationship to multiple binary relationships.” To resolve this misconception, an example that should be solved using a ternary relationship was given to 2022 year students in the exam taken during the misconception detection process in the third main phase (MD phase 5 shown in Figure 1). After inspecting all students' answers, we found that most of the students solved the question using two binary relationships, a few of them solved it using three binary relationships, and very few students solved it correctly. We have decided to build a set of visualizations solving two problems for the same domain, but they differ in requirements and specifications. One of them must be solved using a ternary relationship, and the other must be solved using two binary relationships, and their solutions cannot be interchanged. The examples included in the visualizations conform to the study performed by Rashkovits and Lavy (2020) that discusses ternary relationship misconceptions. All students' wrong answers obtained from the 2022 exam inspection were traced in different visualizations showing the consequence of that wrong choice and illustrating why the chosen design is faulty. Moreover, a visualization is devoted to illustrating each correct solution. Figure 6 shows a problem specification. Figures 7–9 are sample slides of a visualization that shows all the possible wrong solutions that a student might make while Figure 10 shows the only correct solution for problem given in Figure 6. At this stage of visualization, the student encounters all possible solutions without referring to the correct one. This is to stimulate students' thinking ability. Then, a visualization is devoted to demonstrating each of these design alternatives as shown in Figures 11–14. Each visualization starts with the same dataset, containing different data records representing all possible instances of the problem specification in Figure 6, and then the visualization attempts to insert each record in the dataset into the corresponding design to reveal whether that design fits all the data or gets stuck at a certain point due to an error, as shown in the figures. If an error occurs, the nature of the error and its cause are explained in the visualization to help students avoid making the same mistake again.
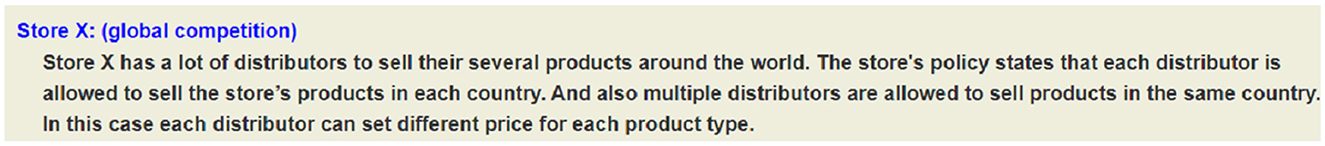
Figure 6. Problem example for ternary relationship misconception.
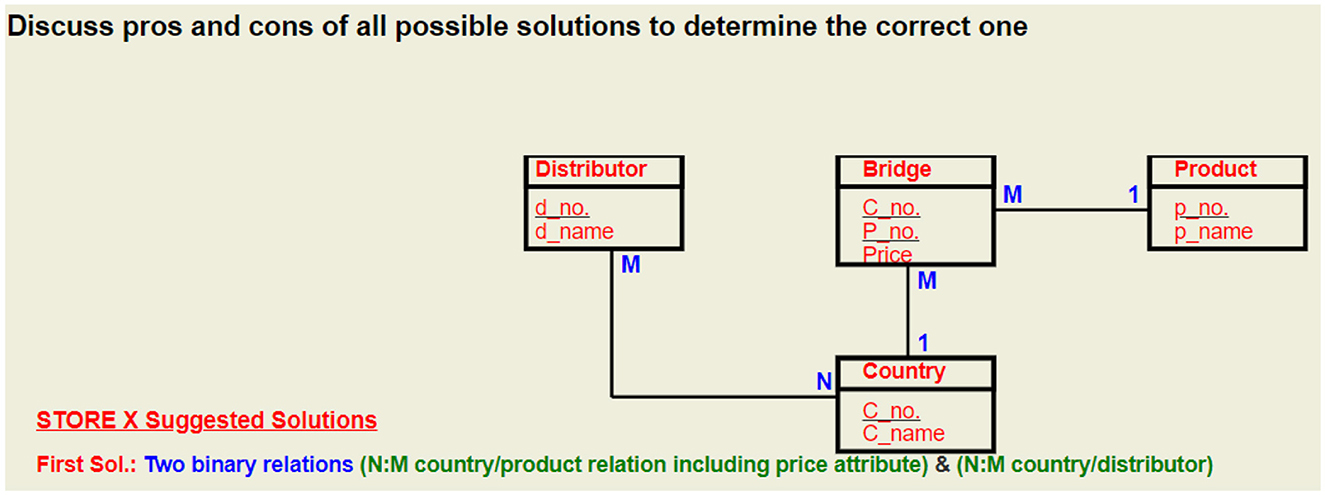
Figure 7. First proposed solution for problem given in Figure 6.
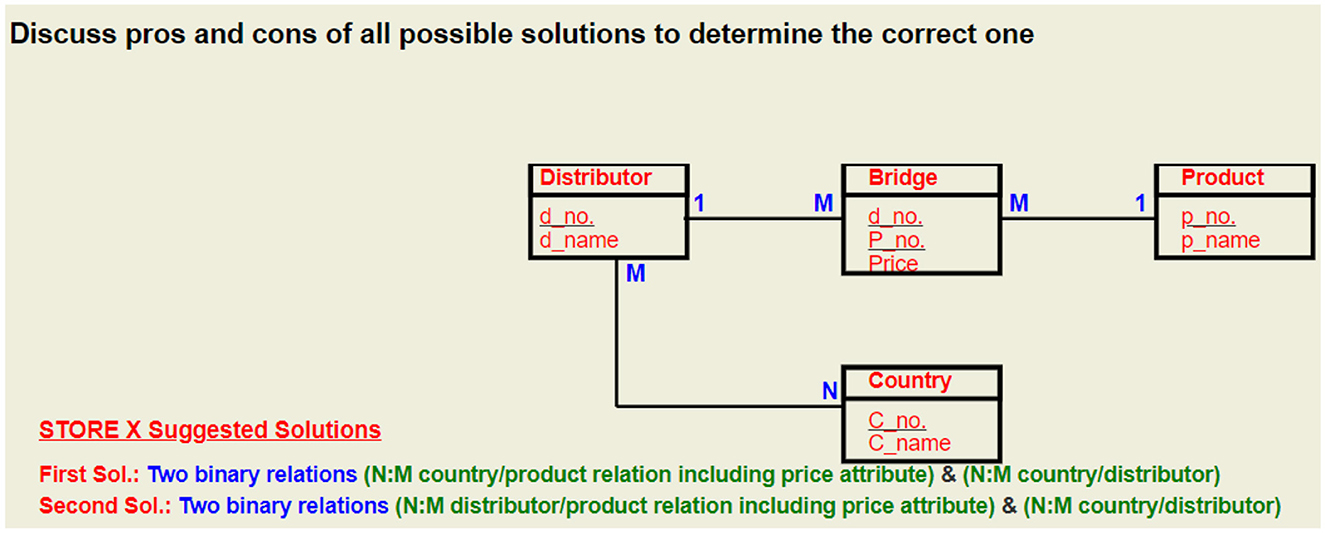
Figure 8. Second proposed solution for problem given in Figure 6.
Figure 9. Third proposed solution for problem given in Figure 6.
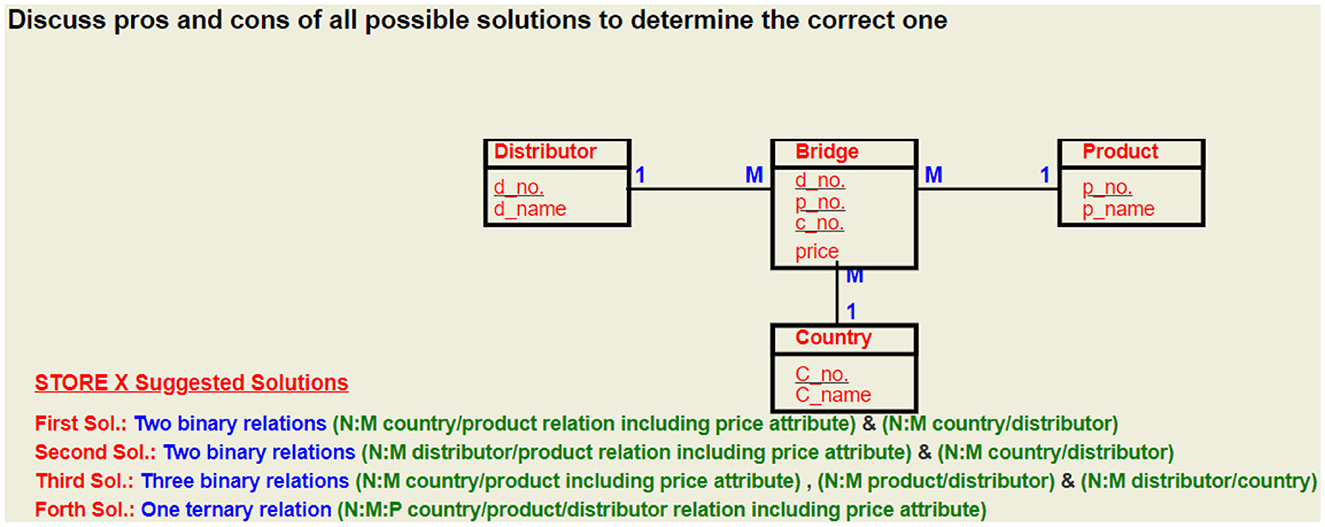
Figure 10. Fourth proposed solution for problem given in Figure 6.
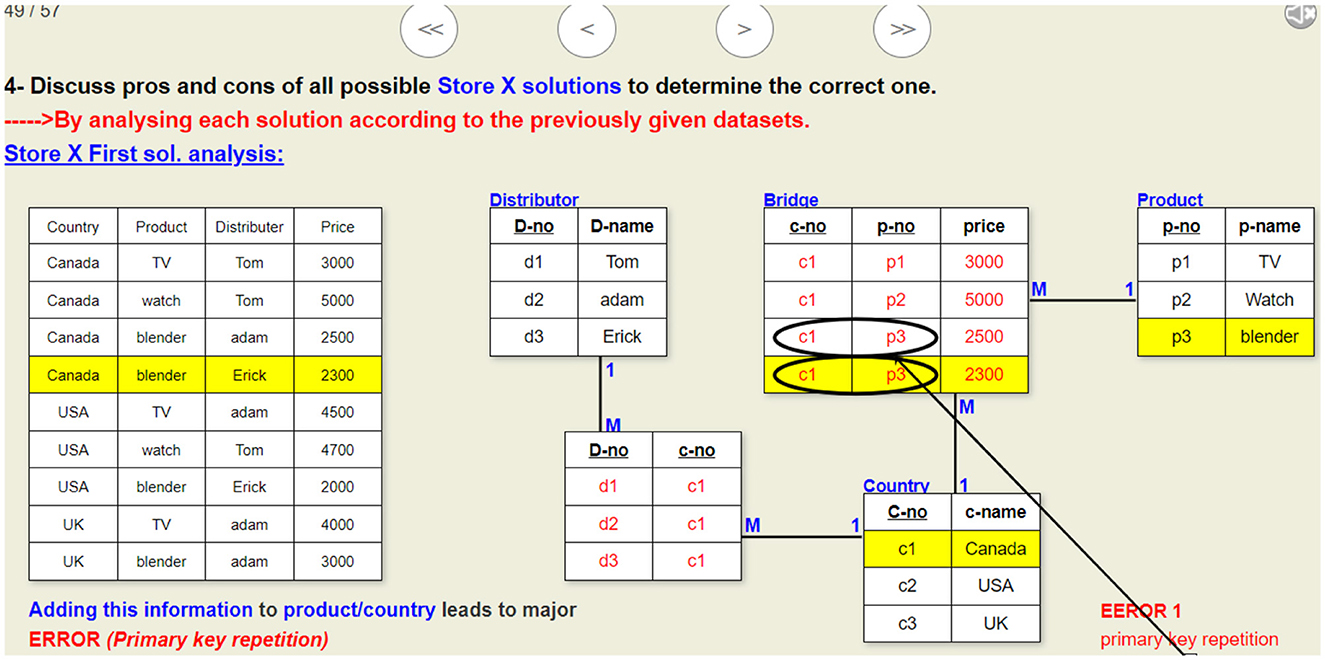
Figure 11. A sample slide of the visualization that analyzes the first proposed solution given in Figure 7. This visualization illustrates why this ERD design is erroneous.
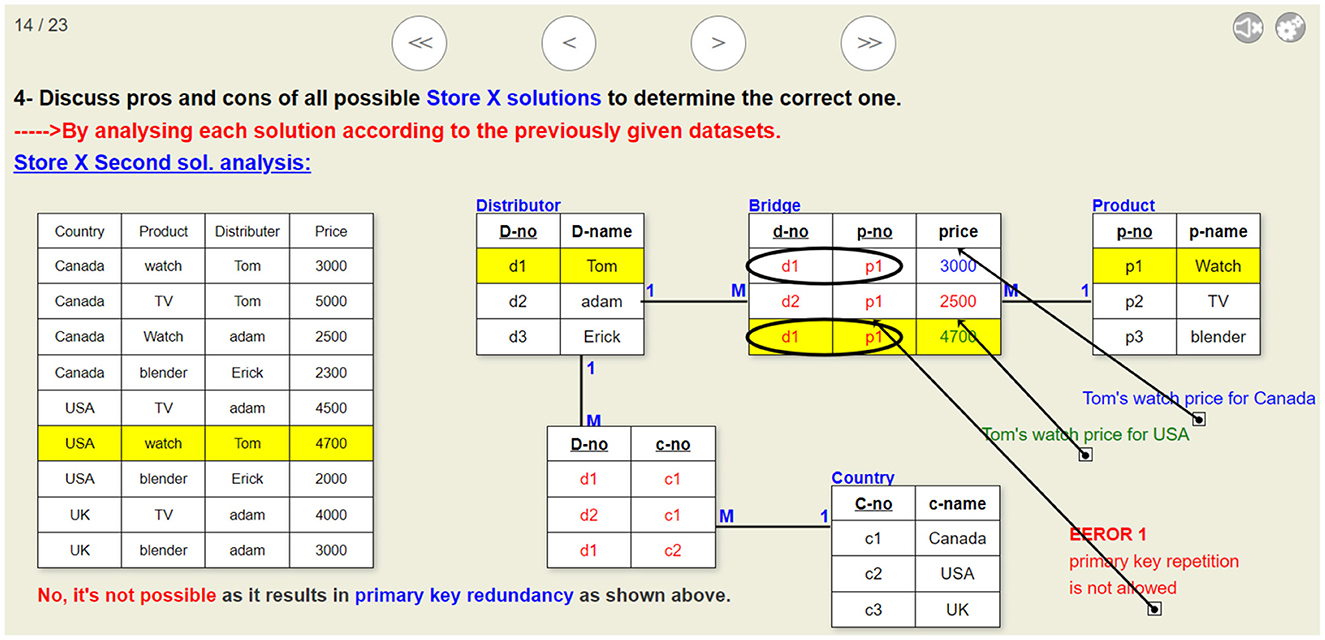
Figure 12. A sample slide of the visualization that analyzes the second proposed solution given in Figure 8. This visualization illustrates why this ERD design is erroneous.
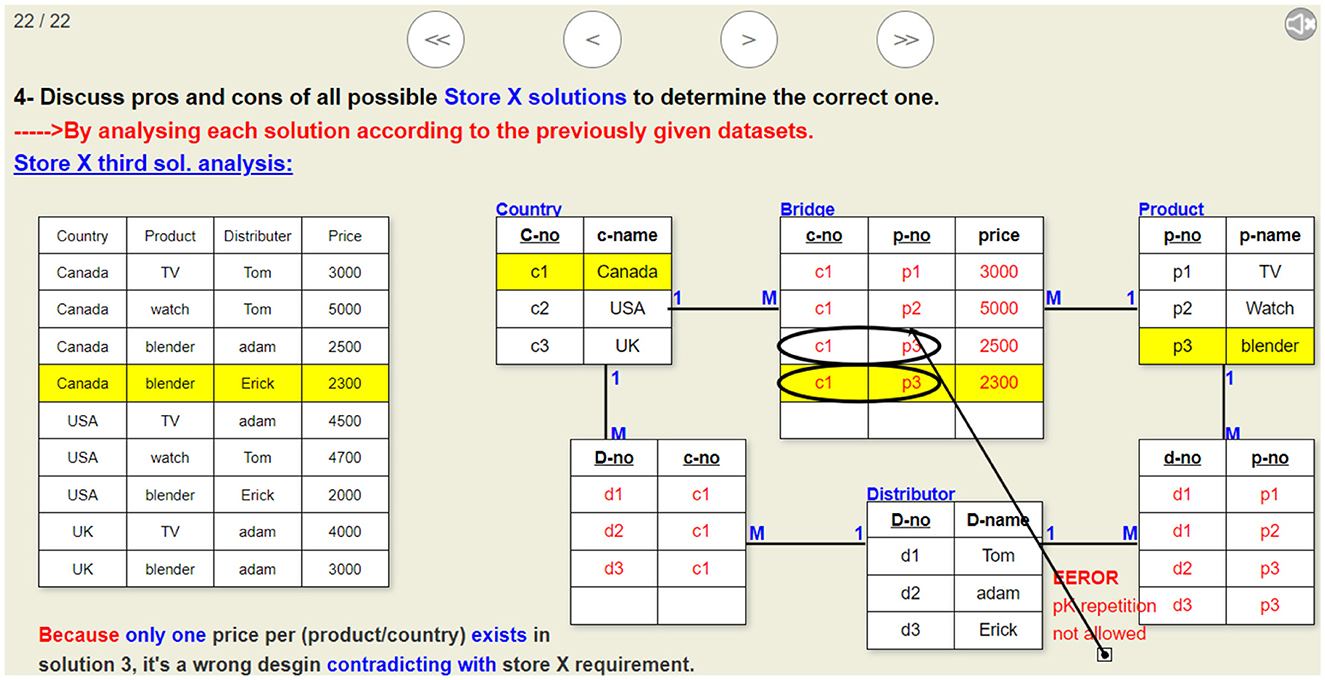
Figure 13. A sample slide of the visualization that analyzes the third proposed solution given in Figure 9. This visualization illustrates why this ERD design is erroneous.
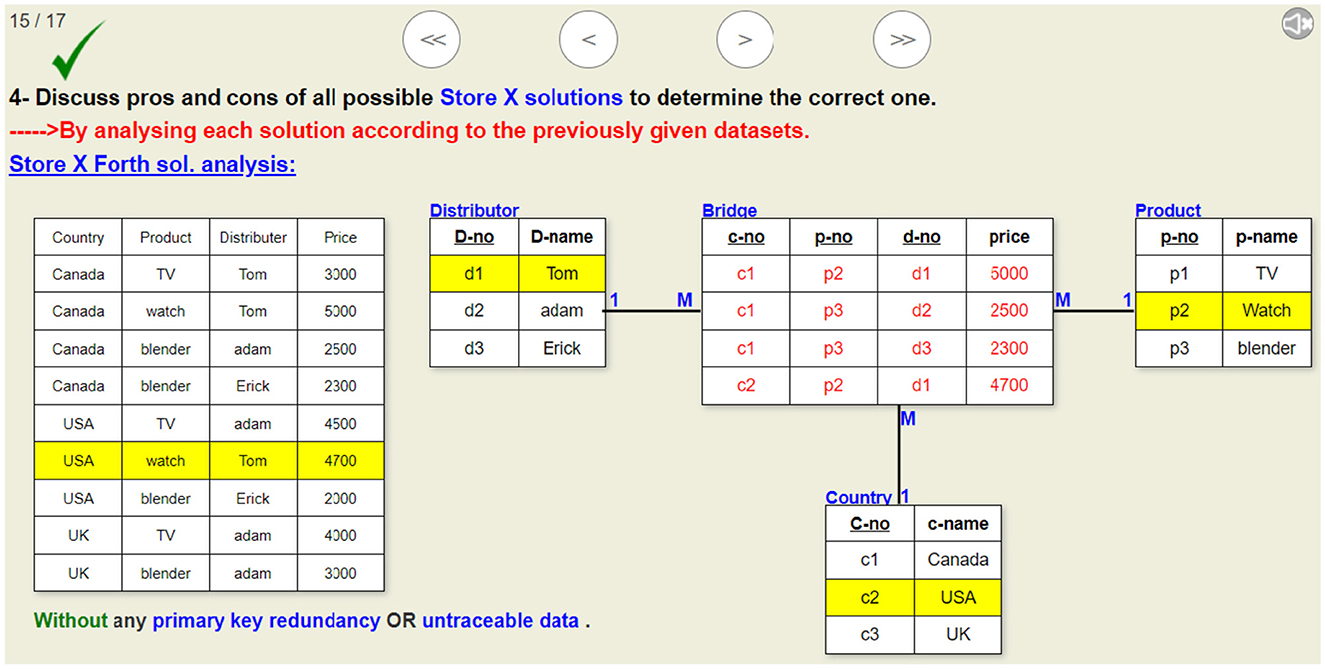
Figure 14. A sample slide of the visualization that analyzes the fourth proposed solution given in Figure 10. This visualization shows why the ternary relationship is the only correct solution.
In our visualization tool, another set of visualizations was also built to illustrate the other problem type that need to be solved using two binary relations instead of one ternary relationship. This method ensures that the student will be exposed to all types of errors (e.g., primary key repetition, data redundancy, untraceable data, and other logical errors, all of which were discussed in the visualizations) that they may encounter due to the existing misconceptions. This was just an example to illustrate the adopted approach during building visualizations to resolve the discovered misconceptions.
Section 4 presents and analyzes the empirical results of this study, including the identified misconceptions and measures of intervention effectiveness, which collectively support hypotheses H1 and H2.
4 Results and discussion
Following the methods in Section 3, we first discuss the concluded misconceptions (H1) and compare outcomes to prior work, then evaluate the intervention (H2).
4.1 Validation of DBCs' misconceptions (H1)
As shown in Table 1, our analysis revealed nine persistent database design misconceptions affecting 16%–98% of students. Notably, we identified five previously undocumented misconceptions (MC1, MC2, MC3, MC4, and MC7), including difficulties such as ERD-to-relational schema mapping (MC1, 20%), Mixing ERD different notations (MC2, 60%), misunderstanding relationship attributes' effect on cardinality (MC3, 33%), and its impact on relational schema (MC4, 16%). The last one is (MC7, 18%) about the difficulty of determining the weak entity. These findings complement four literature-aligned misconceptions, such as ternary relationship different misconceptions in (MC8, 75%) and (MC9, 98%), weak entity misconception found in (MC6, 55%), confirming known challenges while exposing new educational gaps. The most critical issue emerged in ternary relationship cardinality (MC9), with 98% of students demonstrating complete misunderstanding (mean score 0.000), followed by notation mixing (MC2, 60%) and weak entity differentiation (MC6, 55%). Performance metrics reveal distinct learning patterns. Extremely low mean scores (MC2: 0.014; MC8: 0.014; MC9: 0.000) indicate fundamental conceptual failures, while intermediate scores like MC3's 0.793 suggest partial comprehension where targeted remediation could prove effective.
These results tell us two important things for teaching database design: first, we need to focus most on the concepts where students make the most mistakes, especially ternary relationships. Second, for concepts where students show some understanding (such as relationship attributes), we can build on what they partly know. The findings highlight both ongoing teaching challenges we knew about and new problem areas we discovered, showing why we need to keep studying how students learn DBCs. These findings validate H1, demonstrating that undergraduate database students exhibit common recurring misconceptions that are predictable and identifiable through both the literature and empirical analysis.
4.2 Validation of intervention effectiveness (H2)
We evaluated the effectiveness of the proposed visualizations through a comparative study at Assiut University, Egypt. The control group (Spring 2022) used traditional textbooks, while the intervention group (Spring 2023) employed our visualizations in an undergraduate introductory database course. The study measured post-test performance and assessed students' understanding of the specific misconceptions targeted by the visualizations. This assessment was first achieved by employing the Mann–Whitney non-parametric test (Mann and Whitney, 1947), with 5% significance level to compare post-test scores between the control group (2022) and the intervention group (2023). As presented in Table 4, the intervention group achieved significantly higher post-test scores (p < .0001), indicating that the our visualizations had a positive impact on students' understanding of the tested database concepts.
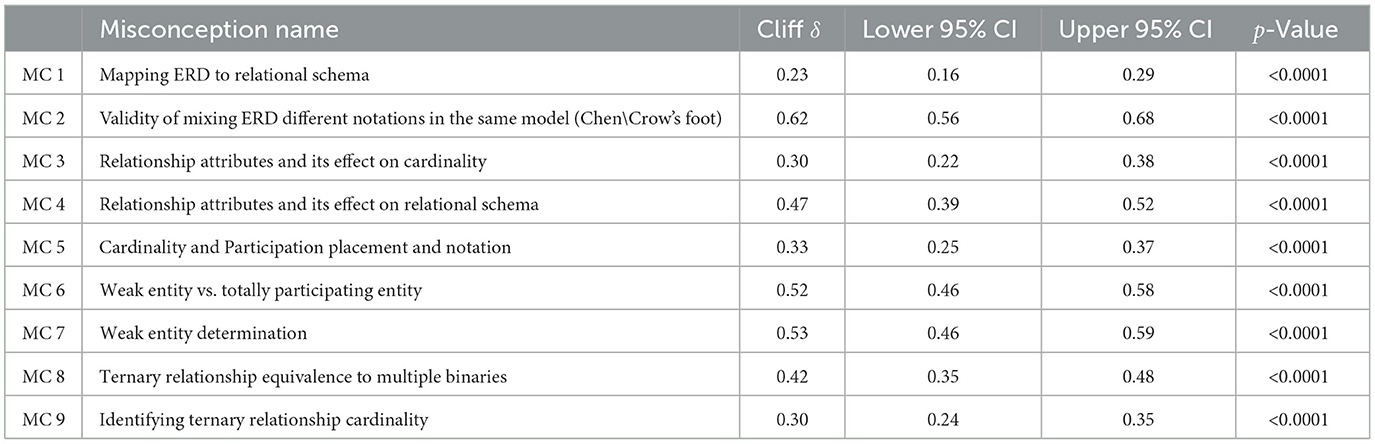
Table 4. Effect sizes (cliff's δ) and statistical significance of intervention effectiveness in addressing database design concepts misconceptions (control group students: n = 425, intervention group students: n = 257).
Second, a further in-depth analysis of 425 control and 257 intervention participants showed statistically significant improvements across all nine targeted database modeling misconceptions, with Cliff's δ effect sizes (Meissel and Yao, 2024; Cliff, 1993) confirming practical significance (δ ≥ 0.147). Following conventional interpretation thresholds (Meissel and Yao, 2024), effects were categorized as: large (δ ≥ 0.474) for MC2 (δ = 0.62) and MC6-7 (δ ≈ 0.52–0.53); medium (0.33 ≤ δ < 0.474) for MC4 (δ = 0.47) and MC8 (δ = 0.42); and small (0.147 ≤ δ < 0.33) for the remaining misconceptions. Notably, while the substantial control group size (n = 425) enhanced statistical power to detect even minor effects, the observed effect sizes, particularly for some concepts such as MC1 (δ = 0.23), should be interpreted cautiously. The apparent modest effects in some misconceptions do not necessarily indicate limited intervention effectiveness, but rather reflect the inherent challenge of achieving large effect sizes in educational interventions, particularly with imbalanced group sizes. Crucially, all effects exceeded the δ ≥ 0.147 threshold for practical significance in education research, confirming the intervention's consistent positive impact across all measured concepts (Hess and Kromrey, 2004). The robust effects for resolving some of the existing misconceptions (e.g., MC2, MC6, and MC7) coupled with statistically significant, albeit smaller, improvements in the other misconceptions collectively demonstrate the intervention's comprehensive effectiveness. This indicates that the visualizations improved student learning of concepts where students typically encounter difficulties and misconceptions. Survey feedback from the intervention group revealed that the materials were clear, engaging, and easy to use, with many students preferring the proposed visualizations over textbooks. These findings suggest that our visualizations could be a valuable tool for teaching basic database design concepts, especially those that are commonly misunderstood that proves the validity of H2. More details of the design, implementation, and evaluation can be found in Abdelaziz et al. (2024).
5 Threats to validity
One of the techniques used during the misconception detection process was inspecting sample sets of students' answers. We inspected a sample of students' final exam answers for the Spring 2018 and 2019 semesters. This might not reflect the current students' misconceptions. The reason we relied on the 2018 and 2019 exams is that, starting in Spring 2020, all exams at our institution were offered online as MCQ questions in response to the pandemic and, therefore, these exams were not reliable to use to extract new misconceptions. To overcome this threat, another phase of misconception detection was conducted by examining students' answers to the 2022 Spring exam. The 2022 final exam was formulated to target all previously discovered misconceptions from the 2018 and 2019 exams to validate them. We discussed all details of the misconception detection process in Section 3.1
6 Conclusions and future work
In this study, we describe our efforts to identify common misconceptions among undergraduate students related to database design concepts. Through the results of the extensive misconception detection process, we found that the identified misconceptions could be considered problematic for a large number of undergraduate students, especially those who are taking an introductory database course for the first time. We concluded a list of nine misconceptions: mapping ERD to relational schema, mixing ERD different notations in the same model (Chen\Crow's foot), relationship attributes and its effect on cardinality, relationship attributes and its effect on relational schema, cardinality and participation placement and notation, weak entity vs. totally participating entity, weak entity determination, ternary relationship equivalence to multiple binaries, and identifying ternary relationship cardinality.
We believe that highlighting and addressing these misconceptions was crucial in improving students' learning of DBCs. We also believe that our findings will be helpful to undergraduate database instructors, and we encourage them to adopt our visualizations in their courses and test their effectiveness in their own settings. Our visualizations are open-source and available online for free use.
Our future work will be directed toward developing visualizations for other database topics such as relational algebra and the Structured Query Language (SQL). In addition, we plan to improve the students' engagement level of our visualizations according to the engagement taxonomy proposed by Naps et al. (2002). Currently, our visualizations are in the “Viewing” level of the taxonomy. We plan to improve our students' level of engagement visualizations to the “Responding” level by adding pop-up questions that can be used in slideshows to immediately gauge students' level of understanding of the presented concept. Further evaluation will be needed to see if there is any difference between the visualizations at the “Viewing” level and those at the “Responding” level.
Data availability statement
The datasets presented in this article are not readily available because The data used in this study consists of students' handwritten exam answer sheets, which exist only in hard copy form. As such, the data is not readily available in digital format. Requests to access the datasets should be directed to the corresponding author, Tm9oYS5hYmRlbGF6aXpAYXVuLmVkdS5lZw==.
Ethics statement
Ethical review and approval was not required for the study on human participants in accordance with the local legislation and institutional requirements. The participants provided their written informed consent to participate in this study.
Author contributions
NA: Resources, Software, Validation, Visualization, Writing – original draft. MF: Conceptualization, Formal analysis, Supervision, Writing – review & editing. MM: Conceptualization, Formal analysis, Supervision, Writing – review & editing. TS: Project administration, Supervision, Writing – review & editing.
Funding
The author(s) declare that no financial support was received for the research and/or publication of this article.
Acknowledgments
This study was supported by the College of Computers and Information in Assiut University, Egypt. Special thanks to Dr. Ibrahim E. Elsemman, the instructor of the Database Design course, for his support.
Conflict of interest
The authors declare that the research was conducted in the absence of any commercial or financial relationships that could be construed as a potential conflict of interest.
Generative AI statement
The author(s) declare that no Gen AI was used in the creation of this manuscript.
Publisher's note
All claims expressed in this article are solely those of the authors and do not necessarily represent those of their affiliated organizations, or those of the publisher, the editors and the reviewers. Any product that may be evaluated in this article, or claim that may be made by its manufacturer, is not guaranteed or endorsed by the publisher.
Abbreviations
DBCs, database design concepts; DBMS, database management systems; ERD, entity relationship diagram; MD, misconception detection; JSAV, JavaScript algorithm visualization.
References
Abdelaziz, N., Farghally, M., Mohammed, M., and Soliman, T. (2024). “An interactive visual presentation of core database design concepts,” in SIGCSE Virtual 2024 (New York, NY: Association for Computing Machinery), 5–11. doi: 10.1145/3649165.3690103
Adams, E. S., Granger, M., Goelman, D., and Ricardo, C. (2004). Managing the introductory database course: what goes in and what comes out? ACM SIGCSE Bull. 36, 497–498. doi: 10.1145/1028174.971467
Antony, S. R., and Batra, D. (2002). Codasys: a consulting tool for novice database designers. ACM SIGMIS Database 33, 54–68. doi: 10.1145/569905.569911
Batra, D., and Antony, S. (1994). Novice errors in conceptual database design. Eur. J. Inf. Syst. 3, 57–69. doi: 10.1057/ejis.1994.7
Buraga, S. C., Amariei, D., and Dospinescu, O. (2022). An owl-based specification of database management systems. Comput. Mater. Contin. 70, 5537–5550. doi: 10.32604/cmc.2022.021714
Chilton, M. A. (2006). Data modeling using entity relationship diagrams: a step-wise method. J. Inf. Syst. Educ. 17:385.
Cliff, N. (1993). Dominance statistics: ordinal analyses to answer ordinal questions. Psychol. Bull. 114, 494. doi: 10.1037/0033-2909.114.3.494
Cvetanovic, M., Radivojevic, Z., Blagojevic, V., and Bojovic, M. (2010). Advice—educational system for teaching database courses. IEEE Trans. Educ. 54, 398–409. doi: 10.1109/TE.2010.2063431
Dietrich, S. W., Goelman, D., Borror, C. M., and Crook, S. M. (2014). An animated introduction to relational databases for many majors. IEEE Trans. Educ. 58, 81–89. doi: 10.1109/TE.2014.2326834
Dullea, J., Song, I.-Y., and Lamprou, I. (2003). An analysis of structural validity in entity-relationship modeling. Data Knowl. Eng. 47, 167–205. doi: 10.1016/S0169-023X(03)00049-1
Goelman, D., and Dietrich, S. W. (2018). “A visual introduction to conceptual database design for all,” in Proceedings of the 49th ACM Technical Symposium on Computer Science Education (New York, NY: ACM), 320–325. doi: 10.1145/3159450.3159555
Goldweber, M., Wei, M., Aly, S., Raj, R. K., and Mokbel, M. (2022). The 2022 undergraduate database course in computer science: what to teach? ACM Inroads 13, 16–21. doi: 10.1145/3549545
Hamzah, M. L., Rukun, K., Rizal, F., Purwati, A. A., and Hamzah, Zarnelly (2019). A review of increasing teaching and learning database subjects in computer science. Revista Espacios 40.
Hess, M. R., and Kromrey, J. D. (2004). “Robust confidence intervals for effect sizes: a comparative study of Cohen's d and cliff's delta under non-normality and heterogeneous variances,” in Annual meeting of the American Educational Research Association, volume 1 (Citeseer).
Hvalshagen, M., Lukyanenko, R., and Samuel, B. M. (2023). Empowering users with narratives: examining the efficacy of narratives for understanding data-oriented conceptual models. Inf. Syst. Res. 34, 890–909.
Imbulpitiya, A., Whalley, J., and Senapathi, M. (2021). “Examining the exams: bloom and database modelling and design,” in Proceedings of the 23rd Australasian Computing Education Conference (New York, NY: ACM), 21–29. doi: 10.1145/3441636.3442301
Ishaq, M., Abid, A., Farooq, M. S., Manzoor, M. F., Farooq, U., Abid, K., et al. (2023). Advances in database systems education: methods, tools, curricula, and way forward. Educ. Inf. Technol. 28, 2681–2725. doi: 10.1007/s10639-022-11293-0
Jones, T. H., and Song, I.-Y. (2000). Binary equivalents of ternary relationships in entity-relationship modeling: a logical decomposition approach. J. Database Manag. 11, 12–19. doi: 10.4018/jdm.2000040102
Karavirta, V., and Shaffer, C. A. (2013). “JSAV: the JavaScript algorithm visualization library,” in Proceedings of the 18th ACM Conference on Innovation and Technology in Computer Science Education (New York, NY: ACM), 159–164. doi: 10.1145/2462476.2462487
Kung, H.-J., and Kung, L. (2013). An interactive tool to improve learning of data modeling: a survey study. J. Comput. Sci. Coll. 28, 11–18.
Lin, Y. (2020). “Student-centered teaching design and practice of database course,” in 2020 International Conference on Advanced Education, Management and Information Technology (AEMIT 2020) (Dordrecht: Atlantis Press), 149–153. doi: 10.2991/assehr.k.200727.033
Lu, Y., Mao, X., Zhou, M., Zhang, Y., Wang, T., Li, Z., et al. (2020). “Haste makes waste: an empirical study of fast answers in stack overflow,” in 2020 IEEE International Conference on Software Maintenance and Evolution (ICSME) (Adelaide, SA: IEEE), 23–34. doi: 10.1109/ICSME46990.2020.00013
Mamykina, L., Manoim, B., Mittal, M., Hripcsak, G., and Hartmann, B. (2011). “Design lessons from the fastest Q&A site in the west,” in Proceedings of the SIGCHI conference on Human factors in computing systems (New York, NY: ACM), 2857–2866. doi: 10.1145/1978942.1979366
Mann, H. B., and Whitney, D. R. (1947). On a test of whether one of two random variables is stochastically larger than the other. Ann. Math. Stat. 18, 50–60. doi: 10.1214/aoms/1177730491
Meissel, K., and Yao, E. S. (2024). Using cliff's delta as a non-parametric effect size measure: an accessible web app and r tutorial. Pract. Assess. Res. Eval. 29, 1–12.
Mitrovic, A., and Suraweera, P. (2016). Teaching database design with constraint-based tutors. Int. J. Artif. Intell. Educ. 26, 448–456. doi: 10.1007/s40593-015-0084-6
Morien, R. I. (2006). A critical evaluation database textbooks, curriculum and educational outcomes. Director 7, 1–14.
Murray, M., and Guimaraes, M. (2008). Animated database courseware: using animations to extend conceptual understanding of database concepts. J. Comput. Sci. Colleges 24:144.
Nagataki, H., Nakano, Y., Nobe, M., Tohyama, T., and Kanemune, S. (2013). “A visual learning tool for database operation,” in Proceedings of the 8th Workshop in Primary and Secondary Computing Education (New York, NY: ACM), 39–40. doi: 10.1145/2532748.2532771
Naik, S., and Gajjar, K. (2021). “Applying and evaluating engagement and application-based learning and education (enable): a student-centered learning pedagogy for the course database management system. J. Educ. 1:13. doi: 10.1177/00220574211032319
Naps, T. L., Rößling, G., Almstrum, V., Dann, W., Fleischer, R., Hundhausen, C., et al. (2002). “Exploring the role of visualization and engagement in computer science education,” in Working Group Reports from ITiCSE on Innovation and Technology in Computer Science Education (New York, NY: ACM), 131–152. doi: 10.1145/960568.782998
Ntshalintshali, G. M., and Clariana, R. B. (2020). Paraphrasing refutation text and knowledge form: examples from repairing relational database design misconceptions. Educ. Technol. Res. Dev. 68, 2165–2183. doi: 10.1007/s11423-020-09758-5
Peruma, A., Simmons, S., AlOmar, E. A., Newman, C. D., Mkaouer, M. W., and Ouni, A. (2022). How do I refactor this? An empirical study on refactoring trends and topics in stack overflow. Empir. Softw. Eng. 27:11. doi: 10.1007/s10664-021-10045-x
Rashkovits, R., and Lavy, I. (2020). Students' difficulties in identifying the use of ternary relationships in data modeling. Int. J. Inf. Commun. Technol. Educ. 16, 47–58. doi: 10.4018/IJICTE.2020040104
Rashkovits, R., and Lavy, I. (2021). Mapping common errors in entity relationship diagram design of novice designers. Int. J. Database Manag. Syst. 13, 1–19. doi: 10.5121/ijdms.2021.13101
Saeed, S., Aamir, R., and Mahmood, Z. (2011). Reflections on teaching database management systems to undergraduate students. Int. J. Educ. Econ. Dev. 2, 398–411. doi: 10.1504/IJEED.2011.043834
Shebaro, B. (2018). Using active learning strategies in teaching introductory database courses. J. Comput. Sci. Coll. 33, 28–36.
Suraweera, P., and Mitrovic, A. (2002). “Kermit: a constraint-based tutor for database modeling,” in Intelligent Tutoring Systems: 6th International Conference, ITS 2002 Biarritz, France and San Sebastian, Spain, June 2-7, 2002 Proceedings 6 (Berlin: Springer), 377–387. doi: 10.1007/3-540-47987-2_41
Taipalus, T. (2020). “Explaining causes behind SQL query formulation errors,” in 2020 IEEE Frontiers in Education Conference (FIE) (Uppsala: IEEE), 1–9. doi: 10.1109/FIE44824.2020.9274114
Keywords: database education, database design concepts, misconceptions, visualizations, entity relationship diagram, relational model, JSAV
Citation: Abdelaziz N, Farghally M, Mohammed M and Soliman T (2025) Identifying and addressing common undergraduate database design misconceptions. Front. Educ. 10:1554089. doi: 10.3389/feduc.2025.1554089
Received: 31 December 2024; Accepted: 15 May 2025;
Published: 24 June 2025.
Edited by:
Octavian Dospinescu, Alexandru Ioan Cuza University, RomaniaReviewed by:
Sohaib Ahmed, Bahria University, Karachi, PakistanPeter Wolcott, University of Nebraska Omaha, United States
Copyright © 2025 Abdelaziz, Farghally, Mohammed and Soliman. This is an open-access article distributed under the terms of the Creative Commons Attribution License (CC BY). The use, distribution or reproduction in other forums is permitted, provided the original author(s) and the copyright owner(s) are credited and that the original publication in this journal is cited, in accordance with accepted academic practice. No use, distribution or reproduction is permitted which does not comply with these terms.
*Correspondence: Noha Abdelaziz, Tm9oYS5hYmRlbGF6aXpAYXVuLmVkdS5lZw==