 Tara Kuhn
 Jennifer J. Heisz
 Laura E. Middleton
- 1Department of Kinesiology and Health Sciences, University of Waterloo, Waterloo, ON, Canada
- 2Department of Kinesiology, McMaster University, Hamilton, ON, Canada
- 3Schlegel-UW Research Institute for Aging, Waterloo, ON, Canada
Purpose: To understand the independent and combined effects of sleep and mental health on academic performance, while also exploring gender differences.
Methods: A cross-sectional survey was distributed to undergraduate students at two Canadian universities in March 2022. Sleep quality and quantity was assessed using the Pittsburgh Sleep Quality Index. Mental health variables included stress, depression, and anxiety. Academic performance was self-reported as students’ cumulative percent average. Multiple linear regressions were used to investigate how (1) sleep, (2) mental health, (3) sleep and mental health together related to academic performance. These analyses were then repeated, stratified by gender.
Results: A total of 1,258 undergraduate students participated. While mental health and sleep duration predicted academic performance among the whole sample, there were important gender differences. In gender-stratified data, sleep quality and quantity predicted academic performance in men but not mental health in the combined model. For women, stress, depression, and anxiety predicted academic performance but not sleep quality. Sleep duration squared, but not sleep duration simply, was associated with academic performance in women.
Conclusion: Sleep and mental health are essential for academic performance in undergraduate students. Further, gender may play a critical role. Universities should consider gender-specific supports to improve the wellbeing of their students.
Introduction
Academic performance is a significant source of stress for many university students (Hurst et al., 2012; Logan and Burns, 2021). The pressure to excel can stem from internal factors, such as the desire for academic success, self-comparison, perfectionism, or external factors like expectations from family and friends (Hurst et al., 2012; Logan and Burns, 2021). For some students, high grades are essential for entry into graduate programs, while for others, academic performance is closely tied to their self-worth (Crocker, 2002). Notably, higher stress levels are associated with poorer academic outcomes (Frazier et al., 2019; Richardson et al., 2012). Understanding the intricate relationship between stress and academic performance is crucial given its critical importance to students.
The World Health Organization defines mental health as “a state of mental wellbeing that enables people to cope with the stresses of life, realize their abilities, learn well and work well, and contribute to their community” (World Mental Health Report, 2022). Mental health, particularly anxiety, plays a pivotal role in academic performance. While stress is often a reaction to external pressures (such as taking a test), anxiety is an internal response that can persist even without immediate threats (National Institute of Mental Health, 2020). High anxiety correlates with lower academic performance (Jamil et al., 2022), though moderate anxiety levels may be optimal (Waqas et al., 2015). This aligns with the Yerkes–Dodson Law, which posits that moderate arousal can enhance performance, while too little or too much can be detrimental (Teigen, 1994). Depression is another common mental health condition associated with worse academic performance and characterized by persistent feelings of sadness and loss of interest (Hysenbegasi et al., 2005).
Sleep also significantly impacts academic performance. Students who experience poor, insufficient, or inconsistent sleep often perform worse academically (Baert et al., 2015; Gomes et al., 2011; Maheshwari and Shaukat, 2019; Okano et al., 2019; Phillips et al., 2017; Raley et al., 2016; Turner et al., 2021). Additionally those with sleep disorders, such as insomnia or sleep apnea, show similar trends (Gaultney, 2010, 2016; Turner et al., 2021). Despite recommendations for seven to nine hours of sleep (Hirshkowitz et al., 2015), nearly one-third of students do not meet this guideline (Humphries et al., 2021; Norbury and Evans, 2019). Sacrificing sleep for extra study time may impair cognitive functions and memory consolidation (Alhola and Polo-Kantola, 2007; Rasch and Born, 2013), leading to poorer academic results (Raley et al., 2016; Zeek et al., 2015).
While the individual effects of sleep and mental health on academic performance are well-documented, their combined impact is less well understood. One study found that poor sleep quality negatively affected academic performance, while mental distress had a positive association when considered independently (El Hangouche et al., 2018). However, only sleep remained a significant factor when controlling for other variables (El Hangouche et al., 2018). Gender differences also exist in sleep and mental health, with men typically getting less sleep and women experiencing difficulties falling asleep (Chaput et al., 2017) and higher rates of depression and anxiety (McLean et al., 2011; Salk et al., 2017). Interestingly, women with higher test anxiety may perform better academically (Colbert-Getz et al., 2013).
Therefore, this study aims to examine the independent and combined effects of sleep and mental health on academic performance among university undergraduate students. Additionally, it explores the gender difference in these relationships to provide a comprehensive understanding of these factors. We hypothesized that better sleep would be associated with better academic performance, and that worse mental health would negatively impact academic performance.
Materials and methods
Study design
This secondary analysis uses data from a cross-sectional study which investigated variations in sleep attitudes across university disciplines (Kuhn et al., 2024). The survey was conducted in March 2022 among students at the University of Waterloo and McMaster University in Ontario, Canada. The study received approval from the ethics committees from both institutions (University of Waterloo ORE #43903, McMaster University MREB #5834). All participants provided electronic informed consent.
Participants
Participants were recruited through a combination of social media, posters, email advertisements, and use of the McMaster Sona System, a platform commonly used for recruiting participants in psychological research. To ensure representation from the broader student population, emails were sent to representatives from all departments or faculties requesting they forward the study information to their student mailing lists. To be eligible, participants had to be currently enrolled as a student at the University of Waterloo or McMaster University. While the survey was open to graduate and undergraduate students, only undergraduate students were included in the present analyses, as the factors affecting academic performance likely differ between these groups.
Measures
Sleep quality and quantity
Sleep quality and quantity were assessed using the Pittsburgh Sleep Quality Index (PSQI; Buysse et al., 1989). The PSQI evaluates sleep over the past month across seven components, with participants reporting the frequency of sleep disturbances from 0 (least frequent) to 3 (most frequent). The maximum score is 21, with higher scores indicating greater sleep disturbance and poorer sleep quality. A global score greater than five signifies significant sleep disturbance. One question asks participants to report the number of hours of sleep they get each night, which was used to determine sleep duration.
Participants were also asked “Have you ever pulled an ‘all-nighter’ (voluntarily skipping sleep and staying up for nearly 24 h or greater) during your academic career?” The response options were “yes”, “no”, or “prefer not to say.” If participants responded “yes,” they were prompted with open text boxes to indicate how many all-nighters they had completed and the timing of their most recent all-nighter.
Mental health
Stress was assessed using the Perceived Stress Scale (PSS; Cohen et al., 1983), a 10-item questionnaire that asked participants to indicate how often they experienced specific feelings or thoughts during the last month. Responses are rated on a scale from 0 (never) to 4 (very often). The total score ranges from 0 to 40, with higher scores indicating greater perceived stress. The scores can be categorized into low, moderate, or high perceived stress.
Anxiety was assessed using the General Anxiety Disorder scale (GAD-7; Spitzer et al., 2006). This seven-item questionnaire asks participants how often they had been bothered by various problems over the past two weeks, with response ranging from 0 (not at all) to 3 (nearly every day). The total score ranges from 0 to 21. A higher score indicates greater anxiety level, and scores can be categorized into minimal, mild, moderate, and severe anxiety.
Depression was assessed using the Patient Health Questionnaire (PHQ-9; Kroenke et al., 2001). This nine-item questionnaire asks participants to select the statement that best describes how they have been feeling over the past two weeks, with responses ranging in intensity from 0 to 3. The total score ranges from 0 to 27, with higher scores indicating greater levels of depression. These scores can be categorized into none-minimal, mild, moderate, moderately severe, or severe levels of depression.
Academic performance
All students, regardless of their university, were shown a grading chart based on the University of Waterloo’s grading scheme. The University of Waterloo uses a 10-point grading system, where the highest grade is A+ or 90–100%, and the lowest grade is a F or 0–59%. Using this chart, students were asked to report their average as both a percentage and a letter grade. If a participant only provided a letter grade, a numeric grade was estimated using the median value for that letter grade. For example, an “A+” was considered 95%, an “A” was considered 87%. The academic performance in percentage was treated as a continuous variable and was the primary outcome of the analyses.
Demographic characteristics
Participants provided demographic information, including age (in years), sex at birth (male, female, prefer not to say), household income (< $20,000; $20,000–$49,999; $50,000–$99,999; > $100,000), and study discipline (Health, Arts [Social Sciences, Fine Arts, Humanities], Science & Math, and Engineering & Computer Science). Regarding gender, participants were asked “how do you describe yourself,” selecting from the following gender categories: man, woman, non-binary, two-spirit, other, or prefer not to say.
Statistical analyses
Statistical analyses were completed using R computing software (R Core Team, 2023). Data were screened for missing and extreme values. For participants with two or fewer missing values in the mental health measures (n = 4), mean imputation was used to resolve missing data (Kroenke et al., 2010). All incomplete PSQI sleep durations (n = 2) and global scores (n = 19) were removed, as these scores could not be estimated or imputed. Additionally, data were screened for extreme values, and participants suspected of providing random responses (e.g., a value outside of the accepted scores for multiple measures) were removed (n = 2).
Participant characteristics were described using mean (standard deviation) for continuous variables and n (percentage) for categorical variables. Differences in participant characteristics by gender (men, women) were analyzed using t-tests for continuous variables and chi-squared tests for categorical variables.
To investigate the relationship between sleep and academic performance, stepwise multiple linear regressions were conducted, with self-reported grade point average (percentage) as the outcome measure. Given that sleep duration, stress, and anxiety are thought to have non-linear relationships with cognition or academic performance (Teigen, 1994; Wild et al., 2018), non-linear terms (squared variables) were added for these measures.
The unadjusted sleep model included the sleep duration, sleep duration squared, and the PSQI global score, all as continuous variables, with no additional covariates. The adjusted sleep model included these sleep variables along with demographic covariates (age, sex, income, university location, study discipline).
A similar approach was used to examine the relationship between mental health and academic performance. The unadjusted mental health models included perceived stress, perceived stress squared, depression, anxiety, and anxiety squared. The adjusted models included these mental health variables along with demographic covariables.
When analyzing the combined effects of sleep and mental health on academic performance, the unadjusted models included all sleep and mental health measures (including squared terms). The fully adjusted models added demographic characteristics to these variables.
The analyses described above were also stratified by gender, comparing participants who identified as “men” or “women.” These models were theoretically driven, based on prior evidence that men and women have differing relationships with sleep and mental health on academic performance. Participants who did not indicate their gender or had a gender identity outside of the “man/woman” binary were excluded from the analysis due to small sample size (n = 41).
Results
Participant characteristics
A total of 1,258 undergraduate students participated in this study. 881 (70.0%) of the total sample identified as women and 336 (26.7%) identified as men. The majority of the sample was under 25 years of age, in their first or second year of study, and with a high average household income. Most students were poor sleepers and had completed at least one all-nighter, although the majority of students were getting the recommended seven to nine hours of sleep. On average, students were going to bed at 12:32 AM (± 102 min) and getting out of bed at 8:34 AM (± 110 min). About half the students had minimal to mild depression and anxiety, while most reported moderate to high levels of stress. Detailed demographic characteristics of the total sample and stratified by gender are provided in Table 1.
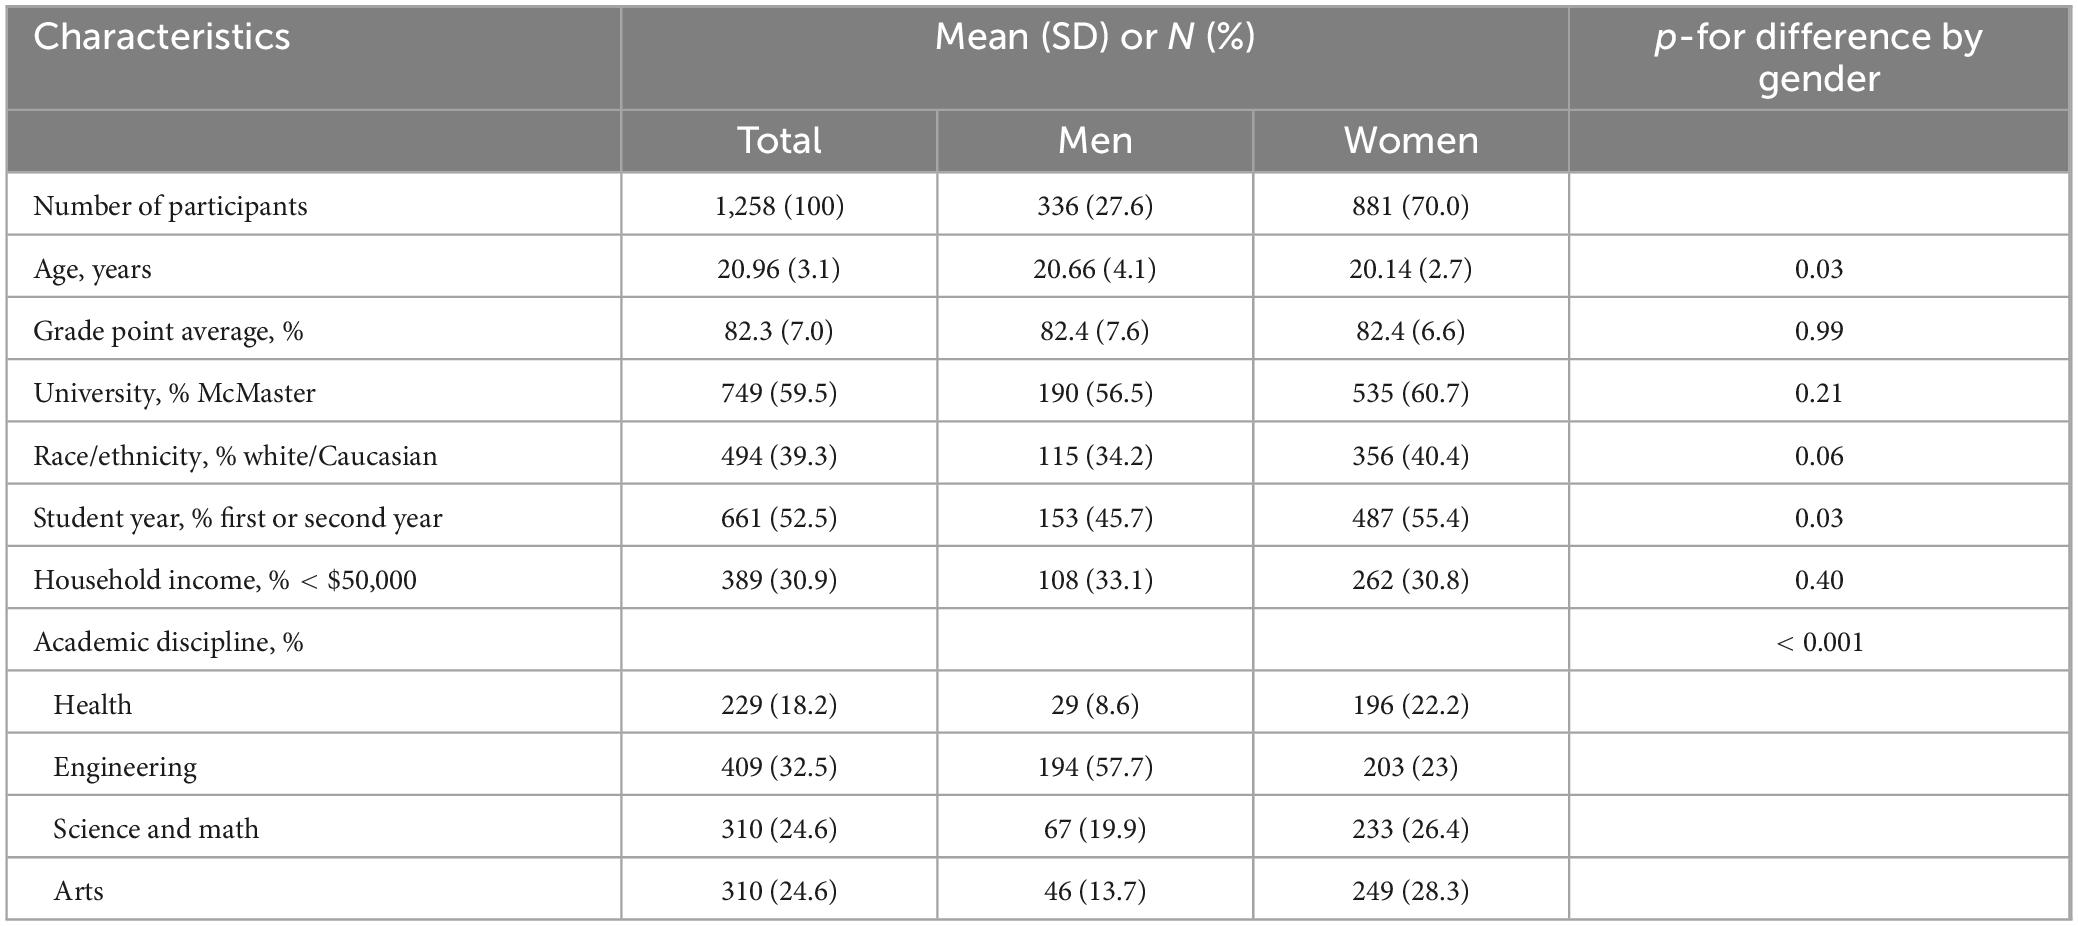
Table 1. Participant characteristics (n = 1,258).
There were few demographic differences by gender. However, the distribution of students by gender varied across faculties, and there was a greater representation of women among first and second-year students. While no significant gender differences were observed in sleep quality and quantity, men were more likely to have completed an all-nighter. Additionally, women were more likely to report more severe mental health symptoms. Finally, men had later in-bed (t = −2.99, p ≤ 0.001) and wake-times (t = −1.87, p = 0.04) than women, where men on average reported going to bed around 12:46 AM (± 97 min) and getting up at 8:44 AM (± 109 min), whereas women reported going to bed at 12:26 AM (± 112 min) and waking up at 8:29 AM (± 109 min) (not shown in table). Detailed sleep and mental health characteristics for the overall sample and by gender are provided in Table 2.
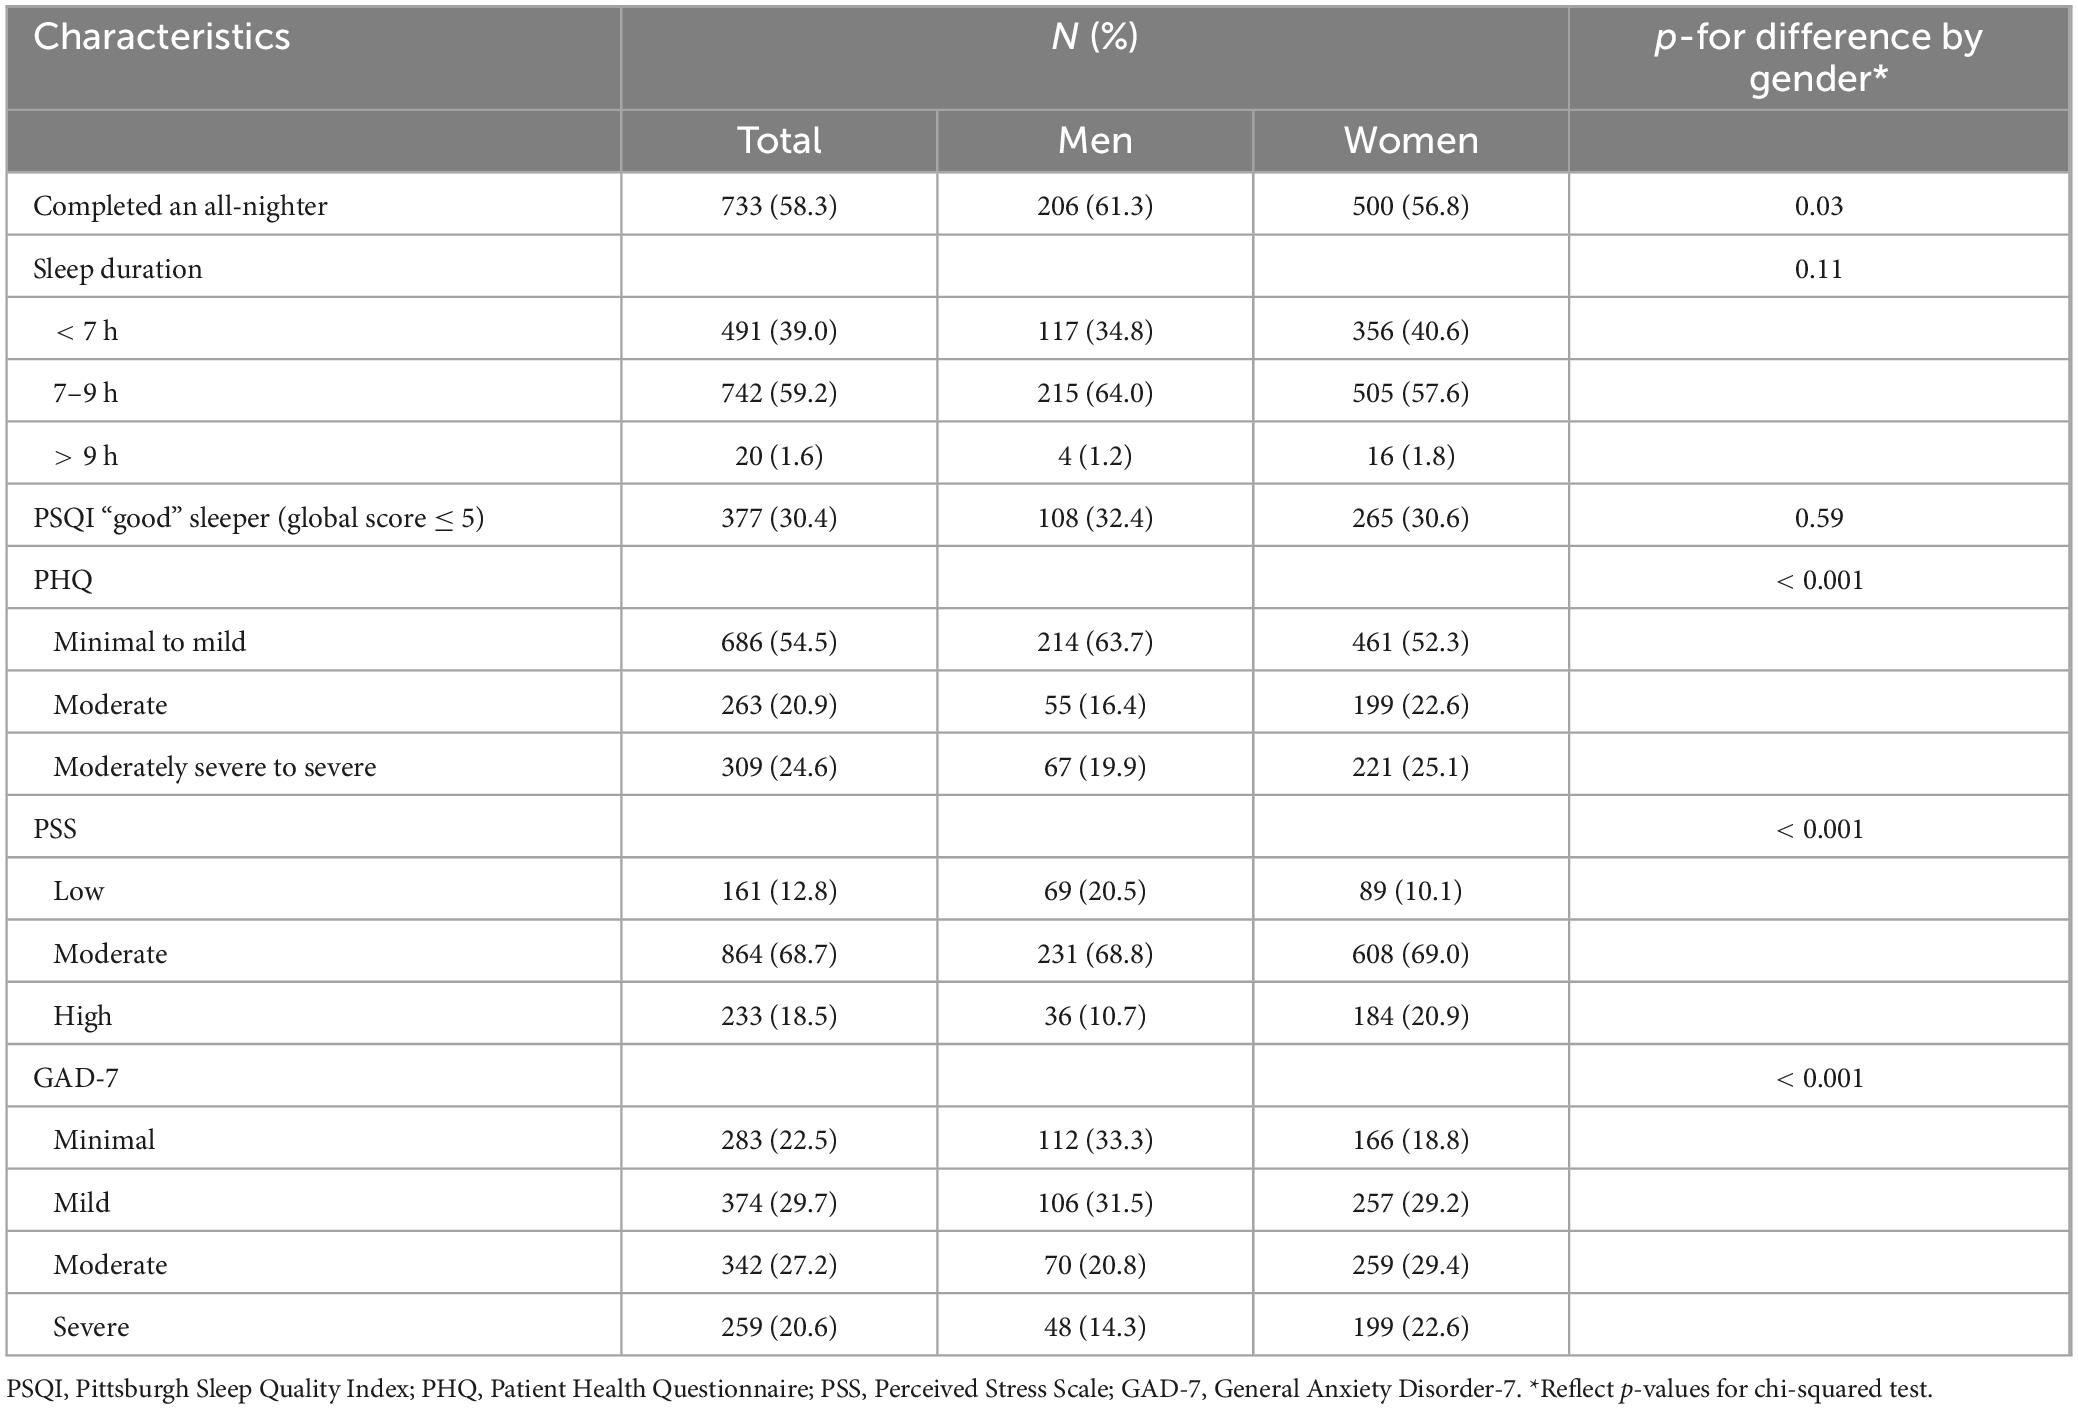
Table 2. Sleep and mental health characteristics.
Sleep on academic performance
Measures of sleep quantity and quality were associated with academic performance in both unadjusted and adjusted models (Table 3, Section A). Better sleep quality, as indicated by a lower PSQI score, was associated with better academic performance. There were significant linear and non-linear relationships for sleep duration, in that those who were on the extreme ends of short or long sleep durations had worse academic performance.
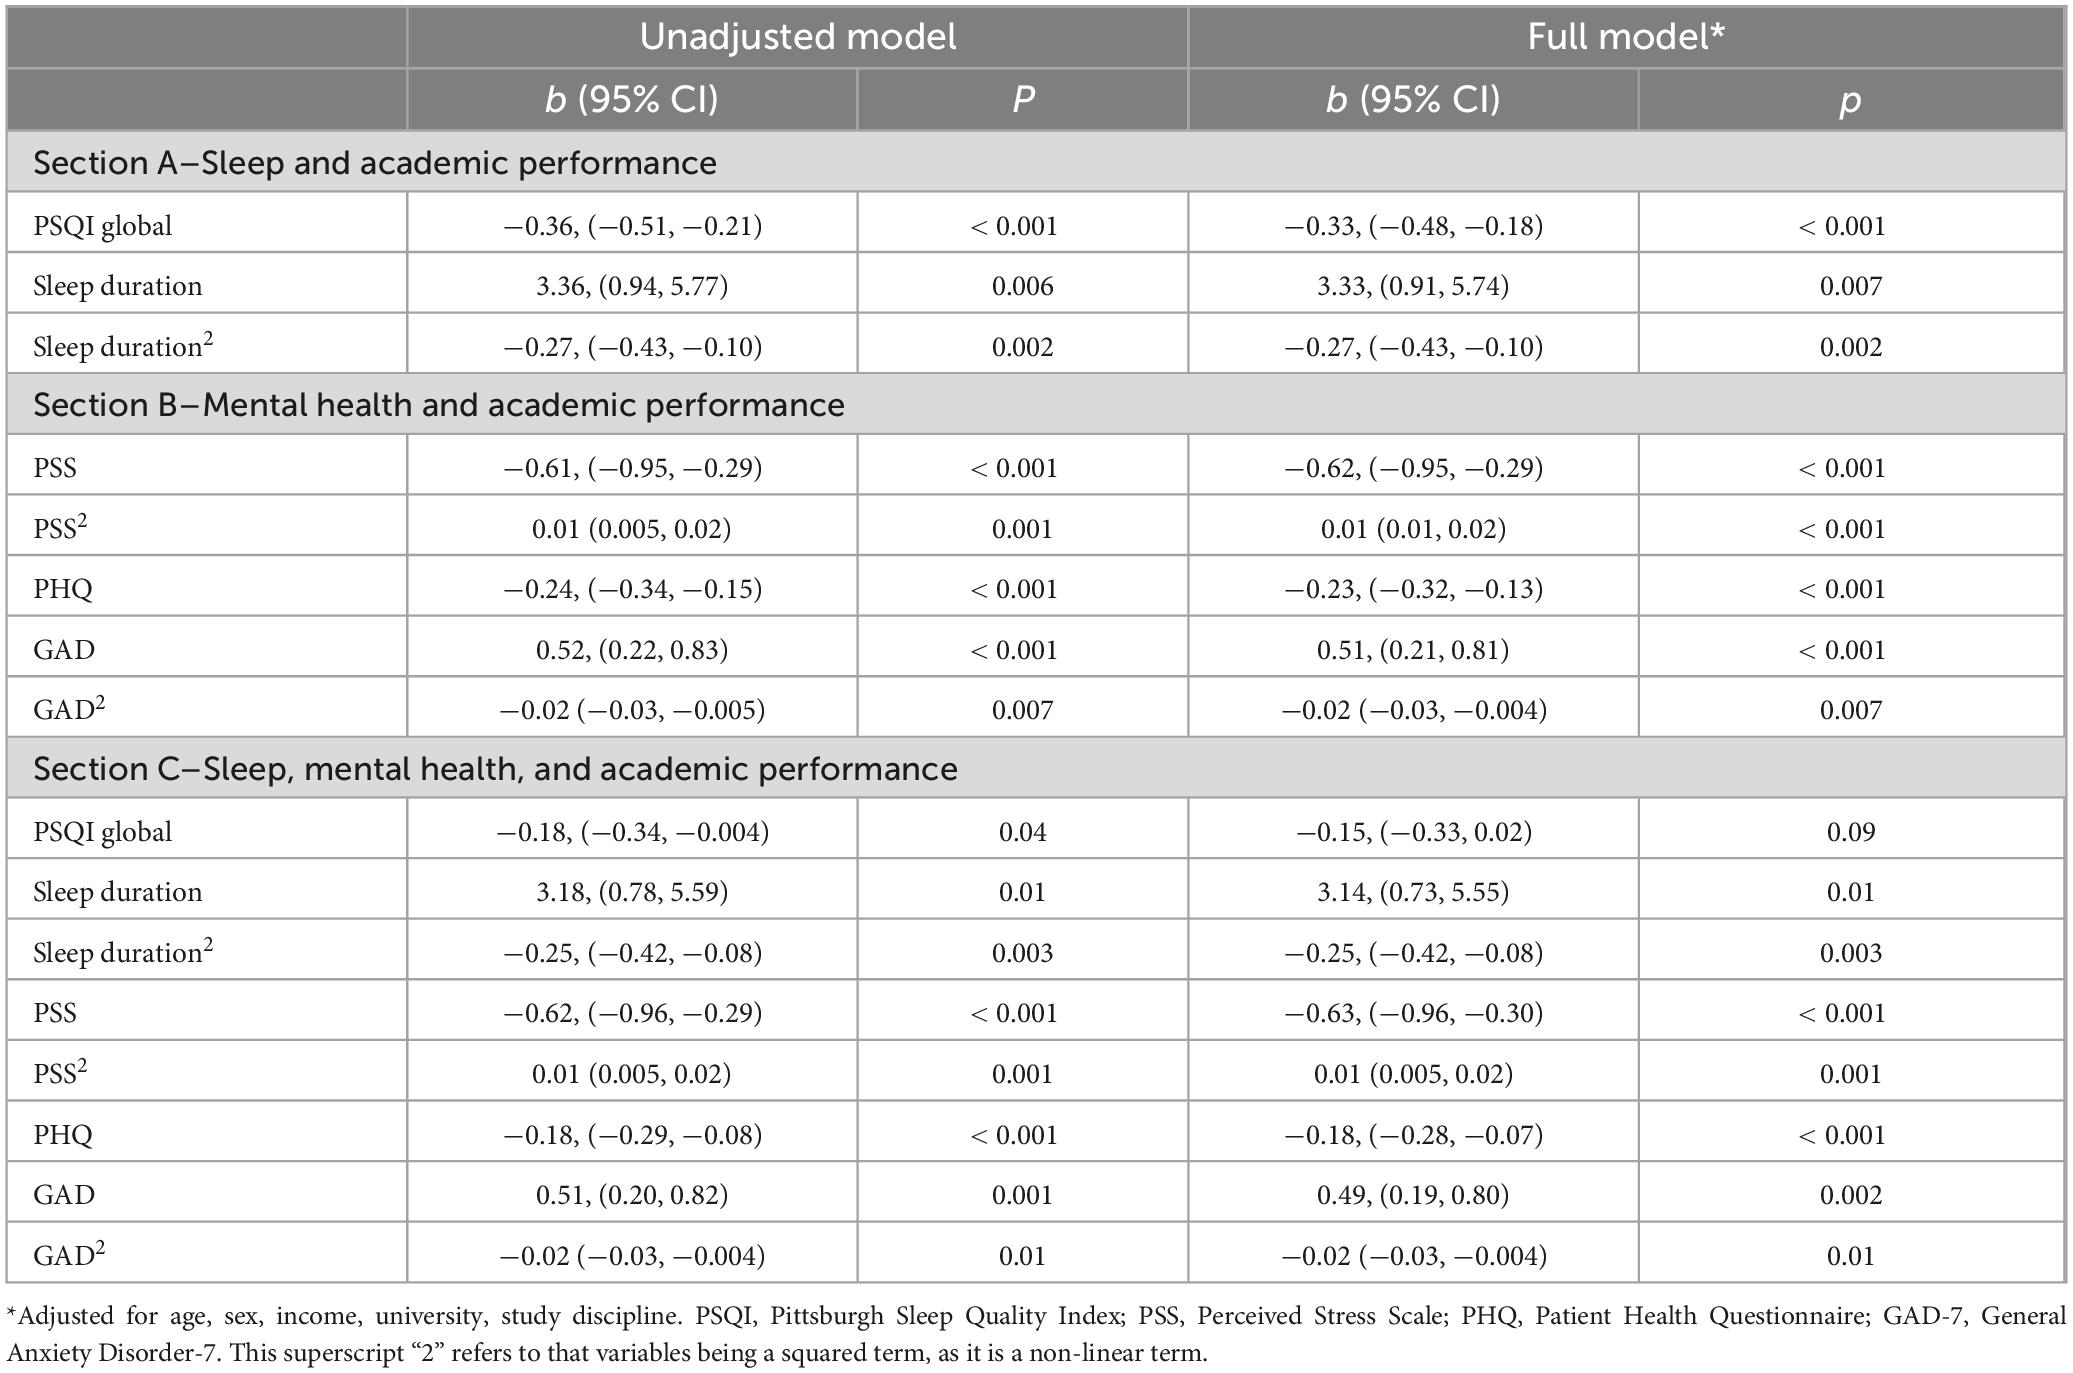
Table 3. Regression coefficients for the association between sleep, mental health, and their combined effect on academic performance.
Mental health on academic performance
All mental health measures were associated with academic performance in both unadjusted and adjusted models (Table 3, Section B). Perceived stress exhibited significant linear and non-linear effect, with higher stress levels associated with worse academic performance. However, this effect plateaued at moderate to very high levels of stress, where GPA remains similar despite increasing stress. More depressive symptoms were associated with worse academic performance. Additionally, anxiety showed significant linear effect and non-linear effects; increasing anxiety levels were associated with better academic performance up to a point, after which extremely high anxiety levels led to a decline in academic performance.
Sleep and mental health on academic performance
In the combined models of sleep and mental health, all measures of sleep quality, sleep quantity, and mental health were associated with academic performance in the unadjusted models. However, in the adjusted models, sleep quality was no longer associated with academic performance (Figure 1A). In contrast, sleep duration, depressive symptoms, stress levels, and anxiety remained significant predictors of academic performance (Figures 1B–E).
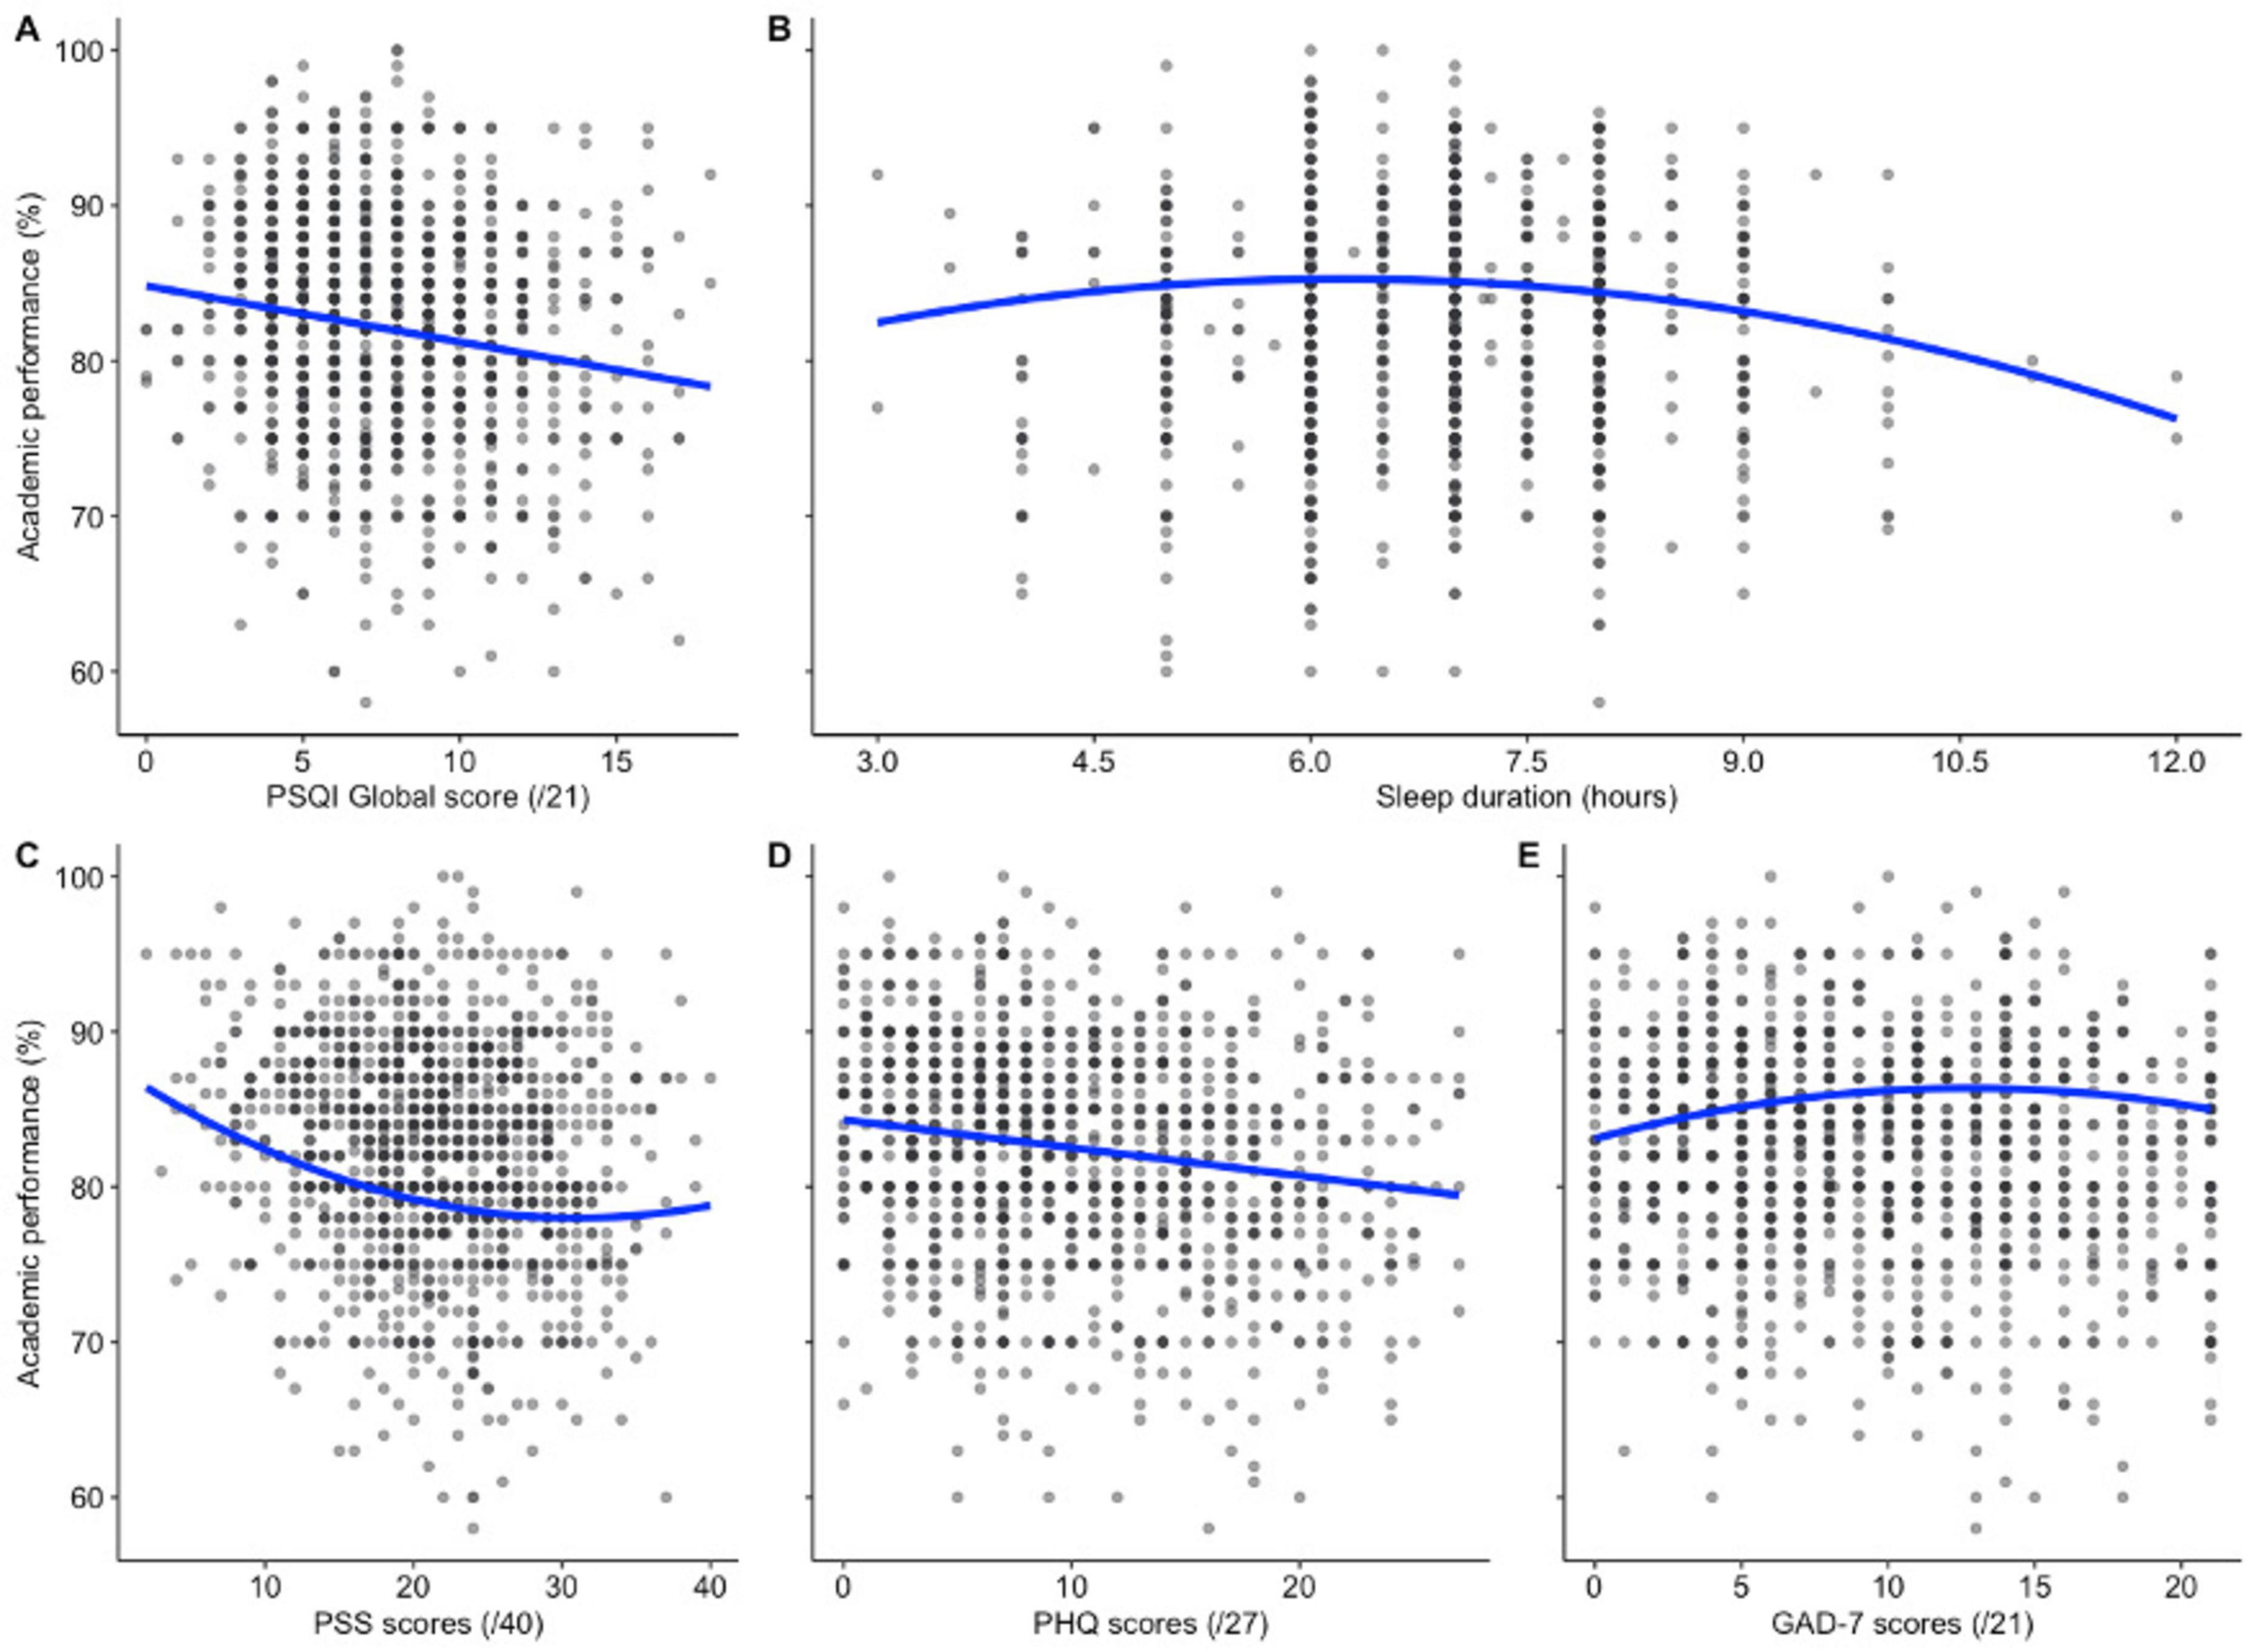
Figure 1. Scatterplots of the unadjusted relationship between sleep, mental health and academic performance. Sleep quality was associated with worse academic performance (A), while sleep duration showed a non-linear relationship with academic performance (B). Higher levels of stress (C) and depression (D) were associated with worse academic performance. Anxiety (E) had a positive, non-linear association with academic performance.
There were significant linear and non-linear effects for sleep duration, indicating that both insufficient and excessive sleep were associated with poorer academic performance (Figure 1B). High levels of stress (Figure 1C) and depression (Figure 1D) were negatively associated with academic performance, whereas higher anxiety levels were positively associated with academic performance (Figure 1E). Notably, there were significant non-linear effects for perceived stress and anxiety: increasing stress levels were associated with worse academic performance until a plateau was reached at moderate to severe stress levels. Similarly, anxiety was positively associated with academic performance up to a point, after which severe anxiety levels was detrimental. See Table 3, Section C for summary of the results.
Sleep and academic performance by gender
Gender-stratified data are presented in Table 4. In both men and women, poor sleep quality was negatively associated with academic performance. Among men, there was significant linear and non-linear relationships between sleep duration in academic performance in the adjusted and unadjusted models, indicating that both insufficient sleep and excessive sleep were associated with worse academic performance than moderate levels of sleep. For women, while the linear term did not reach significance (p = 0.07), the non-linear term was significant, suggesting a similar pattern where extreme sleep durations were associated with worse academic performance. See Table 4, Section A for the gender-stratified data for sleep and academic performance.
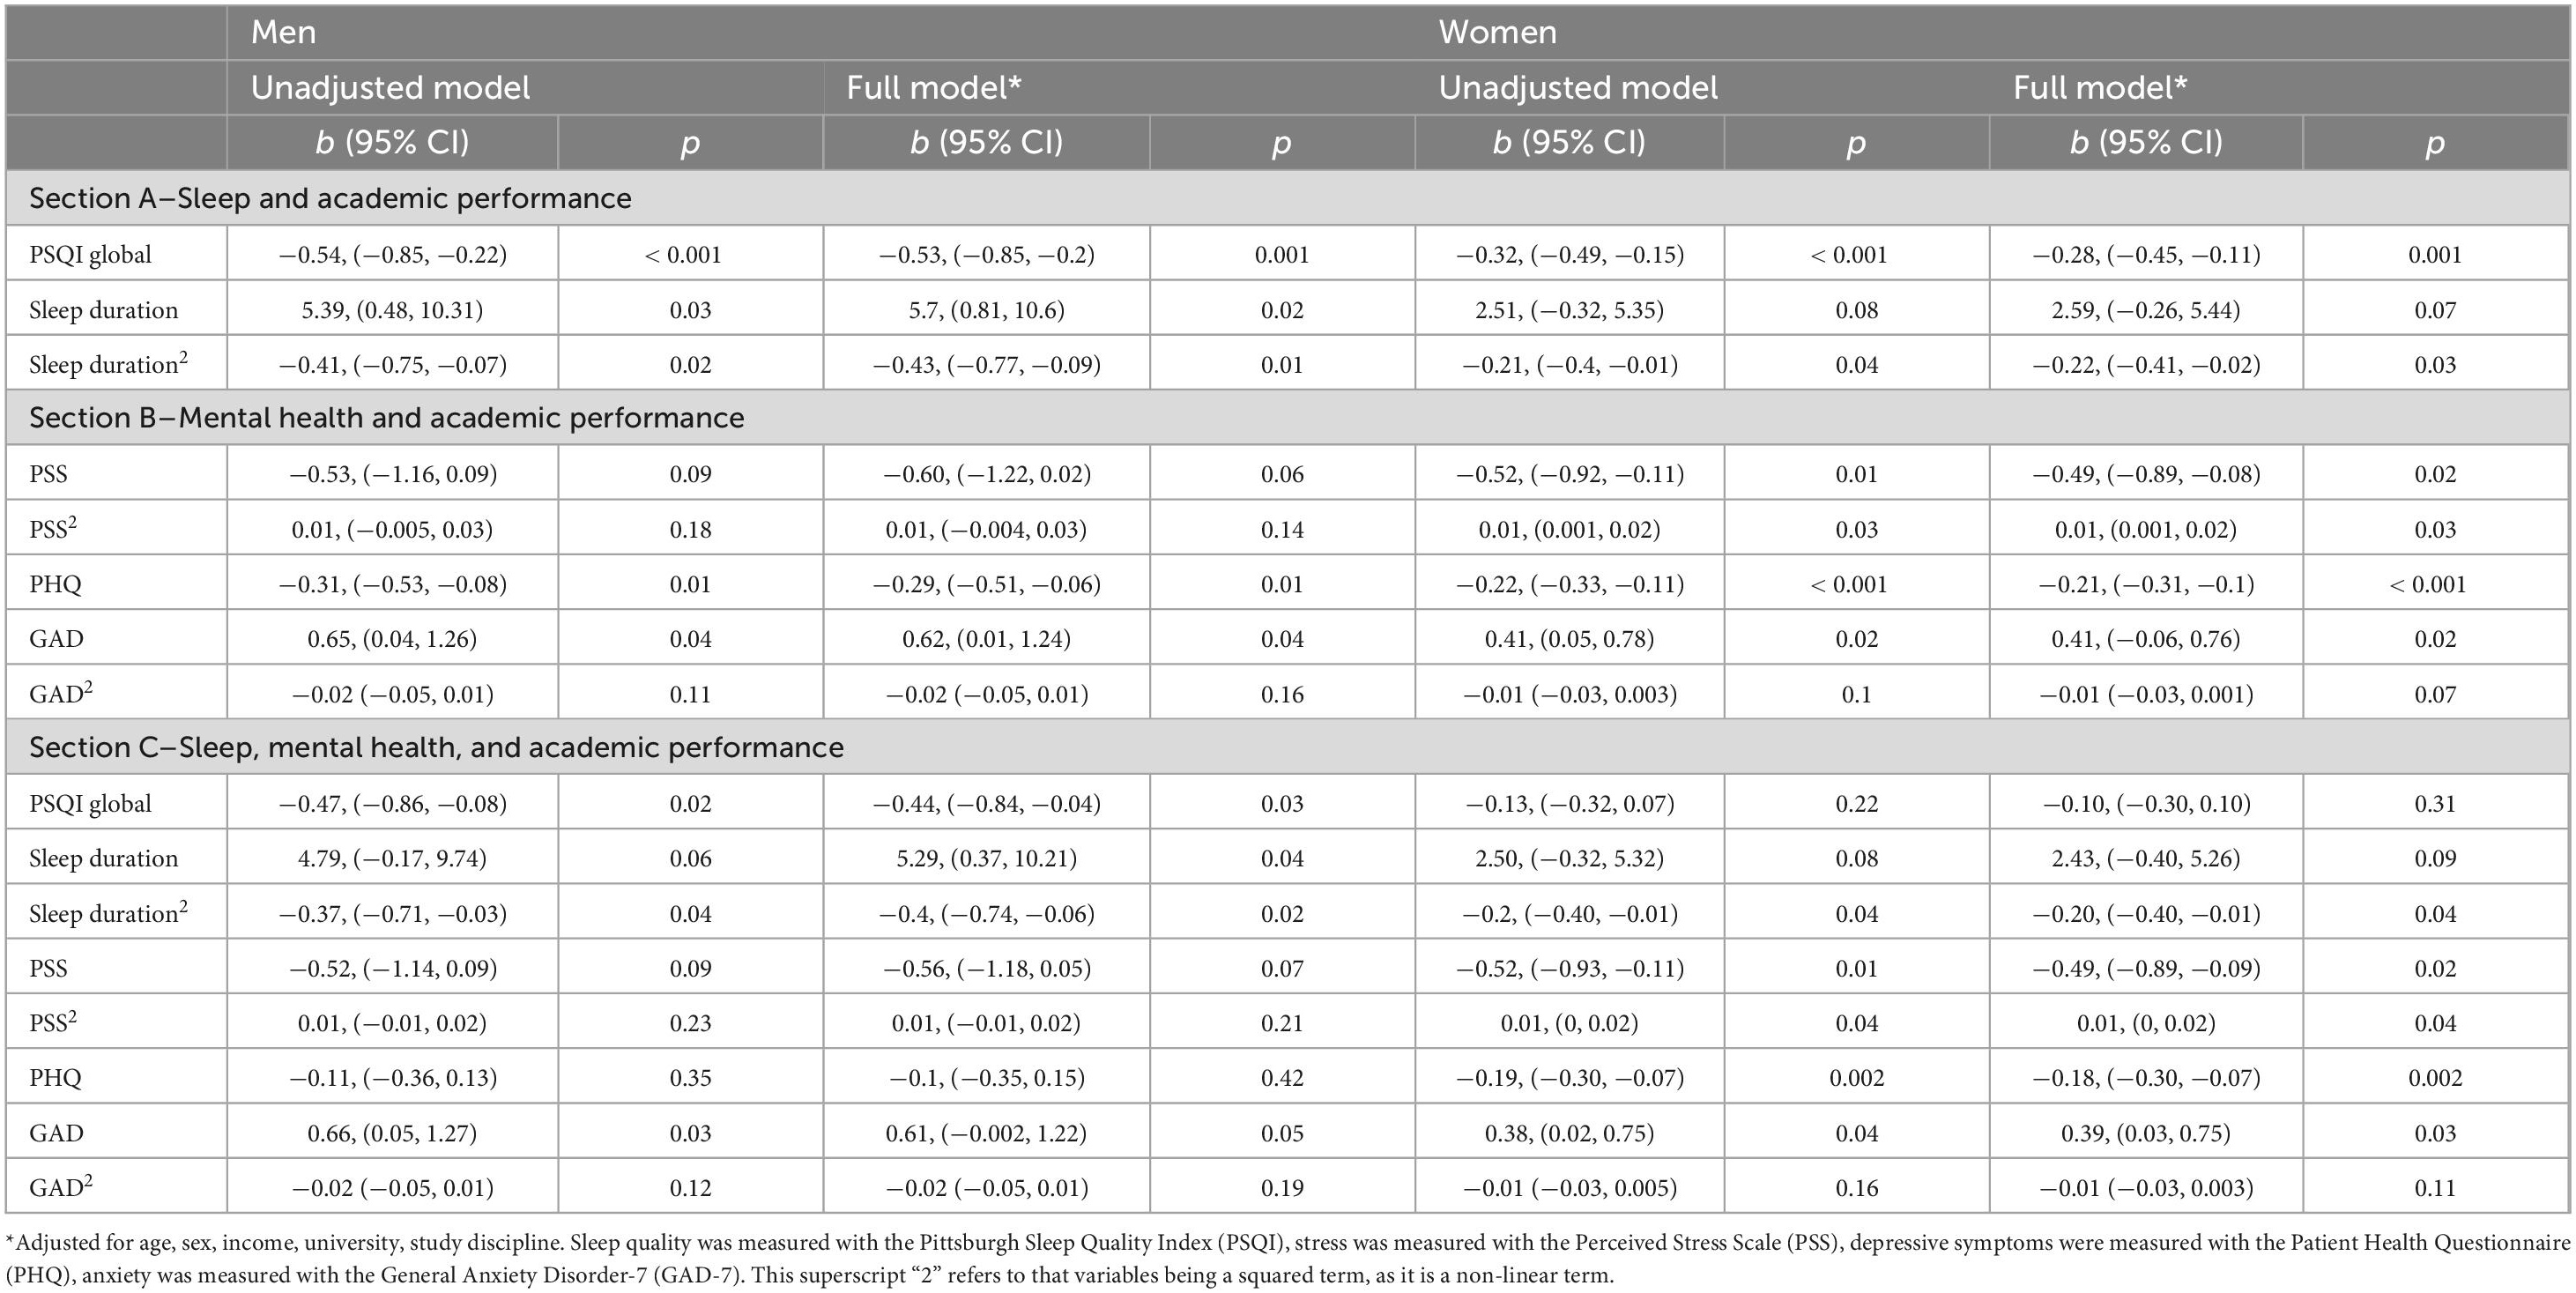
Table 4. Regression coefficients for the association between sleep, mental health, and their combined effect on academic performance in undergraduate men (n = 336) and women (n = 881).
Mental health and academic performance by gender
In both men and women (Table 4, Section B), higher depressive scores were associated with worse academic performance in both the unadjusted and adjusted models. Additionally, anxiety showed a positive linear association with academic performance in both genders in both models.
For women only, stress exhibited significant linear and non-linear relationship with academic performance in the unadjusted and adjusted model, indicating their stress levels influence their academic outcomes in a complex manner. In contrast, stress did not significantly predict academic performance in men.
Sleep, mental health, and academic performance by gender
While examining the combined effects of sleep and mental health, several gender differences emerged (Table 4, Section C). In men, sleep quality significantly predicted academic performance, whereas this relationship was not significant in women. In the adjusted models, men exhibited significant linear and non-linear effects for sleep duration, demonstrating an inverted U-shaped relationship where both insufficient and excessive sleep were associated with worse academic performance compared to moderate sleep levels. Women showed a similar inverted U-shaped relationship; however, the linear term did not reach significance (p = 0.09), while the non-linear term was significant.
Regarding women’s mental health, stress showed a significant linear and non-linear relationship with academic performance in both adjusted and unadjusted models. Higher stress levels were associated with worse academic performance, although this relationship plateaued at moderate-high levels of stress. Men exhibited a similar trend, but stress was not a significant predictor of academic performance in either model.
Depression severity negatively impacted academic performance in women but not in men. Anxiety had a positive linear association with academic performance in women in both models. Men displayed a similar positive linear relationship between anxiety and academic performance, though this effect approached but did not reach significance in the adjusted model (p = 0.051).
Discussion
This study aimed to understand the relationship between sleep, mental health and academic performance in university undergraduate students, while also exploring gender differences. Although most sleep and mental health measures were associated with academic performance in the overall sample, important gender differences emerged. For men, academic performance was associated with sleep quality and quantity, but not mental health. In contrast, for women, academic performance was associated with mental health but not sleep quality or quantity. Interestingly, stress and anxiety influenced academic performance in opposite ways for the entire group and specifically among women. Stress was associated with worse academic performance, whereas anxiety was associated with better academic performance.
This study found several gender differences in the relationship between sleep and mental health and their impact on academic performance. For women, all mental health measures influenced academic performance, while for men these measures did not. There has been little research into how gender impacts sleep, mental health and academic performance. Of the limited literature, some studies suggest that test-anxiety may benefit academic performance for women but not men (Chapell et al., 2005; Colbert-Getz et al., 2013). In contrast, others studies indicate that depression has a stronger impact on women and general anxiety has a stronger impact on men regarding academic performance (Eisenberg et al., 2009). Conflicting results have also been observed regarding mental health and education attainment in teenagers (Burger and Strassmann Rocha, 2023; Cornaglia et al., 2015; Hjorth et al., 2016; Needham, 2009). These discrepancies may be related to gender differences in mental health reporting. Men tend to report lower mental distress (McLean et al., 2011; Salk et al., 2017), but may underreport it due to social desirability or express it in ways not captured by questionnaires (Whitley, 2021, Chapter 5). Social desirability may further contribute in part to why sleep, but not mental health, had a stronger association with academic performance. Having poor sleep might be more socially acceptable, and for some, even be intertwined with their sense of masculinity (Warren and Campbell, 2021). Thus, men might be more willing to disclose when they are experiencing poor sleep but not poor mental health. Alternatively, the smaller number of men in this study may have led to insufficient power to detect the effect of mental health. For example, anxiety was associated with academic performance among men in the unadjusted models but did not reach significance in the fully adjusted models (p = 0.051; see Table 4, Section C).
In women, stress had a significant non-linear relationship with academic performance, where academic performance decreased as stress increased until it plateaued. This suggests a saturation point where greater stress has similar impact on academic performance. Anxiety had a positive effect on academic performance, consistent with prior studies (Chapell et al., 2005; Colbert-Getz et al., 2013). Since anxiety is an internalized reaction to stress (National Institute of Mental Health, 2020), there may be an optimal level of anxiety that motivates students to perform well without overwhelming them, aligning with the Yerkes–Dodson Law model (Teigen, 1994). Anxiety may motivate women to work harder, enhancing performance (Stricker et al., 1993). However, in the present study the same was not true for men.
Regarding academic performance, sleep appeared to be more essential for men than women. Previous research found that the relationship between sleep duration and academic performance was stronger in men than in women (Okano et al., 2019). Sleep quality was significantly associated with academic performance only in men (Okano et al., 2019), aligning with our results. However, this finding is not consistent across all studies as one study found the opposite (Marta et al., 2020). Timing of sleep and circadian alignment may be one factor contributing to these differences. Although the Okano et al. (2019) study did not report gender differences in bedtimes, they found those who went to bed earlier had better academic performance. As found in the present study, young men tend to go to bed later than women (Becker et al., 2018; Kabrita and Hajjar-Muça, 2016; Tsai and Li, 2004) and are more likely to be evening chronotypes (Fischer et al., 2017; Randler and Engelke, 2019). Thus, their personal and circadian schedules may not be aligned with their academic schedules. Critically, circadian misalignment (Montaruli et al., 2019; Phillips et al., 2017) and later bedtimes (Eliasson et al., 2010) are associated with worse academic performance.
Given the gender differences in the relationships between sleep, mental health and academic performance, universities may need to implement gender-specific interventions. For men, interventions should focus on promoting sleep awareness, while for women, mental health awareness should be prioritized. Universities can offer programming or workshops on sleep hygiene, cognitive behavioral therapy, and relaxation/mindfulness, which have been shown to improve sleep and mental health in university students (Friedrich and Schlarb, 2018). Additionally, resources for scheduling, time-management, and organization may help students better adapt to the university environment, allowing them to allocate time for sleep and other wellness activities to promote mental wellbeing.
There are several limitations to this study. First, it is cross-sectional, so causality cannot be inferred between sleep, mental health, and academic performance. Second, the measures were self-reported, introducing potential error and bias. Students may have inflated their grades, as the global average of this sample was 82% (A−). Third, there is likely self-selection bias, where certain types of students (e.g., high achieving students or those concerned about their sleep) may have been more likely to participate. Fourth, these results may not apply to graduate students who may experience different stressors and challenges related to sleep and mental health than undergraduate students (Pfeiffer, 2001; Tan et al., 2023; Wyatt and Oswalt, 2013). Finally, there may be differences by other demographic characteristics not examined here, such as ethno-racial groups (Karsan et al., 2024).
Conclusion
The present study sought to understand how sleep and mental health impacts academic performance and the influence of gender on this relationship. Gender-stratified analyses revealed that sleep may be a more critical factor for academic performance in men, whereas mental health may impact women’s academic performance more. These findings suggest that the benefits of mental health and sleep interventions may vary by gender, highlighting the need for gender-specific support strategies in university.
Data availability statement
The raw data supporting the conclusions of this article will be made available by the authors, without undue reservation.
Ethics statement
The studies involving humans were approved by the University of Waterloo Office of Research Ethics. The studies were conducted in accordance with the local legislation and institutional requirements. The participants provided their written informed consent to participate in this study.
Author contributions
TK: Conceptualization, Data curation, Formal Analysis, Investigation, Methodology, Project administration, Writing – original draft. JH: Conceptualization, Resources, Supervision, Writing – review and editing. LM: Conceptualization, Resources, Supervision, Writing – review and editing.
Funding
The authors declare that no financial support was received for the research and/or publication of this article.
Acknowledgments
We’d like to thank Sameena Karsan for her help with data collection.
Conflict of interest
The authors declare that the research was conducted in the absence of any commercial or financial relationships that could be construed as a potential conflict of interest.
Generative AI statement
The authors declare that no Generative AI was used in the creation of this manuscript.
Publisher’s note
All claims expressed in this article are solely those of the authors and do not necessarily represent those of their affiliated organizations, or those of the publisher, the editors and the reviewers. Any product that may be evaluated in this article, or claim that may be made by its manufacturer, is not guaranteed or endorsed by the publisher.
References
Alhola, P., and Polo-Kantola, P. (2007). Sleep deprivation: Impact on cognitive performance. Neuropsychiatr. Dis. Treat. 3, 553–567.
Baert, S., Omey, E., Verhaest, D., and Vermeir, A. (2015). Mister Sandman, bring me good marks! On the relationship between sleep quality and academic achievement. Soc. Sci. Med. 130, 91–98. doi: 10.1016/j.socscimed.2015.02.011
Becker, S. P., Jarrett, M. A., Luebbe, A. M., Garner, A. A., Burns, G. L., and Kofler, M. J. (2018). Sleep in a large, multi-university sample of college students: Sleep problem prevalence, sex differences, and mental health correlates. Sleep Health 4, 174–181. doi: 10.1016/j.sleh.2018.01.001
Burger, K., and Strassmann Rocha, D. (2023). Mental health, gender, and higher education attainment. Z. Erziehungswissenschaft 27, 89–122. doi: 10.1007/s11618-023-01187-3
Buysse, D. J., Reynolds, C. F., Monk, T. H., Berman, S. R., and Kupfer, D. J. (1989). The Pittsburgh sleep quality index: A new instrument for psychiatric practice and research. Psychiatry Res. 28, 193–213. doi: 10.1016/0165-1781(89)90047-4
Chapell, M. S., Blanding, Z. B., Silverstein, M. E., Takahashi, M., Newman, B., Gubi, A., et al. (2005). Test anxiety and academic performance in undergraduate and graduate students. J. Educ. Psychol. 97, 268–274. doi: 10.1037/0022-0663.97.2.268
Chaput, J. P., Wong, S. L., and Michaud, I. (2017). Duration and quality of sleep among Canadians aged 18 to 79. Health Rep. 28, 28–33.
Cohen, S., Kamarck, T., and Mermelstein, R. (1983). A global measure of perceived stress. J. Health Soc. Behav. 24, 385–396. doi: 10.2307/2136404
Colbert-Getz, J. M., Fleishman, C., Jung, J., and Shilkofski, N. (2013). How do gender and anxiety affect students’ self-assessment and actual performance on a high-stakes clinical skills examination? Acad. Med. 88:44. doi: 10.1097/ACM.0b013e318276bcc4
Cornaglia, F., Crivellaro, E., and McNally, S. (2015). Mental health and education decisions. Labour Econ. 33, 1–12. doi: 10.1016/j.labeco.2015.01.005
Crocker, J. (2002). The costs of seeking self–esteem. J. Soc. Issues 58, 597–615. doi: 10.1111/1540-4560.00279
Eisenberg, D., Golberstein, E., and Hunt, J. B. (2009). Mental health and academic success in college. B.E. J. Econ. Anal. Policy 9:40. doi: 10.2202/1935-1682.2191
El Hangouche, A. J., Jniene, A., Aboudrar, S., Errguig, L., Rkain, H., Cherti, M., et al. (2018). Relationship between poor quality sleep, excessive daytime sleepiness and low academic performance in medical students. Adv. Med. Educ. Pract. 9, 631–638. doi: 10.2147/AMEP.S162350
Eliasson, A. H., Lettieri, C. J., and Eliasson, A. H. (2010). Early to bed, early to rise! Sleep habits and academic performance in college students. Sleep Breath. 14, 71–75. doi: 10.1007/s11325-009-0282-2
Fischer, D., Lombardi, D. A., Marucci-Wellman, H., and Roenneberg, T. (2017). Chronotypes in the US – Influence of age and sex. PLoS One 12:e0178782. doi: 10.1371/journal.pone.0178782
Frazier, P., Gabriel, A., Merians, A., and Lust, K. (2019). Understanding stress as an impediment to academic performance. J. Am. Coll. Health 67, 562–570. doi: 10.1080/07448481.2018.1499649
Friedrich, A., and Schlarb, A. A. (2018). Let’s talk about sleep: A systematic review of psychological interventions to improve sleep in college students. J. Sleep Res. 27, 4–22. doi: 10.1111/jsr.12568
Gaultney, J. F. (2010). The prevalence of sleep disorders in college students: Impact on academic performance. J. Am. Coll. Health 59, 91–97. doi: 10.1080/07448481.2010.483708
Gaultney, J. F. (2016). Risk for sleep disorder measured during students’ first college semester may predict institutional retention and grade point average over a 3-year period, with indirect effects through self-efficacy. J. Coll. Stud. Retent. 18, 333–359. doi: 10.1177/1521025115622784
Gomes, A. A., Tavares, J., and De Azevedo, M. H. P. (2011). Sleep and academic performance in undergraduates: A multi-measure, multi-predictor approach. Chronobiol. Int. 28, 786–801. doi: 10.3109/07420528.2011.606518
Hirshkowitz, M., Whiton, K., Albert, S. M., Alessi, C., Bruni, O., DonCarlos, L., et al. (2015). National Sleep Foundation’s updated sleep duration recommendations: Final report. Sleep Health 1, 233–243. doi: 10.1016/j.sleh.2015.10.004
Hjorth, C. F., Bilgrav, L., Frandsen, L. S., Overgaard, C., Torp-Pedersen, C., Nielsen, B., et al. (2016). Mental health and school dropout across educational levels and genders: A 4.8-year follow-up study. BMC Public Health 16:976. doi: 10.1186/s12889-016-3622-8
Humphries, R. K., Bath, D. M., and Burton, N. W. (2021). Dysfunctional beliefs, sleep hygiene and sleep quality in university students. Health Promot. J. Austr. 33, 162–169. doi: 10.1002/hpja.471
Hurst, C. S., Baranik, L. E., and Daniel, F. (2012). College student stressors: A review of the qualitative research: Qualitative stress review. Stress and Health 29, 275–285. doi: 10.1002/smi.2465
Hysenbegasi, A., Hass, S. L., and Rowland, C. R. (2005). The impact of depression on the academic productivity of university students. J. Ment. Health Policy Econ. 8, 145–151.
Jamil, H., Alakkari, M., Al-Mahini, M. S., Alsayid, M., and Al Jandali, O. (2022). The impact of anxiety and depression on academic performance: A cross-sectional study among medical students in Syria. Avicenna J. Med. 12, 111–119. doi: 10.1055/s-0042-1755181
Kabrita, C. S., and Hajjar-Muça, T. A. (2016). Sex-specific sleep patterns among university students in Lebanon: Impact on depression and academic performance. Nat. Sci. Sleep 8, 189–196. doi: 10.2147/NSS.S104383
Karsan, S., Kuhn, T., Ogrodnik, M., Middleton, L. E., and Heisz, J. J. (2024). Exploring the interactive effect of dysfunctional sleep beliefs and mental health on sleep in university students. Front. Sleep 3:1340729. doi: 10.3389/frsle.2024.1340729
Kroenke, K., Spitzer, R. L., and Williams, J. B. W. (2001). The PHQ-9. J. General Internal Med. 16, 606–613. doi: 10.1046/j.1525-1497.2001.016009606.x
Kroenke, K., Spitzer, R. L., Williams, J. B. W., and Löwe, B. (2010). The patient health questionnaire somatic, anxiety, and depressive symptom scales: A systematic review. General Hosp. Psychiatry 32, 345–359. doi: 10.1016/j.genhosppsych.2010.03.006
Kuhn, T., Karsan, S., Heisz, J. J., and Middleton, L. E. (2024). The differing relationships between academic discipline, sleep hygiene, and dysfunctional sleep attitudes on sleep quality and duration in Canadian University students. Front. Psychol. 15:1396579. doi: 10.3389/fpsyg.2024.1396579
Logan, B., and Burns, S. (2021). Stressors among young Australian university students: A qualitative study. J. Am. Coll. Health 71, 1753–1760. doi: 10.1080/07448481.2021.1947303
Maheshwari, G., and Shaukat, F. (2019). Impact of poor sleep quality on the academic performance of medical students. Cureus 11:e4357. doi: 10.7759/cureus.4357
Marta, O. F. D., Kuo, S.-Y., Bloomfield, J., Lee, H.-C., Ruhyanudin, F., Poynor, M. Y., et al. (2020). Gender differences in the relationships between sleep disturbances and academic performance among nursing students: A cross-sectional study. Nurse Educ. Today 85:104270. doi: 10.1016/j.nedt.2019.104270
McLean, C. P., Asnaani, A., Litz, B. T., and Hofmann, S. G. (2011). Gender differences in anxiety disorders: Prevalence, course of illness, comorbidity and burden of illness. J. Psychiatr. Res. 45, 1027–1035. doi: 10.1016/j.jpsychires.2011.03.006
Montaruli, A., Castelli, L., Galasso, L., Mulè, A., Bruno, E., Esposito, F., et al. (2019). Effect of chronotype on academic achievement in a sample of Italian University students. Chronobiol. Int. 36, 1482–1495. doi: 10.1080/07420528.2019.1652831
National Institute of Mental Health (2020). I’m So Stressed Out! Fact Sheet. Bengaluru: National Institute of Mental Health
Needham, B. L. (2009). Adolescent depressive symptomatology and young adult educational attainment: An examination of gender differences. J. Adolesc. Health 45, 179–186. doi: 10.1016/j.jadohealth.2008.12.015
Norbury, R., and Evans, S. (2019). Time to think: Subjective sleep quality, trait anxiety and university start time. Psychiatry Res. 271, 214–219. doi: 10.1016/j.psychres.2018.11.054
Okano, K., Kaczmarzyk, J. R., Dave, N., Gabrieli, J. D. E., and Grossman, J. C. (2019). Sleep quality, duration, and consistency are associated with better academic performance in college students. Npj Sci. Learn. 4:16. doi: 10.1038/s41539-019-0055-z
Pfeiffer, D. (2001). Academic and Environmental Stress among Undergraduate and Graduate College Students: A Literature Review. Menomonie, WI: University of Wisconsin–Stout.
Phillips, A. J. K., Clerx, W. M., O’Brien, C. S., Sano, A., Barger, L. K., Picard, R. W., et al. (2017). Irregular sleep/wake patterns are associated with poorer academic performance and delayed circadian and sleep/wake timing. Sci. Rep. 7:3216. doi: 10.1038/s41598-017-03171-4
R Core Team (2023). R: A Language and Environment for Statistical Computing [R]. Vienna: R Foundation for Statistical Computing.
Raley, H., Naber, J., Cross, S., and Perlow, M. (2016). The impact of duration of sleep on academic performance in University students. Madridge J. Nurs. 1, 11–18. doi: 10.18689/mjn-1000103
Randler, C., and Engelke, J. (2019). Gender differences in chronotype diminish with age: A meta-analysis based on morningness/chronotype questionnaires. Chronobiol. Int. 36, 888–905. doi: 10.1080/07420528.2019.1585867
Rasch, B., and Born, J. (2013). About sleep’s role in memory. Physiol. Rev. 93, 681–766. doi: 10.1152/physrev.00032.2012
Richardson, M., Abraham, C., and Bond, R. (2012). Psychological correlates of university students’ academic performance: A systematic review and meta-analysis. Psychol. Bull. 138, 353–387. doi: 10.1037/a0026838
Salk, R. H., Hyde, J. S., and Abramson, L. Y. (2017). Gender differences in depression in representative national samples: Meta-analyses of diagnoses and symptoms. Psychol. Bull. 143, 783–822. doi: 10.1037/bul0000102
Spitzer, R. L., Kroenke, K., Williams, J. B. W., and Löwe, B. (2006). A brief measure for assessing generalized anxiety disorder: The GAD-7. Arch. Internal Med. 166, 1092–1097. doi: 10.1001/archinte.166.10.1092
Stricker, L., Rock, D., and Burton, N. (1993). Sex differences in predictions of college grades from scholastic aptitude test scores. J. Educ. Psychol. 85, 710–718. doi: 10.1037/0022-0663.85.4.710
Tan, G. X. D., Soh, X. C., Hartanto, A., Goh, A. Y. H., and Majeed, N. M. (2023). Prevalence of anxiety in college and university students: An umbrella review. J. Affect. Disord. Rep. 14:100658. doi: 10.1016/j.jadr.2023.100658
Teigen, K. H. (1994). Yerkes-Dodson: A law for all seasons. Theory Psychol. 4, 525–547. doi: 10.1177/0959354394044004
Tsai, L.-L., and Li, S.-P. (2004). Sleep patterns in college students: Gender and grade differences. J. Psychosom. Res. 56, 231–237. doi: 10.1016/S0022-3999(03)00507-5
Turner, R. W., Vissa, K., Hall, C., Poling, K., Athey, A., Alfonso-Miller, P., et al. (2021). Sleep problems are associated with academic performance in a national sample of collegiate athletes. J. Am. Coll. Health 69, 74–81. doi: 10.1080/07448481.2019.1655027
Waqas, A., Rehman, A., Malik, A., Muhammad, U., Khan, S., and Mahmood, N. (2015). Association of ego defense mechanisms with academic performance, anxiety and depression in medical students: A mixed methods study. Cureus 7:e337. doi: 10.7759/cureus.337
Warren, N. B., and Campbell, T. H. (2021). The sleep-deprived masculinity stereotype. J. Assoc. Consum. Res. 6, 236–249. doi: 10.1086/711758
Whitley, R. (2021). “Chapter 5: Risk factors and rates of depression in men: Do males have greater resilience, or is male depression underrecognized and underdiagnosed?,” in Men’s Issues and Men’s Mental Health: An Introductory Primer, ed. D. Kritsotaki V. Long and M. Smith (Cham: Springer International Publishing), doi: 10.1007/978-3-030-86320-3
Wild, C. J., Nichols, E. S., Battista, M. E., Stojanoski, B., and Owen, A. M. (2018). Dissociable effects of self-reported daily sleep duration on high-level cognitive abilities. Sleep 41:zsy182. doi: 10.1093/sleep/zsy182
World Mental Health Report (2022). World Mental Health Report: Transforming Mental Health for All. Geneva: World Health Organization.
Wyatt, T., and Oswalt, S. B. (2013). Comparing mental health issues among undergraduate and graduate students. Am. J. Health Educ. 44, 96–107. doi: 10.1080/19325037.2013.764248
Keywords: sleep, gender, mental health, depression, anxiety, stress, academic performance
Citation: Kuhn T, Heisz JJ and Middleton LE (2025) The impact of sleep, mental health, and gender on academic performance in Canadian university students. Front. Educ. 10:1565920. doi: 10.3389/feduc.2025.1565920
Received: 23 January 2025; Accepted: 16 April 2025;
Published: 09 May 2025.
Edited by:
Natanael Karjanto, Sungkyunkwan University, Republic of KoreaReviewed by:
Jiyoon Yoon, University of Texas at Arlington, United StatesBianca Marella, Tarumanagara University, Indonesia
Lie Fun, Maranatha Christian University, Indonesia
Copyright © 2025 Kuhn, Heisz and Middleton. This is an open-access article distributed under the terms of the Creative Commons Attribution License (CC BY). The use, distribution or reproduction in other forums is permitted, provided the original author(s) and the copyright owner(s) are credited and that the original publication in this journal is cited, in accordance with accepted academic practice. No use, distribution or reproduction is permitted which does not comply with these terms.
*Correspondence: Laura E. Middleton, bGF1cmEubWlkZGxldG9uQHV3YXRlcmxvby5jYQ==