 Thu D. Pham
 Angela Baeza Penã2†
 Peter J. Anderson
- 1Indigenous Research Unit, Griffith University, Brisbane, QLD, Australia
- 2Carumba Institute, Queensland University of Technology, Brisbane, QLD, Australia
- 3Graduate School, The University of Queensland, Brisbane, QLD, Australia
- 4Office of the Deputy-Vice-Chancellor (Indigenous Engagement), University of Queensland, Brisbane, QLD, Australia
- 5Relational Insights Data Lab, Griffith University, Brisbane, QLD, Australia
Introduction: This study compares the 5-factor and 4-factor models of the Higher Education Success Factor (HESF) framework. Through this research, we aimed to identify the social determinants influencing Australian university students’ completion rates. We analysed responses from 2,248 participants. The social determinants we examined included the social environment, physical environment, economic conditions, health and wellbeing, and individual characteristics.
Methods: Confirmatory factor analysis was used to validate both models. While both models demonstrated strong and consistent goodness-of-fit measures, the findings reveal that the 4-factor model outperforms the 5-factor model.
Results: Our findings suggest that the 4-factor model provides a good fit to the modified model and reduces the risk of redundancy and overfitting in evaluating the factors that impact student success.
Discussion: Based on our findings, we advocate for academic institutions to adopt the HESF model to identify better where students need support, ultimately improving university completion rates in Australia.
1 Introduction
The impacts of social forces on students’ completion are obvious and substantial. Over the past two decades, research on the social determinants of university students has garnered attention on a global scale (Hemsley-Brown and Oplatka, 2015; Le et al., 2019). Global attention on retention rates in higher education has influenced understanding of the university choice process. The decision-making process for higher education is multifaceted as it incorporates a distinct set of considerations at each stage which varies depending on individual characteristics (Sojkin et al., 2012). Various studies have examined specific determinants, including university rankings, parental involvement and information-seeking sources (Gao, 2018; Koshy et al., 2019; Le et al., 2019; Koenings et al., 2020), highlighting how these factors interact within sociocultural contexts. In the Australian context, studies (James, 2000; Koshy et al., 2019) have shown how socioeconomic factors influence university progression, with parental expectations and institutional structures affecting students from disadvantaged backgrounds.
In this research, we aim to understand who completes a university degree in Australia by identifying the social determinants that influence successful completion. The research question guiding this study is: “What are the main multidimensional factors influencing Australian students” completion of a university degree?’ This study examines a selected set of social determinants that have been identified as significant based on existing literature and available data. Rather than attempting to capture all potential influences, we examine the key above-mentioned social determinants that provide meaningful insights into degree completion rates. Our aim is not to develop a universal model applicable to all contexts but to contribute to a deeper understanding of how specific social determinants shape Australian students’ educational outcomes in higher education.
2 Materials and methodology
2.1 A proposed model for higher education success factor
The higher education success factor (HESF) model was developed by Pham et al. (2024), is a multidimensional construct that can be used to measure the factors influencing a university completion. The HESF model draws its inspiration from the social determinants of health framework developed by Marmot et al. (2005) and the WHO (2010), as well as the social determinants of education framework proposed by Sammen (2017). The framework of health was proposed to draw attention to the role of non-medical social determinants that influence health outcomes (see Marmot et al., 2005). Sammen’s (2017) social determinants of education framework suggests five key areas in each determinant and was used as a guide.
The HESF model (Pham et al., 2024) which focused on Indigenous graduates only has identified five social determinants influencing Australian students’ completion. These include social environment, physical environment, economic conditions, health and wellbeing, and individual characteristics (see Figure 1).
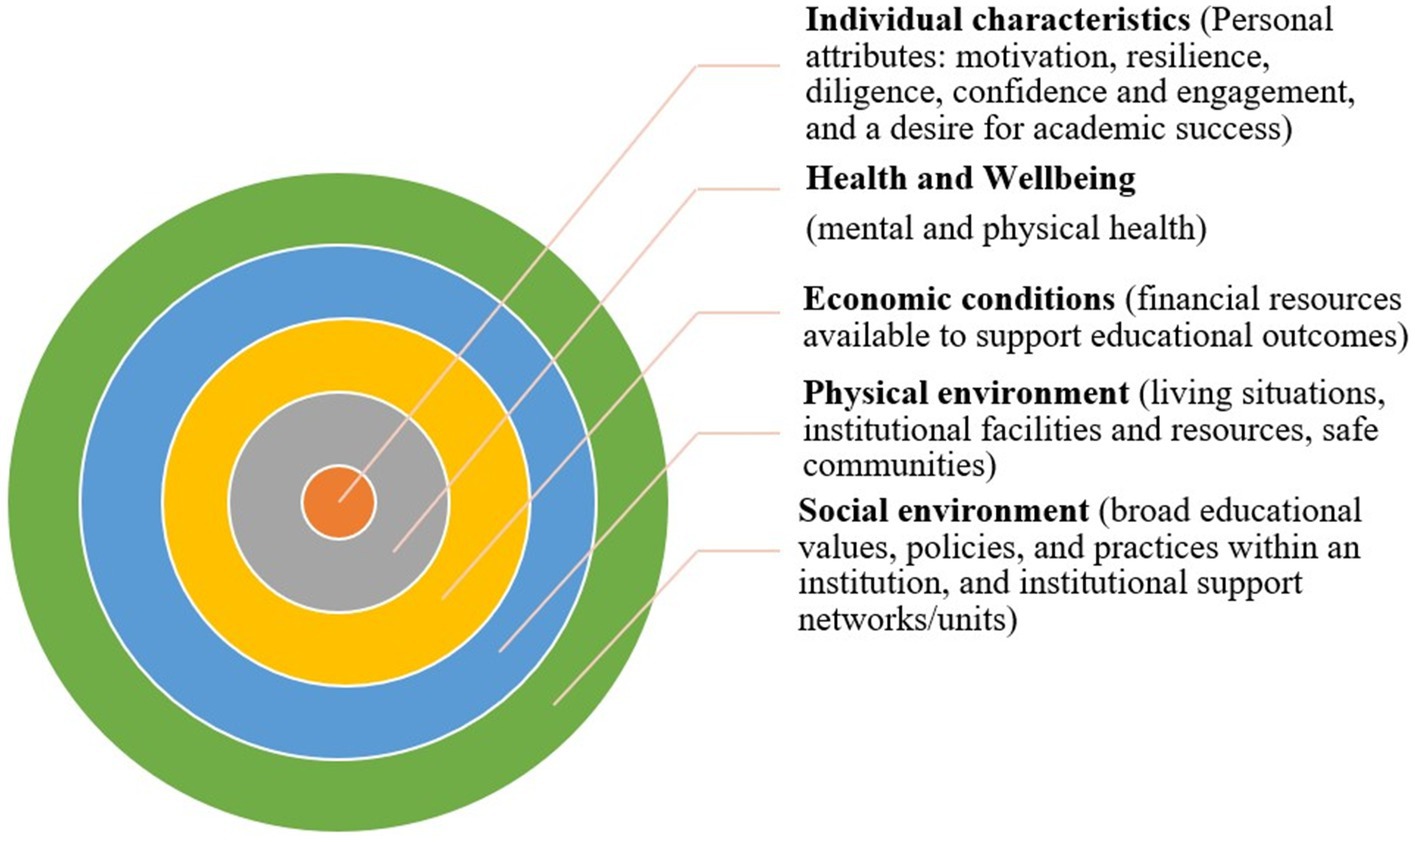
Figure 1. The higher education success factor model (Pham et al., 2024).
The HESF model illustrates the inner individual layers and the external factors that have the potential to enable and/or constrain educational outcomes. The social environment factor focuses on broad education values, policies, and practices within an institution, including the university learning environment, course or unit design, academic and administrative staff professionalism, and the institutional support works and/or units. The physical environment factor has been expanded from the housing and neighborhood framework in Sammen (2017) to incorporate institutional facilities and learning resources, along with living situations, such as housing and community environment, institutional facilities and resources, and safe communities. The economic conditions factor pertains to financial resources allocated to support education outcomes, including scholarships, parents/ guardians’ employment conditions, and financial resources available to support educational outcomes.
In the above-mentioned HESF model, we expanded the health and wellbeing factor to include both physical and mental health. The significant impact of mental health on students’ academic performance (McKenzie and Schweitzer, 2001; Behrendt et al., 2012; Simpson and Ferguson, 2012) could not be ignored and was incorporated into the health and wellbeing factor.
We also acknowledge that factors such as motivation, academic and social engagement, and resilience are crucial to university students’ academic performance (McKenzie and Schweitzer, 2001; Devlin, 2009; Krause and Armitage, 2014). The individual characteristics factor in the HESF model refers to personal attributes, such as motivation, resilience, diligence, confidence, engagement, and a desire for academic success.
To evaluate the HESF model on all Australian graduates, we developed a survey instrument where the model represents multiple factors related to students’ completion. From this perspective, a psychometrically sound instrument would require (a) each determinant/factor to be measured by multiple items and (b) all determinants/factors to be distinguishable individually. We employed a confirmatory factor analysis (CFA) to evaluate two HESF models (i.e., the 5-factor model and the 4-factor model) to determine which model fit our data best. The next section introduces a brief explanation and rationale for CFA.
2.2 Methodology
This study employed a quantitative approach using CFA to evaluate HESF models. The construct examined five unobserved factors: individual characteristics, health and wellbeing, economic conditions, physical environment, and social environment.
The CFA is a theoretically informed statistical framework for linking multiple observed variables to latent variables that are not directly measurable (Roos and Bauldry, 2022). CFA is a statistical technique used to verify the factor structure of a set of observed variables. The above-mentioned technique allows the researcher to test the hypothesis that a relationship between observed variables and their underlying latent constructs exists (Statistical Solutions, 2013). DiStefano and Hess (2005) state one of the following objectives should be clearly stated when using CFA: (1) the goal of refining an existing theoretical perspective, (2) supporting an existing structure, or (3) testing a known dimensional structure. We employed CFA to evaluate the HESF models and substantiate the construct structure of the higher education success factor (objective number 2 above).
2.2.1 Research participants and data collection
A total of 2,528 Australian and/or permanent resident (Indigenous and non-Indigenous) graduates aged 18 and above who graduated from an Australian university between 2018 and 2022 participated in this study. Among the 2,528 participants, 308 identified as Aboriginal and/or Torres Strait Islander people (hereafter respectfully referred to as “Indigenous”). Participants were recruited by Qualtrics using convenience sampling and screened at the commencement of the survey. Screening questions included asking the participants if they were 18 or over and had completed a university degree between 2018 and 2022. Ethical clearance from Queensland University of Technology (QU ethics approval number 6118) was obtained to conduct this research.
2.2.2 Survey development
This study aims to identify the social determinants or latent factors that influence Australian university students’ successful completion of a higher education degree and/or degrees. The research team designed an online questionnaire based on our research aim. The survey was structured into four parts:
1. Demographic questions include age, gender, ethnic group, marital status, Indigeneity, working conditions, living conditions, and so on.
2. A five-point Likert-scale asking graduates to rank their level of agreement from strongly agree to strongly disagree (i.e., strongly agree—agree—neutral—disagree—strongly disagree) on questions about the social environment (i.e., support network and inclusive university environment—12 items), physical environment (i.e., housing or neighborhood—6 items), economic conditions (i.e., parents’/guardians’ employment conditions, financial support—6 items), health and wellbeing (i.e., physical and mental health - 4 items), and individual characteristics (i.e., motivations, adaptation, resilience—6 items) which supported, hindered and/or influenced their success in university completion. While some questions are specifically designed for Indigenous participants, the Likert scale used for these questions is the same as that used for non-Indigenous participants. For examples, we asked graduates to rank their level of agreement for statements such as:
• My family was supportive toward my completion of a university degree;
• I felt that staff members in Indigenous units were mostly friendly, welcoming, and supportive;
• I had no concerns about paying my tuition or stipends;
• I can easily find a healthcare clinic/center when I have a concern about my mental health.
• I felt that the university sufficiently provided facilities to Indigenous students
1. Ranking questions, where graduates had to rank the three most impact factors from their perspective out of the five factors listed above.
2. Open-ended questions, asking graduates to elaborate on the factors they ranked as most impactful on their completion.
This article focuses on the data collection in the second part of the survey, which utilized a five-point Likert scale. Qualtrics software was used to design the online survey. Of the 2,528 valid responses, we were able to use 2,248 responses in our analysis.
2.2.3 Data analysis
SPSS statistics version 29 and R version 4.4.0 software were used to analyse the quantitative data, and Nvivo 14 software was used to analyse the open-ended responses. We analysed the demographic variables and also determined the means and standard deviation of the observed variables.
A CFA approach was employed to address the measurement of latent variables (or factors) through the specification of a measurement model—the HESF model. The relationships between latent variables (the five mentioned above factors) and the observed variables (34 observed variables in total) were measured (Roos and Bauldry, 2022). The data, being of an ordinal nature following a Likert scale, often violates the assumptions of multivariate normality required for standard maximum likelihood estimation in CFA. Hence, special methods like polychoric correlations such as weighted least square means and variances adjusted (WLSMV) were employed. Han (2022) states that in order to deal with non-normality with categorical indicators, WLSMV methods have been recommended. Han (2022: 4) explains:
WLSMV is a limited information estimation method that utilize summary statistics (i.e., tetrachoric or polychoric correlations). As a limited information method, WLSMV is not only robust but also computationally fast, especially when the sample size and the number of dimensions are large.
Additionally, the Spearman correlation was utilized, and an Oblimin rotation was integrated into the analysis. Spearman’s rank correlation is a non-parametric measure of the strength of the relationship between two variables, focusing on monotonic relationships and not assuming linearity or interval scales that are suitable for ordinal data, making it a more appropriate choice than Pearson’s correlation for Likert-scale data (Bishara and Hittner, 2012). To handle missing data, pairwise deletion was implemented on the ordinal data during the execution of both the four-factor and five-factor and CFA models. Pairwise deletion is employed when the statistical procedure uses cases that contain some missing data, and this approach allows researchers to maximize the number of cases used to the greatest extent possible (Marsh, 1998). Mean and mode imputation for missing data by question and group was also trialed but only impacted key fit statistics marginally, without any material or statistical gains, the introduction of this step and complexity was warranted as unnecessary for this paper. However, more advanced and accurate methods could be tested in research future if required.
The hypothesized construct comprised 34 observed variables. Initially, eight variables were excluded due to their dependencies and a significant proportion of missing data. We also excluded 280 straight-line responses, which was determined by removing all responses that had a mean of one due to the respondent answering the same response (e.g., 1, 1, 1… 0.1 or, 2, 2, 2…2) to all questions across the entire survey. Excluding straight-line responses from CFA models is crucial to maintaining the integrity of the analysis. If included, these responses can distort the measurement of latent constructs, leading to biased and unreliable results. By excluding such data, we can ensure our proposed CFA models more accurately reflect the true relationships among the variables of interest, thereby improving the validity and reliability of their findings. After this exclusion, the analysis proceeded with 2,248 rows remaining. Please see Table 1 for the included and excluded variables from the proposed hypothesized construct.
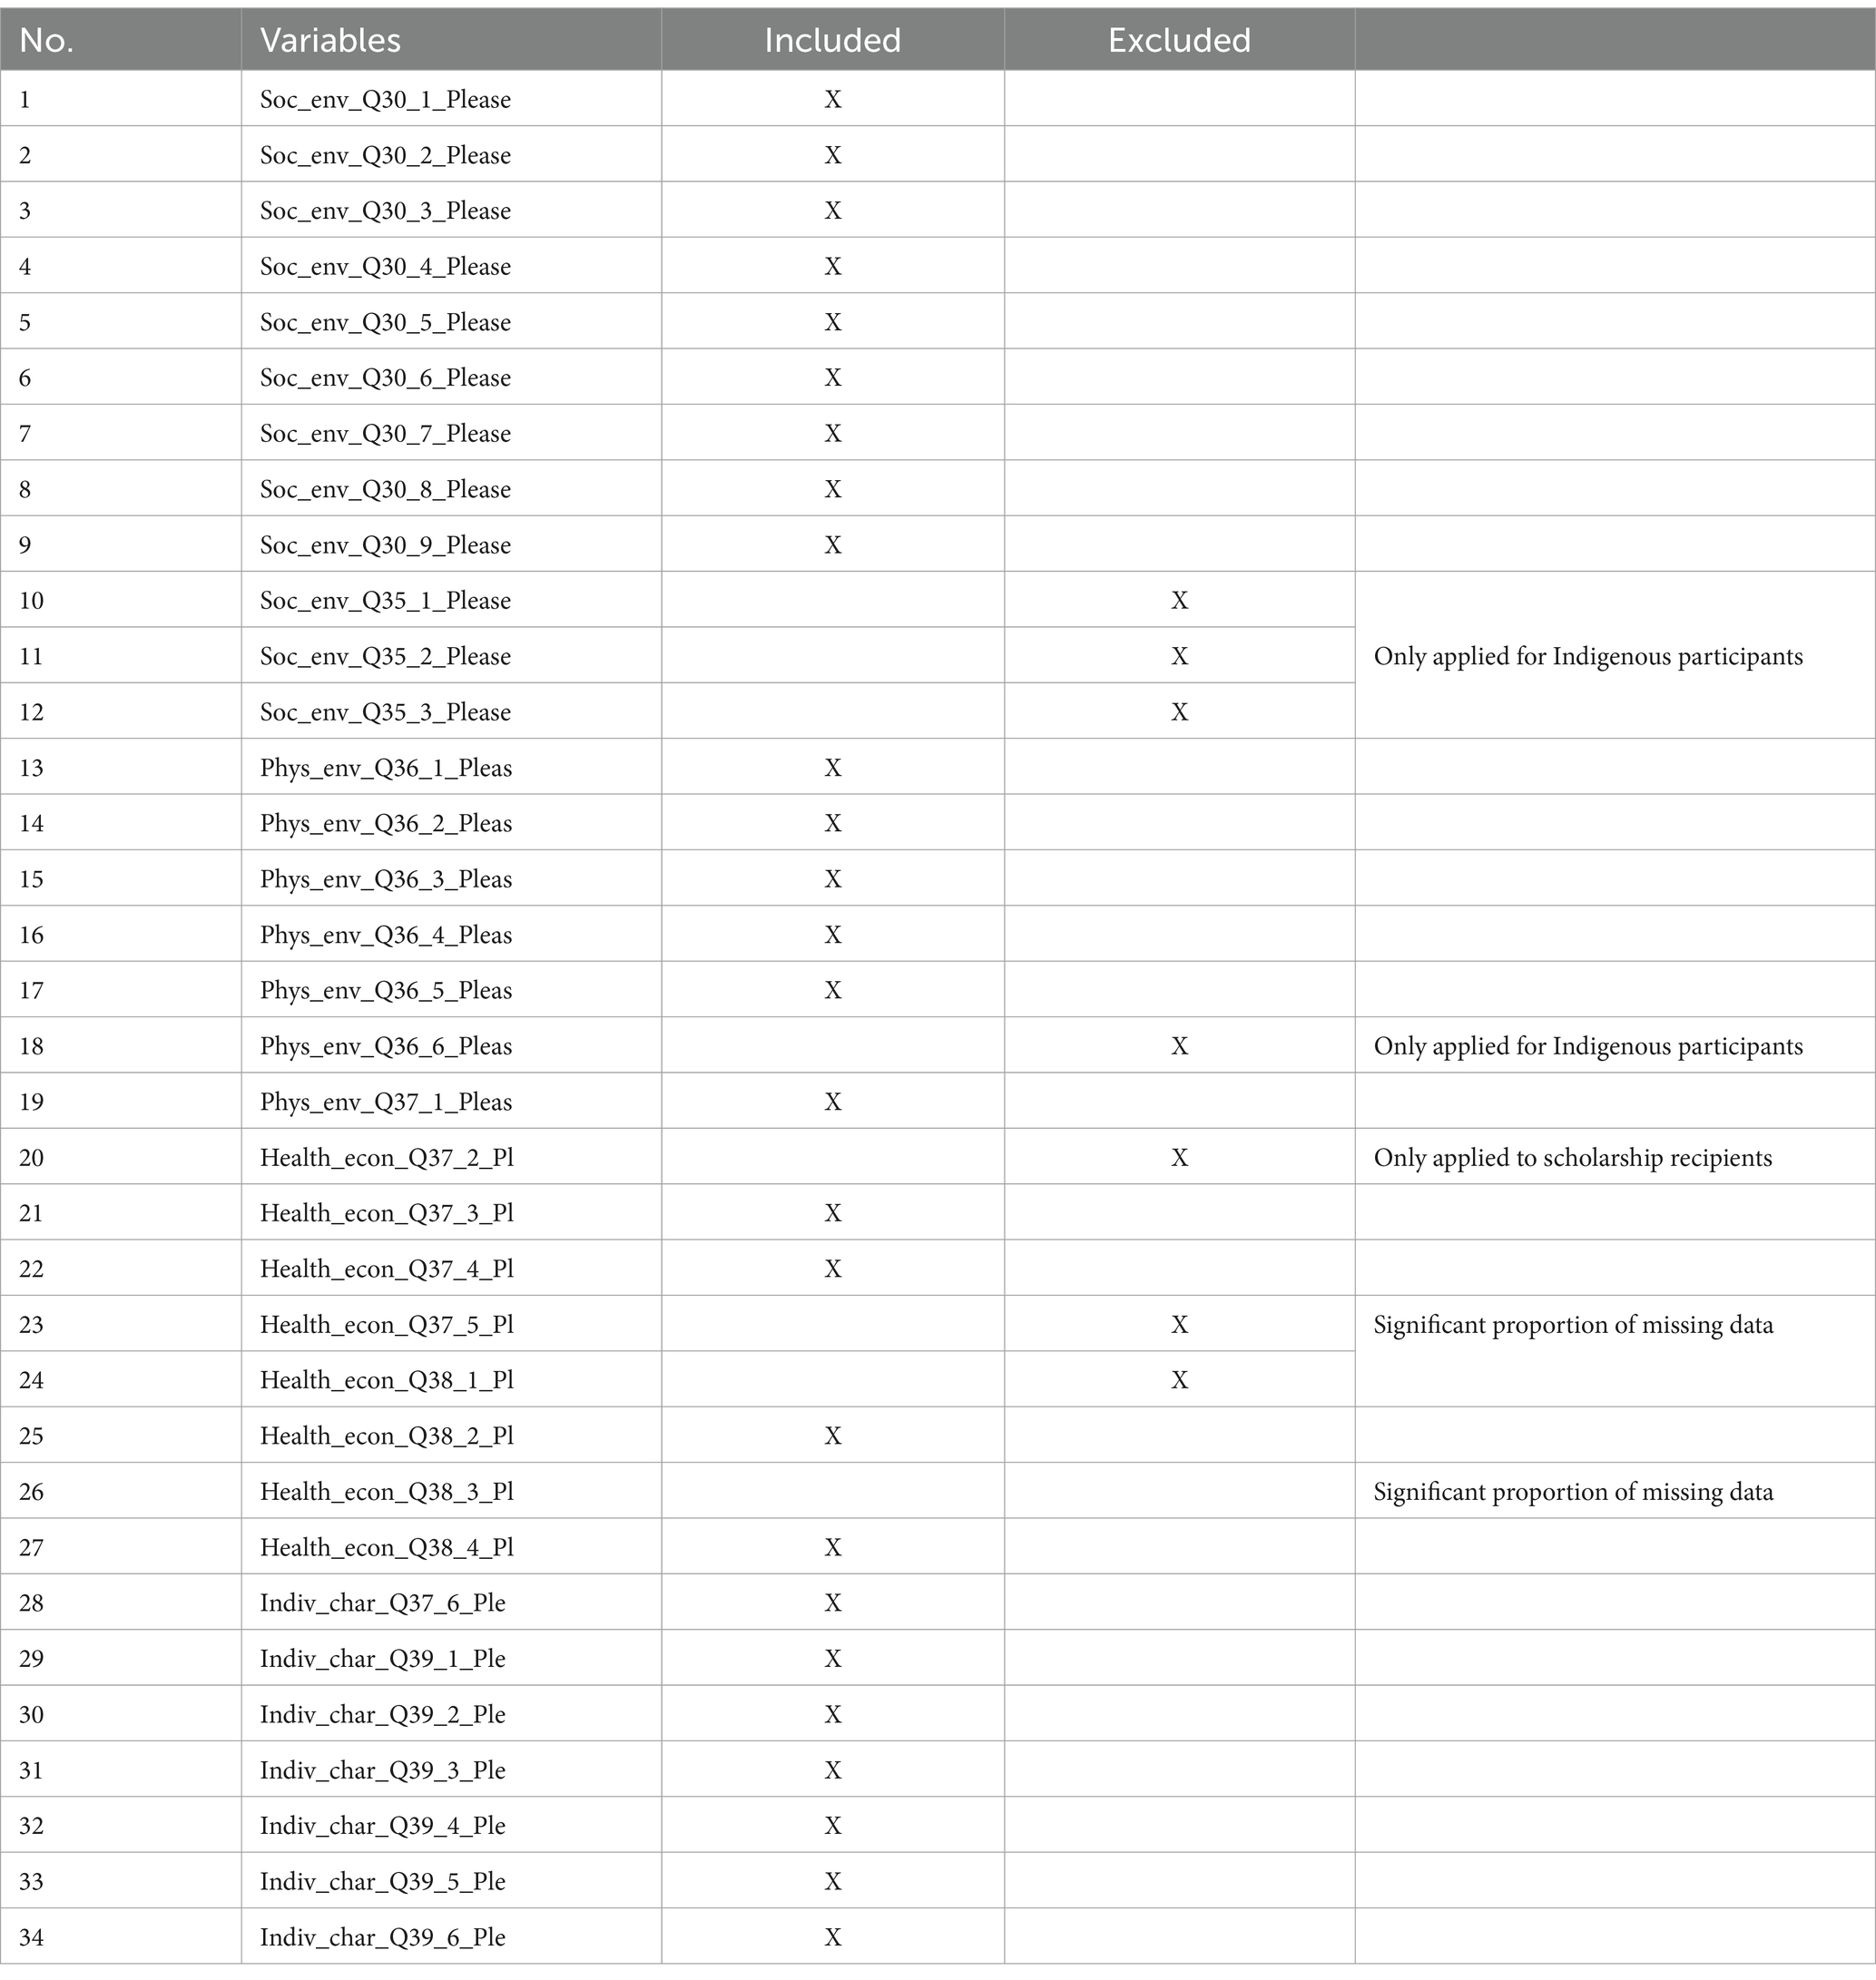
Table 1. Variables inclusion and exclusion.
To ensure the data were suitable for factor analysis, we applied the Kaiser-Meyer-Olkin (KMO) criterion and Bartlett’s test of sphericity. Additionally, the Shapiro–Wilk test was conducted, confirming the appropriateness of using Spearman’s rank correlation (rho). According to common statistical practice, Spearman’s correlation is suitable for analysing ordinal and continuous data because it relies on ranks rather than assuming normality. Making Spearman’s correlation particularly effective for three-, five-, and seven-point Likert scale survey questions often used in social sciences. Unlike Pearson correlation, Spearman’s correlation evaluates relationships based on ranked values instead of raw data, making it ideal for relationships involving at least one ordinal variable or when the relationship is only partially linear.
Hair et al. (2006) recommend a KMO value >0.5, while Kaiser (1974) classifies KMO values as follows: over 0.90 as marvelous, 0.80s as meritorious, 0.70s as middling, 0.60s as mediocre, 0.50s as miserable, and below 0.5 as unacceptable. In this study, the overall KMO value was 0.899, indicating a (just) marvelous level of sampling adequacy and confirming the data’s suitability for factor analysis. All 26 variables met the required KMO criterion threshold with 92.3 per cent (24 out of 26) above 0.8 and 7.7 per cent (two out of the 26) above 0.7., making all variables suitable for further factor analysis (Hair et al., 2006).
To further evaluate the suitability of the respondent data for factor analysis, we conducted Bartlett’s test of sphericity. According to Williams et al. (2010), factor analysis is appropriate when this test produces a significant result (p < 0.05) (Shrestha, 2021; Williams et al., 2010). The Bartlett’s test of sphericity for our dataset yielded a highly significant result at an alpha level of 0.05, χ2(325) = 23011.53; p < 0.001, confirming the data’s suitability for factor analysis. In the next section, we discuss the results obtained from the dataset based on the above-mentioned analyses.
3 Results
3.1 Demographic characteristics of Australian graduates
Table 2 below presents demographic data on gender, age, Indigeneity, degree completion, and year of completion, including their respective counts, percentages, means, and standard deviations. This information provides a comprehensive overview of the research participants.
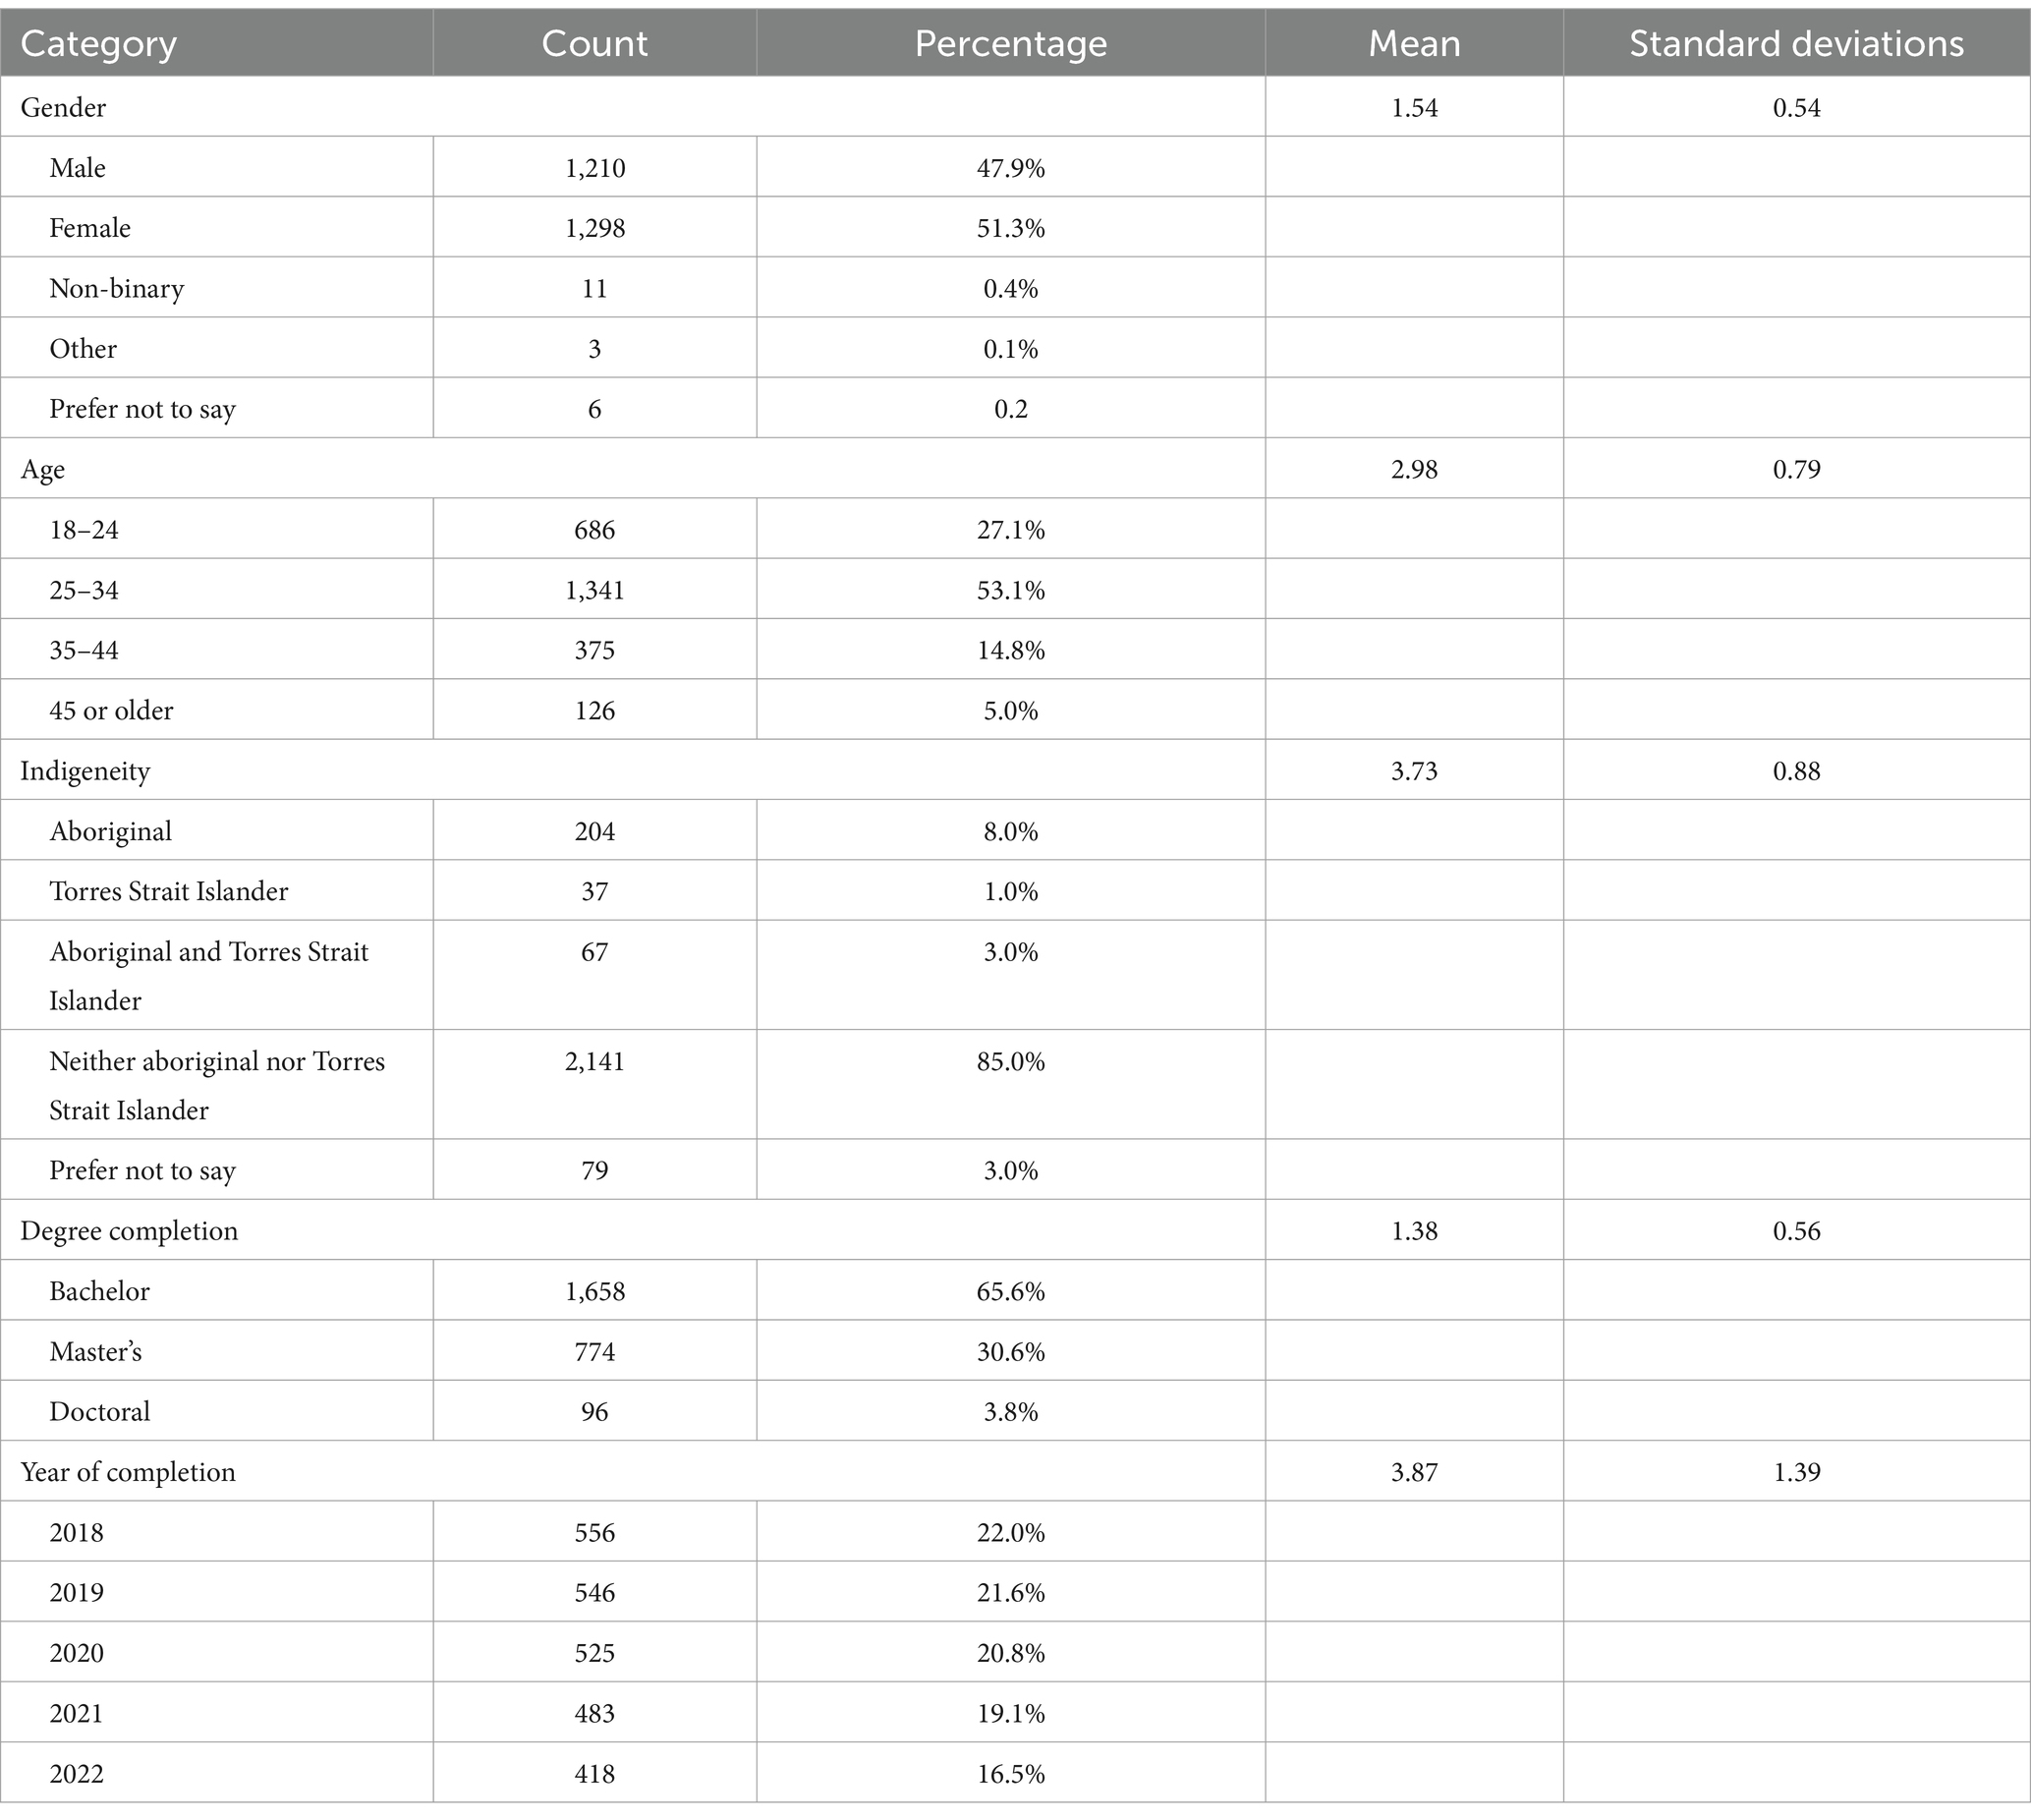
Table 2. Demographic characteristics of Australian graduates.
The majority of participants were male (47.9%) and female (51.3%) with a small proportion identifying as non-binary (0.4%), other (0.1%), or preferring not to disclose (0.2%). The mean for gender is 1.54 with a standard deviation of 0.54. Regarding age, most respondents are between 25 and 34 years old (53.1%), followed by 18–24 (27.1%), 35–44 (14.8%), and 45 or older (5.0%). The mean age category is 2.98 with a standard deviation of 0.79. Most participants (85%) were non-Indigenous, while 8.0% identified as Indigenous participants (i.e., Aboriginal, 1.0% as Torres Strait Islander, and 3.0% as both). Another 3.0% preferred not to disclose. The mean category is 3.73 with a standard deviation of 0.88. Most participants completed a bachelor’s degree (65.6%), followed by master’s (30.6%) and doctoral degrees (3.8%). The mean for degree completion is 1.38 with a standard deviation of 0.56. The respondents graduated across multiple years, with the largest proportion in 2018 (22.0%), decreasing slightly in subsequent years until 2022 (16.5%). The mean year of completion is 3.87 with a standard deviation of 1.39.
3.2 Descriptive statistics and reliabilities
Table 3 summarizes the means, standard deviations and reliabilities of the proposed constructs. Across both models, Cronbach’s alpha ranges between 0.59 and 0.83. The five-factor HESF model has two factors with unreliable measures of Cronbach’s alpha (below 0.7 - see Table 4 below). However, the four-factor model suggests reliable consistency for each factor with all measures above 0.7. As a rule of thumb, Cronbach’s alpha is in an acceptable range when it is over 0.7, and excellent for over 0.9 value. Cronbach’s alpha is a measure of internal consistency, and it is considered as a measure of scale reliability. As Hair et al. (2018) state that reliability can be assessed by the degree of internal consistency which is determined by how highly interrelated the indicators are to one another. In testing the internal consistency of the construct with Cronbach’s alpha and the overall reliability of each factor and variable in both the 5-factor and 4-factor models. When we look at the summary statistics and Cronbach’s alpha to better explore and compare overall model fit; the 4-factor model seems to exhibit slightly better internal consistency and reliability based on the Cronbach’s alpha values across the factors. While the 5-factor model introduces an additional factor, it does not substantially improve the model’s reliability, and in some cases, it reduces the internal consistency. Therefore, based on the reliability statistics, the four-factor model may again be better suited for the data, offering slightly higher internal consistency and reliability. This consistency is essential for survey data analysis, especially in a social science setting where the aim is to measure latent constructs accurately. The 4-factor model’s simplicity and higher reliability make it a more robust choice for this data set.
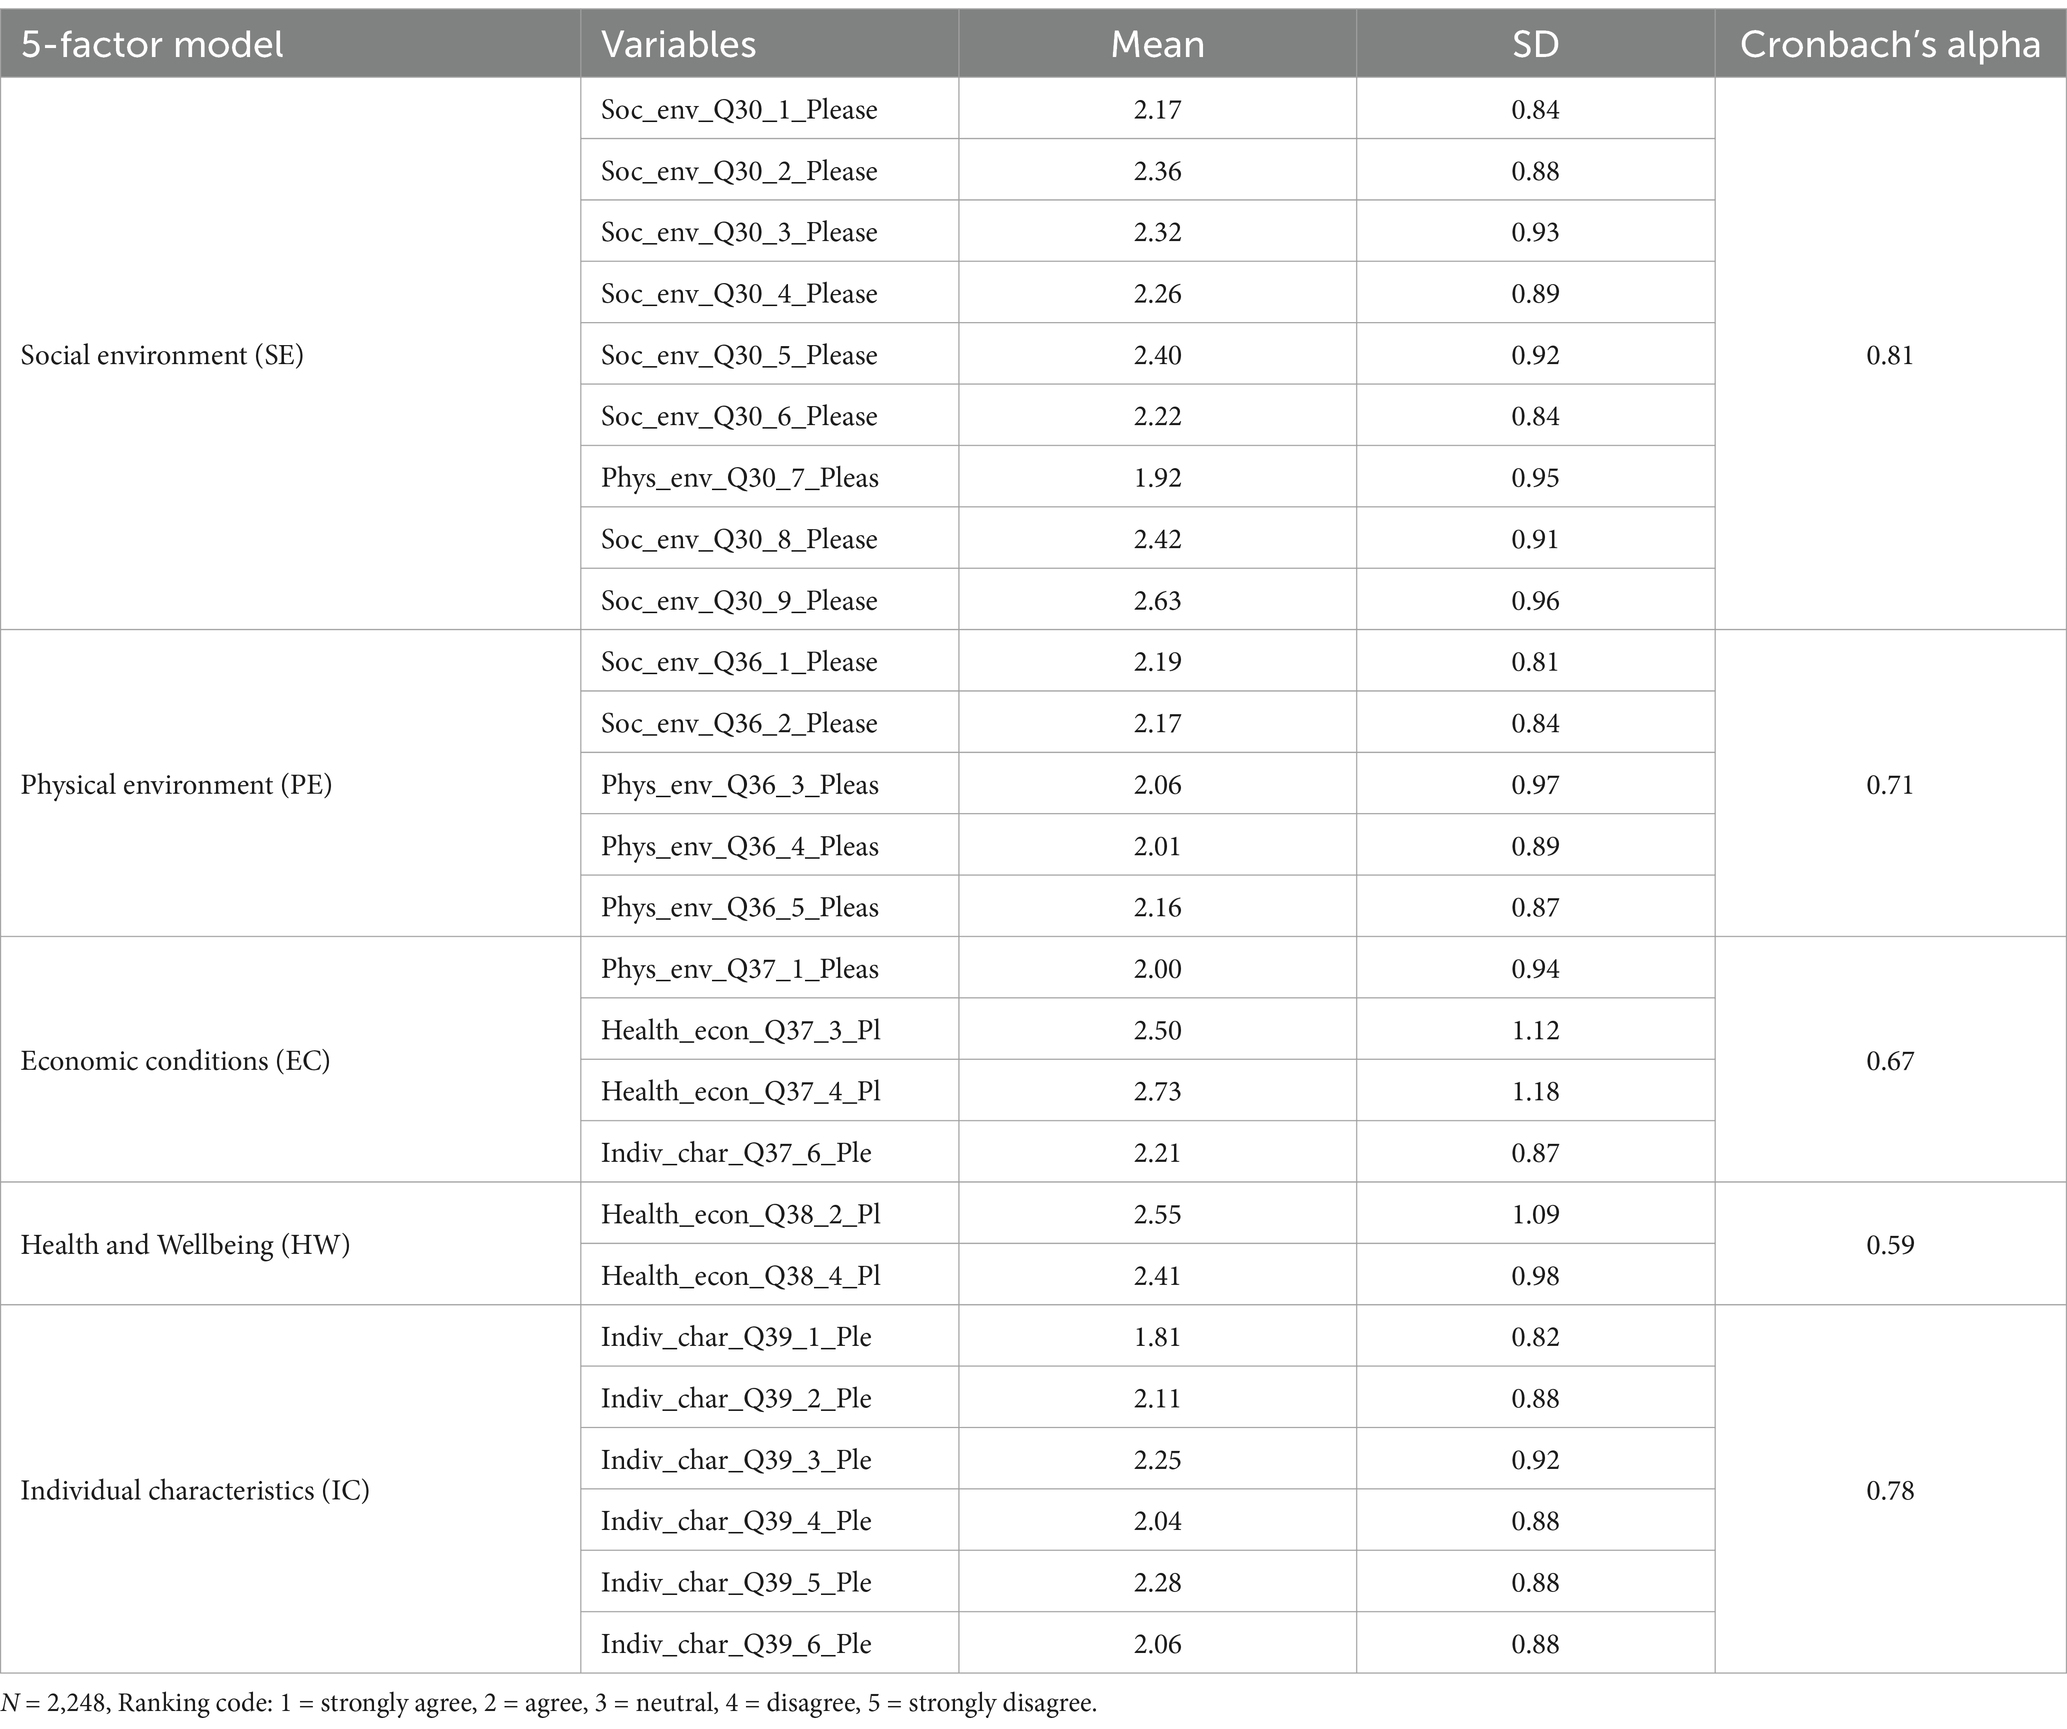
Table 3. 5-factor model descriptive statistics and reliabilities.
Tables 3, 5 also show the means and standard deviations of each Likert scale survey item. The means are well below the neutral value, indicating that the respondents agree that social determinants influence their completion despite the high standard deviation.
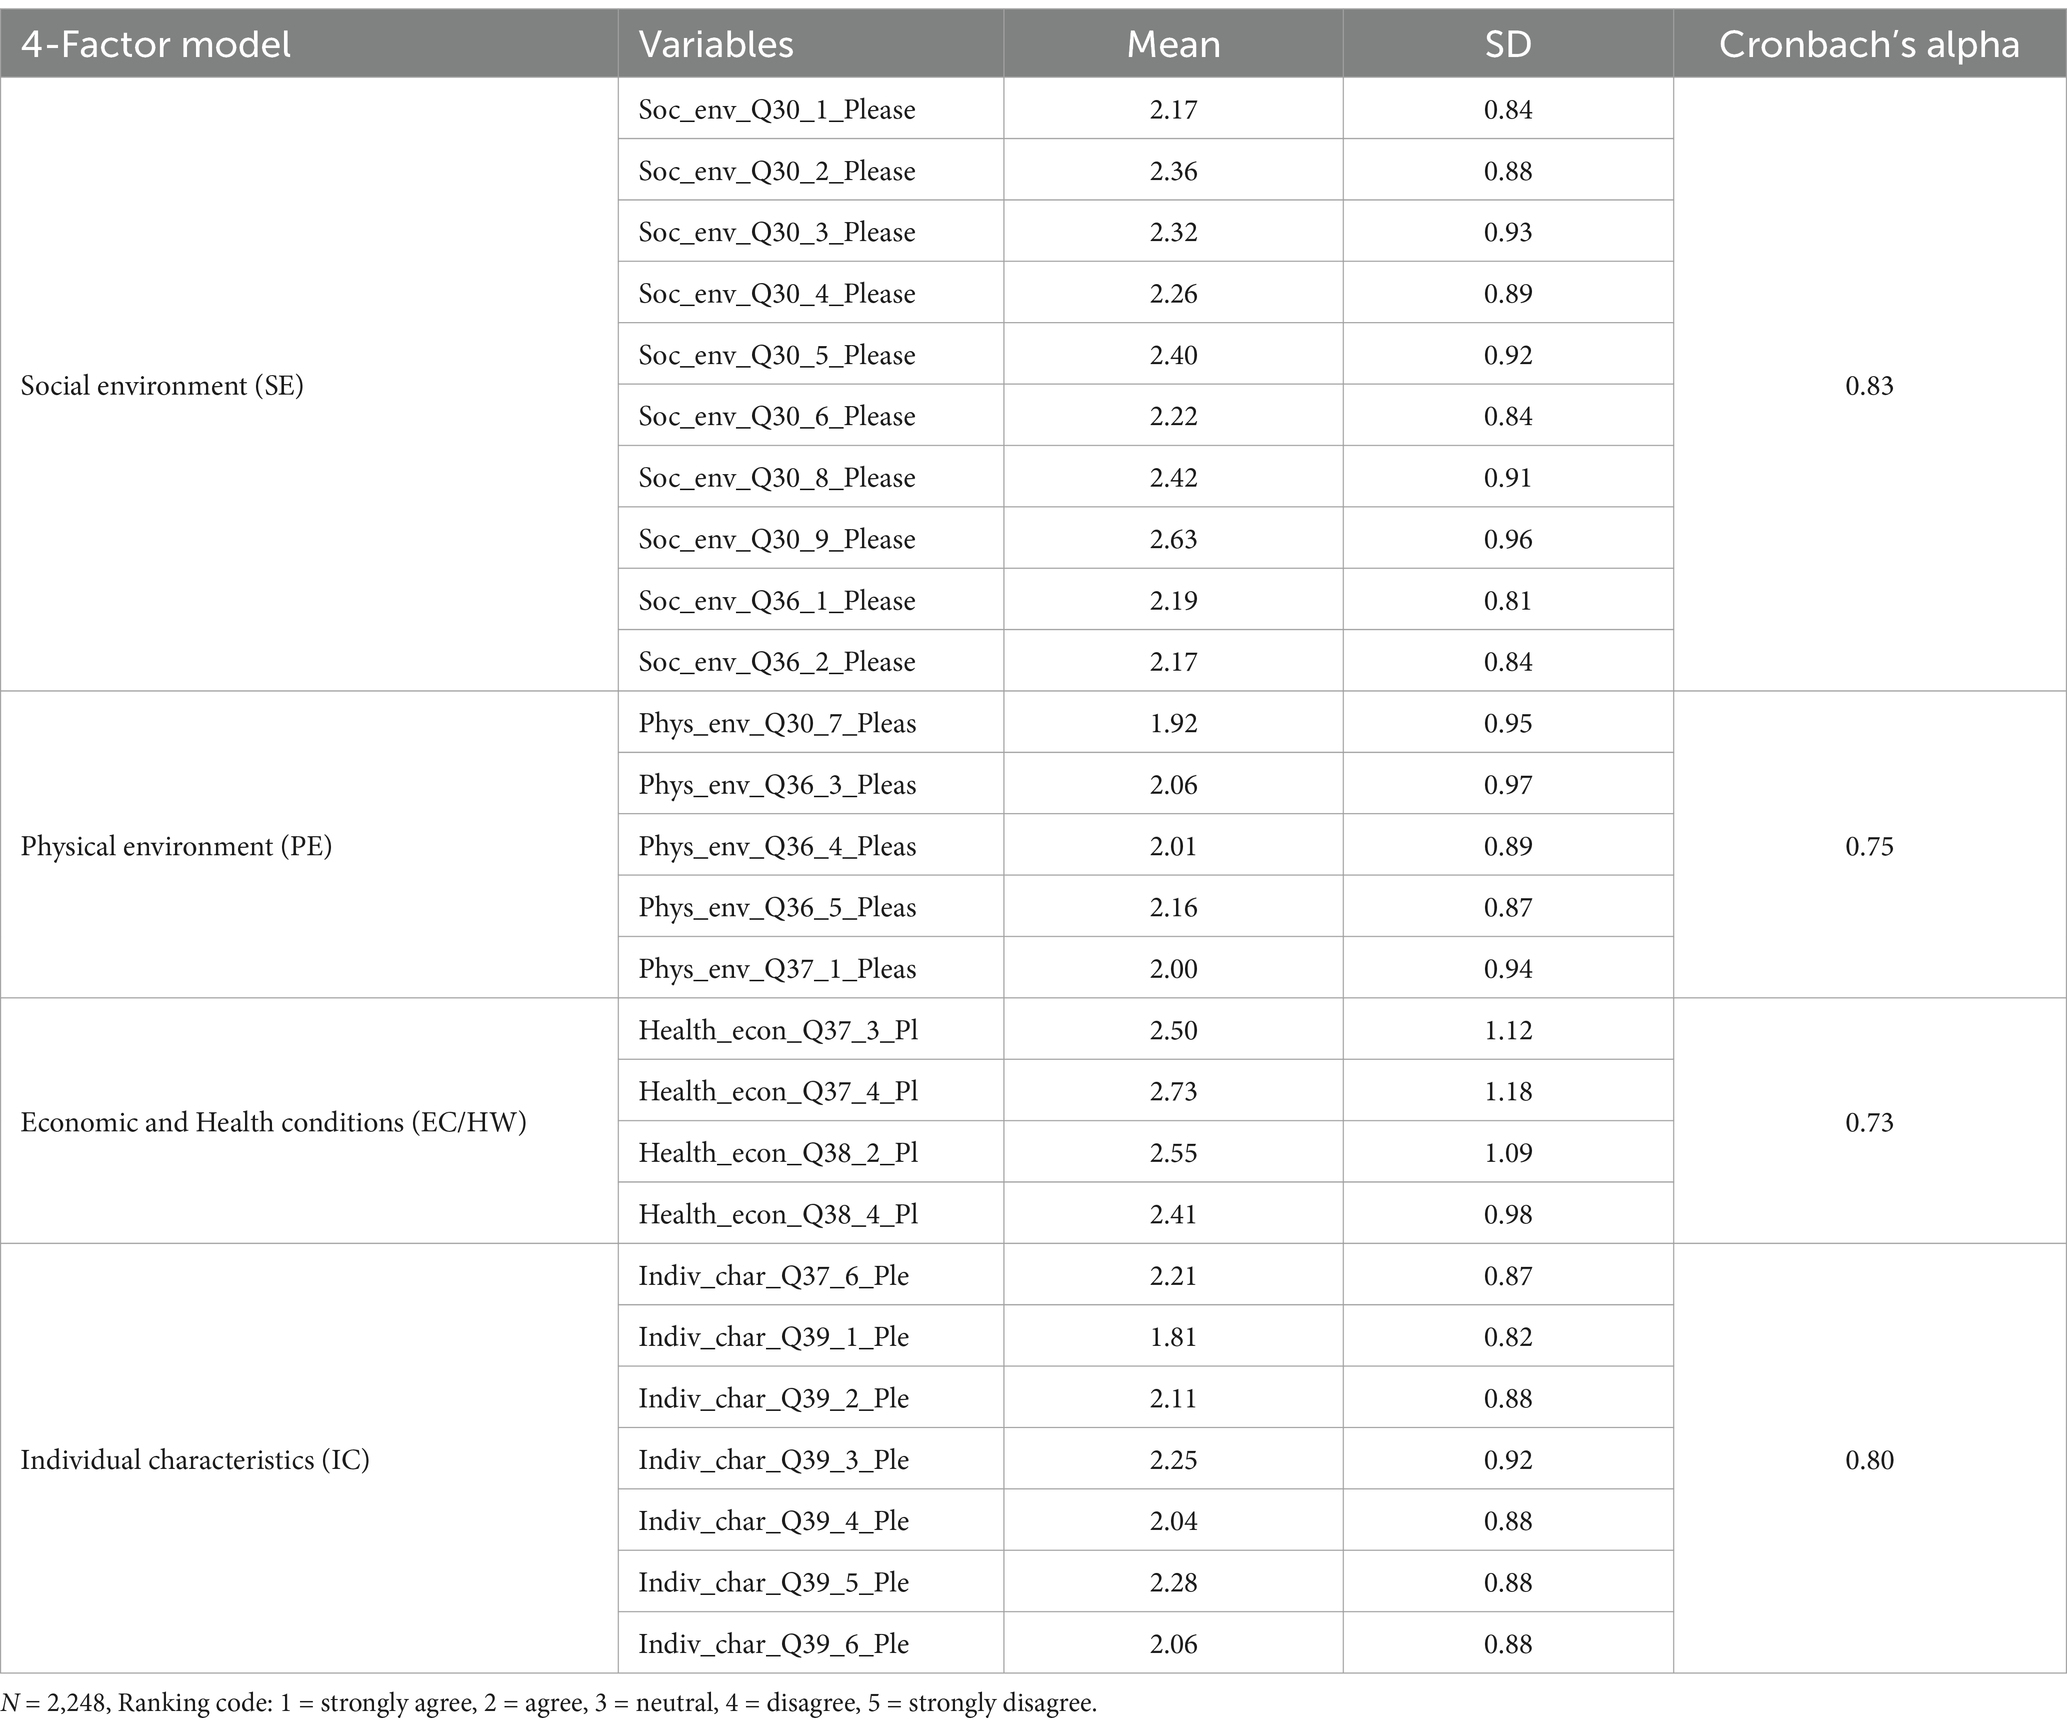
Table 5. 4-factor model descriptive statistics and reliabilities.
3.3 Confirmatory factor analysis
In this study, CFA was employed to validate the construct validity of the survey items. From an evaluation perspective, we tested two CFA models (see Table 6) and compared their fit measures, their internal consistency and their parsimonious fit to determine which model fits the data best. (1) The 5-factor model (see Figure 2) includes five factors proposed in the hypothesized construct. The 5-factor model (CFI = 0.927, TLI = 0.918, RMSEA = 0.094, RMSEA confident interval (CI) = 0.093–0.097, SRMR = 0.084) showed good fit indices supporting the hypothesized five factors of social determinants in higher education. (2) The 4-factor model (see Figure 3) includes four factors in which we respecified the latent variables, combined the economic conditions and health and wellbeing factors, and named it the health and economic wellbeing factor. The 4-factor model (CFI = 0.955, TLI = 0.955, RMSEA = 0.075, RMSEA confident interval (CI) = 0.073–0.077, SRMR = 0.067) showed a good fit, suggesting the four-factor model is a good fit to the modification model and reduces the risk of redundancy and overfitting. The difference in fit indices between the 5-factor model and the 4-factor model was trivial (0.028 in robust CFI; 0.037 in robust TLI, −0.019 in robust RMSEA and −0.017 in SRMR).
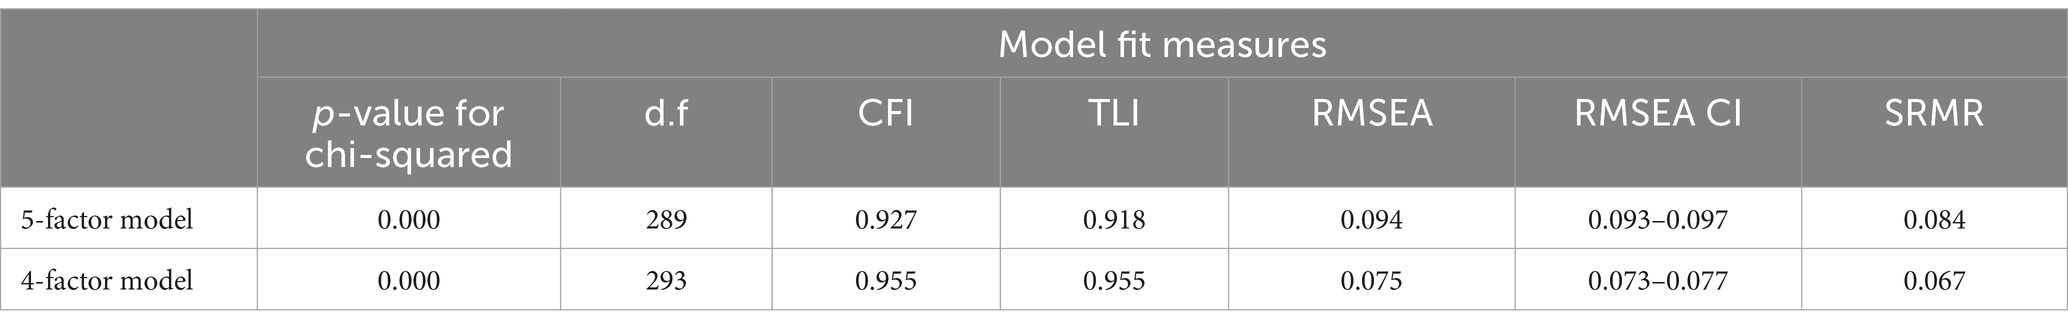
Table 6. Model fit measures.
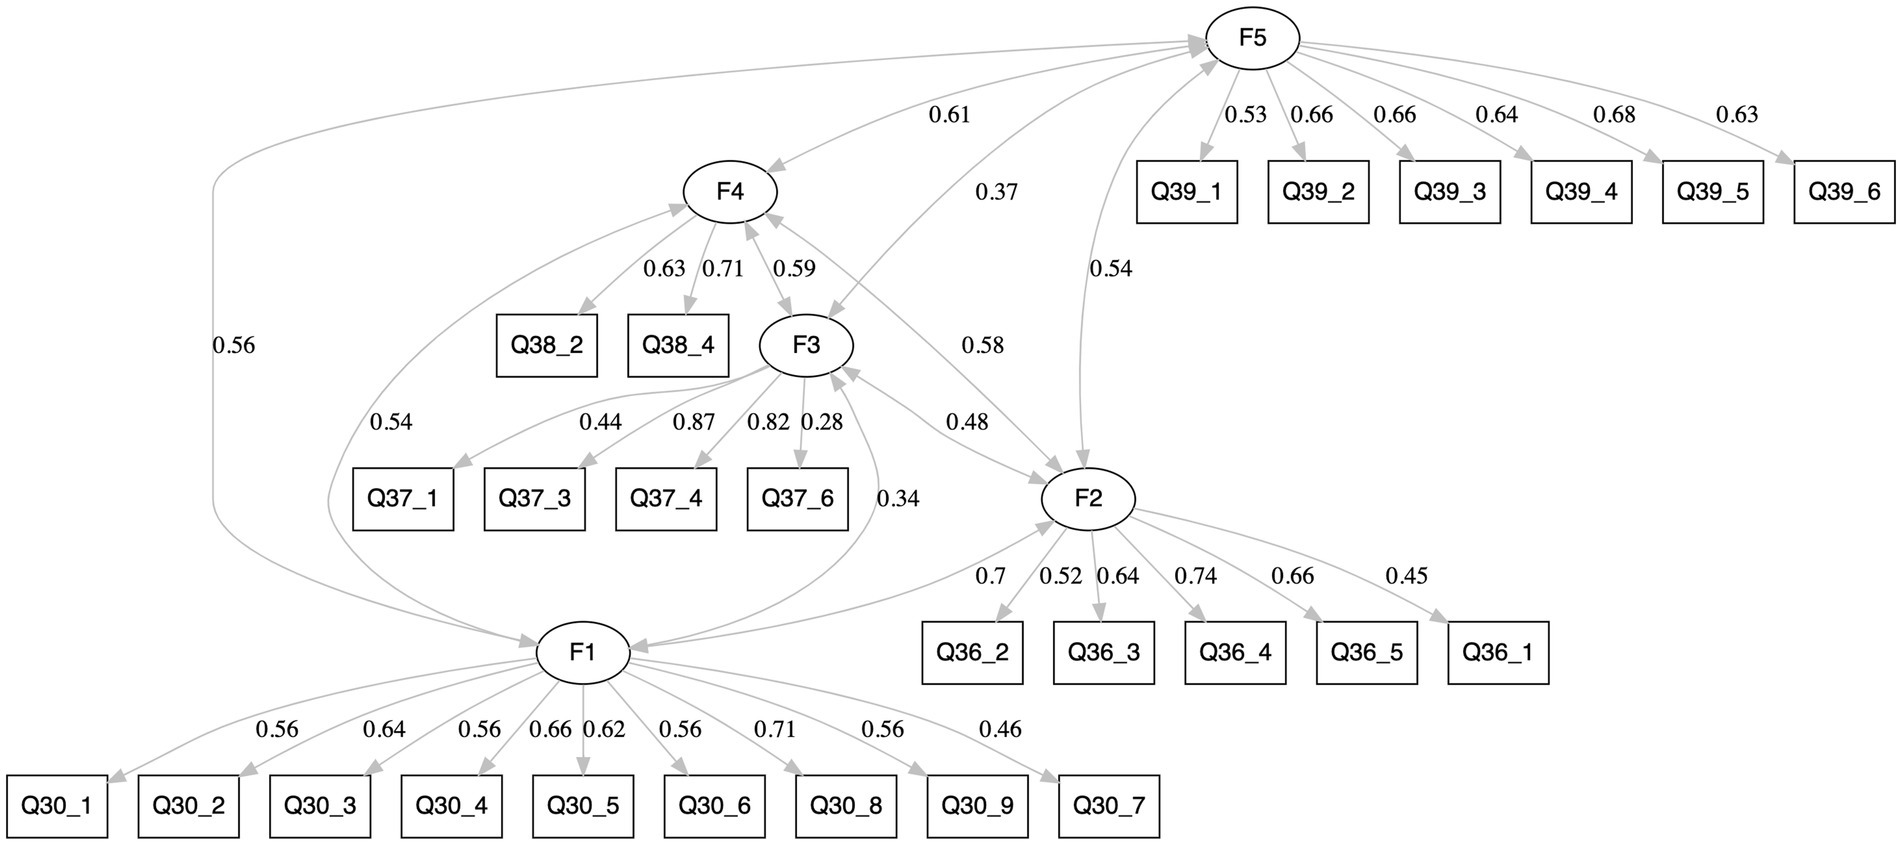
Figure 2. The HESF 5-factor model.
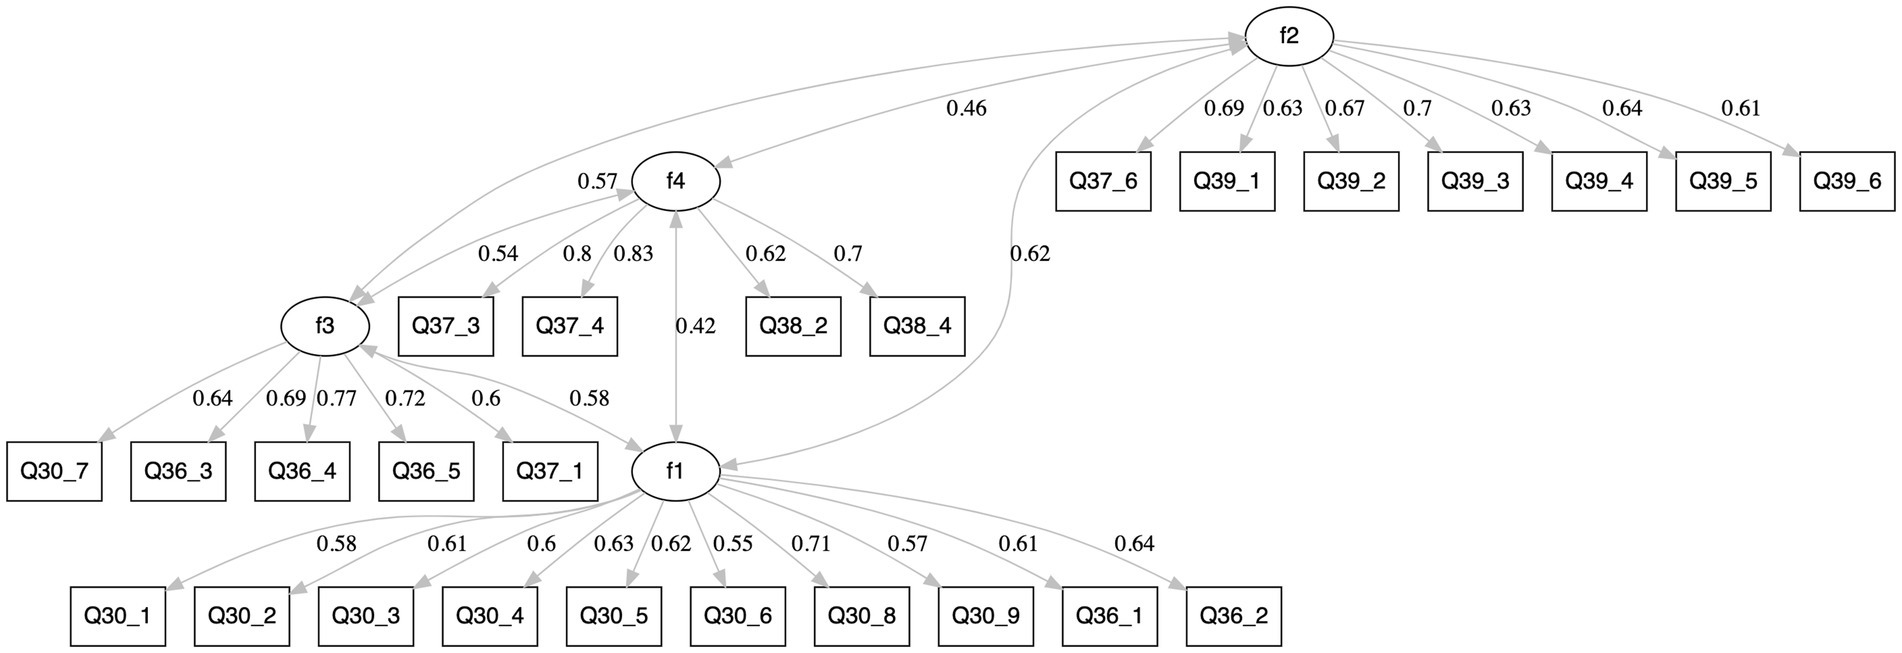
Figure 3. The HESF 4-factor model.
To investigate the models’ goodness of fit, a number of statistics were used: Overall chi-square χ2 (Hooper et al., 2008), RMSEA (Steiger, 1990; Hooper et al., 2008), CFI, TLI (Bentler, 1990), and SRMSR (Hooper et al., 2008). The goodness-of-fit indices, including CFI, TLI, RMSEA, RMSEA CI, and SRMR, were selected to assess model fit based on recommendations by Hu and Bentler (1999) and Schreiber et al. (2006), who suggest that TLI, CFI, and RMSEA should be reported in single-time analyses. In this study, we modified the HESF model and incorporated additional fit indices, such as the RMSEA confidence interval and SRMR, to provide a more comprehensive evaluation of the internal consistency and overall model fit.
Table 6 shows that the 4-factor model consistently outperforms the 5-factor model in fit indices. The 4-factor model’s CFI, TLI, and RMSEA values are closer to ideal fit values than those of the 5-factor model. The 4-factor model may be better suited to the data in this social science setting, as it balances model complexity with better-fit statistics across multiple indices. It is also more parsimonious and still effectively captures the latent constructs.
3.4 Model reliability, parsimony, and internal consistency
Cronbach’s alpha is a measure of internal consistency, and it is considered a measure of scale reliability. Hair et al. (2018) state that reliability can be assessed by the degree of internal consistency, which is determined by how highly interrelated the indicators are. Testing the internal consistency and parsimonious fit for the two models, the 4-factor model showed higher internal consistency for its factors compared to the 5-factor model (see Table 4). As a rule of thumb, we are looking for α > 0.70 at a minimum to consider the factor to be internally consistent, though it is better to have a value of α > 0.80. The 5-factor model does not pass good fit criteria with two factors, including health and wellbeing, and economic conditions factors with both having an α < 0.70.
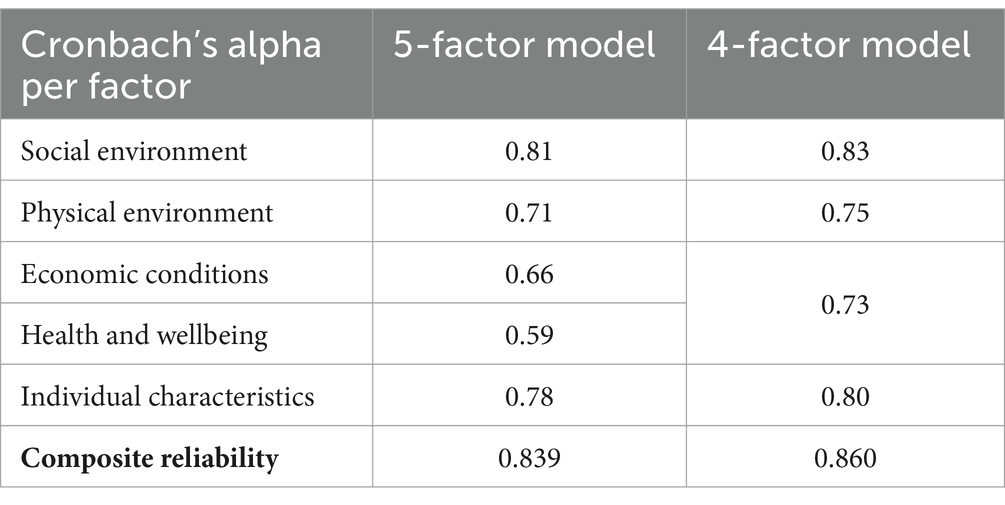
Table 4. Cronbach’s alpha and composite reliability comparison between 5-factor and 4-factor model.
To further assess the composite reliability of the 5-factor and 4-factor models, we employed the online composite reliability calculator (Colwell, 2016). The results indicated that the 4-factor model demonstrated a slightly higher composite reliability (CR = 0.860) compared to the 5-factor model (CR = 0.839) based on standardized factor loadings and error variances. According to Hair et al. (2018), a composite reliability higher than 0.70 is considered. Thus, both models exhibited strong reliability, with the 4-factor model showing a marginally higher CR than the 5-factor model.
Additionally, when examining the “Alpha if Item Dropped,” the 4-factor model maintains a higher Cronbach’s Alpha if any item is removed, suggesting greater robustness in comparison to the 5-factor model. In practice, “Alpha if Item Dropped” is a diagnostic tool used during the scale development or validation process. According to Tavakol and Dennick (2011), “Alpha if Item Dropped” is an important statistic in the context of reliability analysis, particularly when using Cronbach’s Alpha to assess the internal consistency of a scale or a set of survey items. This statistic helps researchers and practitioners to identify which items might be weakening the overall reliability of a scale. By removing such items, the scale can become more reliable, leading to more accurate and meaningful assessments of the underlying construct (Tavakol and Dennick, 2011).
3.5 Factor loadings and factor correlations
Table 7 summarizes the factor loadings for both the 5-factor model, and Table 8 summarizes the factor loadings for the 4-factor model. When looking at the factor loadings, both the 5-factor and 4-factor models exhibit strong loadings, which is promising. While both models mostly pass acceptable thresholds, the 4-factor model is slightly better suited to the data. It demonstrates strong and consistent loadings across all factors, indicating that each latent construct is well-represented by its observed variables. The model is also more parsimonious, avoiding the potential overfitting and redundancy observed in the 5-factor model.
• Five-factor model: the loadings in the 5-factor model range from 0.549 to 0.800, with similarly strong relationships between the observed variables and their respective factors.
• Four-factor model: the loadings in the four-factor model range from 0.551 to 0.827. This range indicates moderate to strong relationships between the observed variables and their respective latent factors. The loadings are consistently high across all factors.
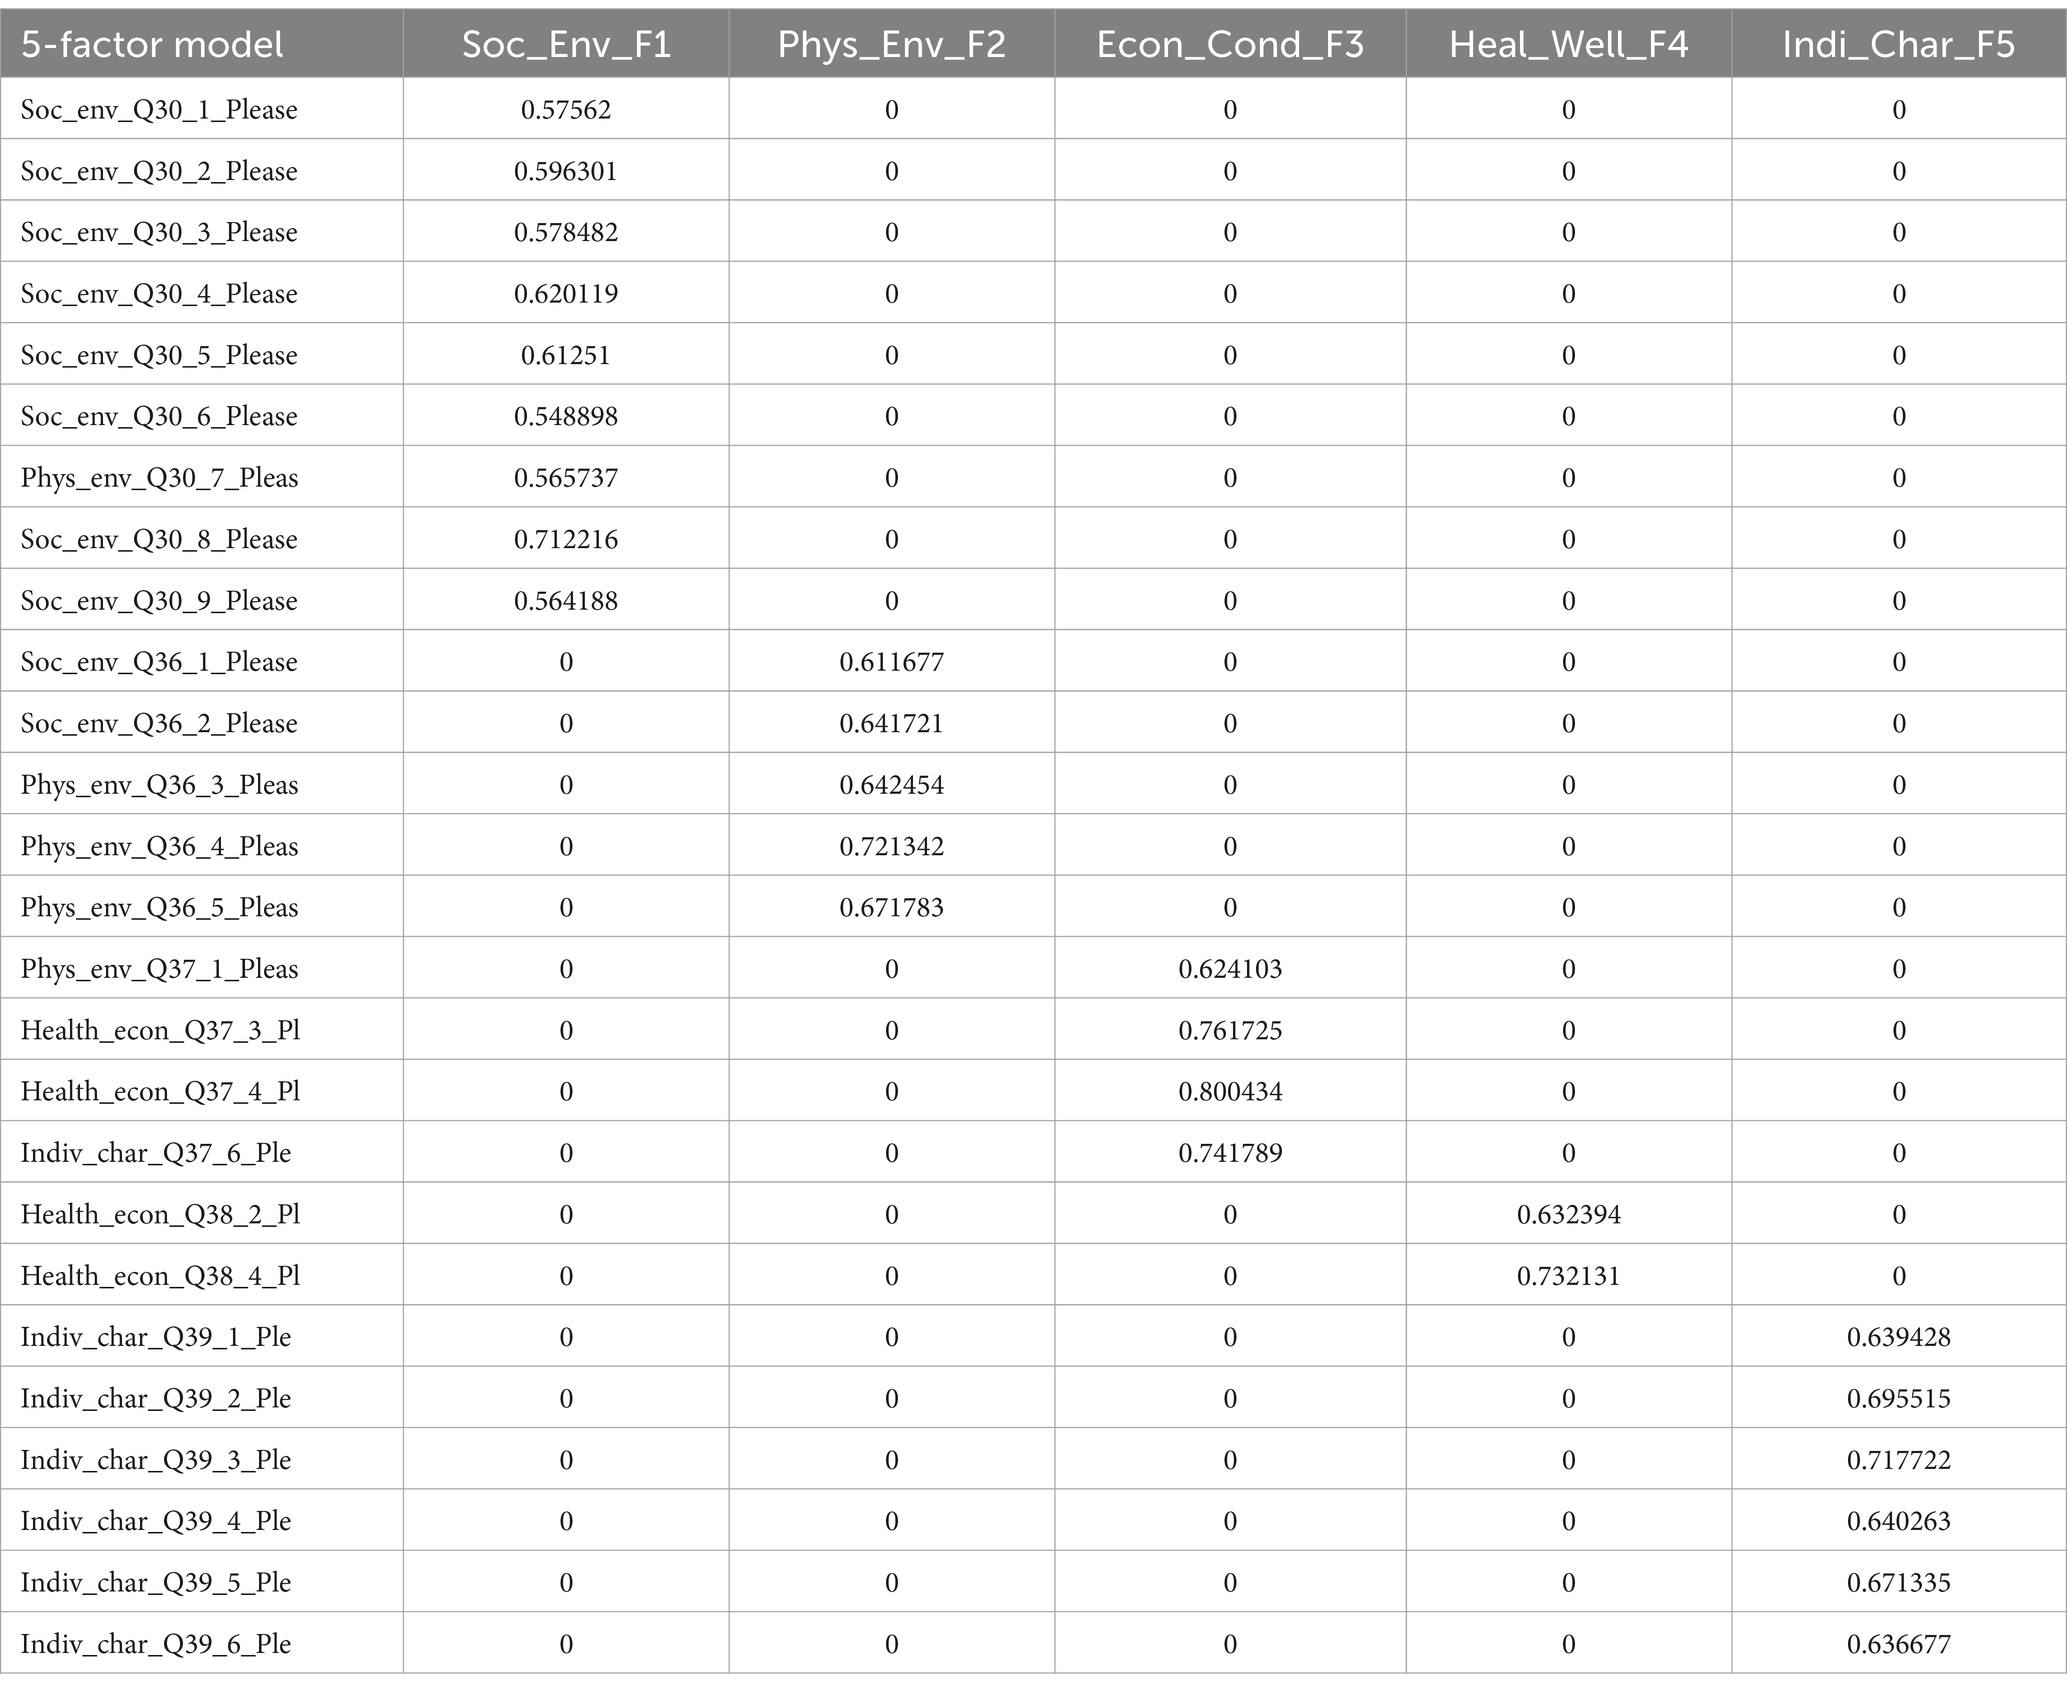
Table 7. The factor loadings for the 5-factor CFA model.

Table 8. The factor loadings for the 4-factor CFA model.
In addition to the fit indices of the two models, we also measured the parameters of the models—factor loadings. Roos and Bauldry (2022) state that “factor loadings are the main parameters of any CFA, as a factor loading is a correlation between the variable and the factor, the squared loading is the amount of the variable’s total variance accounted for by the factor” (Hair et al., 2018, p. 151). As a rule of thumb, loadings of ±0.50 or greater are considered practically significant. Loading above ±0.70 is considered as a sign of a well-defined structure and is the target for any factor analysis (Hair et al., 2018). Tables 7, 8 showed that factor loadings in both the 5-factor model and the 4-factor model are statistically significant with p-values of 0. Loading for most of the indicators is above 0.6, with six and four variables exhibiting loadings within the 0.5–0.6 range in the 5-factor model and the 4-factor model respectively, but neither model has any loadings below 0.5. Overall, both the models are strong and significant.
Once the number of indicators loading on each factor was confirmed, we further examined the correlations between the factors in the 5-factor and 4-factor models (see Tables 9, 10 below).
• Five-factor model: while the five-factor model shows higher correlations for certain factors, this may indicate issues of multicollinearity or redundancy. The model might also be overfitting, in which case, a simpler four-factor solution could suffice.
• Four-Factor model: the more consistent and moderate correlations in the four-factor model suggest that it may provide a more parsimonious and interpretable solution, especially if the goal is to maintain distinct but related latent constructs.
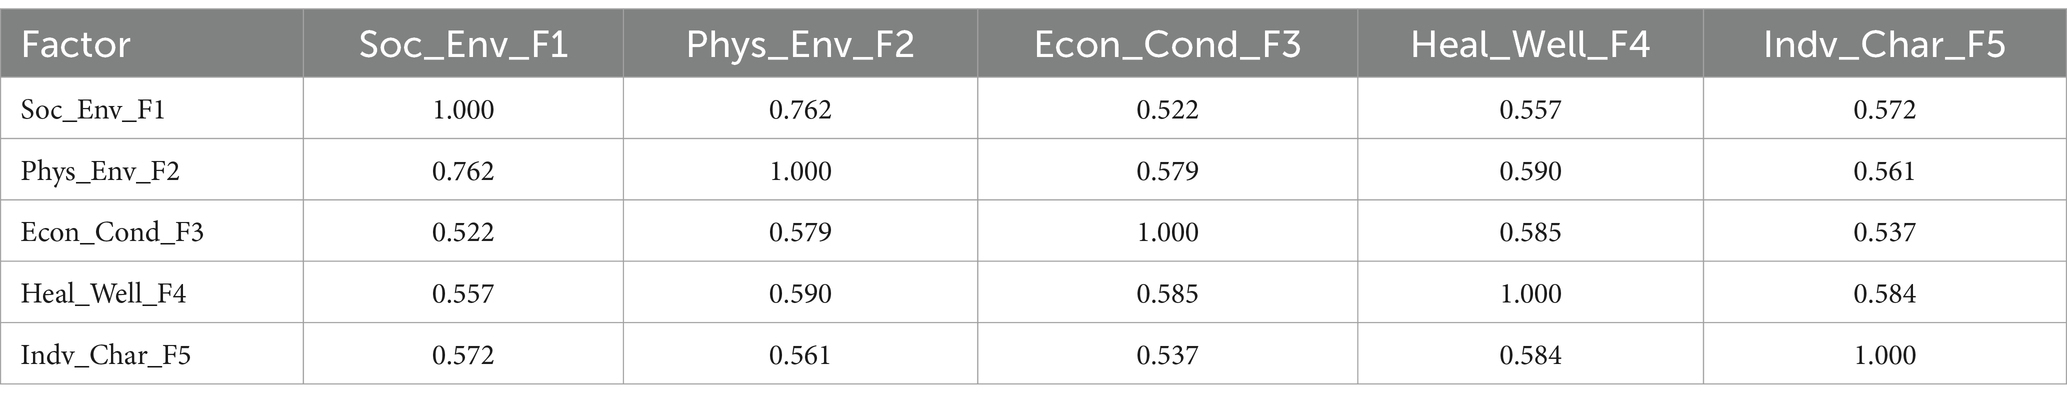
Table 9. Factor correlations in the 5-factor model.
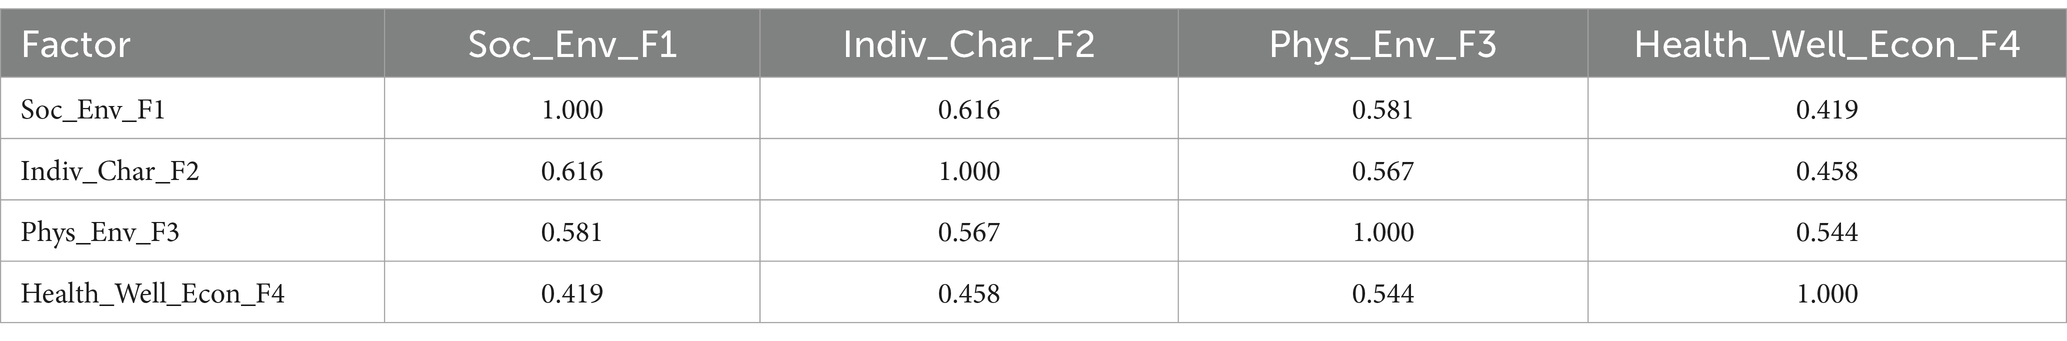
Table 10. Factor correlations in the 4-factor model.
Given the balance between parsimony, interpretability, and correlation strengths, the four-factor model might be more appropriate unless the theoretical justification for a five-factor model is robust. This decision should also consider the specific research questions and the underlying theory guiding the factor analysis.
3.6 Covariances, correlations, and Oblimin rotations
Covariance is a measure of linear association between two variables and is used in qualitative and quantitative studies to analyse the relationship between variables, meanwhile, correlation quantifies the strength of the relationship (Lai, 2020; Van Ingelgom and Versailles, 2021). As the factorial correlations examined the strength of the relationships between the latent variables in the two models reported above, we detail the covariance analysis in which we evaluated the relationships between 26 observed variables. As Abdullah et al. (2014) and Jay et al. (2011) state, when multiple factors are present in the model, it is imperative to elucidate the covariances among them. In addition, Oblique rotations such as the Oblimin method were utilized to allow correlations between the factors to exist. Nguyen and Waller (2023) explained that Oblimin rotations are a type of factor rotation used in factor analysis to permit factors to be correlated, thus providing an accurate representation of the underlying data structure. The factorial correlation of the 5-factor (Figure 4) and 4-factor (Figure 5) models reveals that the factors are not entirely orthogonal. This observation aligns with the selection of Oblimin rotation, as previously delineated in the methodology. Figure 6 below highlights specific correlations among the 26 observed variables.
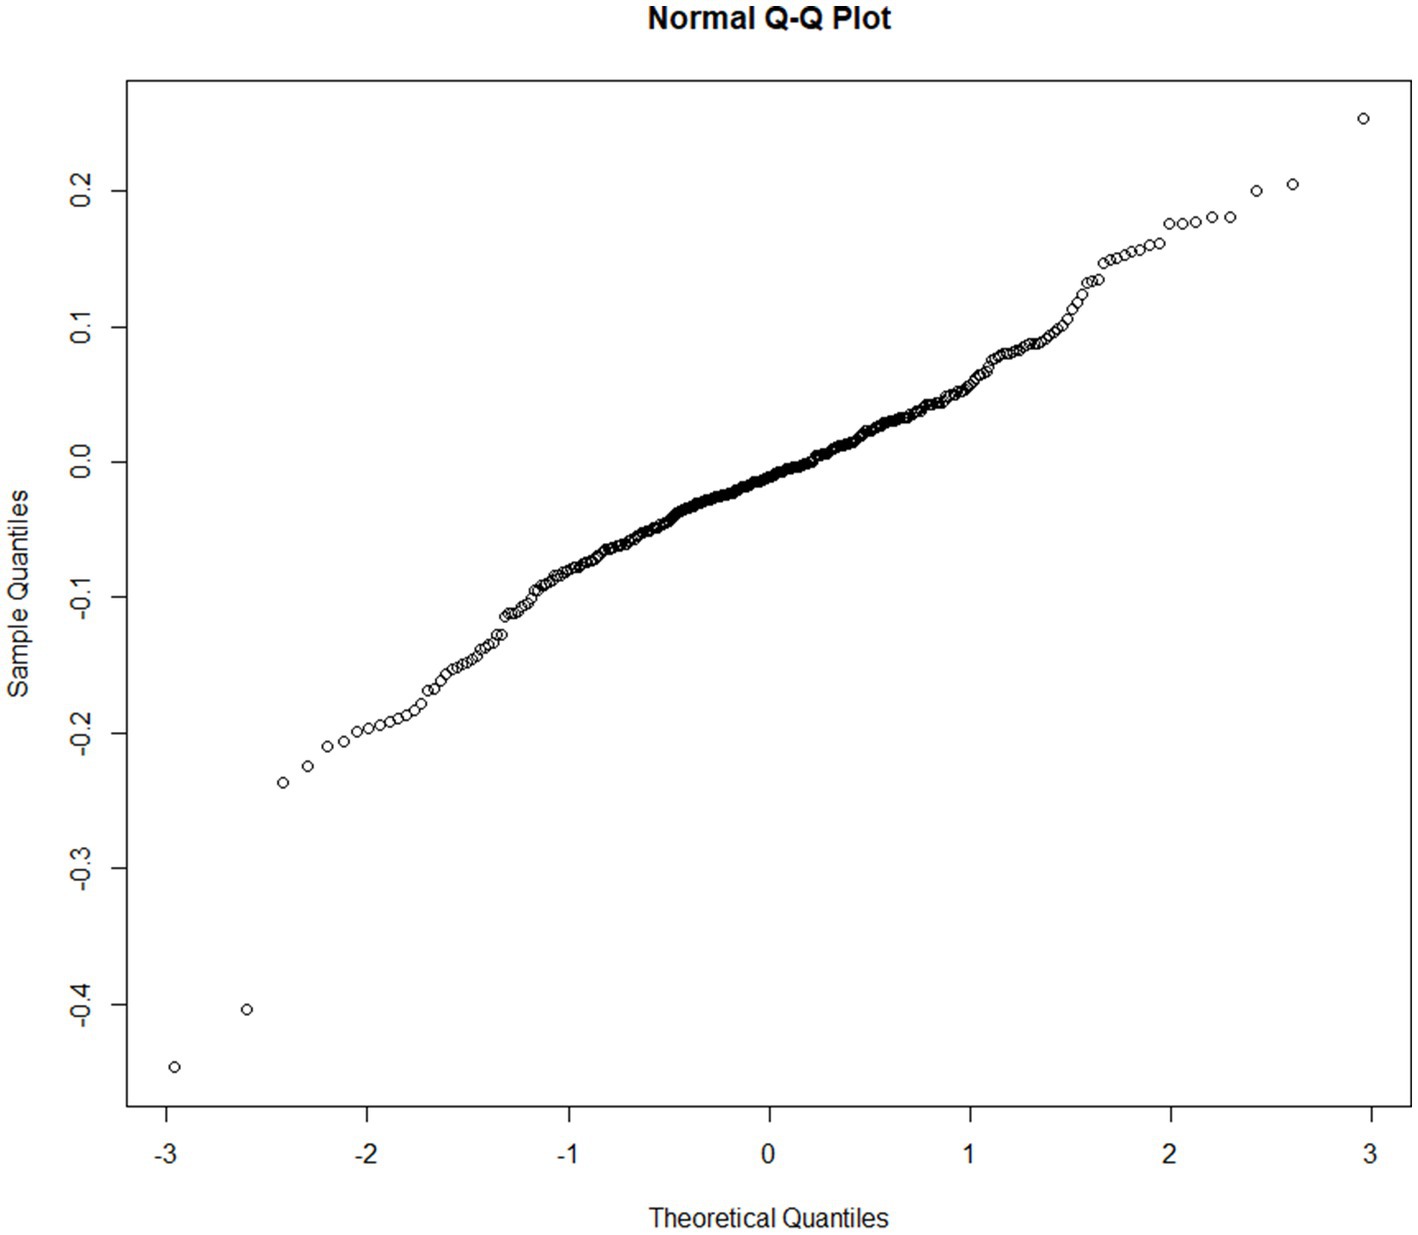
Figure 4. Q-Q plot from the 5-factor model.
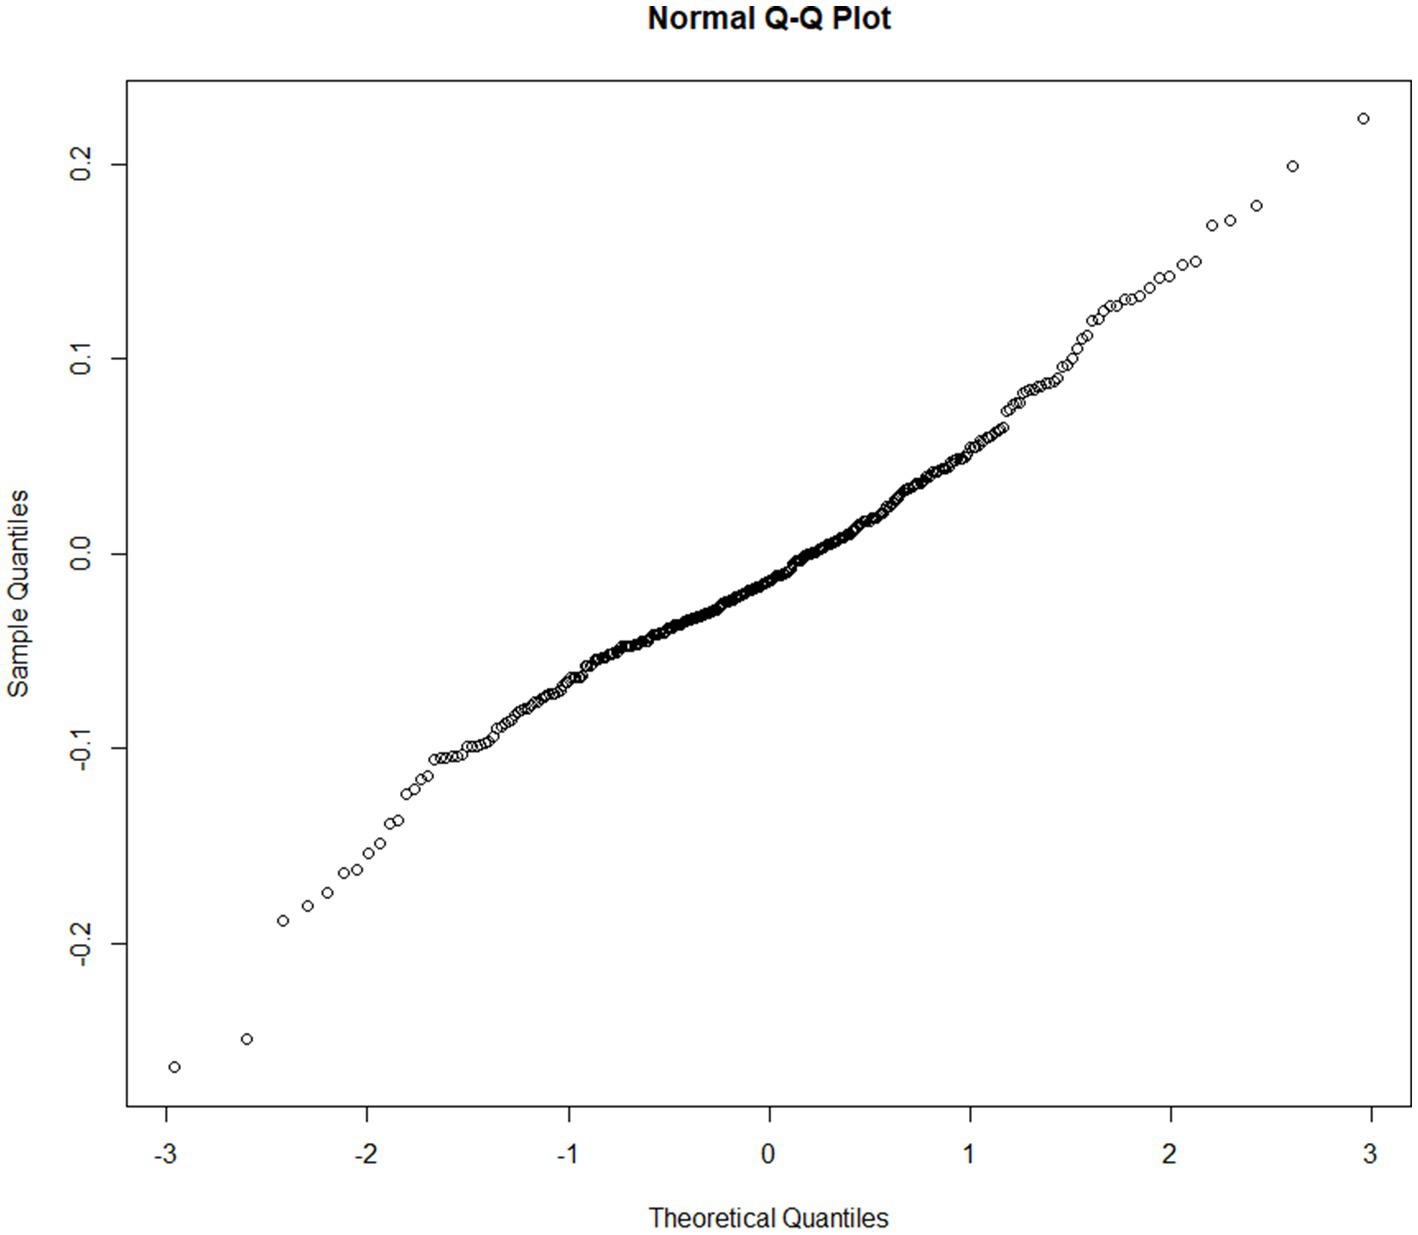
Figure 5. Q-Q plot from the 4-factor model.
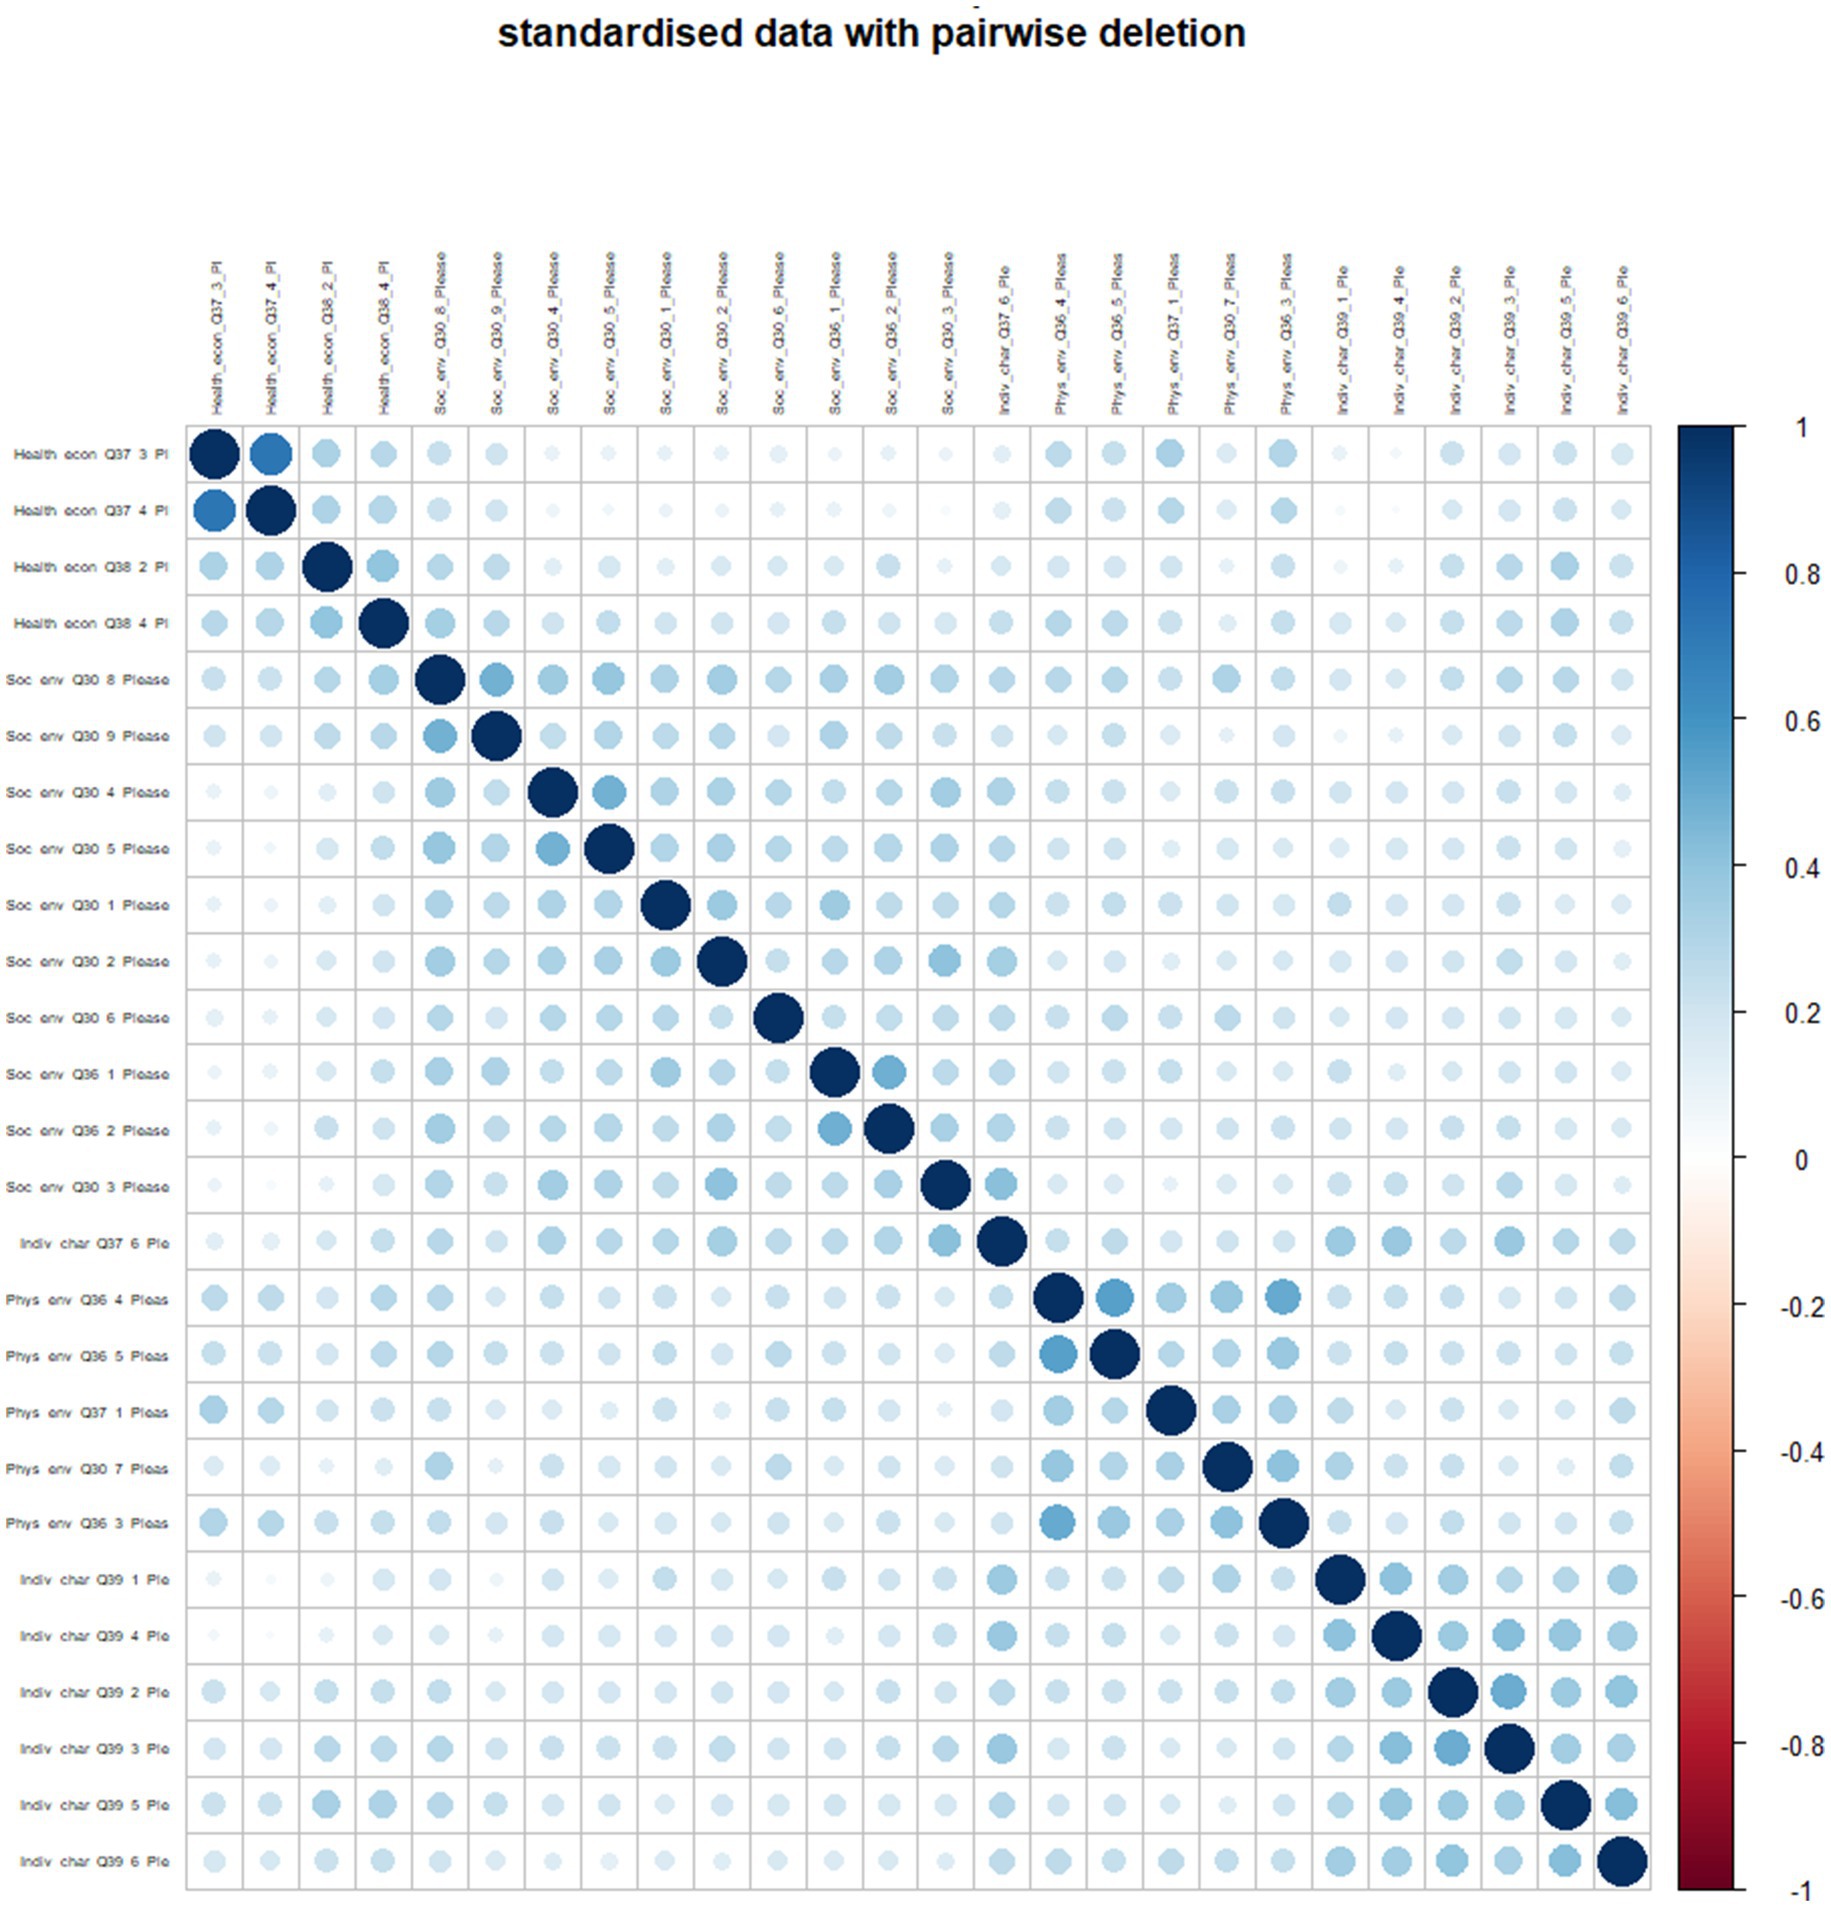
Figure 6. Spearman correlation matrix.
Within both models, each item showcases significant factor loadings [P(>|z|) = 0.000], indicating their pivotal role as markers of the underlying latent factors. Both models also exhibit no cross-loadings within 0.05 of each other, indicating both models meet good model fit criteria on this measure. Therefore, this significance suggests that the items on the scale are closely tied to the latent constructs, reinforcing the validity of the scale’s construction (Jackman, 2005; Jordan and Spiess, 2019). Covariance Analysis in both the 5-factor and the 4-factor model showed that the covariances in this model are all statistically significant at p < 0.05. The magnitude and significance of these covariances [P(>|z|) = 0.000] underscore their roles as interrelated, yet distinct, constructs.
Schreiber et al. (2006) suggested that in reporting structural equation modeling and CFA, the residuals should also be examined as another indicator of model fit. In this study, we investigated the figure residuals for both models. We found that the model residuals from the 5-factor model are reasonably close to normal distribution (see Figure 4), indicating an acceptable to good fit for the data. Similarly, the figure residual from the 4-factor model (see Figure 5) suggests that the model residuals are approximately normally distributed, indicating a very good model fit for the data. When comparing the two models based on the Q-Q plots, the 4-factor model appears to provide a slightly better fit for residual normality without any severe outliers than the 5-factor model.
4 Discussion
This study aimed to validate the structural validity of the proposed HESF model for multidimensional social determinants of higher education, applicable to both Indigenous and non-Indigenous students graduating from an Australian university. In evaluating the two models—the 5-factor model and the 4-factor model, the structural validity of the 5-factor model was validated. Also, we confirmed the validity of the more parsimonious and better fitting 4-factor model. Confirming the HESF model/s allowed us to address the key research question guiding this paper. In this section, we discuss the main multidimensional factors influencing Australian students’ university degree completion and the comparison between the HESF 5-factor and 4-factor models to determine the superior model.
4.1 The main multidimensional factors influence Australian students’ university degree completion
The HESF 5-factor model examined the factors of social environment, physical environment, economic conditions, health and wellbeing, and individual characteristics. Validating the 5-factor model determined the multidimensional factors that influenced Australian students’ university degree completion. Utilizing the HESF 5-factor model allowed us to measure the impact of the social determinants mentioned on Australian students’ completion. The descriptive statistics on the means of the observed items (see Table 3)—the questions we asked Australian graduates in the survey about their level of agreement on the impact of the social determinants on their completion wrapped around the “agree” level (ranging between 1.74 and 2.65), indicating that the social determinants in higher education influenced their completion. However, the standard deviations of the mean (see Table 3) were quite high (range between 0.81 and 1.18), suggesting that graduates’ level of agreement in the dataset was spread out around the “agree” level. This range of standard deviation shows a moderate level of variability in the data around the mean. To understand at what level or if there were differences in the level of impact between groups of participants such as gender, Indigenous and non-Indigenous status, level of education, or study mode requires further analysis for exploring group differences.
Our results in validating the HESF 5-factor model reinforced Pham et al. (2024) findings in exploring factors influencing Indigenous Australian completion rates. While Pham et al. (2024) reported the three most impactful factors on Indigenous graduates from the Indigenous students’ perspective, our findings extend the scope of the participants covered in this study to include the overall Australian university (i.e., Indigenous and non-Indigenous graduates). Evaluating from the internal factors such as individual characteristics (i.e., personal attributes, including motivation, resilience, diligence, confidence, engagement, and a desire for academic success), health and wellbeing (i.e., mental and physical health), to the external factors such as economic conditions (i.e., financial resources available to support educational outcomes), physical environment (i.e., living situations, institutional facilities and resources, safe communities), and social environment (i.e., broad educational values, policies, and practices within an institution, and institutional support networks/units), our validated HESF 5-factor model provides a valid and valuable tool for university leaders and researchers who are interested to investigate the impact of social determinants on students’ completion, student success at their institution.
Beyond identifying the factors influencing student success, this study highlights key policy implications for improving student success by equipping university leaders with a practical tool to assess their institution’s effectiveness. By adopting the HESF model, policymakers and administrators can implement data-driven strategies to enhance student retention and completion rates. This includes developing targeted support programs, optimizing resource allocation, and strengthening equity-focused policies that address barriers to success. Integrating these insights into institutional decision-making ensures more inclusive, student-centered policies, ultimately fostering a higher education system that better supports diverse student populations.
Prior studies (i.e., O’Sullivan et al., 2019; Gao et al., 2021; Patfield et al., 2022) have noted the importance of identifying the social determinants of different groups of participants for cross-comparison purposes, including domestic and international students (Koenings et al., 2020), low socio-economically disadvantaged students (Gao, 2018; O’Sullivan et al., 2019), further analysis using our validated HESF models would provide a tool to apply in their context, enabling the measurement of the influences of social determinants in higher education. Throughout the result section, we provided the CFA results for both the 5-factor model and the 4-factor model. We will then discuss the model comparison to determine the superior model to apply for further analysis and future research.
4.2 Model comparison
Given the provided evaluation criteria and statistics from the CFA approach, results indicate that both the 5-factor and 4-factor models exhibit significant factor loadings (see Tables 7, 8). They both have good to very good factor reliabilities (see Table 3). When looking at the fit indices, the 4-factor model consistently outperformed the 5-factor model (see Table 6). For instance, the CFI, TLI, and RMSEA values for the 4-factor model were closer to ideal fit values than the 5-factor model but not by much, meaning either model could work depending on the literature in the field and the other measures of robustness (internal consistency, number of variables, number of factors, model parsimony, logical concept coherence etc.). The SRMR also indicates a better fit for the 4-factor model.
Whether applying the HESF 5-factor or 4-factor model to further analysis would depend on various criteria, if fit indices such as CFI, TLI, RMSEA, and SRMR are prioritized, then the 4-factor model offers a good balance, especially when considering RMSEA and SRMR. Moreover, when looking at Cronbach’s alpha at the factor level, and the composite reliability between the two models to evaluate the internal consistency of the factors, the 4-factor has the better internal consistency (see Table 5). Another potential indication to consider the 4-factor model for further analysis emerged when we applied the Kaiser method to determine the number of factors. This method involves taking the number of eigenvalues in the correlation matrix >1. Based on our data, applying a Spearman correlation and pair-wise deletion to handle missing values suggested extracting 4 factors. Succinctly, the HESF 4-factor consistently outperforms the 5-factor model as per the outputs from the sections above.
5 Conclusion
This article aimed to validate the reliabilities and validity of the construct—the higher education success factor (HESF) model. The CFA approach was employed to analyse the internal consistency (Cronbach’s alpha), the model parsimonious fit showed that the 4-factor model exhibited higher internal consistency for its factors compared to the 5-factor model. We handled the missing data by applying Spearman correlations with pair-wire deletion to maximize the number of variables included in the analysis. We performed KMO analysis and Bartlett’s test of sphericity to ensure the data were suitable for factor analysis, and the results from the factor loadings, factor correlations, covariances, item correlations, and Oblimin rotations, along with the model outputs, confirmed and validated the HESF models. From the evaluation perspective, we compared the 5-factor and 4-factor models. We determined that both models exhibited strong and significant factor loadings, good fit measures, and reliable for future research in applying our HESF models in measuring the impacts of social determinants on students’ completion.
The validation of both HESF model structures provides higher education institutions with reliable frameworks for understanding and measuring the impact of social determinants on student completion. Whether the 5-factor model or the 4-factor model should be selected for further analysis and/or future research depending on the researchers’ aims and purposes, theoretical considerations and interpretability of the factors. These findings have significant implications for evidence-based policy development in the higher education sector. Institutions can confidently utilize either 5-factor model or 4-factor model structure to inform strategic planning, resource allocation, and the development of targeted support initiatives. The validated HESF models offer policymakers and institutional leaders a systematic approach to identifying and addressing social barriers to completion, ultimately contributing to more equitable and effective student support practices. Our HESF models enable institutions to make data-driven decisions in developing and implementing policies that enhance student success outcomes.
Overall, this study provides strong evidence for not only one but two valid models of HESF that can be applied in Australian higher education. We recommend that Australian universities evaluate their systems to identify the areas of weaknesses, identify where the students need their support the most, and develop strategies to support their students and improve the completion rates of Australian university students. Utilizing the HESF models may assist Australian universities in achieving these goals.
A notable limitation of this study is the use of a convenience sample that included only students who completed university degrees, potentially introducing selection bias as they do not account for the experiences and challenges faced by non-completers. By focusing exclusively on completions and excluding those who dropped out, our findings may not capture the full range of student experiences and outcomes, potentially skewed understanding of student success, limiting the generalizability of the results. This selective sampling approach likely presents an incomplete picture and may overestimate positive outcomes, as students who faced significant challenges or had negative experiences are systematically missing from our analysis.
Another limitation of this study lies in the scope of factors examined. The social determinants of higher education model focus on a set of factors, including individual characteristics, health and wellbeing, economic conditions, physical environment, and social environment. We acknowledge that cultural capital—particularly in its objectified form—can also shape students’ educational trajectories. A more comprehensive analysis of cultural capital’s influence would be critical but require a distinct analytical framework and additional data. Future research should explore its effects in great depth to better understand its role in student success.
Future research should aim to include both degree-completion and non-completion students to provide more comprehensive insights into student experiences and the university’s effectiveness in supporting students to succeed. Furthermore, since our study focused exclusively on Australian graduates who completed their university degrees between 2018 and 2022, future research could enhance the validity of the HESF model by incorporating longitudinal data and/or including cross-cultural student populations in Australia. This would provide a more comprehensive understanding and further enrich the study’s contribution.
Data availability statement
The datasets presented in this article are not readily available because permission was not sought to share the datasets which were used and/or analysed during the current study beyond the research team as per ethics approval. Requests to access the datasets should be directed to PA, cC5hbmRlcnNvbjRAZ3JpZmZpdGguZWR1LmF1.
Author contributions
TP: Conceptualization, Data curation, Formal analysis, Investigation, Methodology, Project administration, Software, Supervision, Validation, Writing – original draft, Writing – review & editing. AB: Writing – original draft, Writing – review & editing. CX: Conceptualization, Investigation, Writing – original draft, Writing – review & editing. LB: Conceptualization, Investigation, Methodology, Project administration, Supervision, Validation, Writing – original draft, Writing – review & editing. PA: Conceptualization, Investigation, Methodology, Supervision, Validation, Funding acquisition, Writing – original draft, Writing – review & editing. RC: Data curation, Software, Writing – original draft, Writing – review & editing.
Funding
The author(s) declare that financial support was received for the research and/or publication of this article. This research project was funded by the Australian Research Council (ARC)’s special research initiative (SRI) 120100005 through the National Indigenous Research and Knowledge’s Network (NIRAKN).
Acknowledgments
We would also thank Derrick Ung, a Data Linkage Analyst from the RIDL for cross-checked data analysis for this paper.
Conflict of interest
The authors declare that the research was conducted in the absence of any commercial or financial relationships that could be construed as a potential conflict of interest.
Generative AI statement
The authors declare that no Gen AI was used in the creation of this manuscript.
Publisher’s note
All claims expressed in this article are solely those of the authors and do not necessarily represent those of their affiliated organizations, or those of the publisher, the editors and the reviewers. Any product that may be evaluated in this article, or claim that may be made by its manufacturer, is not guaranteed or endorsed by the publisher.
References
Abdullah, A., Hedayati Marzbali, M., Woolley, H., Bahauddin, A., and Maliki, N. Z. (2014). Testing for individual factors for the fear of crime using a multiple indicator-multiple cause model. Eur. J. Crim. Policy Res. 20, 1–22. doi: 10.1007/S10610-013-9208-4
Bentler, P. M. (1990). Comparative fit indexes in structural models. Psychol. Bull. 107, 238–246. doi: 10.1037/0033-2909.107.2.238
Behrendt, L., Larkin, S., Griew, R., and Kelly, P. (2012). Review of higher education access and outcomes for Aboriginal and Torres Strait Islander people (1922125253) : Department of Industry, Innovation, Science, Research and Tertiary Education (Australia). Available at: https://apo.org.au/node/31135
Bishara, A. J., and Hittner, J. B. (2012). Testing the significance of a correlation with nonnormal data: comparison of Pearson, spearman, transformation, and resampling approaches. Psychol. Methods 17, 399–417. doi: 10.1037/a0028087
Colwell, S. R. (2016). The composite reliability calculator User’s guide. Tech. Rep. doi: 10.13140/RG.2.1.4298.0888
Devlin, M. (2009). Indigenous higher Education student equity: Focusing on what works. Australian Journal of Indigenous Education 38, 1–8. doi: 10.1375/S1326011100000533
DiStefano, C., and Hess, B. (2005). Using confirmatory factor analysis for construct validation: an empirical review. J. Psychoeduc. Assess. 23, 225–241. doi: 10.1177/073428290502300303
Gao, F. (2018). Do heterophilous networks work? Investigating school-based social capital and the university choice process among less-privileged ethnic minorities in Hong Kong. Race Ethnicity and Education 21, 827–842. doi: 10.1080/13613324.2017.1395329
Gao, F., Ng, J. C. K., and Lee, W. W. S. (2021). Are the effects always positive? Rethinking the role of parental social capital in the university choice process. International Studies in Sociology of Education 1-23. doi: 10.1080/09620214.2021.1886596
Hair, J. F., Babin, B. J., and Anderson, R. E. (2018). Multivariate Data Analysis. 8th Edn. Boston, MA: Cengage.
Hair, J. F., Black, W. C., Babin, B. J., Anderson, R. E., and Tatham, R. L. (2006). Multivariate Data Analysis. 6th Edn. New York, NY: Pearson Education.
Han, H. (2022). The effectiveness of weighted least squares means and variance adjusted based fit indices in assessing local dependence of the Rasch model: comparison with principal component analysis of residuals. PLoS One 17:e0271992. doi: 10.1371/journal.pone.0271992
Hemsley-Brown, J., and Oplatka, I. (2015). University choice: what do we know, what don’t we know and what do we still need to find out? Int. J. Educ. Manag. 29, 254–274. doi: 10.1108/ijem-10-2013-0150/full/html
Hooper, D., Coughlan, J., and Mullen, M. (2008). Structural equation modelling: guidelines for determining model fit. Electron. J. Bus. Res. Methods 6, 53–60.
Hu, L. T., and Bentler, P. M. (1999). Cutoff Criteria for Fit Indexes in Covariance Structure Analysis: Conventional Criteria versus New Alternatives. Structural Equation Modeling 6, 1–55. doi: 10.1080/10705519909540118
James, R. (2000). Non-traditional students in Australian higher education: Persistent inequities and the new ideology of ‘student choice’. Tertiary Education and Management 6, 105–118. doi: 10.1080/13583883.2000.9967016
Jay, E., Duvaut, P., Darolles, S., and Chrétien, A. (2011). Multifactor models. IEEE Signal Process. Mag. 28, 37–48. doi: 10.1109/MSP.2011.941550
Jordan, P., and Spiess, M. (2019). Rethinking the interpretation of item discrimination and factor loadings. Educ. Psychol. Meas. 79, 1103–1132. doi: 10.1177/0013164419843164
Kaiser, H. F. (1974). An index of factorial simplicity. Psychometrika 39, 31–36. doi: 10.1007/BF02291575
Koenings, F., Di Meo, G., and Uebelmesser, S. (2020). University rankings as information source: Do they play a different role for domestic and international students? Applied Economics 52, 6432–6447. doi: 10.1080/00036846.2020.1795075
Koshy, P., Dockery, A. M., and Seymour, R. (2019). Parental expectations for young people’s participation in higher education in Australia. Studies in Higher Education 44, 302–317. doi: 10.1080/03075079.2017.1363730
Krause, K. -L., and Armitage, L. (2014). Australian student engagement, belonging, retention and success: A synthesis of the literature. The Higher Education Academy 2014, 1–45.
Lai, Y. (2020). Application of covariance matrices in financial portfolio. Acad. J. Bus. Manage. 2, 46–52. doi: 10.25236/AJBM.2020.020807
Le, T. D., Dobele, A. R., and Robinson, L. J. (2019). Information sought by prospective students from social media electronic word-of-mouth during the university choice process. J. High. Educ. Policy Manag. 41, 18–34. doi: 10.1080/1360080X.2018.1538595
Marmot, M., Wilkinson, R. G., and Bartley, M. (2005). Social determinants of health. (Second edition). Oxford University Press.
Marsh, H. W. (1998). Pairwise deletion for missing data in structural equation models: nonpositive definite matrices, parameter estimates, goodness of fit, and adjusted sample sizes. Struct. Equ. Model. Multidiscip. J. 5, 22–36.
McKenzie, K., and Schweitzer, R. (2001). Who succeeds at university? Factors predicting academic performance in first-year Australian university students. Higher Education Research & Development 20, 21–33. doi: 10.1080/07924360120043621
Nguyen, H. V., and Waller, N. G. (2023). Local minima and factor rotations in exploratory factor analysis. Psychol. Methods 28, 1122–1141. doi: 10.1037/met0000467
O’Sullivan, K., Robson, J., and Winters, N. (2019). ‘I feel like I have a disadvantage’: How socio-economically disadvantaged students make the decision to study at a prestigious university. Studies in Higher Education 44, 1676–1690. doi: 10.1080/03075079.2018.1460591
Patfield, S., Gore, J., Fray, L., and Gruppetta, M. (2022). The untold story of middle-class Indigenous Australian school students who aspire to university. Critical Studies in Education 63, 80–95. doi: 10.1080/17508487.2019.1572022
Pham, T. D. X., Blue, L. E., Baeza, A., Anderson, P. J., Xing, C., and Saward, M. (2024). Higher Education Success Factor Model: A Means to Explore Factors Influencing Indigenous Australian Completion Rates. Student Success 16, 1–15. doi: 10.5204/ssj.3154
Sammen, H. C. (2017). A Social Determinants of Education Framework [Masters Thesis]: University of Colorado. Available at: https://digital.auraria.edu/work/ns/628b950e-5047-4d1a-9a3f-06a9838f2eca.
Schreiber, J. B., Nora, A., Stage, F. K., Barlow, E. A., and King, J. (2006). Reporting structural equation modeling and confirmatory factor analysis results: a review. J. Educ. Res. 99, 323–338. doi: 10.3200/JOER.99.6.323-338
Shrestha, N. (2021). Factor analysis as a tool for survey analysis. Am. J. Appl. Math. Stat. 9, 4–11. doi: 10.12691/ajams-9-1-2
Simpson, A., and Ferguson, K. (2012). Mental health and higher education counselling services: Responding to shifting student needs. Journal of the Australia and New Zealand Student Services Association. 20, 1–8. Available at: https://janzssa.scholasticahq.com/article/91880
Sojkin, B., Bartkowiak, P., and Skuza, A. (2012). Determinants of higher education choices and student satisfaction: the case of Poland. High. Educ. 63, 565–581. doi: 10.1007/s10734-011-9459-2
Statistical Solutions (2013). Understanding statistical assumptions and tests. Statistical Solutions. Available at: https://www.statisticalsolutions.com (Accessed November 6, 2024).
Steiger, J. H. (1990). Structural model evaluation and modification: an interval estimation approach. Multivariate Behav. Res. 25, 173–180. doi: 10.1207/s15327906mbr2502_4
Tavakol, M., and Dennick, R. (2011). Making sense of Cronbach’s alpha. International Journal of Medical Education 2, 53–55. Available at: https://www.ncbi.nlm.nih.gov/pmc/articles/PMC4205511/
Van Ingelgom, V., and Versailles, A. (2021). Covariance. A first step in the analysis of the relationship between two variables. In: Jean-Frederic Morin, Christian Olsson, and Atikcan, E. Ö. (eds.) Research Methods in the Social Sciences: An A-Z of key concepts. Great Britain: Oxford University Press. 67–69.
Keywords: confirmatory factor analysis, higher education success factor model, HESF model, higher education, social determinants, students’ completion, student success
Citation: Pham TD, Baeza Penã A, Xing C, Blue LE, Anderson PJ and Chappell R (2025) Measuring social determinants influencing Australian university students’ completion: confirmatory factor analysis. Front. Educ. 10:1568521. doi: 10.3389/feduc.2025.1568521
Edited by:
Paitoon Pimdee, King Mongkut’s Institute of Technology Ladkrabang, ThailandReviewed by:
Gregor Ross Maxwell, UiT The Arctic University of Norway, NorwayEduardo Hernández-Padilla, Autonomous University of the State of Morelos, Mexico
Copyright © 2025 Pham, Baeza Penã, Xing, Blue, Anderson and Chappell. This is an open-access article distributed under the terms of the Creative Commons Attribution License (CC BY). The use, distribution or reproduction in other forums is permitted, provided the original author(s) and the copyright owner(s) are credited and that the original publication in this journal is cited, in accordance with accepted academic practice. No use, distribution or reproduction is permitted which does not comply with these terms.
*Correspondence: Thu D. Pham, dGh1LnBoYW1AZ3JpZmZpdGguZWR1LmF1
†ORCID: Thu D Pham, orcid.org/0000-0003-4661-8749
Angela Baeza Pena, orcid.org/0000-0002-7179-7980
Congcong Xing, orcid.org/0000-0003-1176-1756
Levon E Blue, orcid.org/0000-0001-9046-7832
Peter J Anderson, orcid.org/0000-0003-2491-4205
Rhetta Chappel, orcid.org/0009-0000-8053-8633