 Maria Teresa Costado
- Departamento de Didáctica, Universidad de Cádiz, Puerto Real, Spain
Assessing the learning process of students is not easy, as it is difficult to verify that their learning is adequate. In this research, several individual tests are carried out to assess in a continuous, controlled, formative and summative way whether the learning process of mathematical knowledge is effective, as well as to complete this assessment with concise and individualized feedback. The more than 300 participants are students of the Primary Education Degree from four generations and two mathematical knowledge subjects. The results show that the first three generations show an average level of initial mathematical knowledge compared to the fourth control generation, increasing to an intermediate or high success rate in the intermediate tests that form part of the continuous assessment. Likewise, the final tests reflect a high cumulative performance rate, around 90%, considering this as a commitment of the student to his or her own educative process. In conclusion, the fourth generation, the control group where this controlled evaluation process has not been carried out, obtains worse academic results.
1 Introduction
The students who enter university come mostly from a traditional teaching methodology, in which the teacher expounds ideas, and the students are passive agents in their learning. The goal is to change this traditional model of student passivity to one in which there is greater commitment by students and whose assessment is practical, coherent and simple, as has been called for Martínez Muñoz et al. (2012). Students should undertake autonomous work of comprehension, selection and relate new information with what they already know to develop self-regulated, constructive and collaborative learning, minimizing imitation (de Dios Alija, 2020). Both students and teachers should know the prior knowledge of the students, and their weaknesses and strengths when beginning and during their education, to look for the possible causes of their shortcomings and the ways to deal with them, directing efforts toward the improvement of the learning process (Parmigiani et al., 2024).
Student engagement can be understood as the active and meaningful participation of the student in his or her learning process. This effort goes beyond simply attending class or completing assignments. It involves an emotional and cognitive connection to the study material, to peers and to the teacher. An engaged learner seeks to deeply understand concepts, engages in discussions, questions and applies what he or she has learned to new situations. Student engagement is positively related to deeper learning and therefore to better academic outcomes, and continuous assessment can increase student motivation and participation (Yang and Ghislandi, 2024).
Our main aim is to make an effective assessment of students regarding their knowledge as future primary-school teachers, along with the goal of getting students involved in their learning process from the outset. The intention is for the implemented assessment system, which has various initial, intermediate and final tests, to produce the pedagogical purposes that are attributed to them in theory: to facilitate a sound decision-making process for teachers to improve their teaching practice and for students to improve their learning activity (Coll Salvador et al., 2007).
Based on these objectives, we propose the following concrete research questions: (1) How does the implementation of an educational intervention based on continuous and individual assessment and feedback impact on the academic performance (success rate and achievement rate) of initial teacher training students?; (2) How does this pedagogical approach influence the student effort in their own learning process?; (3) Are there significant differences in the academic performance of students compared to a control group?
This research presents an innovative pedagogical experience that implements a continuous and formative assessment system, complemented by individualized feedback. The aim is to change the role of the passive student to a proactive student committed to their own learning, seeking to empower students to identify their learning needs and develop self-regulation and self-reflection skills. This approach has a positive influence on students’ attitudes and motivation, which aligns directly with the second research question.
2 Theoretical framework
2.1 Learning assessment
Academic achievement can be understood as the level of success a student achieves in his or her studies. This success can be measured through different indicators, such as grades obtained in exams and assignments, participation in class, acquisition of competences and development of skills. Castillo-Manzano et al. (2024) stresses the importance of a pedagogical design that encourages active student participation in the learning process and explores the use of continuous assessment as a method to improve academic performance.
The assessment process should abandon its finalistic nature and replace it with a learning-oriented approach. This approach is based on three elements: students undertaking tasks aimed at their profession; feedback to the student; and participation of all agents in their assessment, in which students should learn to improve their performance. The assessment constitutes a complex process that must be conducted continuously rather than with one final evaluation (García-Peñalvo et al., 2020).
The students’ knowledge of the assessment methodology is crucial for their academic success Assessment should take place at different stages of the teaching and learning process: initial, intermediate and final (Cañadas, 2020). Initial assessment takes place before beginning the learning process, with the aim of determining the students’ degree of preparation, predicting foreseeable difficulties and strengths. The final assessment consists of the collection and scoring of data after the period set for carrying out the learning task has ended (Castillo Arredondo and Cabrerizo Diago, 2009).
A fundamental practice in the assessment is the gathering of information by the teachers on how the students’ learning develops while the teaching occurs in real time, whereby the teachers carry out continuous evaluation of their learning (Moreno and Ramírez, 2022). Thus, the current level of the student is ascertained to help them attain set learning goals and understand how they are progressing in the education process. The purpose of the assessment is to obtain information on their progress in such a way that the learning needs or limitations that arise can be identified to give worthwhile feedback (Moreno and Ramírez, 2022).
In their study, Herrero-González et al. (2021) conclude that there is a transfer between the assessment systems they have gone through and those used by the teachers in their early years in the profession, i.e., the way the future teachers are assessed is the way they will assess in their own teaching practice, fostering both personal and professional growth (Parmigiani et al., 2024). Learning has personal value and meaning when it helps students to review, reconstruct, and understand past experiences, present situations and to project their future (Esteban-Guitart et al., 2020). This is one of the long-term goals of our study, that our trainee teachers become familiar with different ways of assessing and which they can apply in their professional future.
Assessment for learning stimulate students to take more ownership of their learning and develop self-regulatory skills (Fraile et al., 2021). Wolterinck-Broekhuis et al. (2024) conclude that assessment for learning is not yet fully integrated into teaching practices and that strengthen students’ self-regulated learning need more attention in future teacher professional development trajectories.
2.2 Feedback
Feedback is defined as information that is communicated to the student with the intention of modifying their thinking or behavior for the purpose of improving learning (Haughney et al., 2020). It is essential to convey to students that, when faced with a failure, they should reflect on the reason that led them to commit it, so that learning can take place (Fraile et al., 2021). Good feedback provides the students with the information they need to be able to understand where they are regarding the educative process, what they must do and why (Contreras-Pérez and Zúñiga-González, 2017). It is essential that the remarks made by teacher are constructive (Haughney et al., 2020), hence the students receive information on their strengths, areas for improvement, and possible strategies for development, as well as promoting self-reflection (Aoun et al., 2018), self-analysis, and the capacity for self-regulation, empowering them as active participants in their own learning process (Farfán Pimentel et al., 2022; Olivera Sagua, 2021, Parmigiani et al., 2024).
Feedback is used to inform students about their performance and as a tool to stimulate critical thinking and self-assessment in students, encouraging their autonomy and active participation in their own learning (Parmigiani et al., 2024). This reflective process allows the teacher to understand and adjust own teaching strategies, improving the learning process as a continuous cycle of feedback, analysis and adjustment that benefits both the student and the teacher (Jurs and Špehte, 2021).
One type of feedback is open to the whole class, providing general observations about the strengths and limitations evident in the students’ answers to a particular exam, with the aim of developing self-evaluation skills in the students (Contreras-Pérez and Zúñiga-González, 2017; Farfán Pimentel et al., 2022; Olivera Sagua, 2021). This exam forms part of the summative assessment, by which they are awarded a final mark or grade, which is a valuation or measurement that aims to express the degree of sufficiency – or insufficiency – of the knowledge, skills or abilities of a student (Castillo Arredondo and Cabrerizo Diago, 2009).
Another type would be individualistic feedback, not homogeneous to the whole class, but focused on the individual, where learners should be able to make sense of information about their performance and act quickly accordingly to improve their learning process (Henderson et al., 2021). Learners may have diverse needs when it comes to learning, so it is imperative that educators designing feedback take these individual needs into account (Haughney et al., 2020). In their study, Johannes and Haase (2022) conclude that students with clear and concise feedback increase in knowledge and self-efficacy, as they have a more realistic view of their own capabilities.
2.3 Dropping out of higher education and teaching innovation
The prevention of dropping out from higher education is one of the most important challenges of university policy: studies indicate that one out of every five students drop out from university in their first year (Ministerio de Educación, Cultura y Deporte [MECD]., 2016). Tinto (2017) singles out motivation as a fundamental factor for staying on at university, along with student goals, academic self-efficacy, the feeling of belonging to a group, and the perceived value of their education. A lack of participation in university life is also a factor that affects the increase in stress and the decrease in motivation, satisfaction and commitment with academic studies (Laranjeira and Teixeira, 2025). If students feel satisfied with the university environment, they will not have the intention of abandoning their degree, since the academic satisfaction of university students is related to the support, they receive from teachers in achieving work autonomy (Tomás and Gutiérrez, 2019).
The organization and development of the teaching and learning process, active methodologies, work required by the teacher, and social interactions with teachers and peers are key elements of university life (Triadó et al., 2015). As is known from teacher practice, using an innovative methodology capable of activating their participation is one of the essential factors of student motivation. Innovation has the condition of practicality, where they should be viable and practical experiences giving rise to tangible results, which can be repeated as examples of good teaching practices. Identifying, analyzing and showing innovative methodology can provide ideas to other educators in their teaching activity (Zabalza, 2012), and this is another of the aims of this study.
3 Methodology
This study employed a quantitative methodology to analyze a teaching innovation approach. We carried out a theoretical and practical of tests (training assessment) scored numerically to express the degree of sufficiency or insufficiency of knowledge (summative assessment). Study outcomes were quantified using success rate (SR – passed students versus students took part in the test) and performance rate (PR – considering matriculated students).
After each test, individualized and concise feedback was provided orally in face-to-face tutorials, complemented by general observations for the whole class, encouraging self-assessment. Evidence of the influence of feedback on student dedication and commitment can be directly inferred from performance and success rates when comparing generations.
The quantitative design is justified by the numerical data collected (scores, rates). A four-generation student design, including a control group, enabled effective comparison by observing outcome differences between groups, as highlighted in the findings. The design of continuous assessment combined with feedback is justified because it aligns with the objective of not reducing assessment to a purely finalistic character but rather serves to guide learning and seeks to modify student thinking or behavior.
3.1 Participants and context of the study
The participants are students from the Primary Education Degree course at the University of Cádiz, with the same characteristics of gender, age, or educational level. The subjects studied form part of the first and second years of the course, which are Conocimiento Matemático I (CM1) [Mathematical Knowledge 1] and Conocimiento Matemático II (CM2) [Mathematical Knowledge 2], taught at the Department of Didactics of the Faculty of Education Science. We give the name “generation” to those students who studied the two subjects consecutively, specifically:
• Generation 1 (G1): first year from February to June 2018 studying CM1, and second year from October 2018 to February 2019 studying CM2.
• Generation 2 (G2): first year from February to June 2019 studying CM1, and second year from October 2019 to February 2020 studying CM2.
• Generation 3 (G3): first year from February to June 2020 studying CM1, and second year from October 2020 to February 2021 studying CM2.
• Generation 4 (G4): first year from February to June 2021 studying CM1, and second year from October 2021 to February 2022 studying CM2.
The sample total comprises 324 students from five academic years: 2017/2018, 2018/2019, 2019/2020, 2020/2021 and 2021/2022. The criteria for obtaining the total participants in the sample was the total students enrolled in the first year for each generation, being 71, 80, 92, and 81, respectively. The same teacher oversaw teaching both CM1 and CM2 for all groups, with the same syllabus and participatory methodology.
3.2 Instrument
For CM1, the initial test comprised 20 primary-level exercises to solve problems, exercises and various arithmetic operations, and two intermediate tests corresponding to the numerical topics (NUM) and to problem resolution (PRO). For CM2, the initial test had 15 questions on geometry, measurements and statistics, and three intermediate tests about spatial and geometry (GEO), magnitudes and measurements (MAG), and statistics and probability (STA). The tests are the same for all generations, there were no modifications, and they were developed by faculty members in the department (never published), based on standard tests, in accordance with the Spanish curriculum.
As a final test, the official exam corresponding to each subject was used. For CM1, the exams were held in June, September, and February, while the CM2 exams were in February, June and September. This final test consisted of various practical and theoretical questions related to the entire subject syllabus. In all the tests, the students were asked to do the calculations necessary for solving the exercise or problem, and the possible explanations or reasoning for the processes of solving each one. Finally, a total score was calculated for each test. Students were passed if they exceeded the numerical score of 5. The results are presented in percentages of passes for each generation and subject.
3.3 Data collection and analysis procedure
The initial tests took place in the first week of classes for each subject, then were analyzed and the results given to the students, who could be aware of their level of mathematical knowledge from the outset. Over the development of each subject, we carried out the intermediate and final tests, where the students being informed at all times of their possible evolution or weak points to improve, or strong points to develop, to foster motivation and interest in the subject, to make them aware of their strengths and weaknesses, and to work between teachers and students together at improving the teaching and learning process. It should be mentioned that only for the fourth generation (G4 – control group) the intermediate and final tests were conducted as a system of evaluation, without initial tests or feedback at any time.
4 Results
The initial, intermediate and final tests expressed as percentages of students that passed them are explained in different subsections. These percentages are defined as the success rate (SR – students passed the test versus students took the test) and the performance rate (PR – students passed the test versus students enrolled). The latter is shown accumulatively (APR), considering the performance rate of the previous sitting of the examination.
4.1 Results for generation G1
The first generation G1 comprised a total of 71 students enrolled for CM1 and decreased to 61 for CM2. This difference represents 14% of the students (10/71) and is mainly due to dropping out of university, or because students repeated the first year, or changed university degrees. The dropout rate was monitored by comparing the number of students enrolled in CM1 with those enrolled in CM2 for each generation, reflecting non-continuity in the grade.
For CM1, 54 out of the enrolled students turned up for the initial test, of whom 33 obtained a score higher than 5 (61%). When the first intermediate test was held, of the 65 students presented only 52 passed (80%). The second intermediate test could not be held due to a lack of time. For the final test, the accumulative performance rate (APR) was 49% at the first sitting, increasing to 82% at the second, and reaching 94% at the third (Table 1).
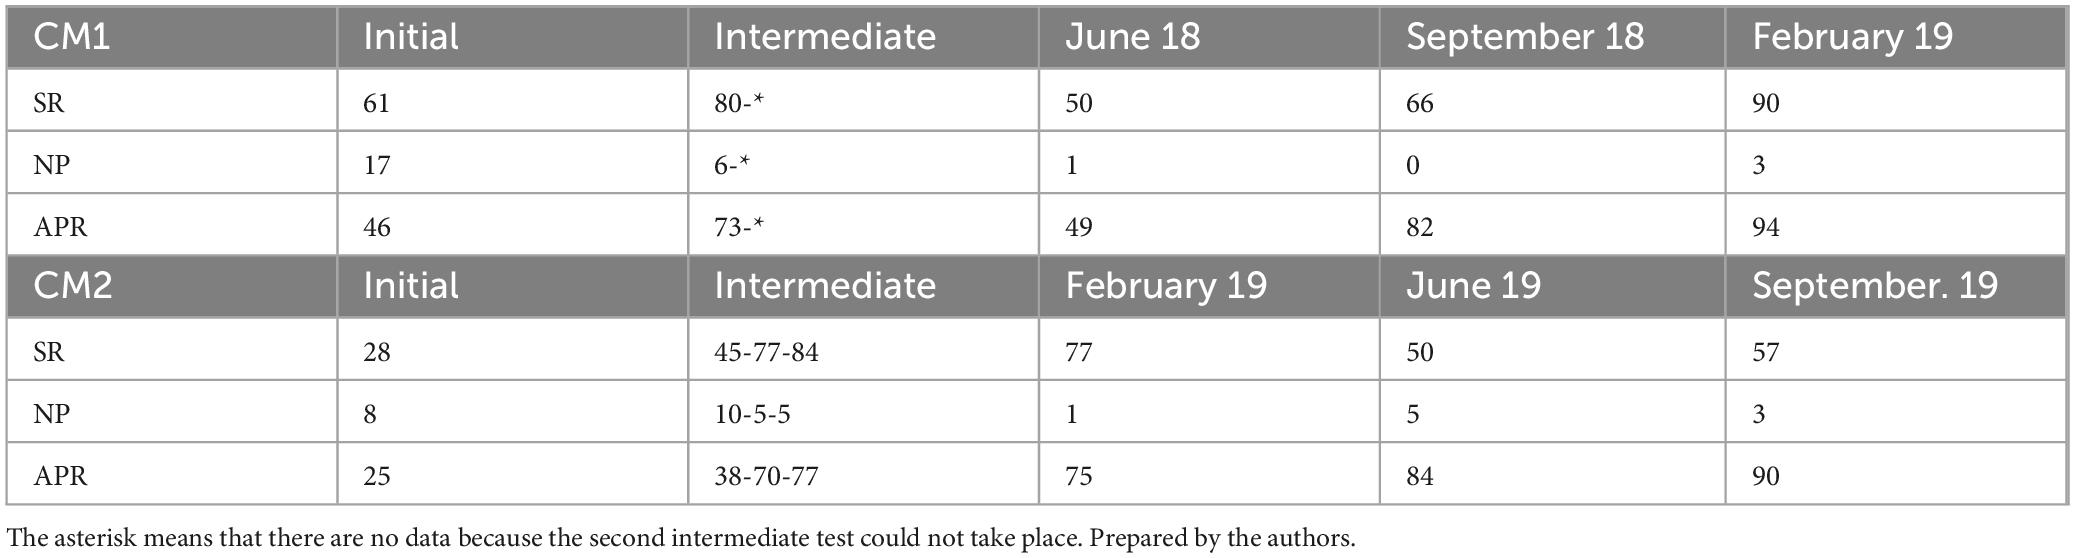
Table 1. Results expressed in percentages (%) for the success rate (SR) of each test taken by Generation 1 (G1), where NP means not present, and showing the accumulative performance rate (APR) for the corresponding subject, CM1 and CM2.
In CM2, 53 of 61 took the initial test, of whom only 15 attained a mark higher than 5 (28%). Given these results, one might expect a higher number of failed students at the end of the subject. However, the mere fact that the students were aware of their low level meant that they dedicated themselves fully to learning the subject and improving their learning process. In the three intermediate tests, 45, 77, and 84% of students passed the test. This demonstrates how the students’ commitment to their own learning process increased from the initial test to the end of CM2. In the final test, the APR was 75% in the first sitting, which increased to 84% in the second and 90% in the third (Table 1).
4.2 Results for generation G2
Continuing with the analysis, there were 80 students enrolled in CM1 and 69 in CM2 for the second generation G2, with a 14% dropout between the first and second years for the total number of students enrolled (11/80). This generation has the same dropout value than G1.
For CM1, 59 of the 80 students enrolled turned up for the initial test, which resulted in a 63% success rate. The first intermediate test was attended by 71 students, of whom 37 obtained a mark higher than 5 (52%), but the SR subsequently fell in the second test to only 38%, with 63 students present. This decrease in the SR could reflect a fall in students’ commitment to the CM1 subject. In the final test, the APR was 30% at the first sitting, 47% in the second, and increasing to 59% in the third (Table 2).
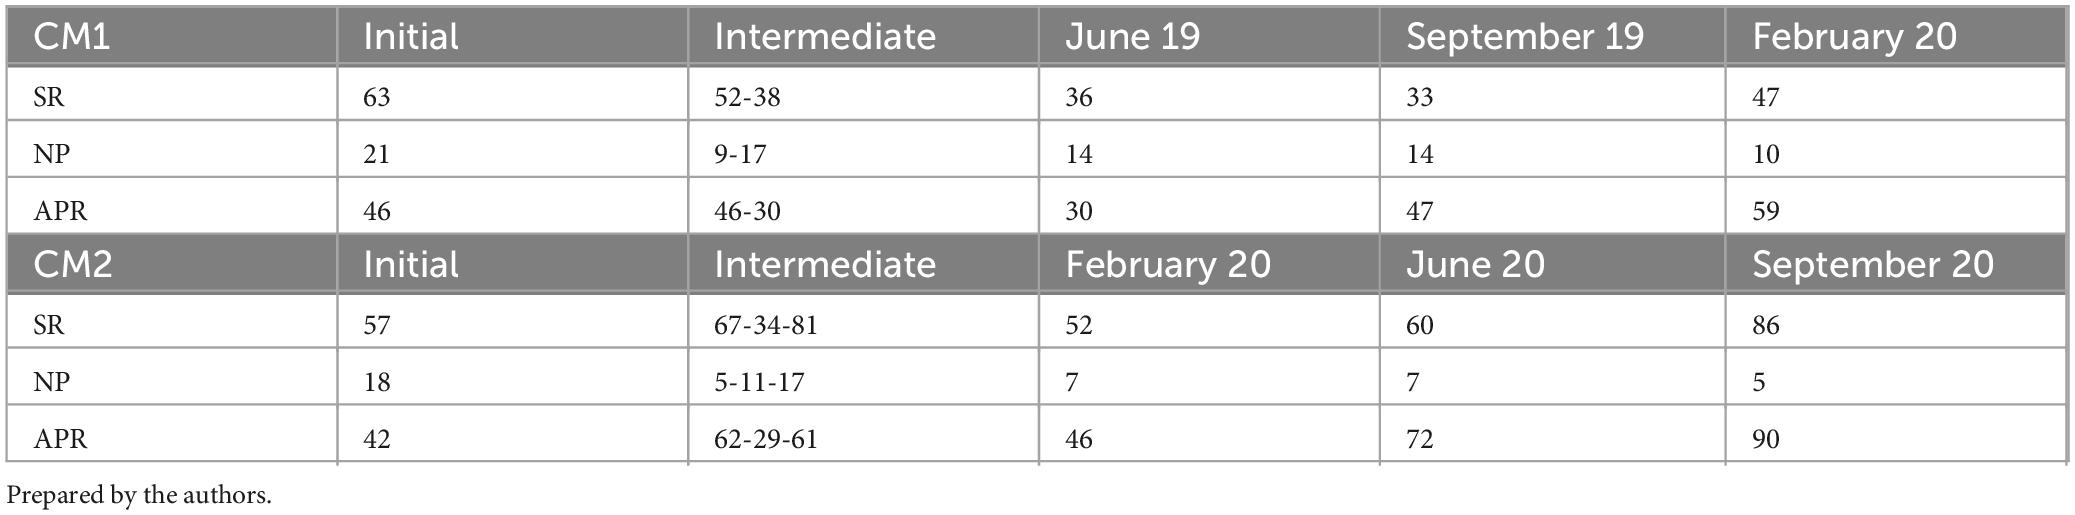
Table 2. Results expressed in percentages (%) for the success rate (SR) of each test taken by Generation 2 (G2), where NP means not present, and showing the accumulative performance rate (APR) for the corresponding subject, CM1 and CM2.
The 57% passed the initial test for CM2, with 69 students enrolled. For three intermediate tests, the SR was 67, 34, and 81%, respectively. The result of the second intermediate test stands out, having a far lower SR than the other two, because, for personal reasons of the teacher, the second intermediate test had to be held a long time after the subject matter was taught, or, perhaps, this part of the syllabus was more complex and harder to understand for the students, according to their own personal assessment communicated to the teachers. Regarding the final test, the APR was 46% at the first sitting, 72% at the second, and 90% at the third (Table 2).
4.3 Results for generation G3
While the first two generations showed mostly positive trajectories and results, the analysis of the third generation (G3) reveals a different picture. For this group, there were 92 students enrolled for CM1, and 70 for CM2. This means a dropout rate of 24%, if we consider the total number of students enrolled in the two subjects. One possible reason for this higher value is that the period between CM1 and CM2 was the summer of 2020, where 22 students did not continue their degree possibly due to the global pandemic.
In the CM1 (Table 3) initial test, only 59 out of 92 enrolled students attended, of whom only 20 passed (34%). In the intermediate tests, the SR was lower than the preceding generations, at 31 and 38%, respectively, because these tests were held during the home lockdown of the pandemic between March and May 2020. Regarding the APR of the final test, it rose from 42% in the first sitting to 72% in the second and 79% in the third (all these tests were carried out online by the students).

Table 3. Results expressed in percentages (%) for the success rate (SR) of each test taken by Generation 3 (G3), where NP means not present, and showing the accumulative performance rate (APR) for the corresponding subject, CM1 and CM2.
For CM2 (Table 3), only 27 out of 70 students were present for the initial test, for which the SR was 55%. In the intermediate tests, the SR was 43, 33, and 40%, respectively. For the final test, the APR was 50% at the first sitting, 69% at the second, and 77% at the third.
The results achieved by G3 were notable for being lower than the other generations. It should be mentioned that this generation was the one most affected by the pandemic and were under home lockdown during CM1 (with online teaching), while their classes and tests for CM2 were partly in person and partly online.
4.4 Results for generation G4
To compare the results of the previous generations with the fourth generation (G4), which acted as a control and did not receive the intervention described above, was analyzed. In CM1 and CM2 there were 81 and 63 enrolled students, respectively. Thus, between the first and second year, there was a 22% dropout rate if we look at the total number of students enrolled in the two subjects analyzed for this generation. The effect of the pandemic may have played a part, although by this time there had been a full return to in-person classes and tests with no health and safety restrictions. It is therefore possible that this value of 22% dropout from university education is due to the students’ lack of interest in their learning.
For CM1, 65 were present for the first intermediate test, and 60 for the second. Only 28% passed the first intermediate test, but the SR fell further to 17% for the second test. This drop in the SR could reflect a lessening commitment of students. For the final test, the APR was 25% for the first sitting, increasing to 42% in the second and 51% in the third (Table 4). For the three intermediate tests, the 63 students enrolled in CM2 obtained an SR of 46, 34, and 48%, respectively. As regards the final test for this subject, the APR was 36% at the first sitting, increasing to 59% at the second and reaching 71% at the third (Table 4). For this generation G4, we can observe that SR and APR are lower than the preceding generations, suggesting that the students’ commitment is less strong.
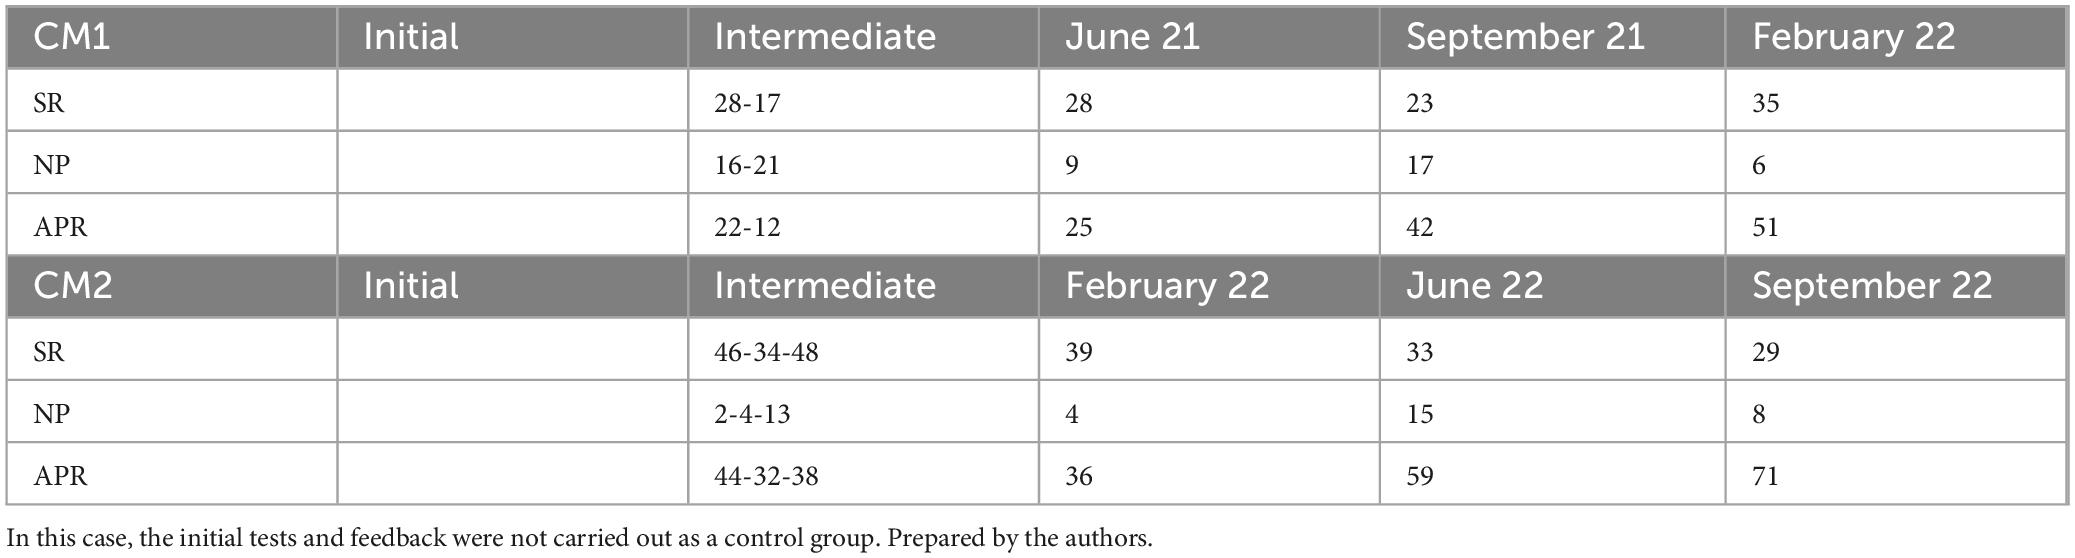
Table 4. Results expressed in percentages (%) for the success rate (SR) of each test taken by Generation 4 (G4), where NP means not present, and showing the accumulative performance rate (APR) for the corresponding subject, CM1 and CM2.
Finally, to illustrate the evolution of the two subjects over the four generations, two comparative figures (Figure 1 for CM1 and Figure 2 for CM2) are presented showing the results of the APR. They show that the G4 generation (control group) is always lower than the other three generations and that the first G1 is the one with the best results of all.
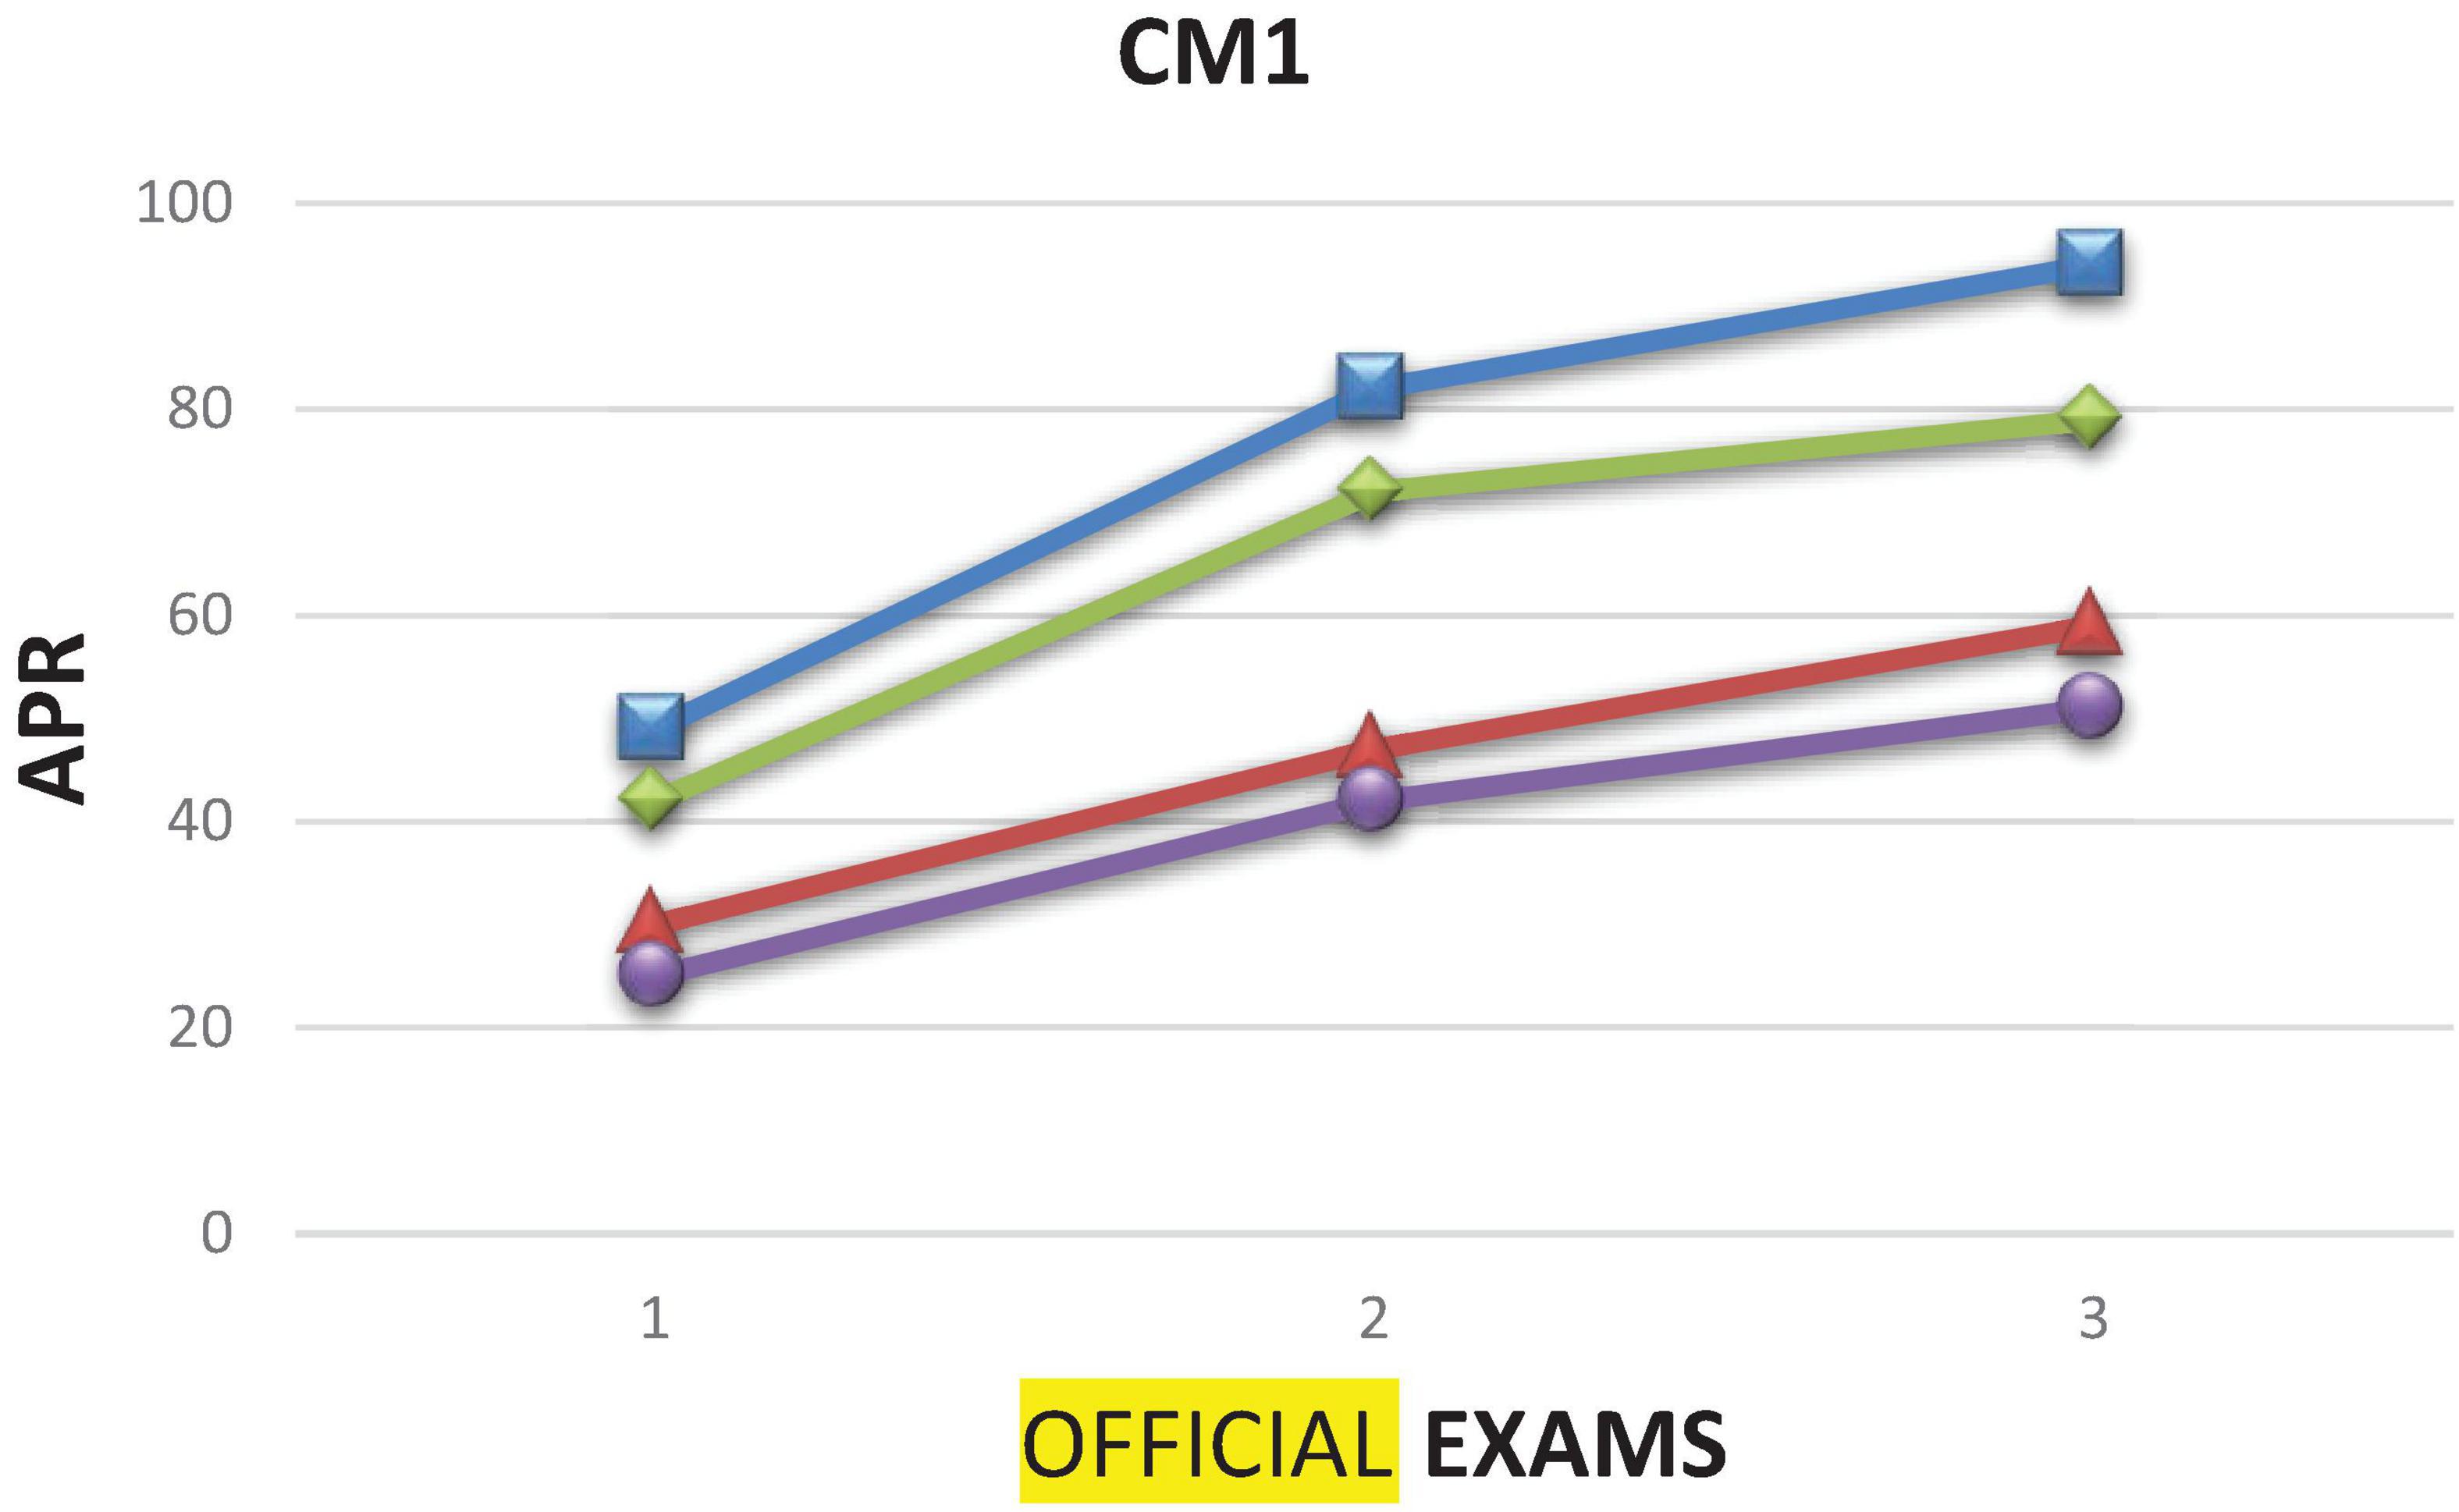
Figure 1. Results for CM1 subject showing the evolution of the APR rate considering each generation: G1 (blue – square), G2 (red – triangle), G3 (green – diamond) and G4 (violet – circle). The numbers 1, 2, 3 in the X axis correspond to the official exams in June, September and February, respectively. Prepared by the authors.
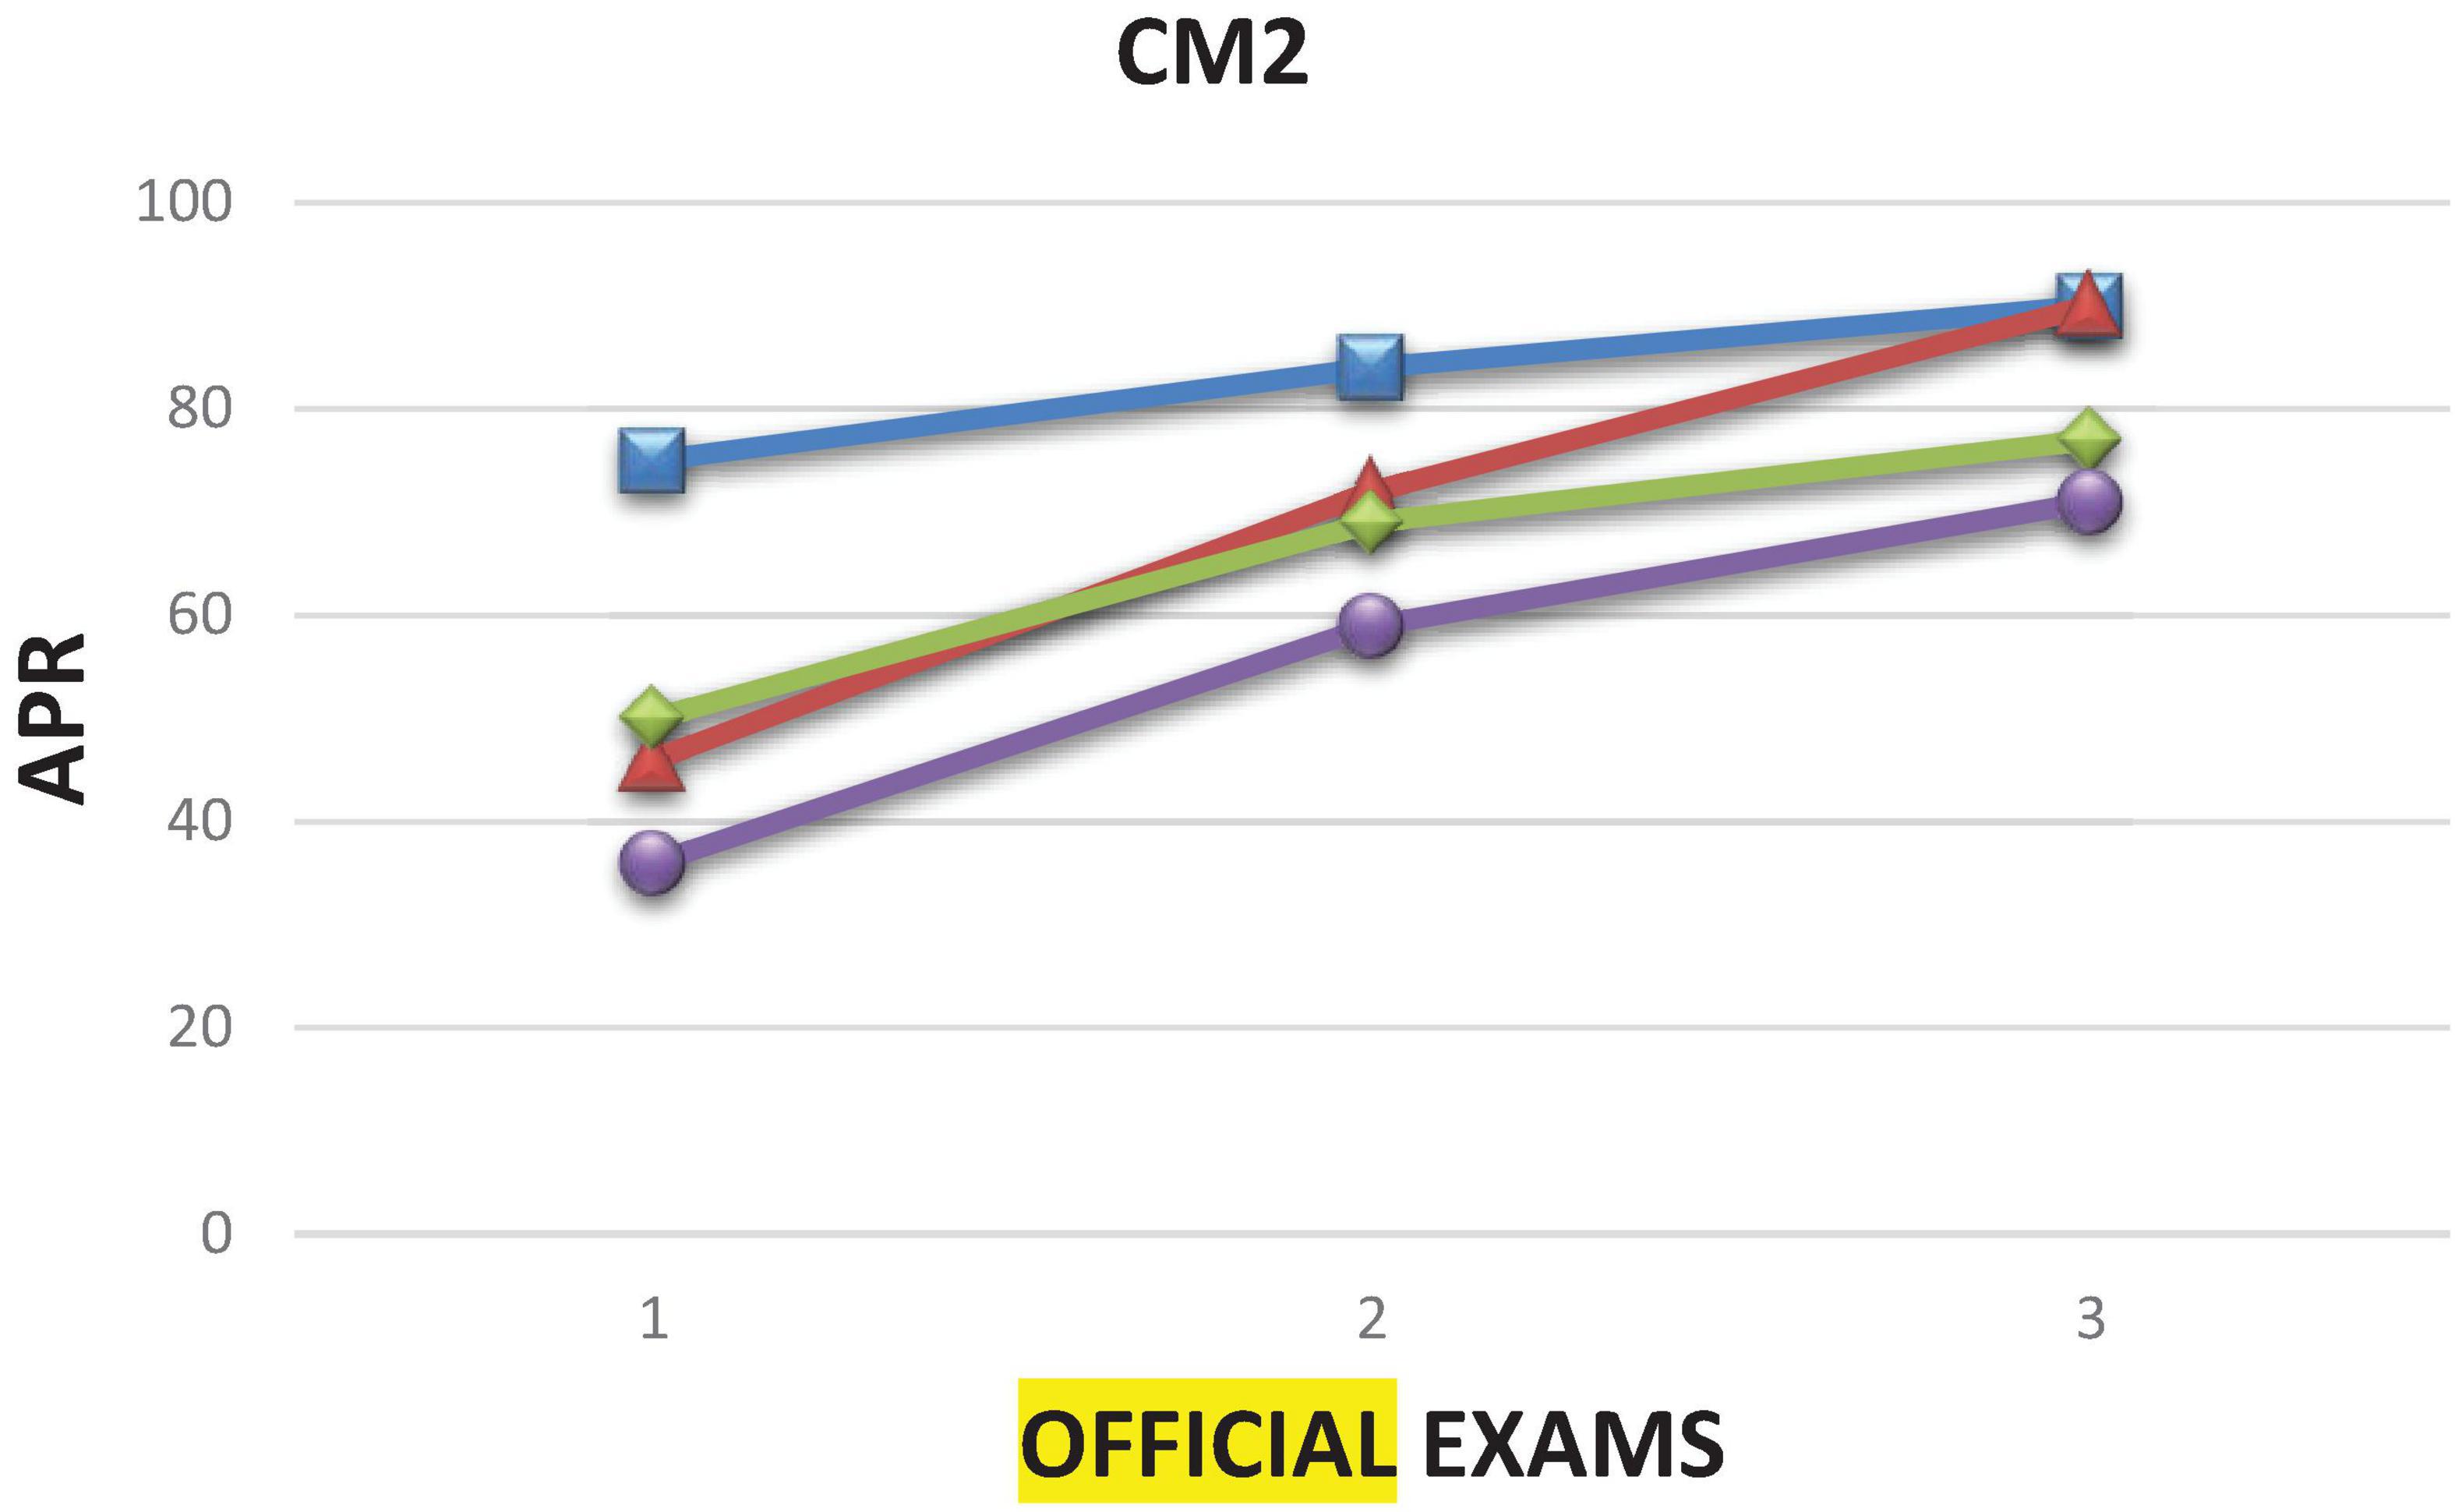
Figure 2. Results for CM2 subject showing the evolution of the APR rate considering each generation: G1 (blue – square), G2 (red – triangle), G3 (green – diamond) and G4 (violet – circle). The numbers 1, 2, 3 in the X axis correspond to the official exams in February, June and September, respectively. Prepared by the authors.
5 Discussion and conclusions
The results of the educational intervention carried out in subjects CM1 and CM2 shows that the students always knew their level of prior knowledge, and the evolution of their own learning process throughout that process and in its conclusion. The assessment constitutes a complex process that needs to be conducted continuously instead of having one single final evaluation (García-Peñalvo et al., 2020), obtaining information on progress and limitations, and implementing feedback given by the teacher (Moreno and Ramírez, 2022). This assessment based on tests and feedback is important for knowing the students learning level and the possible mistakes or shortcomings they have, to try to solve them with the teachers help or following their suggestions to be part of their own improvement.
Looking at the results of the initial tests in CM1 and CM2, we can state that they were carried out with success, as most students passed them (between 55 and 63%), with the occasional exception of a generation falling below.
Regarding the intermediate tests, the SR ranged between 50 and 80%, except for G3, where this generation was most affected by the global pandemic and was under lockdown with online classes and tests and undergoing an uncertain and unprecedented situation. However, for G4, the SR was well below 50%, reaching as low as 17%.
With greater or lesser success, the evolution of the students’ learning is reflected in the final test results. For the first generation (G1), the final APR is 94 and 90% for CM1 and CM2, respectively, being already higher than 80% after the second sitting in both cases. We can state that this generation was committed to their learning from the first year, continuing in the same pattern in the second year of the degree.
For the second generation (G2), the performance in CM1 and CM2 is different, because the APR barely attains 59% in the former but reaches 90% for the latter in the third sitting. The students’ dedication in CM1 was less than for G1, given that the results of the initial test were good (63%). In contrast, for CM2, although G2 began with a similar SR in the initial test, their evolution was different. The SR and APR values are higher both in the intermediate and final tests, reaching a final APR of 90%. Therefore, we can conclude that this second generation involved themselves in their own development in the second year as a reaction to their results. This demonstrates that, although the students did not evolve with such success in the first year, they became aware of their situation and obtained a higher academic performance in the second.
The SR of the initial test for G3 was 34 and 55% for CM1 and CM2, respectively, which is below the preceding generations. The intermediate tests show an average level of commitment lower than the other generations, perhaps due to their initial level being lower, and/or because of the situation of home lockdown. However, it should be emphasized that the APR of the final tests is 70% for both subjects, reaching almost 80% finally. It is important to remember that these students lacked social interactions and participation in university life, causing a lack of motivation and satisfaction, essential factors for persistence in university education, as Tinto (2017) states.
Lastly, for the fourth generation (G4), the APR has values between 25 to 51% for CM1, and for CM2 only comes to 71%, lower than the preceding generations. These results show that the affected or post-pandemic generations (G3 and G4), obtained worse rates than the pre-pandemic generations, contrary to the conclusion reached by Sánchez-Mendiola et al. (2023).
Regarding the university dropout rate, for two generations the values are lower than those recorded by the Ministerio de Educación, Cultura y Deporte [MECD]. (2016), where one in five students drop out of university education in the first year. For G1 one in seven and for G2 one in six students drop out of the primary education degree, increasing to 24% for G3, for whom this stage occurred in the summer of 2020 (pandemic era). However, for G4, 22% (almost one in four) dropped out, a rate that is higher than G1 and G2 and slightly higher than the MECD value (one in five).
All these results show that, the students’ evolution was considerable, showing effort and commitment in their learning. The change to a innovate methodology with greater student involvement in their own learning is fundamental and effective. With this interpretation and analysis of the system of student assessment and feedback, we aim to show how the students can be committed to their own process and be aware at all times of their weaknesses and strengths and are capable of self-assessment (Farfán Pimentel et al., 2022; Olivera Sagua, 2021).
Greater student involvement in their own learning process was precisely one of our objectives, and the assessment system seems to have been successful, particularly if we compare the first two generations with the control group. Both students and teachers should be aware of their starting level at the outset of every subject, along with the mathematical knowledge and skills acquired to evaluate the learning pace and the level of development they have reached. Providing constant feedback on their progress encourages the learner to remain active in the learning process and to strive for improvement (Castillo-Manzano et al., 2024).
With all, the initial research questions have been answered: the impact of the innovative experience has been exposed with the four generation results; the way as the methodology influences the involvement of the students can be inferred from the results mentioned on dedication and commitment; and finally, the significant differences are obtained with the comparison between group and control group. That shows the learning evolution and dedication of G1 and G2 students. Their observable improvement performance after receiving feedback directly supports the theory that feedback is crucial for modifying behavior and commitment to learning, fostering self-reflection, self-analysis and the ability to self-regulate. The differences between G1/G2 and G3/G4 suggests that the implemented methodology was effective and fundamental to increasing motivation and meaningful participation in the learning process (student engagement), showing a positive correlation between this innovative methodology and higher success/achievement rates. In conclusion, the results strongly suggest that a continuous assessment system incorporating formative and summative tests with explicit and individualized feedback is an effective pedagogical tool to increase student engagement.
This study has certain limitations. In terms of the number of participants, although there are more than 300 students in total, when divided by generations and subjects, the size of each specific group might be limited for certain statistical analyses or to ensure high generalizability to other populations. Other is that the research methodology doesn’t delve into why or how students perceived the experience, how they interacted with the feedback at a qualitative level, or the internal processes that led to changes in dedication. An implicit recommendation could be to complement future research with qualitative approaches (interviews or analysis of qualitative test responses) to gain a deeper understanding of learning processes, students’ perceptions of feedback and factors contributing to their engagement or disengagement. Finally, the specific characteristics of the tests (their design, difficulty, etc.) or the specific context of implementation may have influenced the results in ways that are not fully controlled or generalizable. Furthermore, this pedagogical approach could be repeated with different student populations and institutional settings, because it will be useful to other educators as an example of good teaching practice (Zabalza, 2012).
Data availability statement
The raw data supporting the conclusions of this article will be made available upon reasonable request.
Author contributions
MC: Conceptualization, Data curation, Formal analysis, Investigation, Methodology, Resources, Supervision, Validation, Visualization, Writing – original draft, Writing – review & editing.
Funding
The author(s) declare that no financial support was received for the research and/or publication of this article.
Acknowledgments
We would like to thank all the participants who took their time to take part in this research.
Conflict of interest
The author declares that the research was conducted in the absence of any commercial or financial relationships that could be construed as a potential conflict of interest.
Generative AI statement
The author declares that no Generative AI was used in the creation of this manuscript.
Any alternative text (alt text) provided alongside figures in this article has been generated by Frontiers with the support of artificial intelligence and reasonable efforts have been made to ensure accuracy, including review by the authors wherever possible. If you identify any issues, please contact us.
Publisher’s note
All claims expressed in this article are solely those of the authors and do not necessarily represent those of their affiliated organizations, or those of the publisher, the editors and the reviewers. Any product that may be evaluated in this article, or claim that may be made by its manufacturer, is not guaranteed or endorsed by the publisher.
References
Aoun, C., Vatanasakdakul, S., and Ang, K. (2018). Feedback for thought: Examining the influence of feedback constituents on learning experience. Stud. High. Educ. 43, 72–95. doi: 10.1080/03075079.2016.1156665
Cañadas, L. (2020). Evaluación formativa en el contexto universitario: Oportunidades y propuestas de actuación [Formative assessment in the university context: Opportunities and proposals for action]. Rev. Digit. Invest. Docencia Univer. 14:e1214. Spanish. doi: 10.19083/10.19083/ridu.2020.1214
Castillo Arredondo, S., and Cabrerizo Diago, J. (2009). Evaluación educativa de aprendizajes y competencias [Educational assessment of learning and skills]. Spanish. Madrid: Pearson Educación
Castillo-Manzano, J. I., Castro-Nuno, M., López-Valpuesta, L., Sanz-Diaz, M. T., and Yñiguez, R. (2024). Evaluating the design of digital tools for the transition to an e-continuous assessment in higher education. J. Comput. High. Educ. 36, 875–893. doi: 10.1007/s12528-023-09381-2
Coll Salvador, C., Rochera Villach, M. J., Mayordomo Saiz, R. M., and Naranjo Llanos, M. (2007). Evaluación continua y ayuda al aprendizaje. Análisis de una experiencia de innovación en educación superior con apoyo de las TIC [Continuous assessment and learning support. Analysis of an innovative experience in higher education supported by ICT]. Electronic J. Res. Educ. Psychol. 5, 783–804. Spanish. doi: 10.25115/ejrep.v5i13.1249
Contreras-Pérez, G., and Zúñiga-González, C. G. (2017). Concepciones de profesores sobre retroalimentación: Una revisión de la literatura [Teachers’ conceptions of feedback: A review of the literature]. Magis. Rev. Int. Invest. Educ. 9, 69–90. Spanish. doi: 10.11144/Javeriana.m9-19.cpsr
de Dios Alija, T. (2020). Transformación de un modelo educativo a través de la formación y las comunidades docentes de aprendizaje [Transformation of an educational model through training and learning communities]. Rev. Interuniversitaria Formación Profesorado 95, 61–78. Spanish. doi: 10.47553/rifop.v34i2.77131
Esteban-Guitart, M., González-Patiño, J., Iglesias, E., and González-Ceballos, I. (2020). La personalización educativa en tiempos de cambio e innovación educativa. Un ejemplo ilustrativo [Educational personalization in times of change and educational innovation: An illustrative example]. Aula Abierta 49, 395–404. Spanish. doi: 10.17811/rifie.49.4.2020.395-404
Farfán Pimentel, D. E., Asto Huamaní, A. Y., Quispe Fuentes, I., and Farfán-Pimentel, J. F. (2022). Retroalimentación en el aprendizaje y aprendizaje colaborativo en estudiantes de educación secundaria de una institución educativa de Lima [Feedback on learning and collaborative learning in secondary school students at an educational institution in Lima]. Ciencia Latina Revista Científica Multidisciplinar 6, 711–732. Spanish. doi: 10.37811/cl_rcm.v6i2.1917
Fraile, J., Ruiz-Bravo, P., Zamorano-Sande, D., and Orgaz-Rincón, D. (2021). Formative assessment, self-regulation, feedback and digital tools: Use of socrative in higher education. Retos 42, 724–734. doi: 10.47197/retos.v42i0.87067
García-Peñalvo, F. J., Corell, A., Abella-García, V., and Grande, M. (2020). La evaluación online en la educación superior en tiempos de la COVID-19 [Online assessment in higher education during COVID-19]. Educ. Knowledge Soc. 21:26. Spanish. doi: 10.14201/eks.23086
Haughney, K., Wakeman, S., and Hart, L. (2020). Quality of feedback in higher education: A review of literature. Educ. Sci. 10:60. doi: 10.3390/educsci10030060
Henderson, M., Ryan, T., Boud, D., Dawson, P., Phillips, M., Molloy, E., et al. (2021). The usefulness of feedback. Active Learn. High. Educ. 22, 229–243. doi: 10.1177/1469787419872393
Herrero-González, D., Manrique Arribas, J. C., and López-Pastor, V. M. (2021). Incidencia de la formación inicial y permanente del profesorado en la aplicación de la evaluación formativa y compartida en educación física [Impact of initial and continuing teacher training on the application of formative and shared assessment in physical education]. Restos 41, 533–543. Spanish
Johannes, C., and Haase, A. (2022). The impact of feedback mode on learning gain and self-efficacy: A quasi-experimental study. Active Learn. High. Educ. 25, 391–407. doi: 10.1177/14697874221131970
Jurs, P., and Špehte, E. (2021). The role of feedback in the distance learning process. J. Teach. Educ. Sustainabil. 23, 91–105. doi: 10.2478/jtes-2021-0019
Laranjeira, M., and Teixeira, M. O. (2025). Relationships between engagement, achievement and well-being: Validation of the engagement in higher education scale. Stud. High. Educ. 50, 756–770. doi: 10.1080/03075079.2024.2354903
Martínez Muñoz, L. F., Castejón Oliva, F. J., and Santos Pastor, M. L. (2012). Diferentes percepciones sobre evaluación formativa entre profesorado y alumnado en formación inicial en educación física [Different perceptions of formative assessment among teachers and students in initial training in physical education]. Rev. Electrónica Interuniversitaria Formación del Profesorado 15, 57–67. Spanish
Ministerio de Educación, Cultura y Deporte [MECD]. (2016). Datos y cifras del sistema universitario español: Curso 2015-2016 [Facts and figures of the Spanish university system: 2015-2016 academic year]. Spanish. Madrid: Ministerio de Educación, Cultura y Deporte
Moreno, T., and Ramírez, A. (2022). “Evaluación formativa y retroalimentación del aprendizaje [Formative assessment and learning feedback]” in Evaluación y aprendizaje en educación universitaria: estrategias e instrumentos [Assessment and learning in university education: strategies and instruments], eds M. Sánchez and A. Martínez (Universidad Nacional Autónoma de México, Coordinación de Universidad Abierta, Innovación Educativa y Educación a Distancia), 65–79. Spanish
Olivera Sagua, I. J. (2021). La retroalimentación en el proceso de enseñanza–aprendizaje del inglés en estudiantes de secundaria [Feedback in the English teaching-learning process in secondary school students]. Rev. Latinoamericana Ogmios 1, 140–150. Spanish. doi: 10.53595/rlo.v1.i2.013
Parmigiani, D., Nicchia, E., Murgia, E., and Ingersoll, M. (2024). Formative assessment in higher education: An exploratory study within programs for professionals in education. Front. Educ. 9:1366215. doi: 10.3389/feduc.2024.1366215
Sánchez-Mendiola, M., Manzano-Patiño, A. P., García-Minjares, M., Buzo Casanova, E., Herrera Penilla, C. J., Goytia-Rodríguez, K., et al. (2023). Large-scale diagnostic assessment in first-year university students: Pre- and transpandemic comparison. Educ. Assesment Eval. Accountability 35, 503–523. doi: 10.1007/s11092-023-09410-9
Tinto, V. (2017). Through the eyes of students. J. Coll. Student Retention Res. Theory Pract. 19, 254–269. doi: 10.1177/1521025115621917
Tomás, J. M., and Gutiérrez, M. (2019). Aportaciones de la teoría de la autodeterminación a la predicción de la satisfacción académica en estudiantes universitarios [Contributions of self-determination theory to the prediction of academic satisfaction in university students]. Rev. Invest. Educ. 37, 471–485. Spanish. doi: 10.6018/rie.37.2.328191
Triadó, X. M., Aparicio, P., Freixa, M., and Torrado, M. (2015). Satisfacción y motivación del profesorado en el primer curso en grados de ciencias sociales [Teacher satisfaction and motivation in the first year of social science degrees]. Rev. Docencia Univer. 13, 203–229. Spanish. doi: 10.4995/redu.2015.6454
Wolterinck-Broekhuis, C. H. D., Poortman, C. L., Schildkamp, K., and Visscher, A. J. (2024). Key stakeholder voices: Investigating student perceptions of teachers’ use of assessment for learning. Educ. Assessment Eval. Accountability. 36, 257–275. doi: 10.1007/s11092-024-09428-7
Yang, N., and Ghislandi, P. (2024). Quality teaching and learning in a fully online large university class: A mixed methods study on students’ behavioral, emotional, and cognitive engagement. High. Educ. 88, 1353–1379. doi: 10.1007/s10734-023-01173-y
Keywords: mathematics education, assessment, initial teacher training, feedback, mathematical knowledge
Citation: Costado MT (2025) Assessment and feedback: an experience of teaching innovation. Front. Educ. 10:1583160. doi: 10.3389/feduc.2025.1583160
Received: 25 February 2025; Accepted: 11 August 2025;
Published: 08 September 2025.
Edited by:
Gina Chianese, University of Trieste, ItalyReviewed by:
Lorella Giannandrea, University of Macerata, ItalyPāvels Jurs, Riga Technical University, Latvia
Willian Jose Ferreira, Universidade de Taubaté, Brazil
Copyright © 2025 Costado. This is an open-access article distributed under the terms of the Creative Commons Attribution License (CC BY). The use, distribution or reproduction in other forums is permitted, provided the original author(s) and the copyright owner(s) are credited and that the original publication in this journal is cited, in accordance with accepted academic practice. No use, distribution or reproduction is permitted which does not comply with these terms.
*Correspondence: Maria Teresa Costado, bWFyaWF0ZXJlc2EuY29zdGFkb0BnbS51Y2EuZXM=