 Christine Broussard
 Margaret Gough Courtney
 Sarah L. Dunn
 K. Godde
 Vanessa Preisler
- 1College of Arts & Sciences, University of La Verne, La Verne, CA, United States
- 2College of Natural Sciences, California State University, San Bernardino, Palm Desert Campus, CA, United States
- 3School of HESBS, Moreno Valley College, Moreno Valley, CA, United States
Introduction: Course-based Undergraduate Research Experiences (CUREs) are high-impact learning practices that replace the traditional apprenticeship model and can increase learning gains in diverse groups. We examined CUREs across disciplines (including the social and natural sciences) to evaluate performance at a Hispanic-Serving Institution.
Methods: We administered five instruments, including the CURE Survey of Course Elements, CURE Survey of Opinions, Experimental Design Ability Tool/Expanded Experimental Design Ability Tool, Career Adapt-Abilities Scale, and a demographic questionnaire. Wilcoxon Rank tests, Kolmogorov-Smirnov tests, and unpaired t-tests evaluated the efficacy of CUREs across students and within (and between) discipline type (social or natural science).
Results: Significant positive learning gains were experienced for select instrument items, but not for career-ready skills. Natural science students displayed significant positive changes for three scientific practice skills, whereas social sciences students had greater positive changes for a different set of three scientific practice skills.
Discussion: Overall, CUREs positively impacted student skills and self-perceptions.
Introduction
The shift to research-embedded or course-based undergraduate research experiences (CUREs) in STEM (Auchincloss et al., 2014) began as a result of dissatisfaction with traditional cookbook laboratory sessions (aka, inquiry based learning). Higher education practitioners recognized that canned laboratory experiences with known outcomes did little to foster the kinds of skills and habits of mind they hoped to instill in learners (Brownell et al., 2012; Wei and Woodin, 2011). An alternative to the cookbook laboratory is apprenticeship research, which has been shown to achieve the learning outcomes desired (Delogu et al., 2023; Kilgo et al., 2015; Kuh, 2008; Lopatto, 2004, 2007, 2010; Lopatto et al., 2008). However, institutional challenges, such as human resources (Sundberg and Moncada, 1994; Herreid, 1998; National Science, and Teachers Association, 2001), infrastructure (Wood, 2003; Desai et al., 2008), or financial resources (Lewis et al., 2003; Hue et al., 2010), and students’ personal obstacles (Pierszalowski et al., 2021), such as family and financial obligations (Gin et al., 2022; Malcom et al., 2010), and academic cultural capital (Bangera and Brownell, 2014; Pfeifer et al., 2021) prevent learners from accessing these opportunities. The CURE (pun intended) seemed a logical solution to the challenges educators and learners face.
Renewed urgency in the movement for STEM transformation came from reports detailing how the United States falls short in the number of STEM bachelor’s degrees awarded annually (US Congress Joint Economic Committee, 2012; Graham et al., 2013) and a report highlighting the need to produce one million additional college graduates with STEM degrees to meet the demand for STEM graduates (President’s Council of Advisors on Science and Technology [PCAST], 2012, 2024). Efforts to improve and diversify student enrollment and retention through funding for interventions or programming to curb attrition have fluctuated with time and political pressures, yet equity gaps still exist across gender, ethnicity, and other demographic variables, i.e., first generation status and underrepresented minorities (URM), (Bangera and Brownell, 2014; Means and Pyne, 2017; National Academies of Sciences, Engineering, and Medicine, 2024). Despite increased representation by women and URM individuals graduating with STEM degrees or in the STEM workforce between 2011-2021, a National Science Foundation report (2023) and the PEW Research Center showed equity gaps remain in the STEM workforce with lower: (1) representation by those considered URM (15% Hispanic, 9% African American/Black and 1% American Indian or Alaskan Native), (2) median salaries across genders and with URM status, and (3) numbers of employees who have a bachelor’s degree completed (National Center for Science and Engineering Statistics [NCSES], 2023; Fry et al., 2021).
Financial challenges in higher education associated with the pandemic (O’Leary and Audrey, 2023) and the predicted enrollment cliff (Boeckenstedt, 2022; Bauman, 2024) have shifted focus at many institutions from providing educational experiences based on high-impact practices to minimalist programs and heavy cost-cutting, with many institutions questioning the value of traditional laboratory courses (Cancilla and Albon, 2017; Arnaud, 2020). The resulting scaling back on laboratory offerings, including shifting them online (Morad, 2022) further diminishes the opportunities for students to have hands-on STEM experiences and in-person gains (Rosen and Kelly, 2022; Photopoulos et al., 2022). However, students who participate in hands-on research experiences are more likely to be retained, graduate at a higher rate, and continue into science-related careers (Russell et al., 2007; Dong et al., 2024), supporting the STEM workforce. Calls for embedding research into the curriculum (Malcom et al., 2010) aim to reduce barriers to broader participation. Moreover, research on course-based experiences demonstrated that similar outcomes to the apprenticeship model could be generated (McCune and Hounsell, 2005; Lopatto et al., 2008; Harrison et al., 2011; Corwin et al., 2015; Dolan, 2016) with the CURE model, even when research goals were not met (Gin et al., 2018).
As CUREs become more popular and the landscape of higher education changes (August, 2021), along with recognition of additional COVID-related disruptions to the status quo of higher education (García-Morales et al., 2021), other disciplines have begun adapting traditional fieldwork experiences into short-term research experiences and adopting CUREs patterned after STEM efforts. In the social sciences, some studies of short-term research opportunities (Cuthbert et al., 2012; Ruth et al., 2019) demonstrated similar learning gains as STEM CUREs. However, not all CUREs gave the same outcomes. Another study indicated limited gains or declines in student interest or sense of competence (Wessels et al., 2021). CURE designs that incorporated a mix of student-centered and faculty-directed research experiences had better outcomes (Hosein and Rao, 2017). These varied outcomes suggest social science CUREs are in a developmental phase that might benefit from insights from the more established CURE community.
Multiple exposures to high-impact practices improve retention, persistence, and graduation, particularly for under-served students (Finley and Tia Brown, 2013). The study of social science research experiences (e.g., sociology, anthropology, and criminology) is particularly important in light of the benefits of high-impact practices and the fact that students in a variety of majors take social science courses as part of a general education requirement. Moreover, the social sciences reach more underserved students than the natural sciences; comparatively, the social sciences attract an increased number of students identifying as first generation, URM, and female (Ruth et al., 2023). If the goal of the higher education transformation movement is to expand access, achieve consistency, and increase research offerings, CURE-type courses embedded in the humanities, social science, and natural science disciplines would broaden opportunities for students to be engaged and benefit from the CURE elements and high impact practices embedded in the research experiences.
CURE effectiveness has traditionally been evaluated in natural and life science courses, with little attention paid to the social sciences (i.e., Broussard et al., 2021; Ruth et al., 2023). In this study we extend the development and examination of CUREs to the social sciences and humanities. The question we addressed was whether effective CUREs could be designed and implemented across multiple STEM (biology, computer science, mathematics, and physics) and associated disciplines (anthropology, kinesiology, sociology, rhetoric and communications) at a single institution. The purpose of this study, therefore, was to ascertain whether expanding CUREs in this manner would lead to positive outcomes for students across programs. Over eight semesters, we consistently incorporated all five key CURE elements (Auchincloss et al., 2014) in every course; developed both lower- and upper-division CUREs; and assessed their impact on diverse student populations –including historically marginalized groups, different gender identities, and non—traditional students–at an HSI—designated institution.
To answer the overall question, we divided it into a series of research questions focused on student success across programs: Did CURE participation lead to…
RQ1. … enhancement of student learning?
RQ2. … improvements in students’ research design skills?
RQ3. … changes in students’ science and self-perceptions (psychosocial gains)?
and
RQ4. … any notable differences between outcomes in social science versus natural science CUREs?
Materials and methods
Undergraduate students (N = 297, ages 18–25 + years) in lower- and upper-division courses were recruited within the first few weeks of each semester, across a 4-year period, from courses that were designated as CUREs and met the project requirements for participation in natural and social sciences (study approved by the University of La Verne Institutional Review Board, protocol number 2017-13-CAS). Thus, the study uses a convenience sample for which pre and post data were collected. Students were recruited and signed written informed consents in the first 2 weeks of class. Each CURE course was taught by faculty who participated in an organized CURE faculty learning community throughout the funding period to further their understanding of CURE development and implementation.
Procedures
CURE development
The first CURE courses were taught Spring 2017, with 17 unique CUREs offered over the course of the project (anonymized per IRB approval and described in Supplementary Table 1; 4 were taught Spring 2020, reported in Broussard et al., 2021). Over the 4–year span of the project, each CURE course was offered one to five times, allowing for adjustments and improvements with each semester taught. Upper-division courses (and only one lower division) were offered, based on instructor preference, and in most instances, they were open to all levels of undergraduates.
Assessment of the student experience
Student data collection took place in the classroom, using assignments, surveys, and faculty reports of their observations and opinions (submitted after course grade submission). Matched pre and post data across courses were pooled to understand the overall experience of project students. Pre data were collected in the first 1–3 weeks of the semester and post data in the last 2–3 weeks of the semester.
We used the Scientific Practice Skills elements from the CURE Survey of Course Elements (CSCE) (Denofrio et al., 2007; Lopatto et al., 2008) to examine RQ1 and RQ4. Examples of items include reading primary literature, collecting and analyzing data, and presenting posters. CURE Survey Opinions (CSO) (Denofrio et al., 2007; Lopatto et al., 2008) items were used to assess RQ3 and RQ4. The response rate was 62.9%, due in part to some faculty members not administering the pre or post survey according to guidelines.
Since the main goals for this project included student acquisition of STEM and related content, promoting comprehension and application of scientific process, and facilitating skills development for effective research design (RQ2), the content and science process learning outcomes were assessed through objective and subjective measures. Instructors created variations of the objective Experimental Design Ability Tool (EDAT) (Sirum and Humburg, 2011) and Expanded Experimental Design Ability Tool (E-EDAT) (Brownell and Kloser, 2015), in order to evaluate students’ understanding of the process of scientific inquiry and analysis. Because these instruments differed across courses, we standardized the outcome as a percentage-correct score. The EDAT/E-EDAT response rate was lower because some instructors did not administer the assessment as requested–29.7% of all consented students completed the assessment.
To evaluate professional and career readiness outcomes, the 24-item Career Adapt-Abilities Scale (CAAS) (Savickas and Porfeli, 2012) was also implemented as a secondary measure of learning gains (career preparation). The CAAS is a standard measure of career adaptability rooted in career construction theory (Savickas and Porfeli, 2012). Student’s self-reported confidence in performing important tasks, curiosity about opportunities, options, and ways of completing tasks, perception of control over their external environment, and concern about the future were measured. We combined the CAAS with the CURE survey with permission (Lopatto, 2016, Personal Communication). For student perceptions (RQ3), subjective assessments of changes in science opinions and self-perception using the CSO and CAAS were analyzed. A demographic questionnaire captured a range of basic student information including ethnicity, gender (male, female, another gender), major, class standing, parental income, first-generation college attendance status, and hours worked.
Statistical analysis
As the variables are primarily categorical or non-normally distributed continuous variables, we used non-parametric Wilcoxon signed rank tests to analyze the CSCE, CSO, CAAS, and EDAT/E-EDAT data. A Bonferroni correction for multiple tests was applied to the significance cutoff (ɑ = 0.05) for each section of the CSCE, CSO, and CAAS instruments, which is calculated by dividing the p-valuecutoff by the number of tests run for a single hypothesis, minimizing the number of false positives for significance reported. For the CURE instrument, our cutoff for evaluating statistical significance was 0.002 (0.05/25 = 0.002) for the CSCE and 0.0021 (0.05/22) for the CSO, while for the CAAS instrument our cutoff was 0.01 (0.05/5 indices = 0.01). We first applied these tests to the entire sample, and then followed up with subgroup analyses, comparing natural science and social science. We tested for normality using Stata’s sktest, which combines a test based on skewness with a test based on kurtosis into a single test statistic. To formally compare the outcomes for natural and social science we estimated unpaired t-tests and Kolmogorov-Smirnov tests, the latter of which is appropriate for non–normally distributed outcomes. Analyses were conducted in Stata 18 (StataCorp., LLC 2023).
Results
Descriptive statistics for the sample are shown in Table 1. The majority of participants were 20 or 21 years old, and participation was split evenly across male and female identities (only one respondent reported another gender identity across the data collection period). Our institution restricted available institutional data to the Fact Book, and thus, we only present a comparison between the CURE sample and the institution’s greater undergraduate student demographics for gender and race/ethnicity. Compared to the gender composition of the university’s overall undergraduate population, in which nearly 58% identify as female (see Supplementary Table 2), those identifying as female are slightly underrepresented in our sample. More than three-quarters of the sample identified as non-White, and more than 40% of the sample identified as Latina/o. Compared to the racial/ethnic composition of the university’s undergraduate population, our sample is similar with regard to identification as non-White (76.01% in the sample vs. 79.85% in the undergraduate population), but the sample underrepresents those identifying as Latina/o (44.26% in the sample vs. 52.45% in the undergraduate population; see Supplementary Table 2). About a quarter of the sample was transfer students. Approximately one third of participants had previously taken a CURE (or CURE-like) course, and of these, the majority had taken only one. We note that at our institution, high impact practices (HIPs, including embedded research) were intentionally included in many courses (lower and upper division) before this research commenced. However, it would be difficult to tease out the impacts of those prior practices, not to mention CUREs, on students in the cohort examined due to significant data limitations. Thus, we did not analyze the data separately based on prior CURE exposure.
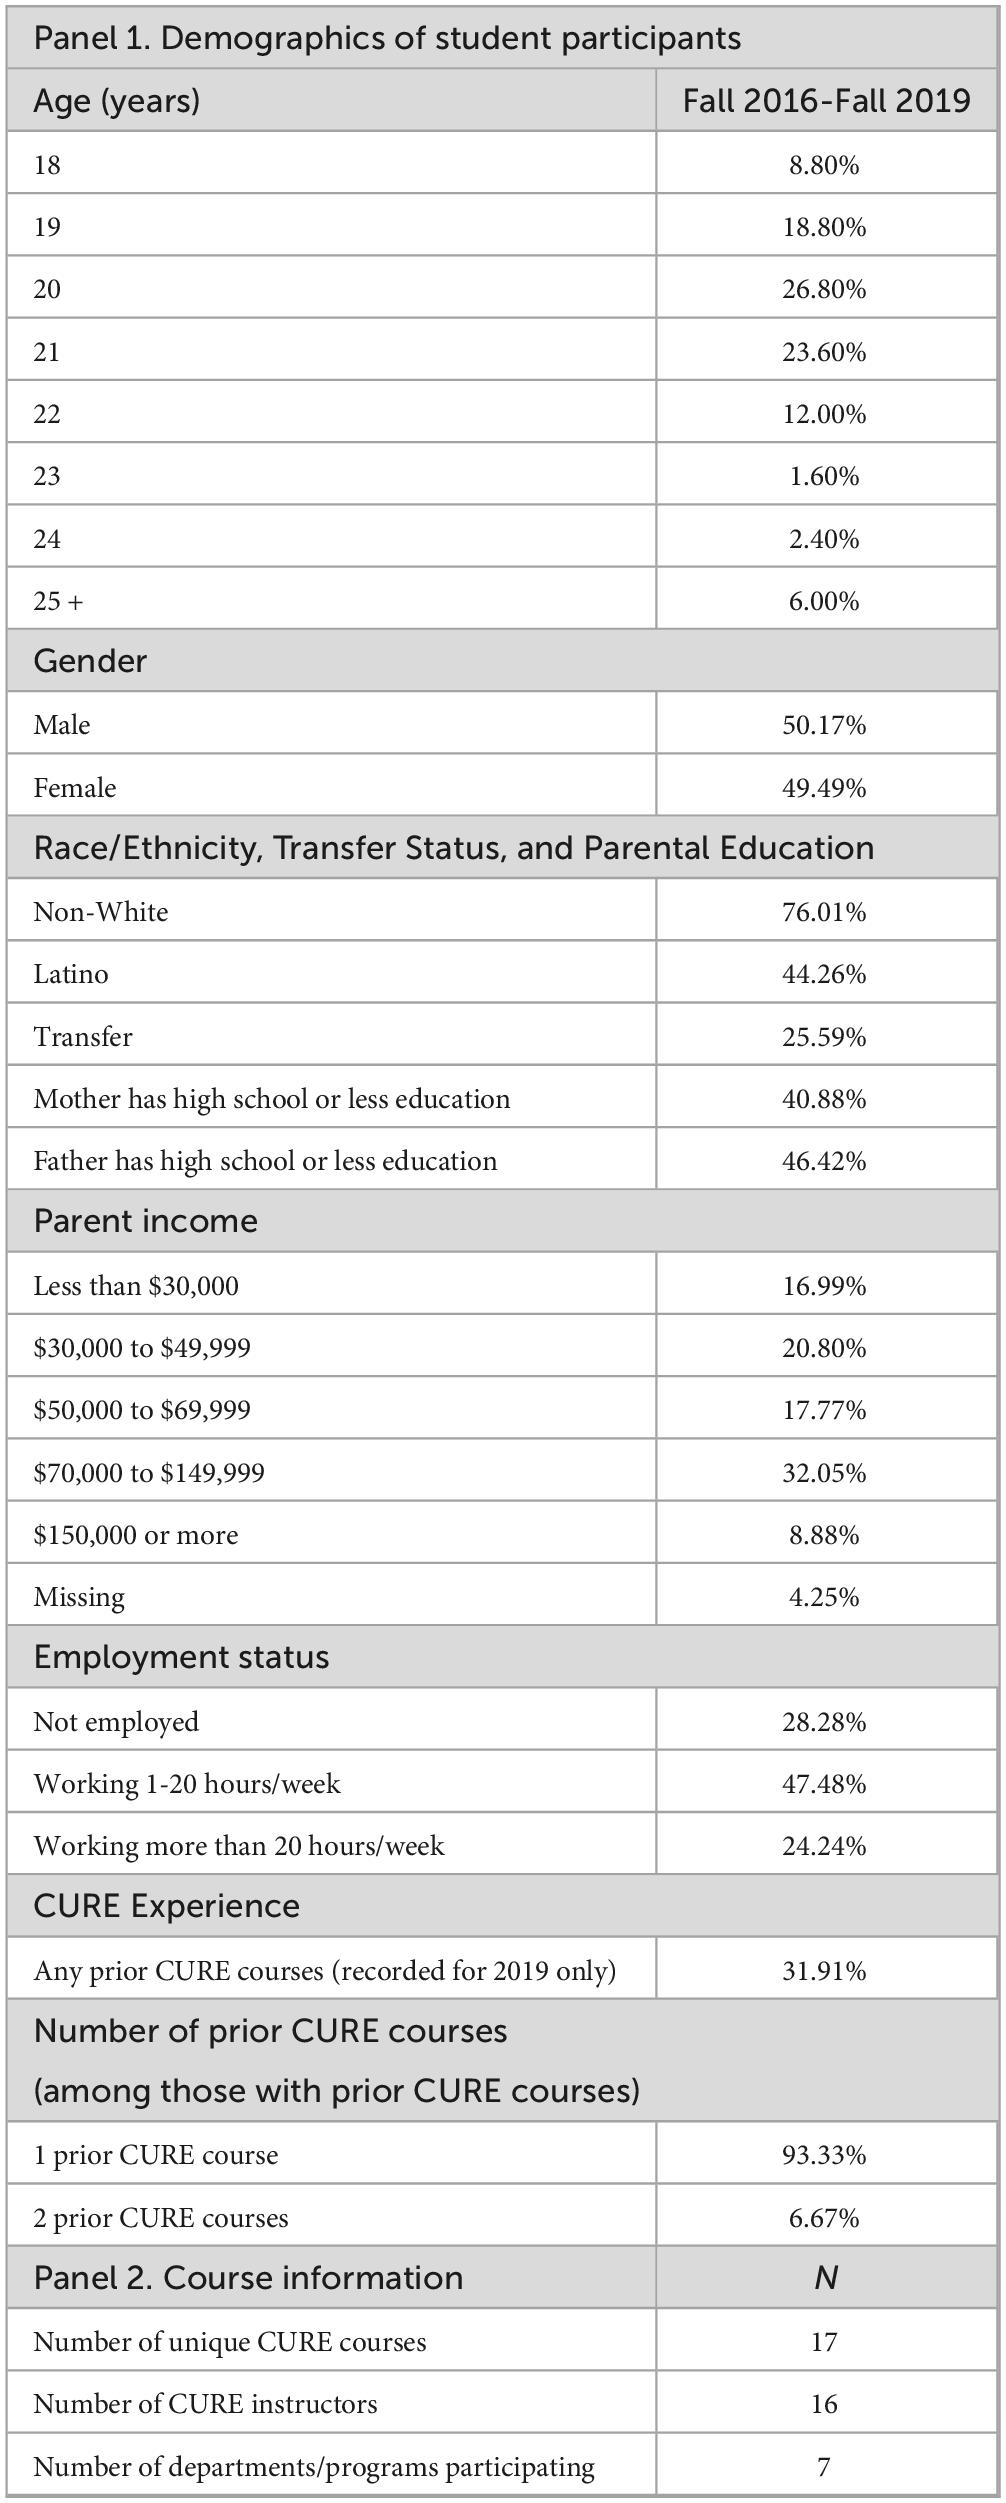
Table 1. Demographics of student participants (N = 297) and course information.
Enhancement of scientific practice skills (RQ1)
Results from this survey are shown in Table 2. Statistically significant findings (from Wilcoxon rank tests) were observed for each of the Scientific Practice Skills items of the CSCE. The highest percentages of positive change are seen for writing a research report and analyzing data. Approximately one-quarter of students reported no changes from the pre- to post-periods, while the percent reporting negative changes ranged from 12.8 to 26.9%. Importantly, most students reported positive changes.
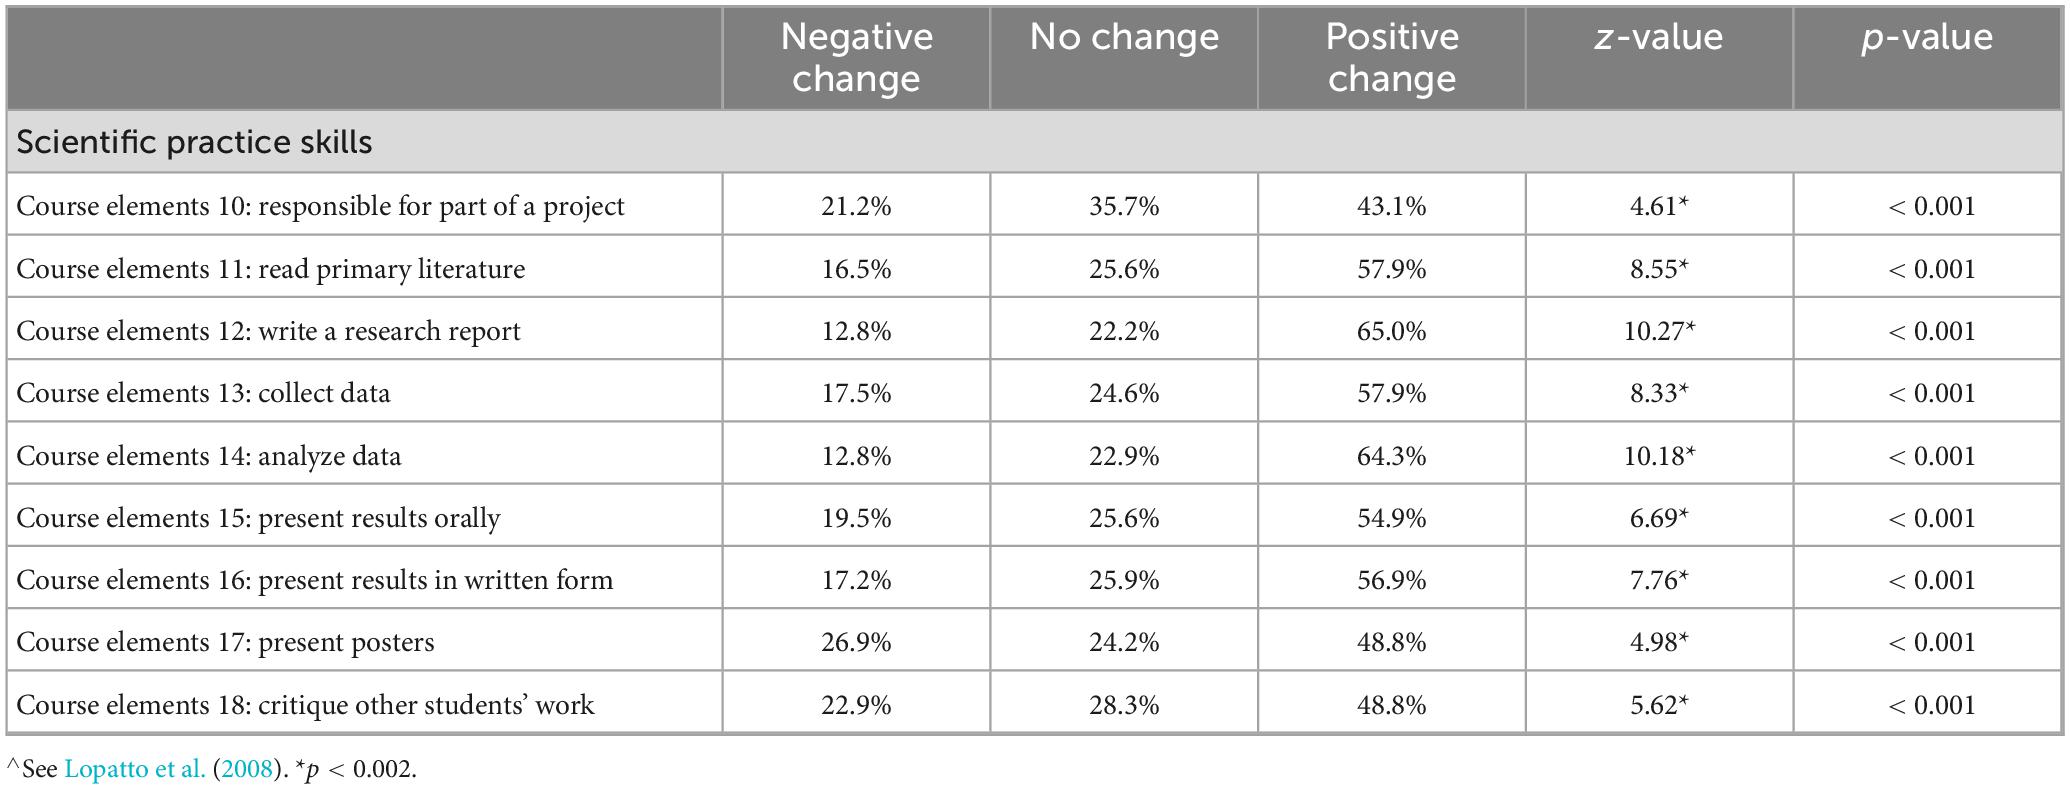
Table 2. RQ1: Wilcoxon test results with percent negative change, no change, and positive change for CURE survey∧ of course elements, across all students, fall 2016-fall 2019 (n = 297).
Improvement of research design (RQ2)
The Wilcoxon rank test results for the EDAT/E-EDAT indicated a statistically significant difference from pre to post (z = 8.42, p < 0.001). As shown in Table 3, nearly 79% of the sample achieved a higher score on the post-test compared to the pre-test.
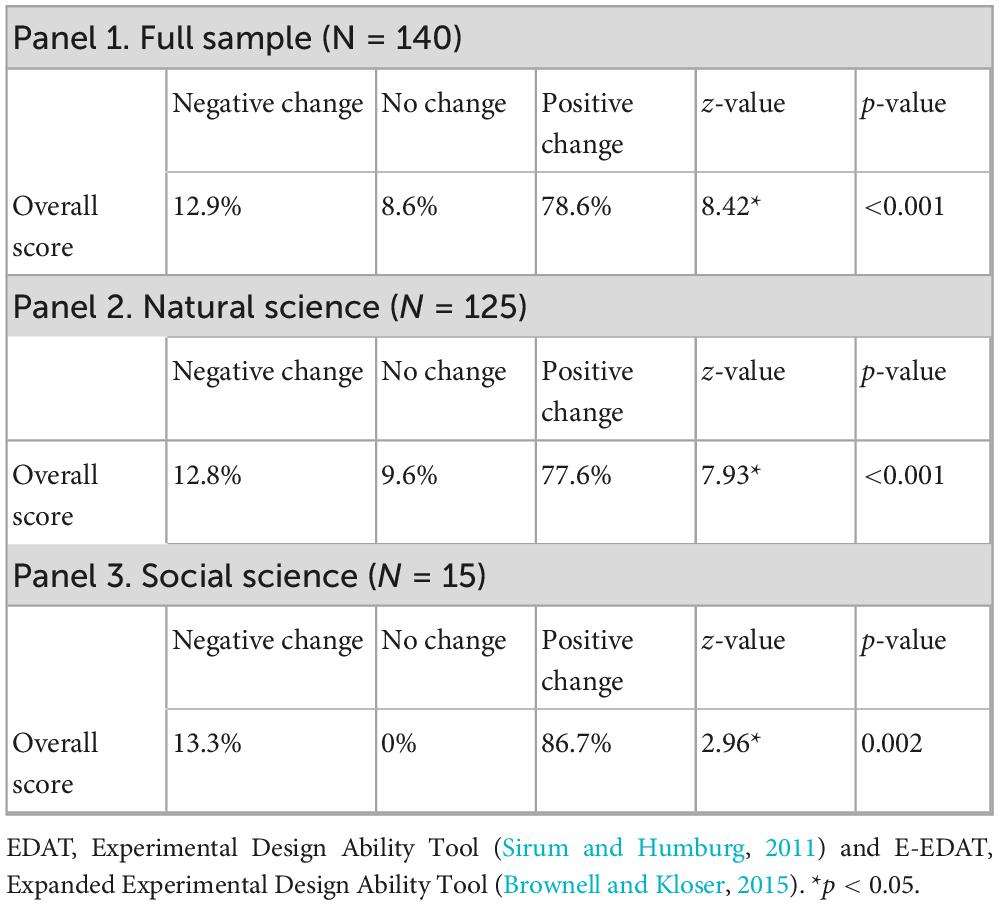
Table 3. RQ2 and 4: Wilcoxon test results with percent negative change, no change, and positive change for EDAT/E-EDAT, across all students, fall 2016-fall 2019.
Perceptions of science and self (RQ3)
To study students’ perceptions of science and self, we used the CSO (Table 4). Wilcoxon rank test model results were statistically significant for both confidence items; for each item approximately one-third of students reported gains from pre to post, while less than 15% reported declines. However, the modal result was no change. For perception of science, three items were statistically significant. Approximately 35% of students reported an increase in thinking that real science was non-linear. However, somewhat surprisingly, for knowing results ahead of time and null results being a failure, items that were expected to show decreases over time, more than 30% of students reported an increase, only about 20% of students reported a decrease, and nearly half had no change. In the area of Intellectual Development, the model for all theories being valid was statistically significant, and approximately 36% of students had an increase on that item. There were no statistically significant results in the areas of structure/design or values/preferences. None of the relevant CAAS items (Table 5) had statistically significant findings, though somewhat interestingly, very few students report no change. Rather, similar numbers of students reported negative changes as reported positive changes.
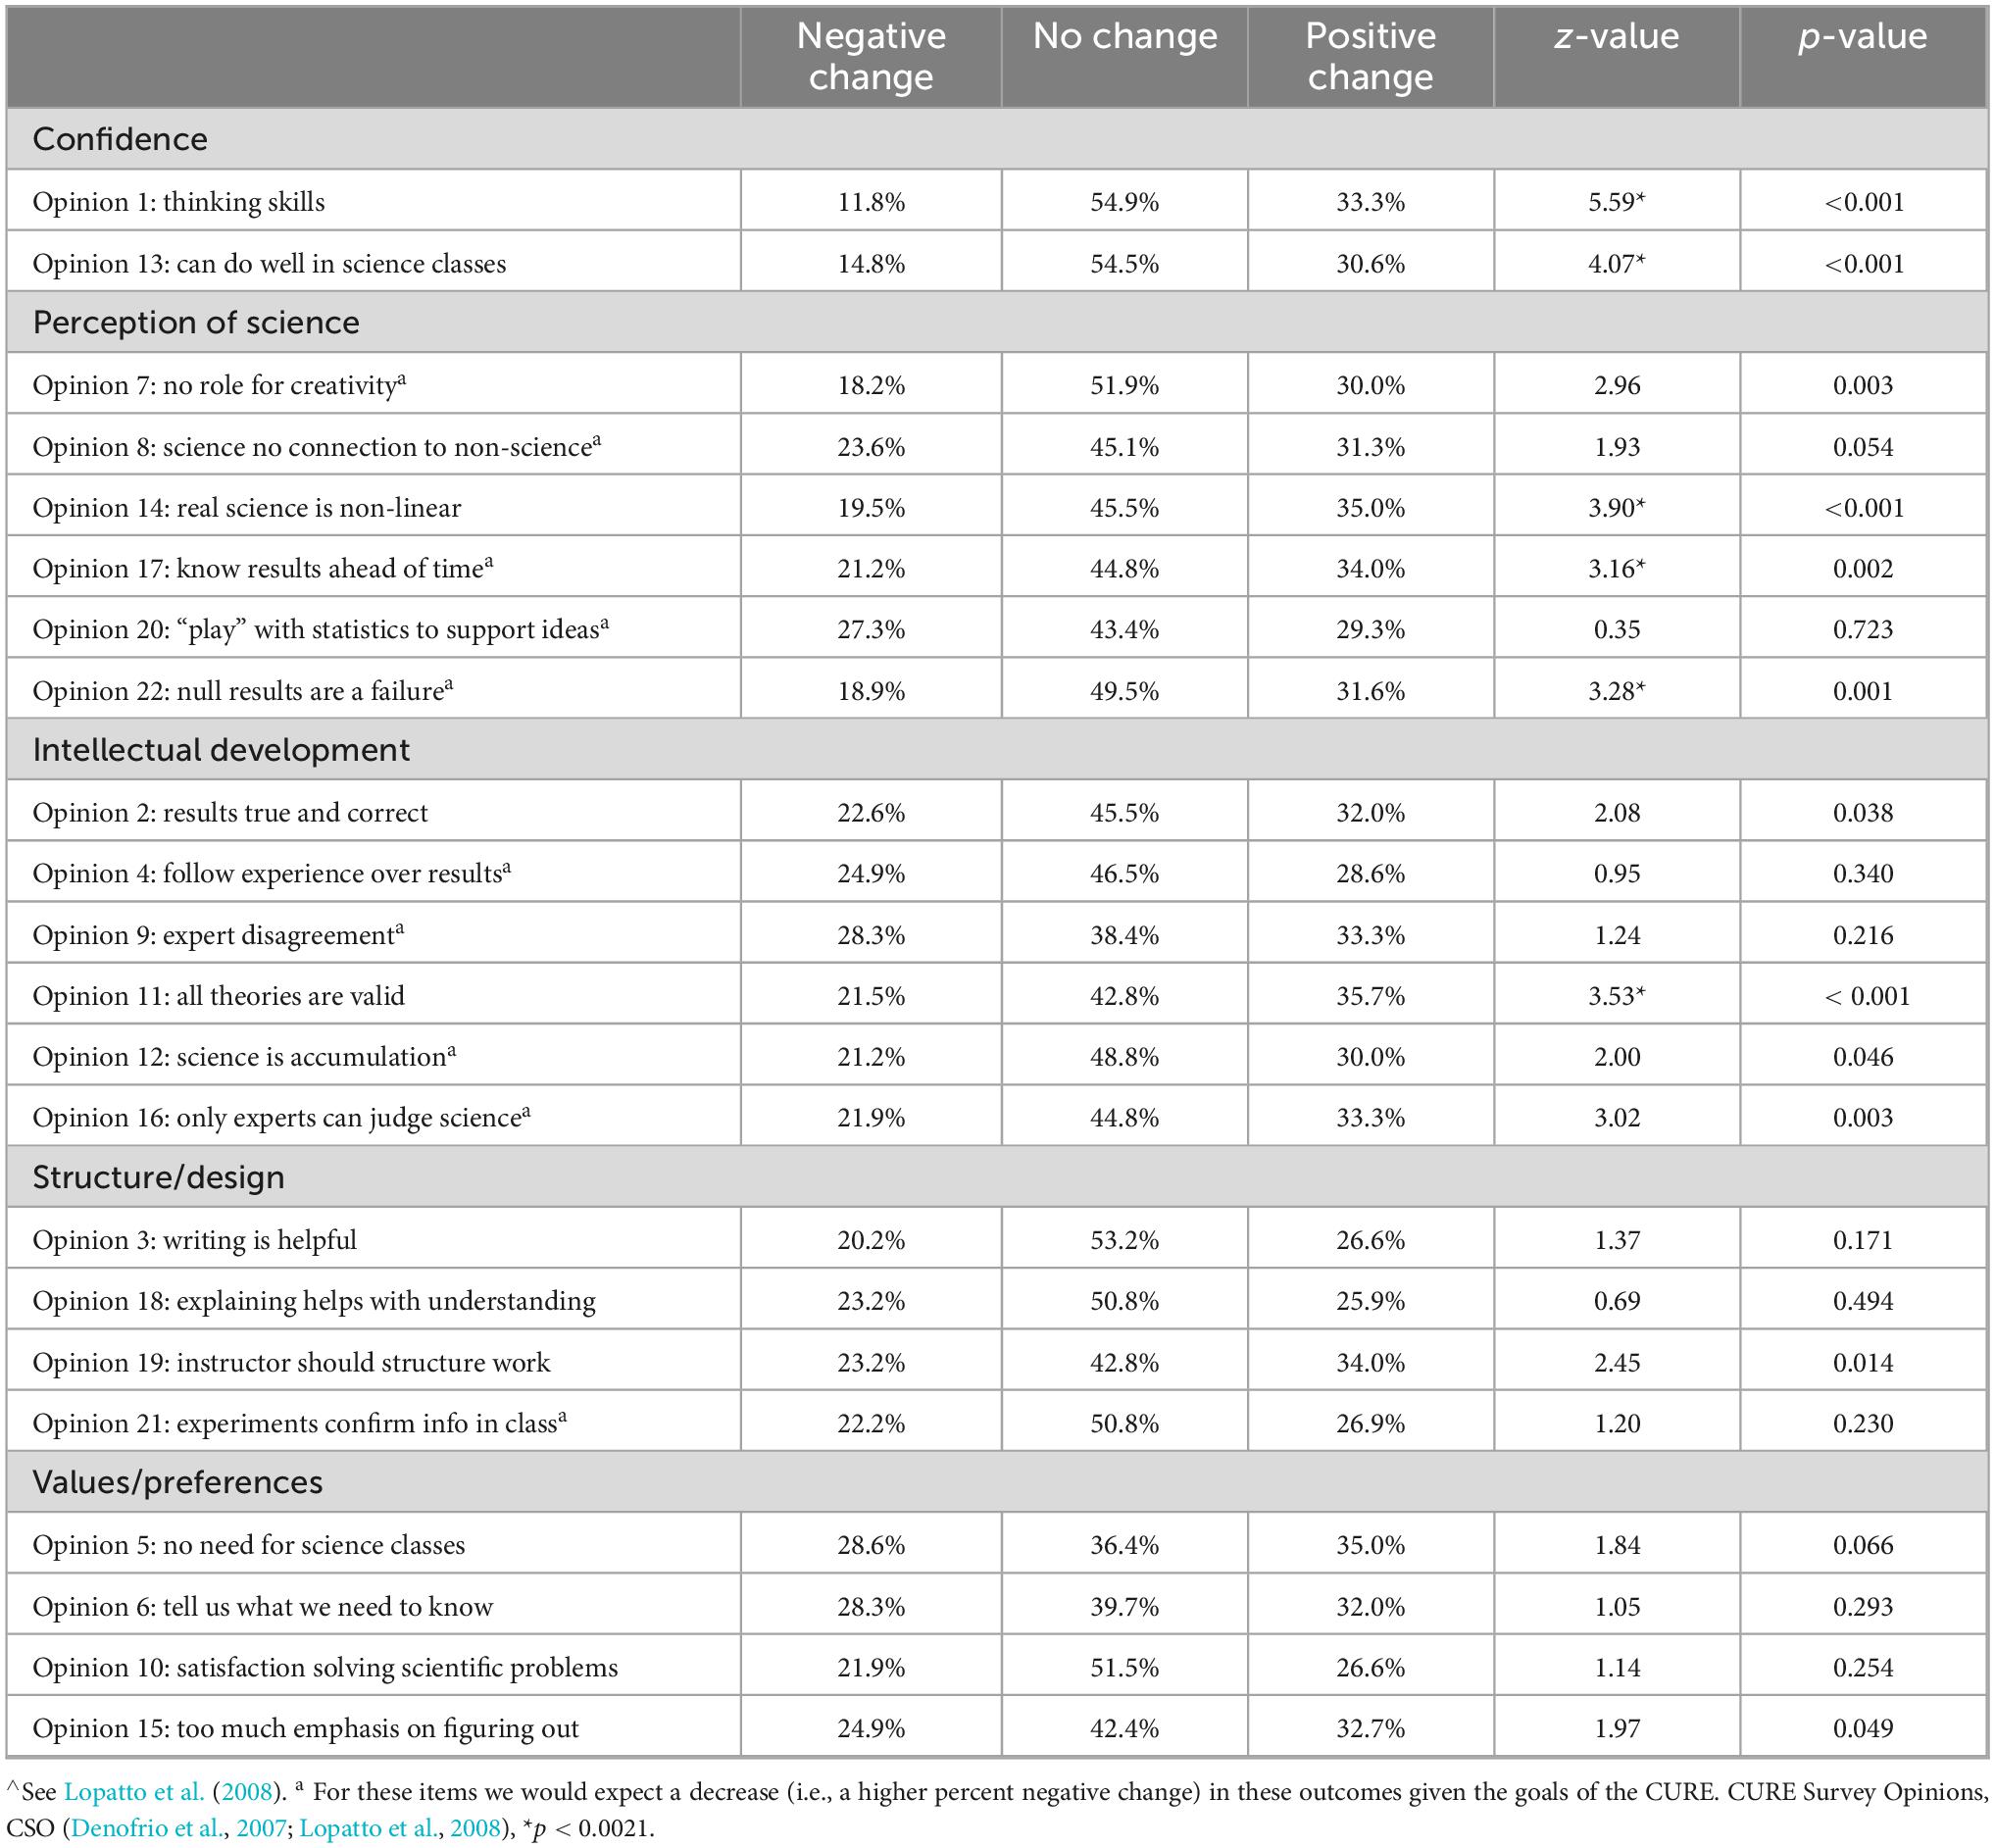
Table 4. RQ3: Wilcoxon test results with percent negative change, no change, and positive change for CURE survey opinions∧, across all students, fall 2016-fall 2019 (n = 297).
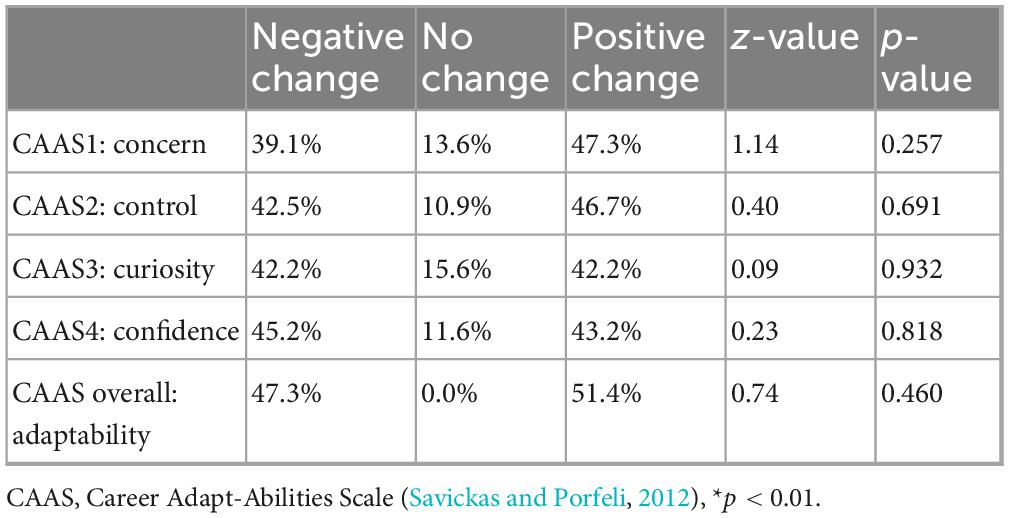
Table 5. Wilcoxon test results with RQ 3: percent negative change, no change, and positive change for CAAS constructs, across all students, fall 2016–fall 2019 (N = 294).
Differences between outcomes in social sciences versus natural sciences CUREs (RQ4)
As noted above, gains in research skills and research design are relatively similar across the natural sciences (N = 259 for CURE Course Elements and N = 125 for EDAT/E-EDAT) and social sciences (N = 38 for CURE Course Elements and N = 15 for EDAT/E-EDAT). In particular, separate models for the two groups confirm significant pre-post increases in the EDAT/E-EDAT (Table 3), and the Kolmogorov-Smirnov results comparing the two indicate the gains are not statistically different for natural science compared to social science. Yet, there are a few statistically significant differences. In the domain of scientific practice skills with the CSCE (Tables 6, 7), unpaired t-tests indicate the gains for students in the social sciences were larger than the gains for students in the natural sciences (though both groups showed positive gains). This was true for writing a research report (p < 0.05), collecting data (p < 0.001), and analyzing data (p < 0.01). To illustrate these differences visually, Figure 1 presents the mean pre–post changes plus or minus two standard error intervals for these three scientific practice skills for the social sciences and natural sciences. The overlap of confidence intervals in Figure 1 for writing a research report deviates from the t-test results because it is showing confidence intervals and not values derived from a t-test. For perceptions of science and self (CSO) (Tables 8, 9) there was one significant difference: On the item of knowing results ahead of time, on average, students in the social sciences showed declines, while students in the natural sciences showed slight increases. Results from Table 7 indicate that about 37% of social science students reported decreases on this item, with 47% reporting no change, and 16% reporting an increase. However, in Table 9, with the results for students in the natural sciences, this is flipped, with about 37% reporting increases on this item, 44% reporting no change, and 19% reporting decreases.
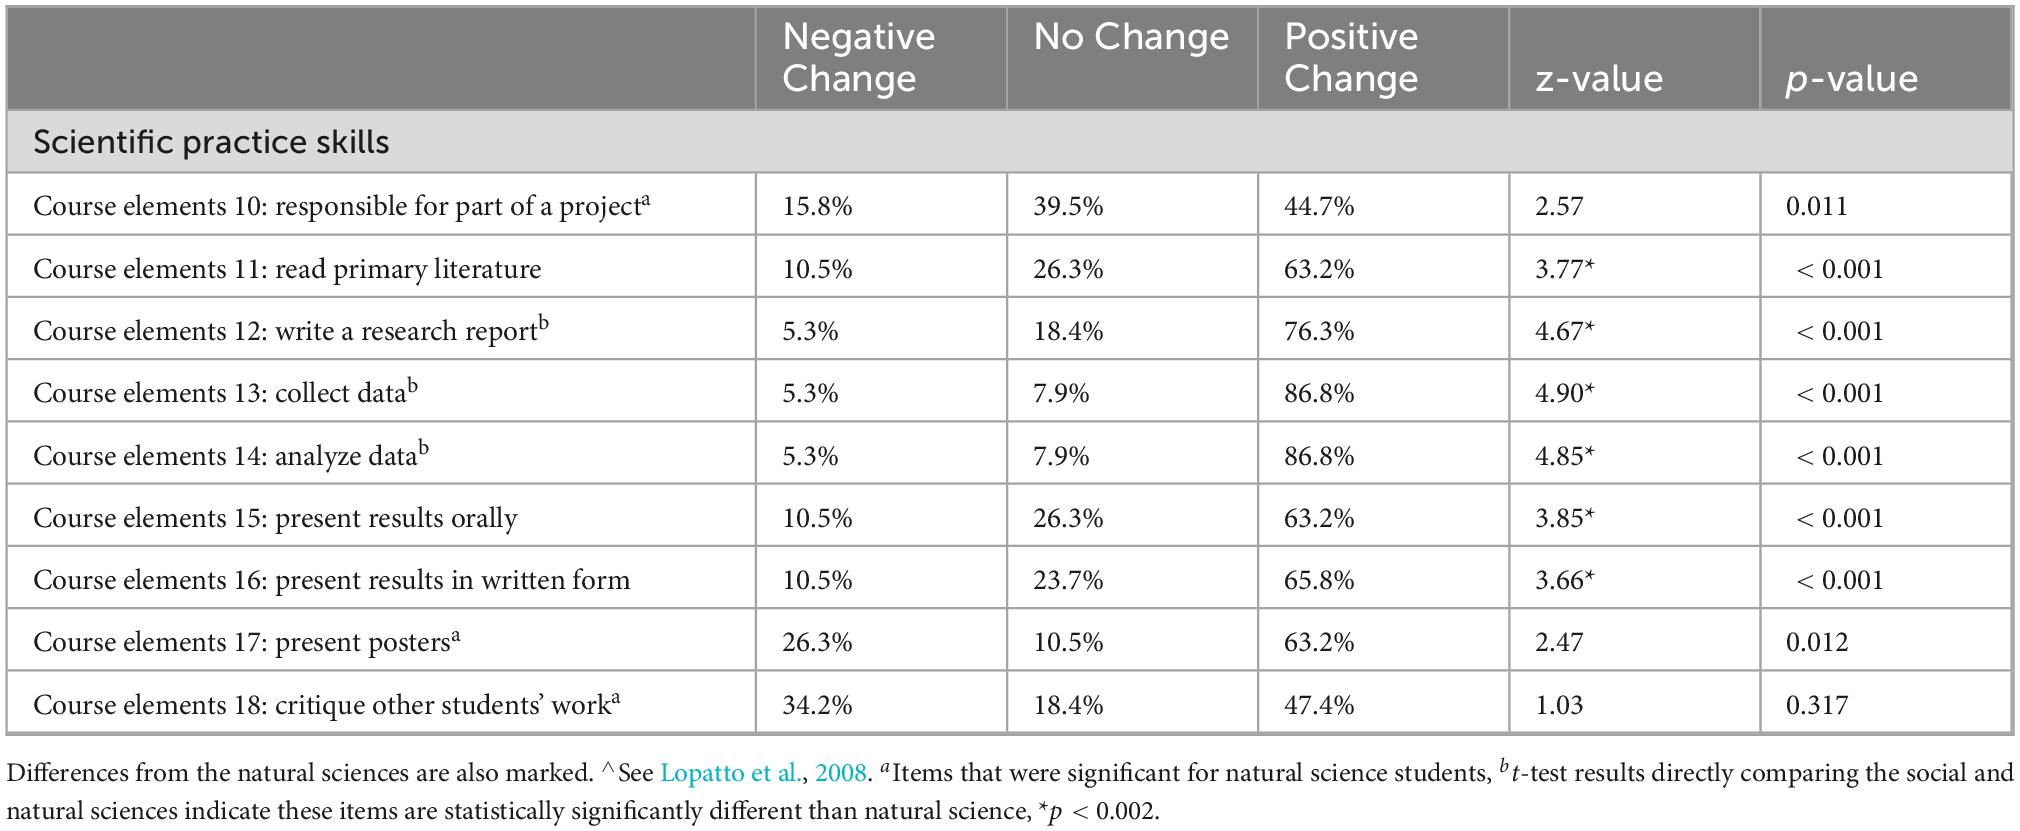
Table 6. RQ4: Wilcoxon test results with percent negative change, no change, and positive change for CURE course elements∧, social science, fall 2016-fall 2019 (n = 38).
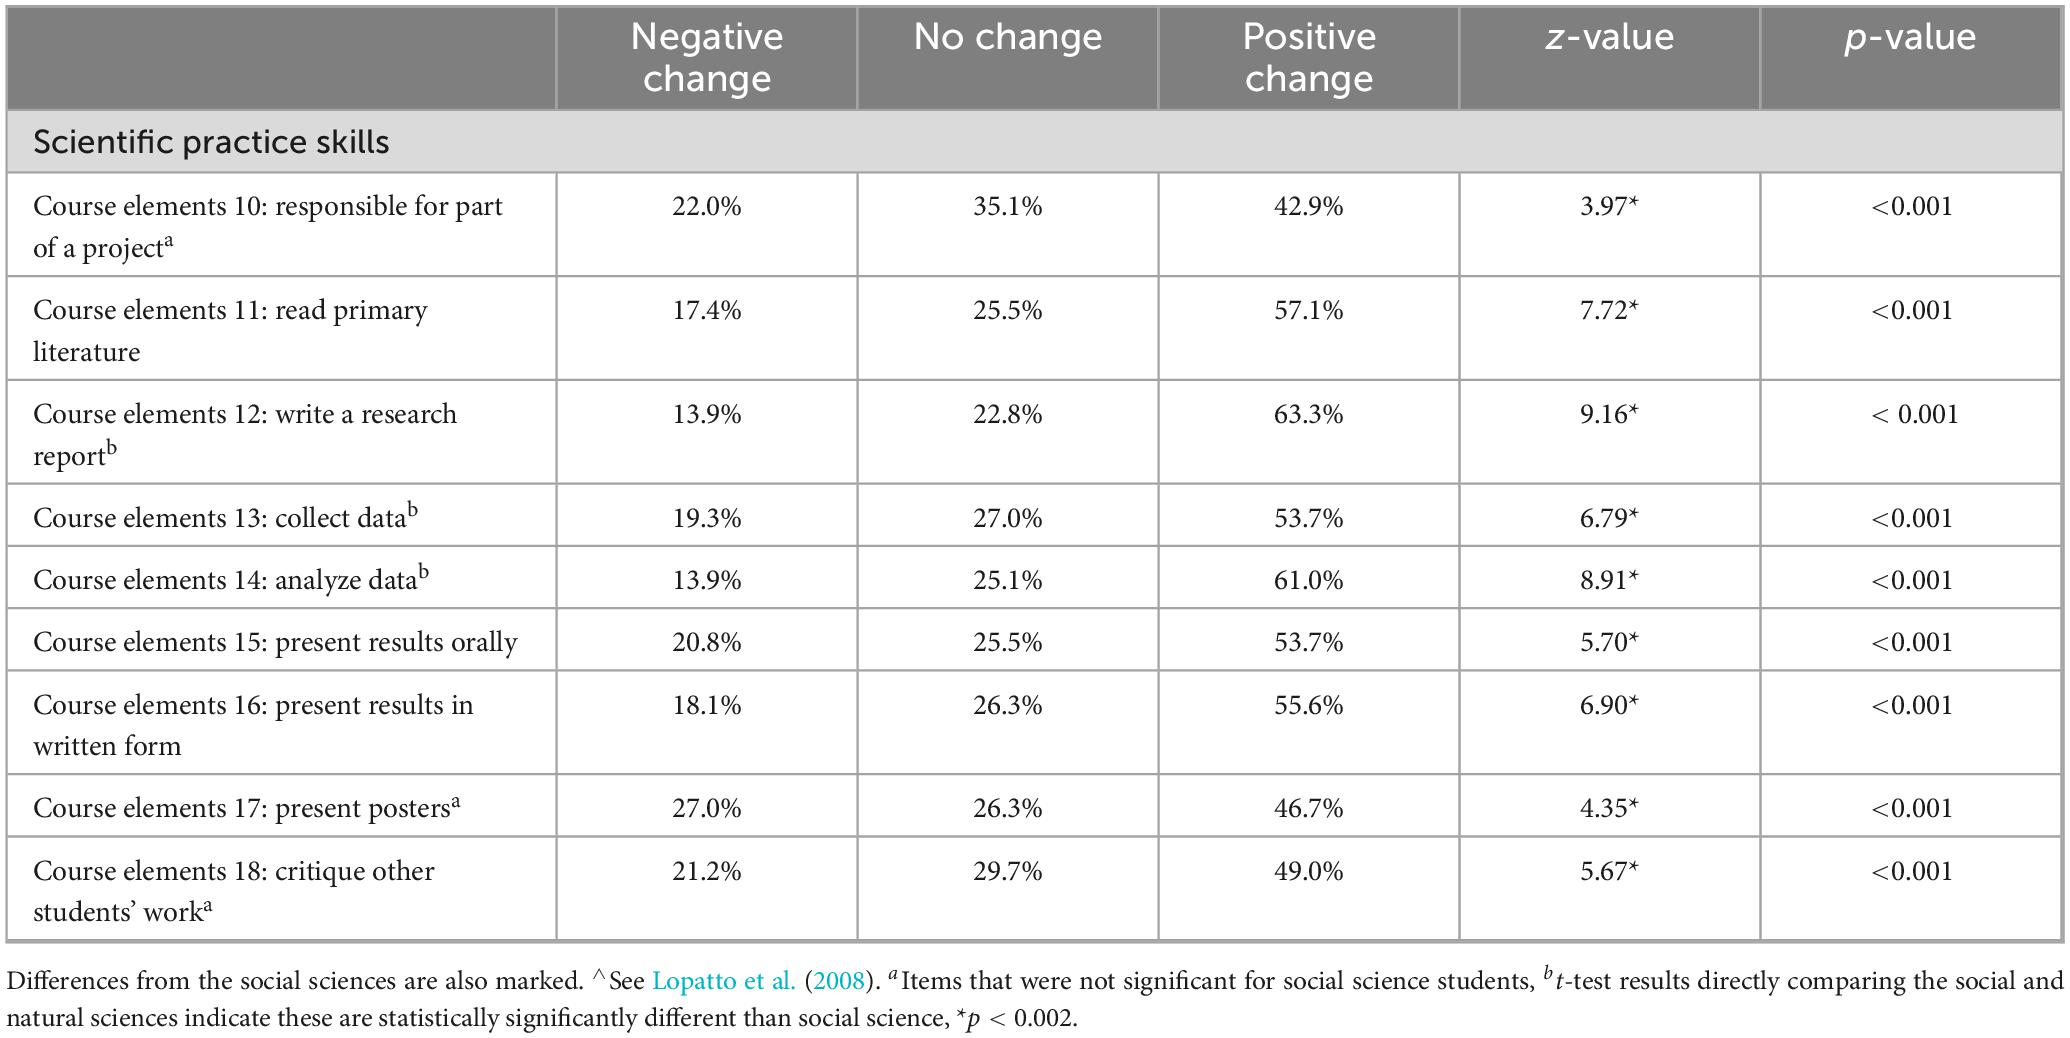
Table 7. RQ 4: Wilcoxon test results with percent negative change, no change, and positive change for CURE course elements∧, natural science, fall 2016-fall 2019 (n = 259).
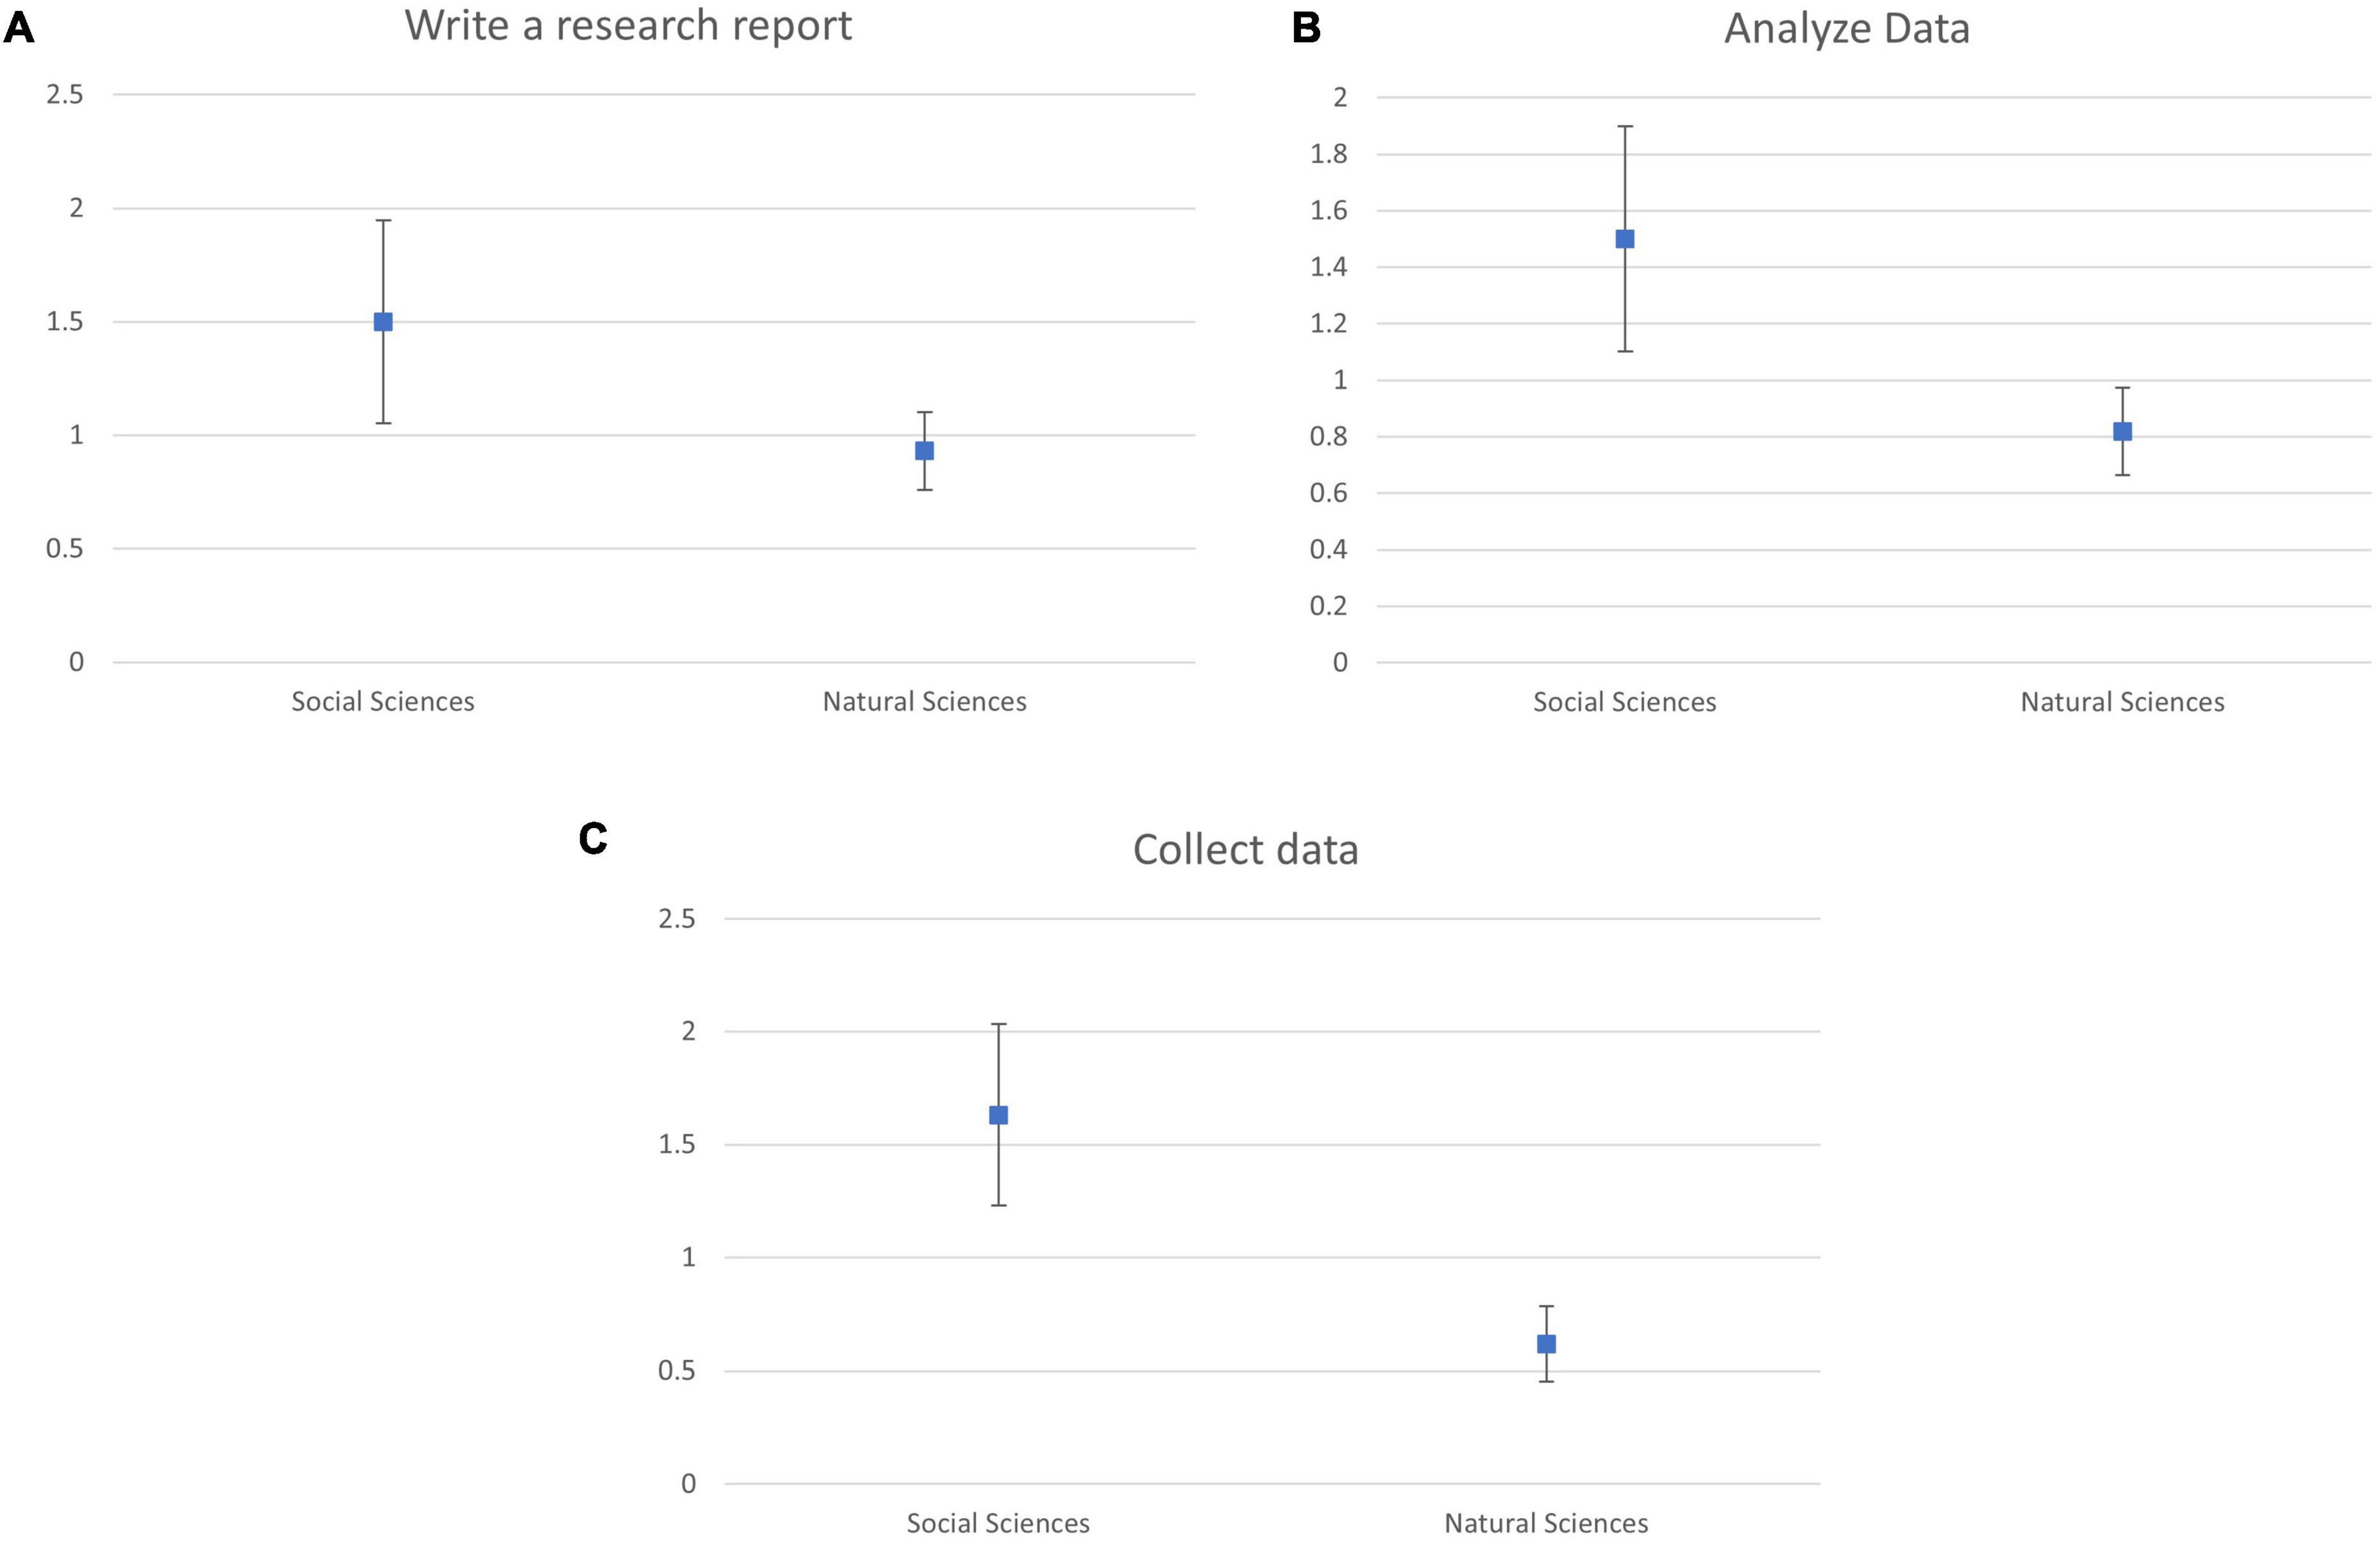
Figure 1. The mean pre-post changes with confidence intervals for the Social Sciences (N = 38) and the Natural Sciences (N = 259) for the CURE Course Elements (Lopatto et al., 2008); The confidence intervals were computed setting α = 0.05 or a 95% confidence level; Write a research report (A), Analyze Data (B) and Collect Data (C).
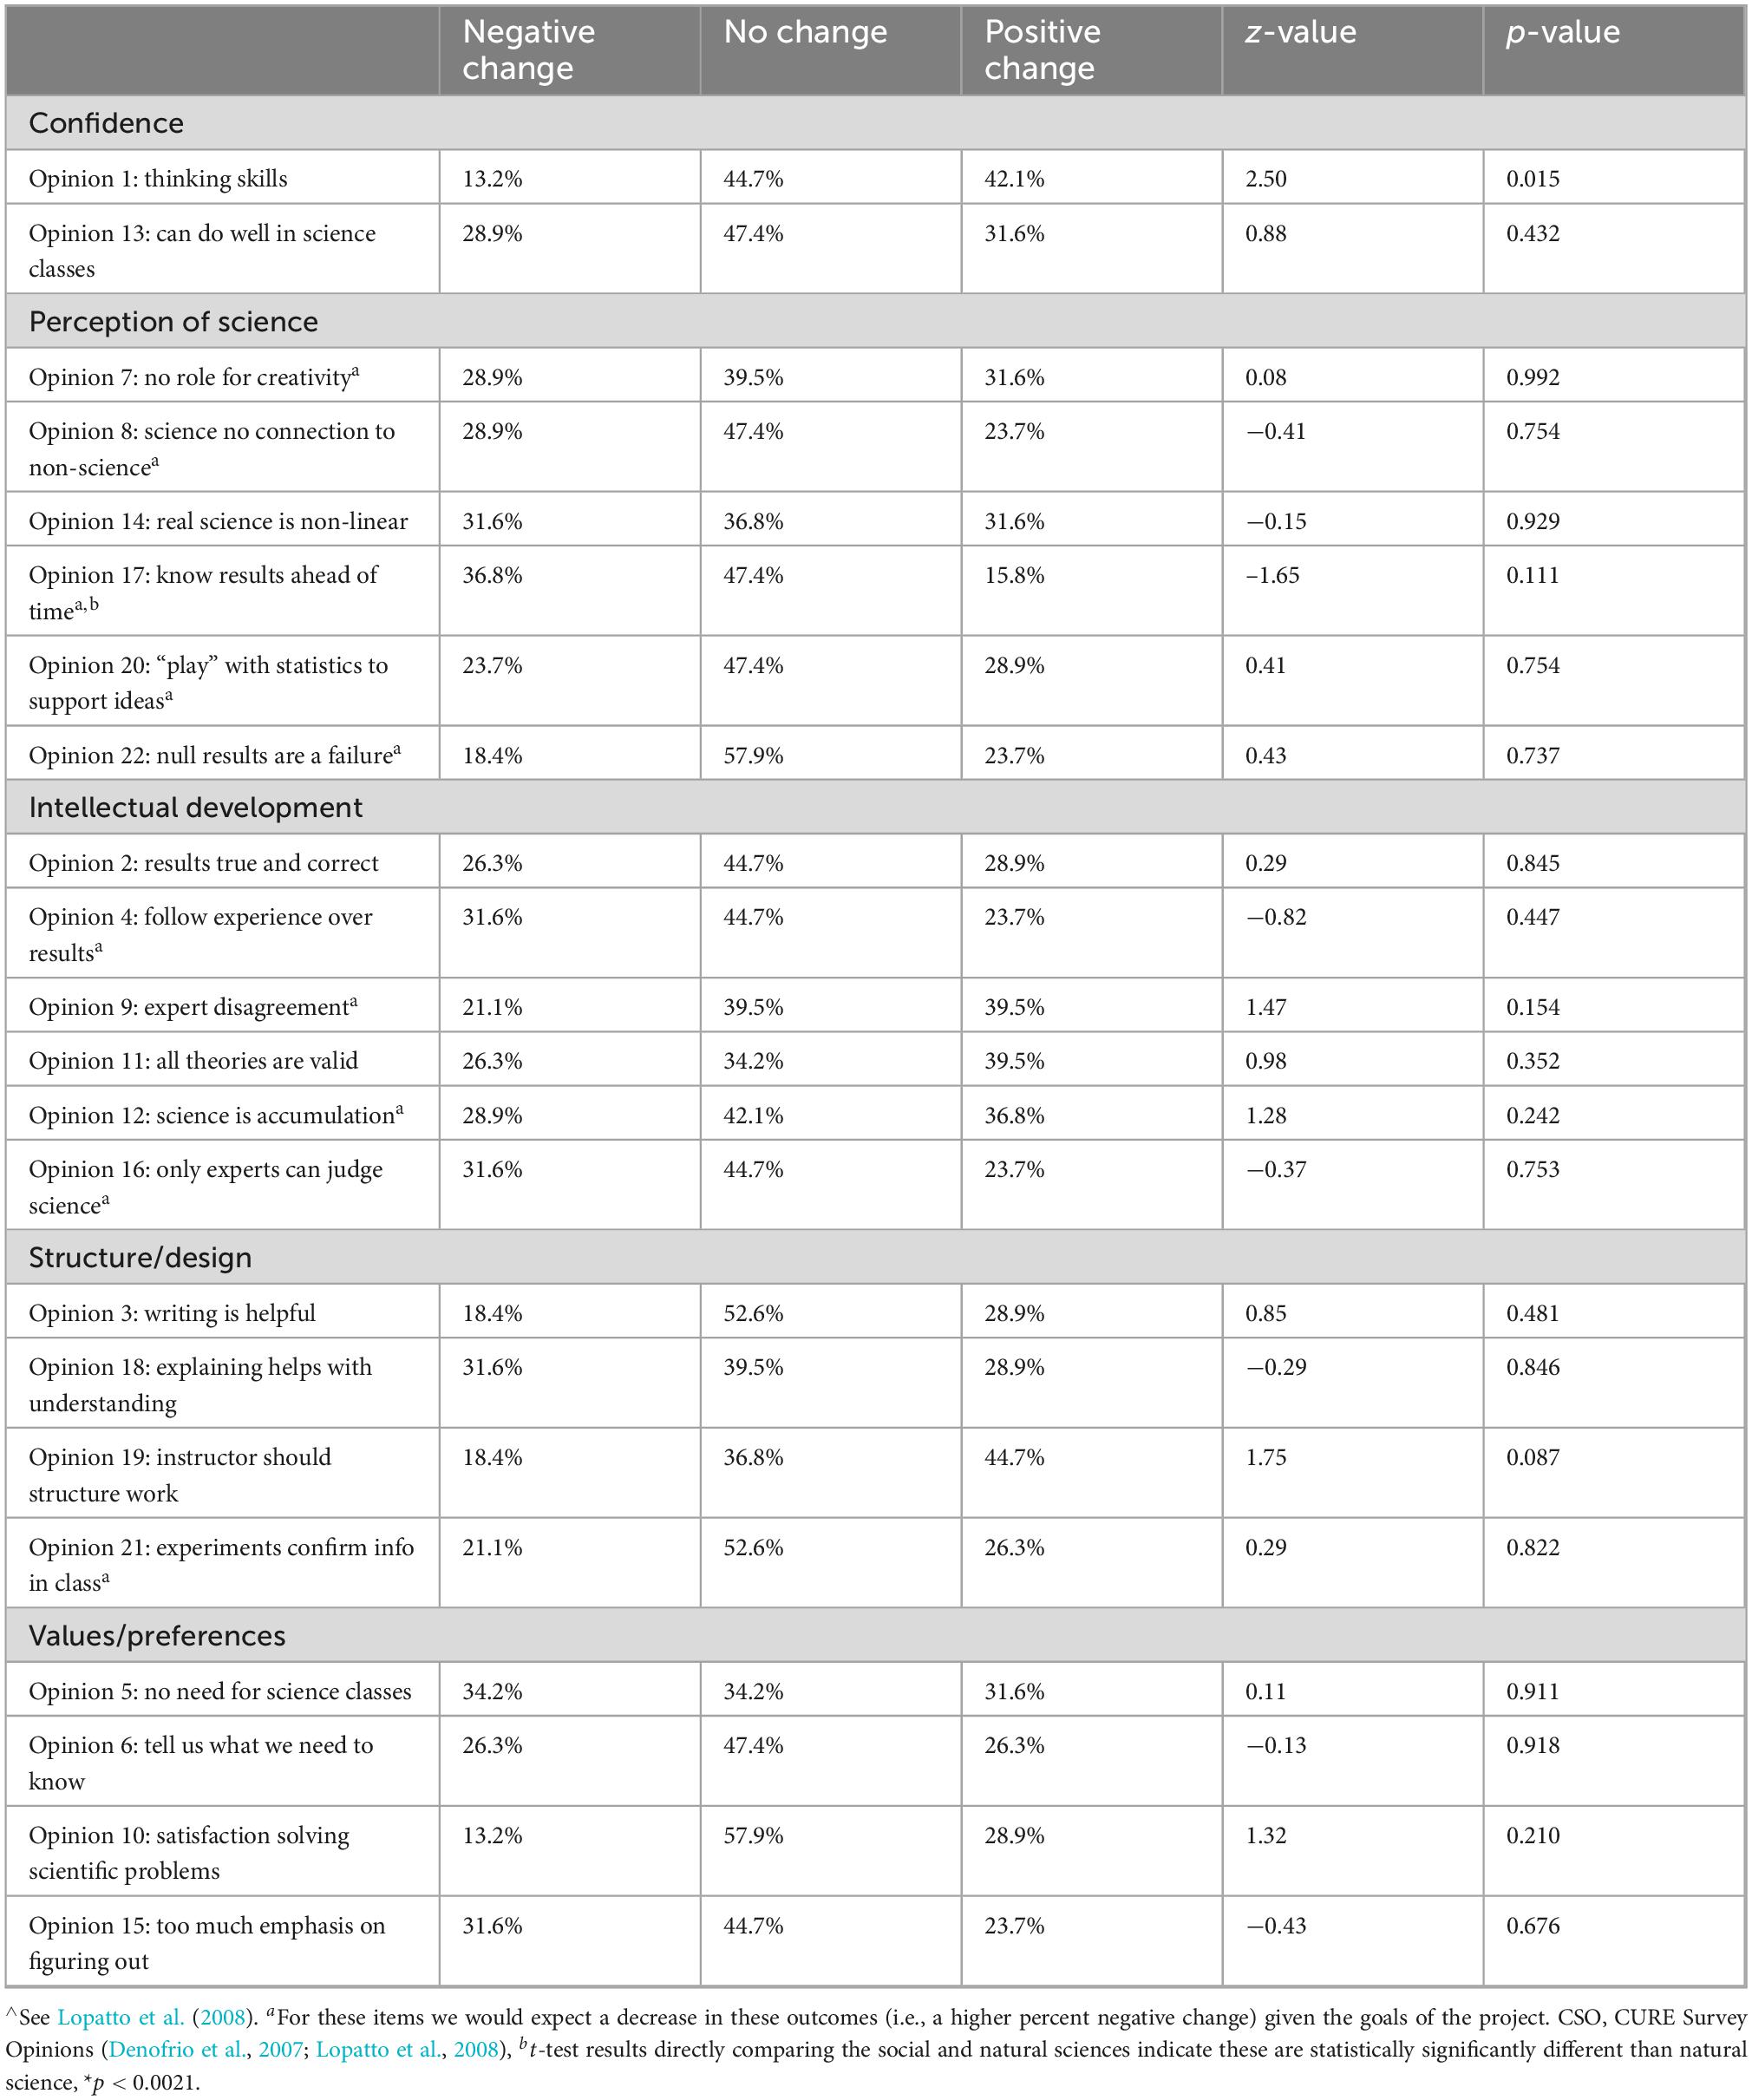
Table 8. RQ 4: Wilcoxon test results with percent negative change, no change, and positive Change for CURE survey opinions∧, social science (N = 38).
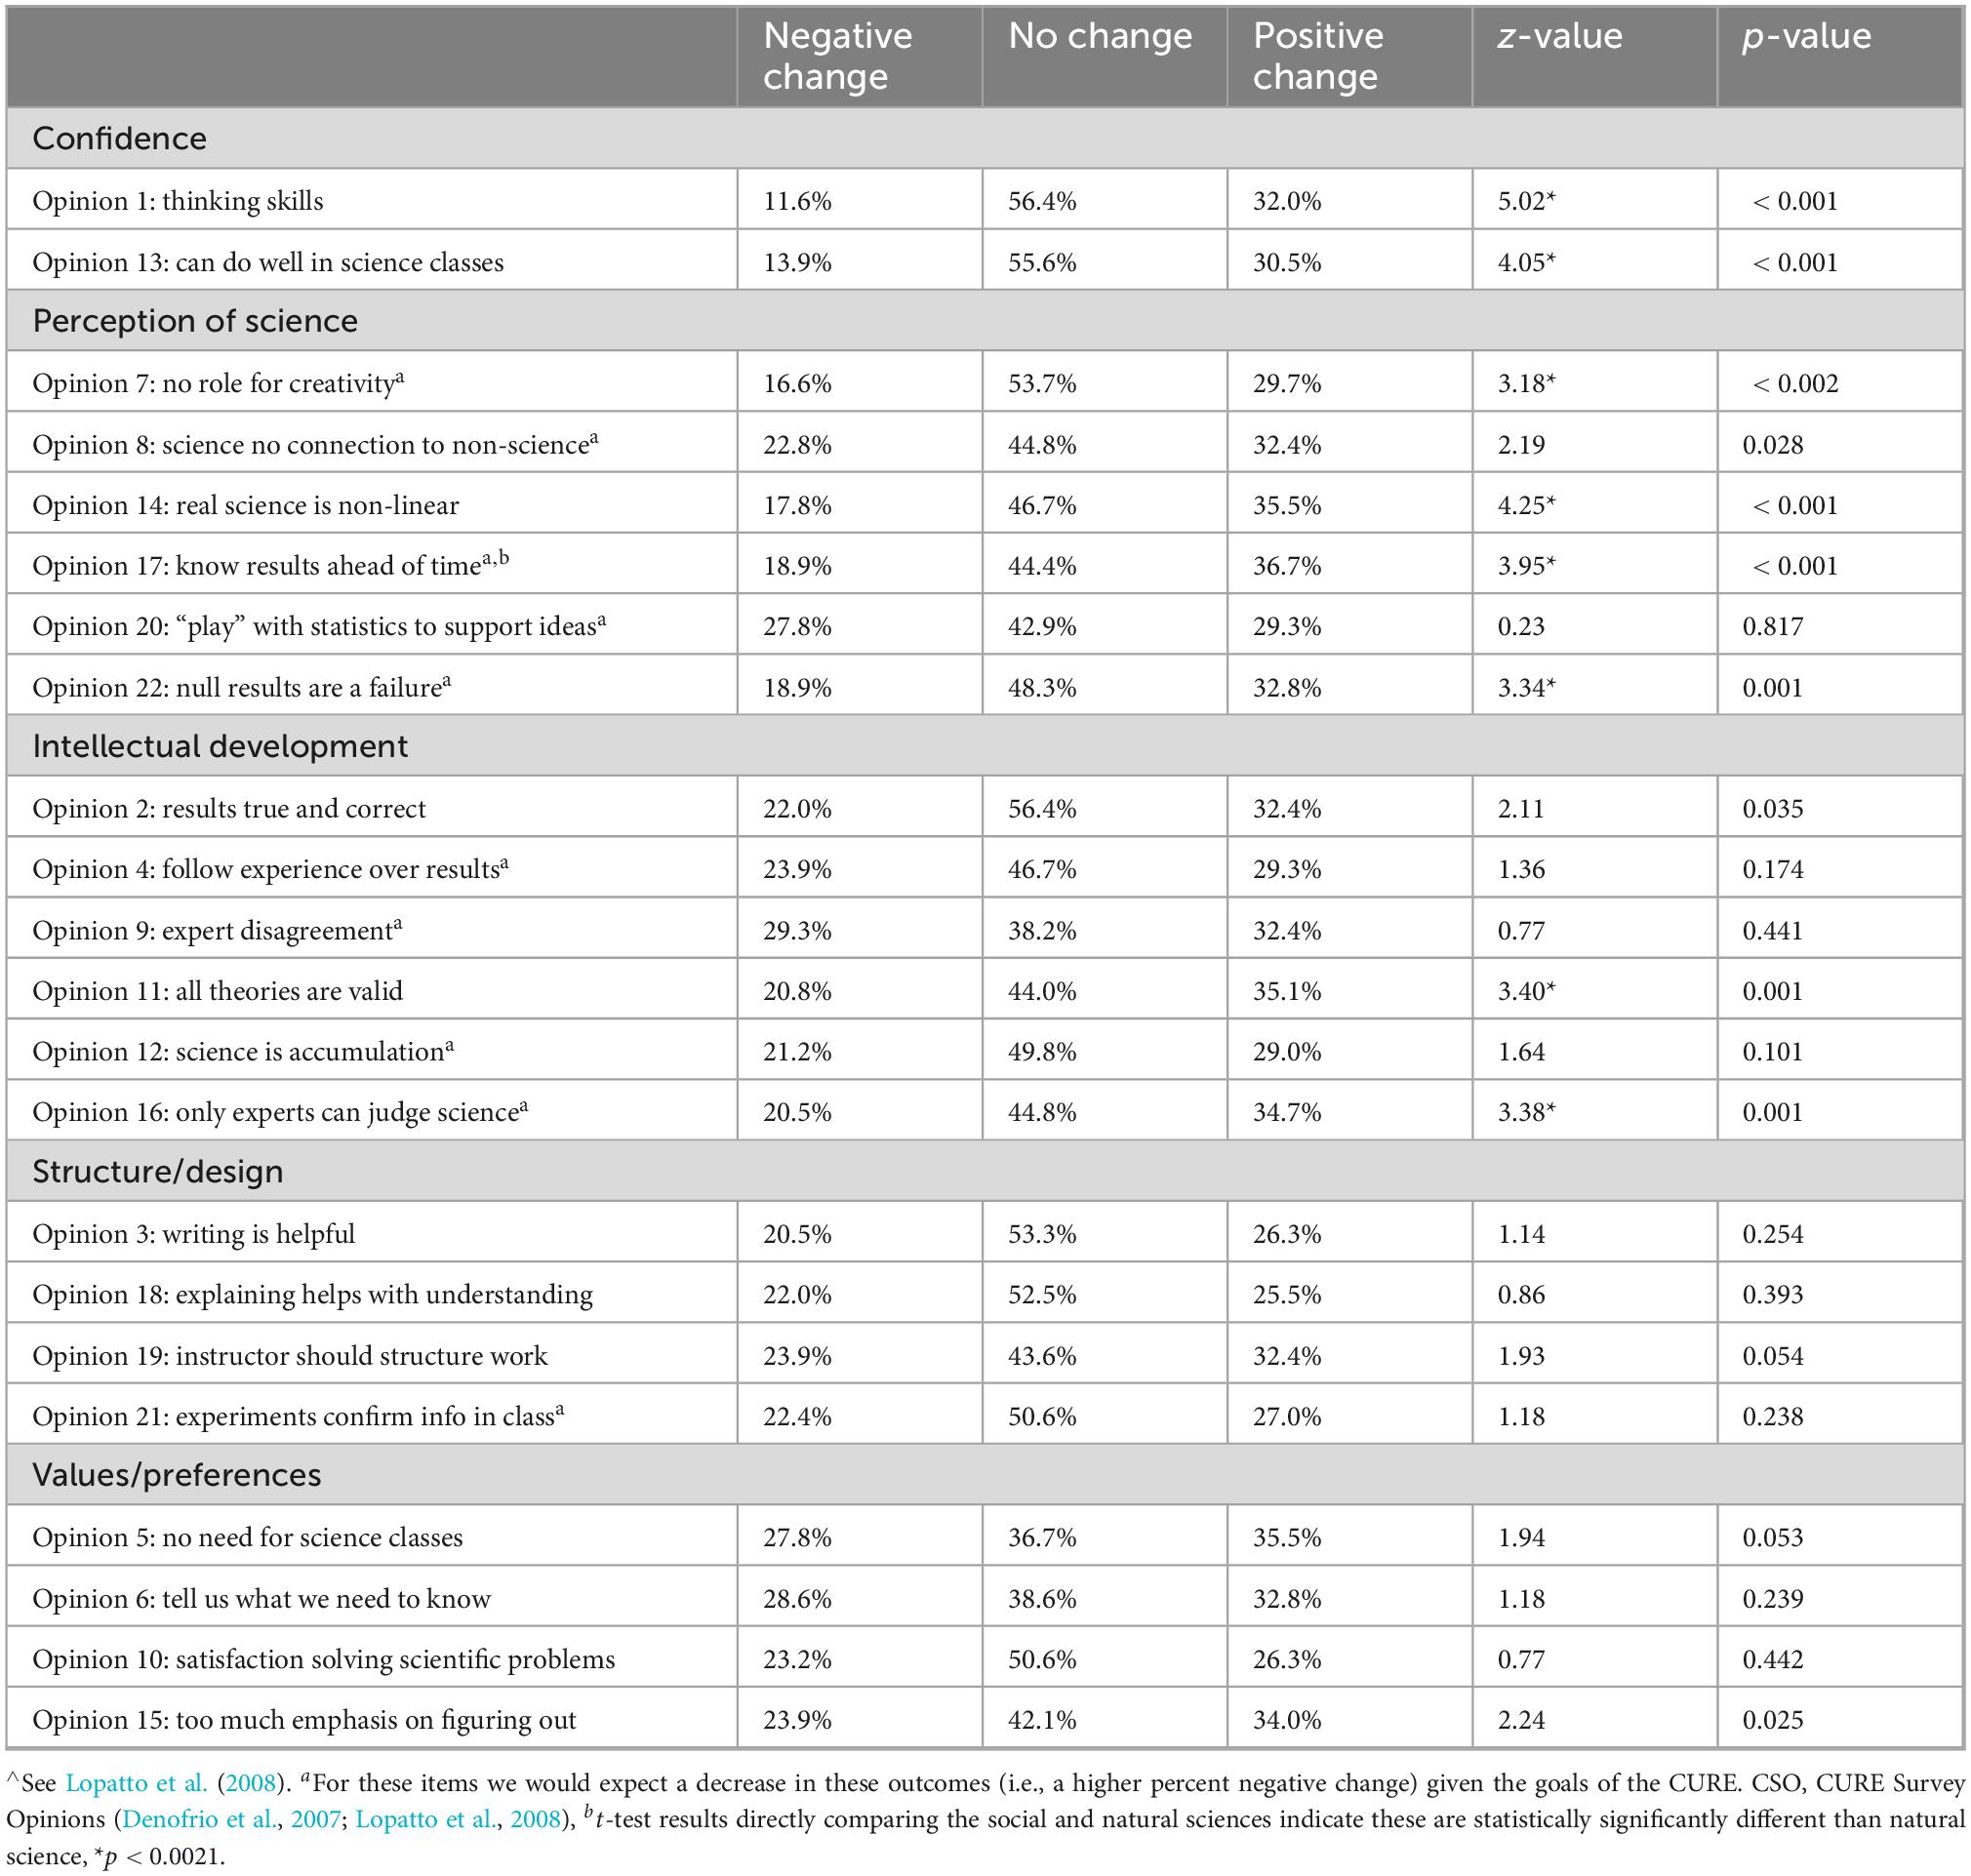
Table 9. RQ 4: Wilcoxon test results with percent negative change, no change, and positive Change for CURE survey opinions∧, natural science (n = 259).
Discussion
Undergraduate research experiences (UREs; apprenticeship-type, often extracurricular) are considered a high-impact practice (Kuh, 2008) that have been shown to enhance understanding of the conduct of research; research and laboratory skills; scientific self-efficacy; and persistence in STEM (Hunter et al., 2007; Russell et al., 2007) and are tied to better graduation rates (Dong et al., 2024). CUREs (course-based, curricular, equitable) promote access and broaden participation by removing some of the main obstacles to URE participation (Bangera and Brownell, 2014; Malcom et al., 2010) thereby reducing equity gaps. The goal of this project was to enhance inclusivity by expanding opportunities for students at an HSI to experience high-impact practices using the CURE model in a variety of disciplines and by determining whether these opportunities translated into enhanced student learning, increased research design skill, psychosocial gains, and were effective in both the natural and social sciences. As a result of this project, students had the opportunity to learn new scientific skills and engage with substantive material in novel ways. The demographic profiles of a majority of participating students reflected those that often do not have as many opportunities to take advantage of apprenticeship experiences outside of the classroom or may not have had the opportunity to develop the skill set necessary to be invited by faculty to work in a laboratory research setting. The CURE courses allowed students to obtain relevant, hands-on research experience across multiple disciplines, without requiring an apprenticeship model, both important goals in the project. Overall our results show a similar trend to our data collected during the pandemic (Broussard et al., 2021).
Learning and skills gains—RQ 1 and 2
For subjective measures of learning gains, we saw significant increases in the CSCE survey from pre to post for scientific practice skills (RQ1). These items include scientific practice “skills” (e.g., oral communication, scientific writing, data analysis, interpretation of results, understanding primary literature, laboratory work, independent and collaborative work) as defined by Hunter et al. (2007). Our findings provide evidence that participating in CURE courses led to significant self-assessed learning gains for many students. For an objective measure of student gains in research design skills we focused on course-specific versions of the EDAT/E-EDAT. Large pre-post gains, indicating improvements in understanding research design from the beginning to the end of the semester, were found. Overall, both subjective and objective measures indicate significant learning gains pre-post CURE semester, answering RQ1 and RQ2. Similar results were found by Delogu et al. (2023) with significant improvements in students’ academic performance (as measured by course grades and GPA) following embedded research experiences in undergraduate courses across disciplines (Delogu et al., 2023) and in Leyser-Whalen and Monteblanco (2022) in sociology courses. These results support the idea that inclusive CUREs can be implemented in a variety of disciplines and yield gains in learning and skills.
Science- and self-perception (psychosocial gains)—RQ3
UREs and CUREs are models of scaffolded communities of practice and represent professional socialization (student valued competence and social acceptance) into the sciences (Brown et al., 1989; Farmer et al., 1992). We probed psychosocial gains (RQ3) in “becoming a scientist”—attitudes and behaviors necessary to become a scientist, including understanding professional practice and the nature of research work, developing an identity as a scientist, disposition for practicing science, and “personal-professional development”—scientific identity and self-efficacy (Hunter et al., 2007), in addition to epistemological development, with the CURE survey opinions (CSO) (RQ3). We predicted but did not find statistically significant gains in both categories of confidence/self-efficacy, which contrasts with (Delogu et al., 2023) who found significant increases in student academic self-efficacy following CURE experiences across several disciplines. We also predicted that the CURE experience would enhance student perceptions of science. We did not see statistically significant gains in the six categories probing student perceptions of science, which does not support the hypothesis that CURE experiences across disciplines promote an increase, again contrasting with Delogu et al. (2023); Miller (2021) who noted self-efficacy and understanding of science process benefits in a community-based research project in an Anthropology course. These disparate findings may be due to differences in CURE design, disciplines included in the study, and assessment tools used to evaluate gains.
Studies have shown that traditional lecture introductory courses in biology (Ding and Mollohan, 2015), chemistry and physics (Adams et al., 2006; Redish, 1999; Zhang and Ding, 2013) result in students regressing, rather than becoming more expert in their thinking (i.e., epistemological development, where epistemology refers to the nature of knowledge and the nature of learning). Conversely, students of the social sciences tend to fall on the more expert end of the epistemology spectrum, believing that knowledge is uncertain, and learning is non—linear (Jehng et al., 1993). The performance of students in the CUREs, therefore, may be influenced by their confidence and identity as a practitioner (e.g., social scientist, natural scientist, designer, etc.) from prior course experiences or may be a function of the varied designs of the CUREs in this study, particularly if the lecture portion of the CURE was unmodified.
We utilized the CSO questions to probe the impact of the CURE on students’ epistemological development. We predicted that several of the intellectual development-related questions on the CSO would reflect students’ transitions to more expert thinking. The statistically significant finding of no change in, ‘since nothing is known for certain, all theories are equally valid,’ suggests that students did not exhibit a shift to transitional knowledge-building. Responses to the remaining five questions did not change significantly. These results suggest there was no epistemological development pre to post.
Given that persistence in STEM and pursuit of graduate training is a highlighted outcome of STEM (Bascom-Slack et al., 2012; Brownell et al., 2012; Dolan, 2016) and non-STEM (Hernandez-Ruiz and Dvorak, 2020) CUREs, we probed career-related outcomes such as ‘enhanced career/graduate school preparation’, benefits to current education, preparation for graduate school, participation in new career-related experiences, preparation for real-world work, and development of professional networks, using the CAAS. We did not see a direct effect following CURE courses on career readiness of students (Fall 2016 through Fall 2019), but this may be due to limitations with the CAAS.
Comparison of natural and social science outcomes—RQ4
Completing a CURE significantly impacted social science and natural science student performances and perceptions, with natural science participants having larger positive gains in scientific practice skills. The CURE survey opinions (CSO) demonstrated no increases or decreases in perception of science for participants of either discipline, except for “knowing results ahead of time” for natural science students. This may be an outcome of how natural science students are introduced to designing experimental questions and hypotheses. Experimental work relies on predictions from the hypotheses, which natural science students may interpret as knowing the results ahead of time.
It has been demonstrated there are differences in student confidence, approach, motivation, and learning style preferences between natural and social science students. Pakistani students majoring in English and Education report higher confidence in their studying and understanding abilities as opposed to Chemistry and Computer Science majors (Shaukat and Bashir, 2016), which is contrary to our findings here. Indonesian natural science students are more motivated and have a different learning style as compared to social science majors (Triyanto and Handayani, 2018). These differences in learning attributes likely explain the dissimilarities we found between the natural and social sciences when they were directly compared for scientific practice skills and CSCE survey (the social sciences group displayed increased positive changes for ‘writing a research report’, and collecting and analyzing data), despite not finding differences between confidence levels between the student groups. Further, the scientific practice skills profiles of social science and natural science students were impacted differently; group work (“responsible for part of a project”), presenting results in real time to others (“present posters”), and providing peer feedback (“critique other students’ work”) were not significant for the social sciences, but exhibited statistically significant learning gains for the natural sciences, highlighting potential differences in instruction that are not currently documented in the published literature and which should be examined.
Overall, implementation of CUREs through this project led to student learning gains, and improved understanding of research design, but no significant change in self-perceptions (confidence, identity, and self-efficacy) across traditional STEM and associated disciplines. Both natural and social science students saw learning and design skills improvements; they differed in specific science skills, and one’s perception of science and self-following CURE completion. Yet, aspects remain to be explored; URM student success, inclusivity, student retention/persistence, and applied learning experiences embedded into the curriculum are often buzz words included in institutional and program learning outcomes without measures that transcend disciplines. This initial study aimed to evaluate those measures across 4 years and within traditional STEM and associated undergraduate programs at a private HSI. A manuscript in preparation will delve into more details of CURE courses and impacts on faculty.
Our study was not without limitations. Although there were significant gains, for a few students EDAT/E-EDAT scores went down, possibly reflecting external issues such as stress, being over-extended at the end of the semester, familial issues, etc. We suggest that future implementation of the EDAT or E-EDAT incorporate questions that capture the students’ perceptions of their own stress and work-life balance (Avdija, 2018) in order to evaluate whether decreases in post-EDAT/E-EDAT scores were due to influences outside of the classroom. Further, the sample size for the social sciences was small, although not too small to analyze for significance. However, a larger sample size may identify additional significant changes through sample representation. At a small institution like ours, there are more limited opportunities for offering multiple sections of a single course in the social sciences each year in comparison to some of the natural science fields. Future research might consider a comparison of pre-surveys of students with no prior exposures to CUREs and other high impact practices and one or more prior CURE exposures to understand how much the pre-scores vary. Additional directions should include comparisons of social and natural science curriculum to pinpoint how the differences in course work (type) within the natural and social sciences fields (e.g., group work, presentations, etc.) impact learning gains across the groups.
Data availability statement
The raw data supporting the conclusions of this article cannot be made available due to IRB restrictions.
Ethics statement
The studies involving humans were approved by University of La Verne Institutional Review Board (2017-13-CAS). The studies were conducted in accordance with the local legislation and institutional requirements. The participants provided their written informed consent to participate in this study.
Author contributions
CB: Conceptualization, Data curation, Funding acquisition, Investigation, Methodology, Project administration, Resources, Supervision, Writing – original draft, Writing – review and editing. MG: Conceptualization, Data curation, Formal Analysis, Funding acquisition, Investigation, Methodology, Resources, Software, Supervision, Validation, Writing – review and editing, Writing – original draft. SD: Conceptualization, Funding acquisition, Investigation, Methodology, Resources, Writing – review and editing, Writing – original draft. KG: Conceptualization, Data curation, Funding acquisition, Investigation, Methodology, Resources, Writing – review and editing, Writing – original draft. VP: Conceptualization, Formal Analysis, Funding acquisition, Investigation, Methodology, Resources, Visualization, Writing – review and editing, Writing – original draft.
Funding
The author(s) declare that financial support was received for the research and/or publication of this article. This project was supported by an Undergraduate Education Program grant from the W.M. Keck Foundation. Any opinions, findings, and conclusions or recommendations expressed in this publication are those of the authors and do not necessarily reflect the views of the W.M. Keck Foundation.
Conflict of interest
The authors declare that the research was conducted in the absence of any commercial or financial relationships that could be construed as a potential conflict of interest.
Generative AI statement
The authors declare that no Generative AI was used in the creation of this manuscript.
Publisher’s note
All claims expressed in this article are solely those of the authors and do not necessarily represent those of their affiliated organizations, or those of the publisher, the editors and the reviewers. Any product that may be evaluated in this article, or claim that may be made by its manufacturer, is not guaranteed or endorsed by the publisher.
Supplementary material
The Supplementary Material for this article can be found online at: https://www.frontiersin.org/articles/10.3389/feduc.2025.1593436/full#supplementary-material
References
Adams, W. K., Perkins, K. K., Podolefsky, N. S., Dubson, M., Finkelstein, N. D., and Wieman, C. E. (2006). New instrument for measuring student beliefs about physics and learning physics: The colorado learning attitudes about science survey. Phys. Rev. Spec. Top. Phys. Educ. Res. 2:10101. doi: 10.1103/PhysRevSTPER.2.010101
Auchincloss, L. C., Laursen, S. L., Branchaw, J. L., Eagan, K., Graham, M., Hanauer, D. I., et al. (2014). Assessment of course-based undergraduate research experiences: A meeting report. CBE—Life Sci. Educ. 13, 29–40. doi: 10.1187/cbe.14-01-0004
August, S. E. (2021). Envisioning dimensions of equity in an academic ecosystem: How disruption allows Us to reimagine convergent stem ecosystems. Am. Assoc. Advan. Sci. Improv. Undergraduate Stem Educ. Initiative.
Avdija, A. S. (2018). College stress: Testing the unidimensionality of a standardized stress measuring inventory designed to assess stress among. Children Teenagers 1:68. doi: 10.22158/ct.v1n2p68
Bangera, G., and Brownell, S. E. (2014). Course-Based undergraduate research experiences can make scientific research more inclusive. CBE—Life Sci. Educ. 13, 602–606. doi: 10.1187/cbe.14-06-0099
Bascom-Slack, C. A., Arnold, A. E., and Strobel, S. A. (2012). Student-Directed discovery of the plant microbiome and its products. Science 338, 485–486. doi: 10.1126/science.1215227
Bauman, D. (2024). Colleges were already bracing for an ‘enrollment cliff.’ now there might be a second one. Chronicle Higher Educ.
Boeckenstedt, J. (2022). Will your college survive the demographic cliff: National trends are interesting-but enrolling students is a local challenge. Chronicle Higher Educ. 68.
Broussard, C., Courtney, M. G., Dunn, S., Godde, K., and Preisler, V. (2021). Course-Based undergraduate research experiences performance following the transition to remote learning during the COVID-19 pandemic. J. College Sci. Teach. 51, 27–41. doi: 10.1080/0047231X.2021.12290539
Brown, J. S., Collins, A., and Duguid, P. (1989). Situated cognition and the culture of learning. Educ. Res. 18, 32–42. doi: 10.3102/0013189X018001032
Brownell, S. E., and Kloser, M. J. (2015). Toward a conceptual framework for measuring the effectiveness of course-based undergraduate research experiences in undergraduate biology. Stud. Higher Educ. 40, 525–544. doi: 10.1080/03075079.2015.1004234
Brownell, S. E., Matthew, J., Kloser, Fukami, T., and Shavelson, R. (2012). Undergraduate biology lab courses: Comparing the impact of traditionally based “cookbook” and authentic research-based courses on student lab experiences. J. College Sci. Teach. 41, 36–45.
Cancilla, D., and Albon, S. (2017). Should we continue to provide life support to the traditional undergraduate teaching laboratory or is it time to let it go? Int. J. Innov. Online Educ. 1:2017. doi: 10.1615/IntJInnovOnlineEdu.2017015277
Corwin, L. A., Graham, M. J., and Dolan, E. L. (2015). Modeling course-based undergraduate research experiences: An agenda for future research and evaluation. CBE—Life Sci. Educ. 14:es1. doi: 10.1187/cbe.14-10-0167
Cuthbert, D., Arunachalam, D., and Licina, D. (2012). ‘It feels more important than other classes I have done’: An ‘authentic’ undergraduate research experience in sociology. Stud. Higher Educ. 37, 129–142. doi: 10.1080/03075079.2010.538473
Delogu, F., Nelson, M., Timmons, S. C., Weinstein, M., Bhattacharya, B., Jaussen, P., et al. (2023). A systemic transformation of an arts and sciences curriculum to nurture inclusive excellence of all students through course-based research experiences. Front. Educ. 8:1142572. doi: 10.3389/feduc.2023.1142572
Denofrio, L. A., Russell, B., Lopatto, D., and Lu, Y. (2007). Linking student interests to science curricula. Science 318, 1872–1873. doi: 10.1126/science.1150788
Desai, K. V., Gatson, S. N., Stiles, T. W., Stewart, R. H., Laine, G. A., and Quick, C. M. (2008). Integrating research and education at research-extensive universities with research-intensive communities. Adv. Physiol. Educ. 32, 136–141. doi: 10.1152/advan.90112.2008
Ding, L., and Mollohan, K. N. (2015). How college-level introductory instruction can impact student epistemological beliefs. J. College Sci. Teach. 44, 19–27. doi: 10.2505/4/jcst15_044_04_19
Dolan, E. L. (2016). Course-based undergraduate research experiences: Current knowledge and future directions. Natl. Res. Counc. Comm. Pap. 1, 1–34.
Dong, W., Eddy, R. M., Mendelsohn, D. M., Koletar, C., Matelski, M., and Barraza, E. (2024). Effects of research-related activities on graduation at a hispanic serving institution. J. Coll. Student Retent. Res. Theory Pract. 26, 126–150. doi: 10.1177/15210251211065099
Farmer, J. A., Buckmaster, A., and LeGrand, B. (1992). Cognitive apprenticeship: Implications for continuing professional education. New Direct. Adult Continuing Educ. 1992, 41–49. doi: 10.1002/ace.36719925506
Finley, A., and Tia Brown, M. (2013). Assessing underserved students’ engagement in high-impact practices. Washington, DC: American Association of Colleges and Universities.
Fry, R., Brian, K., and Cary, F. (2021). STEM jobs see uneven progress in increasing gender, racial and ethnic diversity (No. 202.419.4372). Washington, D.C: Pew Research Center.
García-Morales, V. J., Garrido-Moreno, A., and Martín-Rojas, R. (2021). The transformation of higher education after the COVID disruption: Emerging challenges in an online learning scenario. Front. Psychol. 12:616059. doi: 10.3389/fpsyg.2021.616059
Gin, L. E., Pais, D., Cooper, K. M., and Brownell, S. E. (2022). Students with disabilities in life science undergraduate research experiences: Challenges and opportunities. CBE—Life Sci. Educ. 21:ar32. doi: 10.1187/cbe.21-07-0196
Gin, L. E., Rowland, A. A., Steinwand, B., Bruno, J., and Corwin, L. A. (2018). Students who fail to achieve predefined research goals may still experience many positive outcomes as a result of CURE participation. CBE—Life Sci. Educ. 17:ar57. doi: 10.1187/cbe.18-03-0036
Graham, M. J., Frederick, J., Byars-Winston, A., Hunter, A.-B., and Handelsman, J. (2013). Science education. Increasing persistence of college students in STEM. Science 341, 1455–1456. doi: 10.1126/science.1240487
Harrison, M., Dunbar, D., Ratmansky, L., Boyd, K., and Lopatto, D. (2011). Classroom-Based science research at the introductory level: Changes in career choices and attitude. CBE—Life Sci. Educ. 10, 279–286. doi: 10.1187/cbe.10-12-0151
Hernandez-Ruiz, E., and Dvorak, A. L. (2020). Replication of a course-based undergraduate research experience for music students. Nordic J. Music Therapy 29, 317–333. doi: 10.1080/08098131.2020.1737186
Herreid, C. F. (1998). Why isn’t cooperative learning used to teach science? BioScience 48, 553–559. doi: 10.2307/1313317
Hosein, A., and Rao, N. (2017). Students’ reflective essays as insights into student centred-pedagogies within the undergraduate research methods curriculum. Teach. Higher Educ. 22, 109–125. doi: 10.1080/13562517.2016.1221804
Hue, G., Sales, J., Comeau, D., Lynn, D. G., and Eisen, A. (2010). The american science pipeline: Sustaining innovation in a time of economic crisis. CBE—Life Sci. Educ. 9, 431–434. doi: 10.1187/cbe.09-12-0091
Hunter, A., Laursen, S. L., and Seymour, E. (2007). Becoming a scientist: The role of undergraduate research in students’ cognitive, personal, and professional development. Sci. Educ. 91, 36–74. doi: 10.1002/sce.20173
Jehng, J.-C. J., Johnson, S. D., and Anderson, R. C. (1993). Schooling and students′ epistemological beliefs about learning. Contemp. Educ. Psychol. 18, 23–35. doi: 10.1006/ceps.1993.1004
Kilgo, C. A., Ezell Sheets, J. K., and Pascarella, E. T. (2015). The link between high-impact practices and student learning: Some longitudinal evidence. Higher Educ. 69, 509–525. doi: 10.1007/s10734-014-9788-z
Kuh, G. D. (2008). High-Impact educational practices: What they are, who has acces to them, and why they matter, 1st Edn. Washington, D.C: American Association of Colleges & Universities.
Lewis, S. E., Conley, L. K., and Horst, C. J. (2003). Structuring research opportunities for all biology majors. Bioscene 29, 9–14.
Leyser-Whalen, O., and Monteblanco, A. D. (2022). Course-based undergraduate research experiences (CUREs) in general education courses. UI J. 13:36519.
Lopatto, D. (2004). Survey of Undergraduate Research Experiences (SURE): First findings. Cell Biol. Educ. 3, 270–277. doi: 10.1187/cbe.04-07-0045
Lopatto, D. (2007). Undergraduate research experiences support science career decisions and active learning. CBE—Life Sci. Educ. 6, 297–306. doi: 10.1187/cbe.07-06-0039
Lopatto, D. (2010). Science in solution: The impact of undergraduate research on student learning. Washington, DC: Council on Undergraduate Research and Tucson, AZ: Research Corporation for Science Advancement.
Lopatto, D., Alvarez, C., Barnard, D., Chandrasekaran, C., Chung, H.-M., Du, C., et al. (2008). Genomics education partnership. Science 322, 684–685. doi: 10.1126/science.1165351
Malcom, L. E., Dowd, A. C., and Yu, T. (2010). Tapping HSI-STEM funds to improve Latina and Latino access to STEM professions. Los Angeles, CA: University of Southern California.
McCune, V., and Hounsell, D. (2005). The development of students? Ways of thinking and practising in three final-year biology courses. Higher Educ. 49, 255–289. doi: 10.1007/s10734-004-6666-0
Means, D. R., and Pyne, K. B. (2017). Finding my way: Perceptions of institutional support and belonging in low-income, first-generation, first-year college students. J. Coll. Stud. Dev. 58, 907–924. doi: 10.1353/csd.2017.0071
Miller, J. (2021). Undergraduate student led research: An applied anthropology course as a community-based research firm. Teach. Anthropol. 10, 14–20. doi: 10.22582/ta.v11i3.581
Morad, R. (2022). Universities reimagine teaching labs for a virtual future. Ed Tech: Focus Higher Educ.
National Academies of Sciences, Engineering, and Medicine (2024). International talent programs in the changing global environment. Washington, D.C: National Academies of Sciences, Engineering, and Medicine.
National Center for Science and Engineering Statistics [NCSES] (2023). National science foundation report: Diversity and stem: Women, minorities, and persons with disabilities: (No. NSF 23-315). Alexandria, VA: National Center for Science and Engineering Statistics.
National Science, and Teachers Association (2001). Practicing science: The investigative approach in college science teaching. Alexandria, VA: NSTA Press.
O’Leary, B., and Audrey, W. (2023). These were higher ed’s biggest financial losses from the pandemic. Chronicle Higher Educ.
Pfeifer, M. A., Reiter, E. M., Cordero, J. J., and Stanton, J. D. (2021). Inside and out: Factors that support and hinder the self-advocacy of undergraduates with ADHD and/or specific learning disabilities in STEM. CBE—Life Sci. Educ. 20:ar17. doi: 10.1187/cbe.20-06-0107
Photopoulos, P., Tsonos, C., Stavrakas, I., and Triantis, D. (2022). Remote and in-person learning: Utility versus social experience. SN Comp. Sci. 4:116. doi: 10.1007/s42979-022-01539-6
Pierszalowski, S., Bouwma-Gearhart, J., and Marlow, L. (2021). A systematic review of barriers to accessing undergraduate research for stem students: Problematizing under-researched factors for students of color. Soc. Sci. 10:328. doi: 10.3390/socsci10090328
President’s Council of Advisors on Science and Technology [PCAST] (2012). Report to the president—engage to excel: Producing one million additional college graduates with degrees in science, technology, engineering, and mathematics. Washington, D.C: President’s Council of Advisors on Science and Technology.
President’s Council of Advisors on Science and Technology [PCAST] (2024). Letter to the president: Expanding STEM talent in the federal workforce. Washington, D.C: President’s Council of Advisors on Science and Technology.
Redish, E. F. (1999). Millikan lecture 1998: Building a science of teaching physics. Am. J. Phys. 67, 562–573. doi: 10.1119/1.19326
Rosen, D. J., and Kelly, A. M. (2022). Working together or alone, near, or far: Social connections and communities of practice in in-person and remote physics laboratories. Phys. Rev. Phys. Educ. Res. 18:010105. doi: 10.1103/PhysRevPhysEducRes.18.010105
Russell, S. H., Hancock, M. P., and McCullough, J. (2007). Benefits of undergraduate research experiences. Science 316, 548–549. doi: 10.1126/science.1140384
Ruth, A., Brewis, A., Blasco, D., and Wutich, A. (2019). Long-Term benefits of short-term research-integrated study abroad. J. Stud. Int. Educ. 23, 265–280. doi: 10.1177/1028315318786448
Ruth, A., Brewis, A., and SturtzSreetharan, C. (2023). Effectiveness of social science research opportunities: A study of course-based undergraduate research experiences (CUREs). Teach. Higher Educ. 28, 1484–1502. doi: 10.1080/13562517.2021.1903853
Savickas, M. L., and Porfeli, E. J. (2012). Career adapt-abilities scale: Construction, reliability, and measurement equivalence across 13 countries. J. Vocat. Behav. 80, 661–673. doi: 10.1016/j.jvb.2012.01.011
Shaukat, S., and Bashir, M. (2016). University students’ academic confidence: Comparison between social sciences and natural science disciplines. J. Elementary Educ. 25, 113–123.
Sirum, K., and Humburg, J. (2011). The Experimental Design Ability Test (EDAT). Bioscene: J. College Biol. Teach. 37, 8–16.
Sundberg, M., and Moncada, G. (1994). Creating effective investigative laboratories for undergraduates. Bioscience 44, 698–704. doi: 10.2307/1312513
Triyanto, andHandayani, R. D. (2018). Comparing learning motivation and learning style between natural science and social science students in higher education. Int. J. Innov. Learn. 23:304. doi: 10.1504/IJIL.2018.10010770
US Congress Joint Economic Committee (2012). STEM education: Preparing for the jobs of the future. Washington, D.C: US Congress Joint Economic Committee.
Wei, C. A., and Woodin, T. (2011). Undergraduate research experiences in biology: Alternatives to the apprenticeship model. CBE—Life Sci. Educ. 10, 123–131. doi: 10.1187/cbe.11-03-0028
Wessels, I., Rueß, J., Gess, C., Deicke, W., and Ziegler, M. (2021). Is research-based learning effective? Evidence from a pre–post analysis in the social sciences. Stud. Higher Educ. 46, 2595–2609. doi: 10.1080/03075079.2020.1739014
Wood, W. B. (2003). Inquiry-Based undergraduate teaching in the life sciences at large research universities: A perspective on the boyer commission report. Cell Biol. Educ. 2, 112–116. doi: 10.1187/cbe.03-02-0004
Keywords: Hispanic Serving Institution (HSI), equitable research experiences, high impact practices (HIPs), student learning, scientific practice skills, research design, student self-perceptions, perceptions of science
Citation: Broussard C, Gough Courtney M, Dunn SL, Godde K and Preisler V (2025) Expanding the CURE: the impact of course-based undergraduate research experiences across natural and social sciences. Front. Educ. 10:1593436. doi: 10.3389/feduc.2025.1593436
Received: 14 March 2025; Accepted: 11 June 2025;
Published: 17 July 2025.
Edited by:
David Rodriguez-Gomez, Universitat Autònoma de Barcelona, SpainReviewed by:
Carlos C. Goller, North Carolina State University, United StatesDavida S. Smyth, Texas A&M University San Antonio, United States
Copyright © 2025 Broussard, Gough Courtney, Dunn, Godde and Preisler. This is an open-access article distributed under the terms of the Creative Commons Attribution License (CC BY). The use, distribution or reproduction in other forums is permitted, provided the original author(s) and the copyright owner(s) are credited and that the original publication in this journal is cited, in accordance with accepted academic practice. No use, distribution or reproduction is permitted which does not comply with these terms.
*Correspondence: Vanessa Preisler, dnByZWlzbGVyQGxhdmVybmUuZWR1