 Sonnia Valeria Zapatier Castro
 Delia Dolores Noriega Verdugo
 Ruth María Farías Lema
 Ruth Rubí Peña Holguín
 Juan Diego Valenzuela Cobos*
- Universidad Estatal de Milagro, Milagro, Guayas, Ecuador
Introduction: Public universities in Ecuador face persistent structural and contextual challenges that affect the delivery of quality education. Despite institutional efforts, significant gaps remain between student expectations and perceived service quality.
Methods: This study used the HEdPERF model to assess students’ perceptions of educational service quality at a public university in Ecuador. A structured digital questionnaire was administered to a stratified random sample of 1,500 students across four faculties. Confirmatory Factor Analysis (CFA) and Principal Component Analysis (PCA) were employed to validate the model and identify key dimensions influencing satisfaction.
Results: The CFA results showed excellent fit indices (CFI = 0.997, TLI = 0.997, RMSEA = 0.020), confirming the validity of the HEdPERF structure in this context. Reliability was also high, with Cronbach’s Alpha and Composite Reliability (CR) exceeding 0.70. PCA identified that non-academic factors such as infrastructure, access to services, and university reputation had a stronger influence on students’ perceptions than academic factors.
Discussion: The findings highlight the importance of integrating both academic and non academic dimensions into institutional quality strategies. Continuous assessment, curriculum innovation, and equitable access to services are essential to improving student satisfaction and promoting sustainable and inclusive education in Ecuador’s public universities.
1 Introduction
In Latin America, structural and contextual challenges continue to hinder public universities from delivering high-quality education.” In response to increasing labor market demands and growing student expectations, higher education institutions are under pressure to enhance not only their academic offerings but also the overall quality of the services they provide (Carlson, 2001; Posso-Pacheco et al., 2024). In Ecuador, public universities face persistent difficulties related to infrastructure, administrative inefficiency and the scarcity of student support services, factors that influence the perception of educational quality (Béltran, 2021).
Service quality in higher education is a multifaceted concept that directly influences both student satisfaction and institutional performance (Abdullah, 2005; Brochado, 2009; Sultan and Wong, 2012; Hair et al., 2010; Cadima, 2016; Parasuraman et al., 1988), This concept is closely linked to the philosophy of Total Quality Management (TQM), introduced by Edward Deming, which emphasizes statistical quality control as a means to optimize organizational outcomes, including those in educational settings (Anderson et al., 1994; Neave, 1987; Neyestani, 2017; Petersen, 1999; Deming and Orsini, 2010). However, defining service quality in education remains complex, as students’ perceptions are mediated by expectations, cultural context, and institutional conditions. Karapetrovic and Willborn (1997) propose that quality in education corresponds to “the ability of students’ knowledge to meet established requirements,” such as those defined by employers, accrediting bodies, and professional organization.
Students are key actors in the academic system, and their perception of the quality of service is a crucial indicator for evaluating institutional effectiveness (Oldfield and Baron, 2000). However, this perception is influenced by multiple factors beyond teaching, such as academic support, communication, accessibility and service efficiency. Several recent studies in the Latin American context highlight a growing discrepancy between student expectations and the actual quality of services received, particularly in non-academic aspects such as infrastructure and administrative support (Hernandez-Diaz et al., 2021). These findings underscore the need for robust evaluation tools that can identify the underlying dimensions that shape satisfaction and drive institutional improvement.
Several models have been developed to address this challenge. SERVQUAL, proposed by Parasuraman et al. (1988), conceptualizes quality as the gap between expected and perceived service. SERVPERF, a later version, focuses exclusively on service performance, eliminating the expectations component (Cronin and Taylor, 1992; Maldonado and Moreta, 2017). More recently, HEdPERF (Higher Education PERFormance) has emerged as a specialized scale for assessing service quality in higher education institutions, incorporating six dimensions and 41 items that capture both academic and nonacademic aspects of the student experience (Abdullah, 2005). The relevance of the model lies in its validated psychometric properties and its applicability in diverse educational contexts.
While emerging tools such as SMART-QUAL, performance panels, and systematic reviews have driven quality assessment (Adot et al., 2023; Betavia et al., 2023; Kucińska-Landwójtowicz et al., 2023), HEdPERF remains widely used due to its methodological rigor and multidimensional scope (Oldfield and Baron, 2000; Clemes et al., 2008; Ladhari, 2009). Its application is particularly valuable in developing countries such as Ecuador, where structural and institutional challenges require context-specific approaches. When combined with advanced statistical techniques such as Confirmatory Factor Analysis (CFA) and Principal Component Analysis (PCA), HEdPERF provides a robust framework for assessing student satisfaction and institutional performance (Carvajal-Morales et al., 2024; Guevara-Viejó et al., 2025).
This study seeks to evaluate students’ perception of the quality of educational service at an Ecuadorian public university using a factorial approach. Specifically, the research seeks to: (i) validate the structure of the HEdPERF model through Confirmatory Factor Analysis (CFA); (ii) identify the most influential factors that influence student satisfaction through Principal Component Analysis (PCA); and (iii) highlight areas of action for institutional improvement. Through this methodology, the study provides empirical evidence that can support decision-making in Ecuadorian public universities and, in addition, can inform quality assurance practices in similar contexts in Latin America.
2 Theoretical framework
The HEdPERF (Higher Education PERFormance) model, previously introduced, is a specialized instrument designed to assess service quality in higher education. It comprises six dimensions and 41 items that capture both academic and administrative aspects of student experience, thus offering a multidimensional view of service quality. Its conceptual foundation rests on the assumption that quality equals performance (Q = P), and it incorporates characteristics unique to the university context, such as student-faculty interaction, curriculum relevance, and administrative efficiency (Gbadamosi and De Jager, 2009).
• Academic aspects: this dimension focuses on curriculum content, teacher competence, teaching methods and the availability of educational resources (Abdullah, 2006). The relevance and updating of the curriculum are fundamental elements that guarantee the adequacy to the demands of the labor market and the development of students’ competencies (Ramírez Valladares et al., 2024; Soutar and Turner, 2002). Evaluating these aspects helps institutions identify areas for improvement and design strategies to optimize educational quality (Teeroovengadum et al., 2019).
• Non-academic aspects: includes administrative efficiency, student support services, and campus infrastructure (Abdullah, 2006; Ramírez Valladares et al., 2024). Programs such as psychological services, academic advising, and extracurricular activities contribute to student satisfaction and academic success (Sultan and Wong, 2012).
• University reputation: institutional reputation significantly influences student perceptions of quality, recruitment potential, and graduate employability. It is built upon elements such as teaching quality, research impact, infrastructure, and social outreach (Mayuri-Ramos et al., 2023). High reputation perception correlates positively with student satisfaction and institutional loyalty (Amado Mateus and Juarez Acosta, 2022).
• Access: refers to the ease with which students utilize academic, administrative, and technological resources (Perkins et al., 2024). This includes physical and digital infrastructure such as libraries, laboratories, virtual platforms, and scholarships (Trow, 2006).
• Academic programs: evaluated by their relevance to labor market demands, curricular flexibility, and pedagogical innovation (Abdullah, 2006; Teeroovengadum et al., 2019). Effective programs integrate meaningful learning and promote the development of transversal competencies (Gonzalez and Padilla, 1997; Nguyen et al., 2024).
• Understanding and support: this dimension emphasizes the quality of institutional communication, academic guidance, and personalized advising (Abdullah, 2006). Effective student support reinforces retention and fosters a sense of belonging (Harvey and Green, 1993).
2.1 Applications of HEdPERF in public universities
The HEdPERF model has been extensively applied and validated across diverse educational contexts, with particular effectiveness in public universities due to its capacity to measure both academic and service dimensions (Abdullah, 2006; Ramírez Valladares et al., 2024). Table 1 synthesizes key studies that have employed the HEdPERF instrument in regions such as Asia, Europe, Oceania, and Latin America.
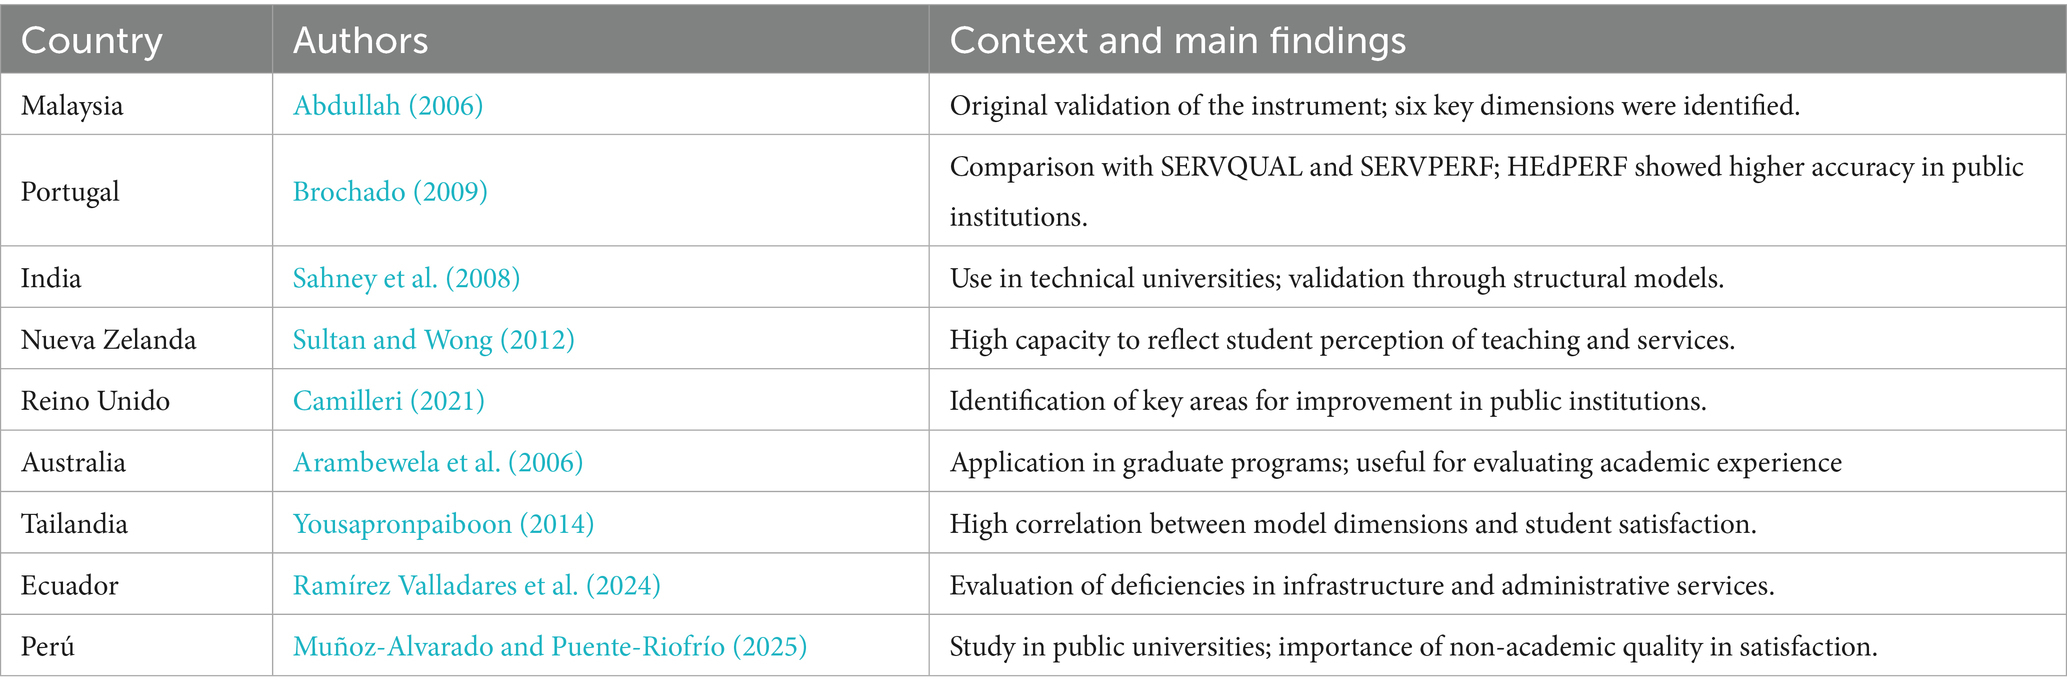
Table 1. International applications of the HEdPERF model in higher education institutions.
2.2 Contribution of the study
Despite its global validation, the application of HEdPERF in public universities in Latin America remains scarce. Most regional studies have focused on private institutions or have adopted general quality assessment approaches that lack contextual adaptation and psychometric rigor (Ramírez Valladares et al., 2024; Muñoz-Alvarado and Puente-Riofrío, 2025). Furthermore, the literature on psychometric methodology emphasizes that even well-established instruments must be revalidated when applied to different populations and cultural settings to ensure measurement equivalence and structural integrity (Muñiz and Fonseca-Pedrero, 2019; Hambleton et al., 2004).
This study seeks to overcome this gap through the application and validation of the HEdPERF model in a public university in Ecuador. Using statistical techniques such as Confirmatory Factor Analysis (CFA) and Principal Component Analysis (PCA), this research identifies the most influential dimensions in student perception of educational quality. In this way, it offers evidence-based perspectives for improving institutional quality management and student satisfaction strategies in Latin American public higher education.
3 Materials and methods
3.1 Research design
The present study adopted a quantitative approach with a non-experimental and cross-sectional design. According to Hernández et al. (2014), the quantitative methodology allows for the collection of objective and measurable data, facilitating the statistical analysis of the information gathered. Likewise, the non-experimental nature of the study implies the absence of manipulation of the variables of interest, focusing solely on the observation and analysis of students’ perceptions in their natural context. On the other hand, the justification for the cross-sectional nature of the study lies in the need to collect data at a single point in time to analyze participants’ perceptions regarding the quality of educational services (Bisquerra Alzina, 2012).
This empirical study involved four faculties: Faculty of Educational Sciences (FACE), Faculty of Economic, Social, and Technological Sciences (FACESYT), Faculty of Engineering Sciences (FACI), and Faculty of Health Sciences (FACS). The selection of these faculties was based on their disciplinary specificity and the homogeneity of the sample, aiming to ensure a representative analysis of different academic areas and to validate the applied model in various educational contexts.
3.2 Data collection
The data collection was conducted through the administration of a structured questionnaire based on the HEdPERF model, designed to assess students’ perceptions of the quality of educational services. The questionnaire was administered digitally through the Google Forms platform, a tool widely used for data collection in academic research due to its ease of use, efficiency and distribution in digital environments (Alavez Gutiérrez, 2017). The link to the form was distributed through institutional e-mails, ensuring direct and secure communication with students and preserving anonymity and voluntary participation.
The population consisted of 68,429 students enrolled in various faculties of a public university in zone 5 of Ecuador, covering various academic programs and study modalities. The sample comprised 1,500 students, using a stratified random sampling approach, following the guidelines established by Creswell et al. (2018), to ensure the representativeness of the different fields of knowledge within the institution. The Table 2 presents the sociodemographic composition of the sample, providing a detailed breakdown of its characteristics.
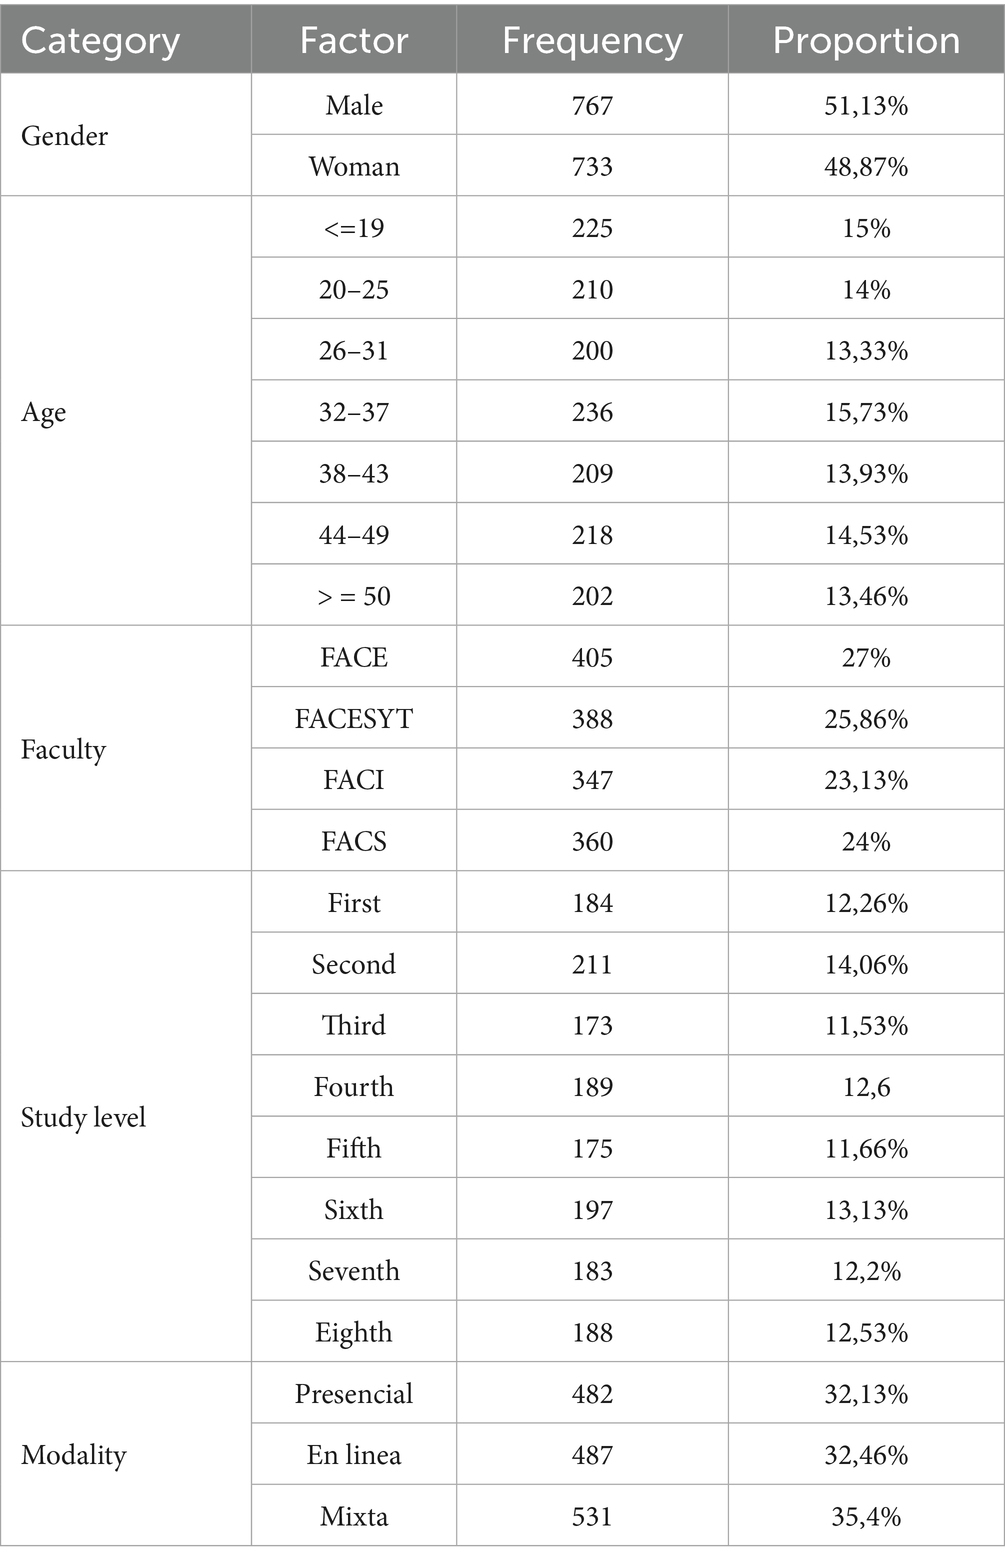
Table 2. Sociodemographic characteristics of the sample.
3.3 Procedure and ethical considerations
To ensure compliance with ethical principles in research, the study was submitted for evaluation and approval by the university’s ethics committee, ensuring respect for the dignity, privacy, and rights of the participants (Hadjistavropoulos, 2020).
Prior to administering the questionnaire, students were informed about the research objectives and were asked to provide informed consent, in accordance with the principles established in the Declaration of Helsinki (World Medical Association, 2013). It was emphasized that their participation was voluntary, anonymous, and confidential, and that the data collected would be used exclusively for academic and research purposes. Additionally, students were assured that they could withdraw from the study at any time without negative consequences.
To protect the collected data, anonymization and secure storage measures were adopted in compliance with privacy regulations and personal data management laws established in the General Data Protection Regulation (GDPR) (Parlamento Europeo y Consejo de la Unión Europea, 2018).
3.4 Instrument
The instrument used for data collection was a structured questionnaire based on the HEdPERF (Higher Education Performance-only model), developed by Harvey and Green (1993), and widely applied in assessing the quality of educational services in higher education institutions. This model has been validated in multiple studies and has demonstrated reliability and validity across various university contexts (Alves and Raposo, 2007; Sultan and Wong, 2012; World Medical Association, 2013). The questionnaire included items designed to measure students’ perceptions regarding five key dimensions of the HEdPERF model (Table 3).
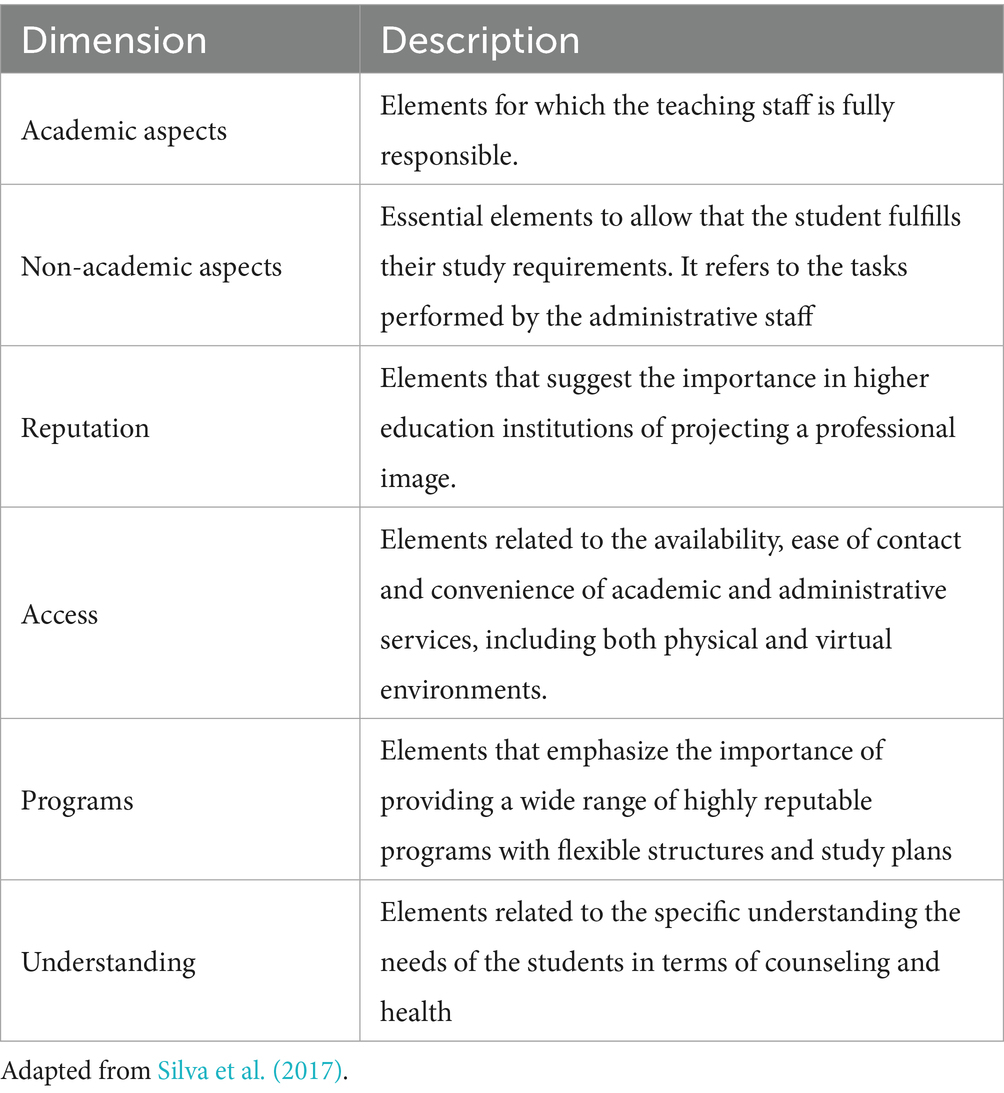
Table 3. HEdPERF questionnaire dimensions.
Each item was evaluated using a 5 point Likert scale, where 1 represented “Strongly Disagree” and 5 “Strongly Agree,” following the methodology used in previous studies on service quality in higher education.
Before the questionnaire was applied, a pilot test was conducted with a group of 150 students, allowing for minor wording adjustments to improve comprehension. Subsequently, the internal consistency of the instrument was assessed using Cronbach’s Alpha coefficient, ensuring its statistical reliability (Nunnally and Bernstein, 1994).
3.5 Test hypotheses
The following hypotheses were proposed to be evaluated using the CFA:
H1: The factorial structure of the HEdPERF model presents a satisfactory fit in the sample studied.
H2: The dimensions of the model (perception of access, institutional reputation, non-academic aspects and academic aspects) are significantly related to the global perception of educational quality.
H3: The relationship between the dimensions and the student’s global perception reflects the validity of the construct in the context of the public university in Ecuador.
3.6 Data analysis
The analysis of the validity and reliability of the instrument was performed using R software (version 2024.09.1), following a rigorous statistical approach based on confirmatory factor analysis (CFA) techniques. First, the adequacy of the data matrix for factorization was assessed using the Kaiser-Meyer-Olkin (KMO) test and Bartlett’s test of sphericity (Silva et al., 2017; Nunnally and Bernstein, 1994). Subsequently, the CFA was carried out using the Unweighted Least Squares (ULS) estimation method, considering the ordinal nature of the data and seeking to minimize biases in parameter estimation (Forero et al., 2009). The model fit indicators, such as the Goodness of Fit Index (GFI), the Tucker-Lewis Index (TLI), the Comparative Fit Index (CFI) and the Root Mean Square Error of Approximation (RMSEA), were calculated following the recommendations in the literature to assess the structural validity of the model (Hu and Bentler, 1998).
The reliability of the instrument was evaluated using Cronbach’s alpha coefficient (Cronbach, 1951) and composite reliability (Fornell and Larcker, 1981), guaranteeing the internal consistency of the scales. For convergent validity, the Average Value of Variance Extracted (AVE) was used, verifying that each construct explained at least 50% of the variance of its indicators. For discriminant validity, the Fornell-Larcker criterion and the HTMT matrix (Henseler et al., 2015) were used, confirming the independence between factors. In addition, a Principal Component Analysis (PCA) was performed to synthesize the information and evaluate the latent structure of the global construct, analyzing the variance explained and the standardized factor loadings (Cadima, 2016). This approach allows validation of the conceptual model and provides a solid statistical basis for the interpretation of the results.
4 Results
4.1 Evaluation and identification of factors
The descriptive analysis of the evaluated dimensions reveals that participants’ perceptions are mainly concentrated in the midrange values of the Likert scale, with means ranging between 3.17 and 3.81. The dimensions associated with access to resources, university reputation, and non-academic aspects recorded the highest average scores, suggesting a positive evaluation of these factors within the university experience. In contrast, academic aspects show greater variability in responses, with standard deviations close to 0.90, indicating significant differences in students’ perceptions, possibly influenced by individual or contextual factors (Table 4).
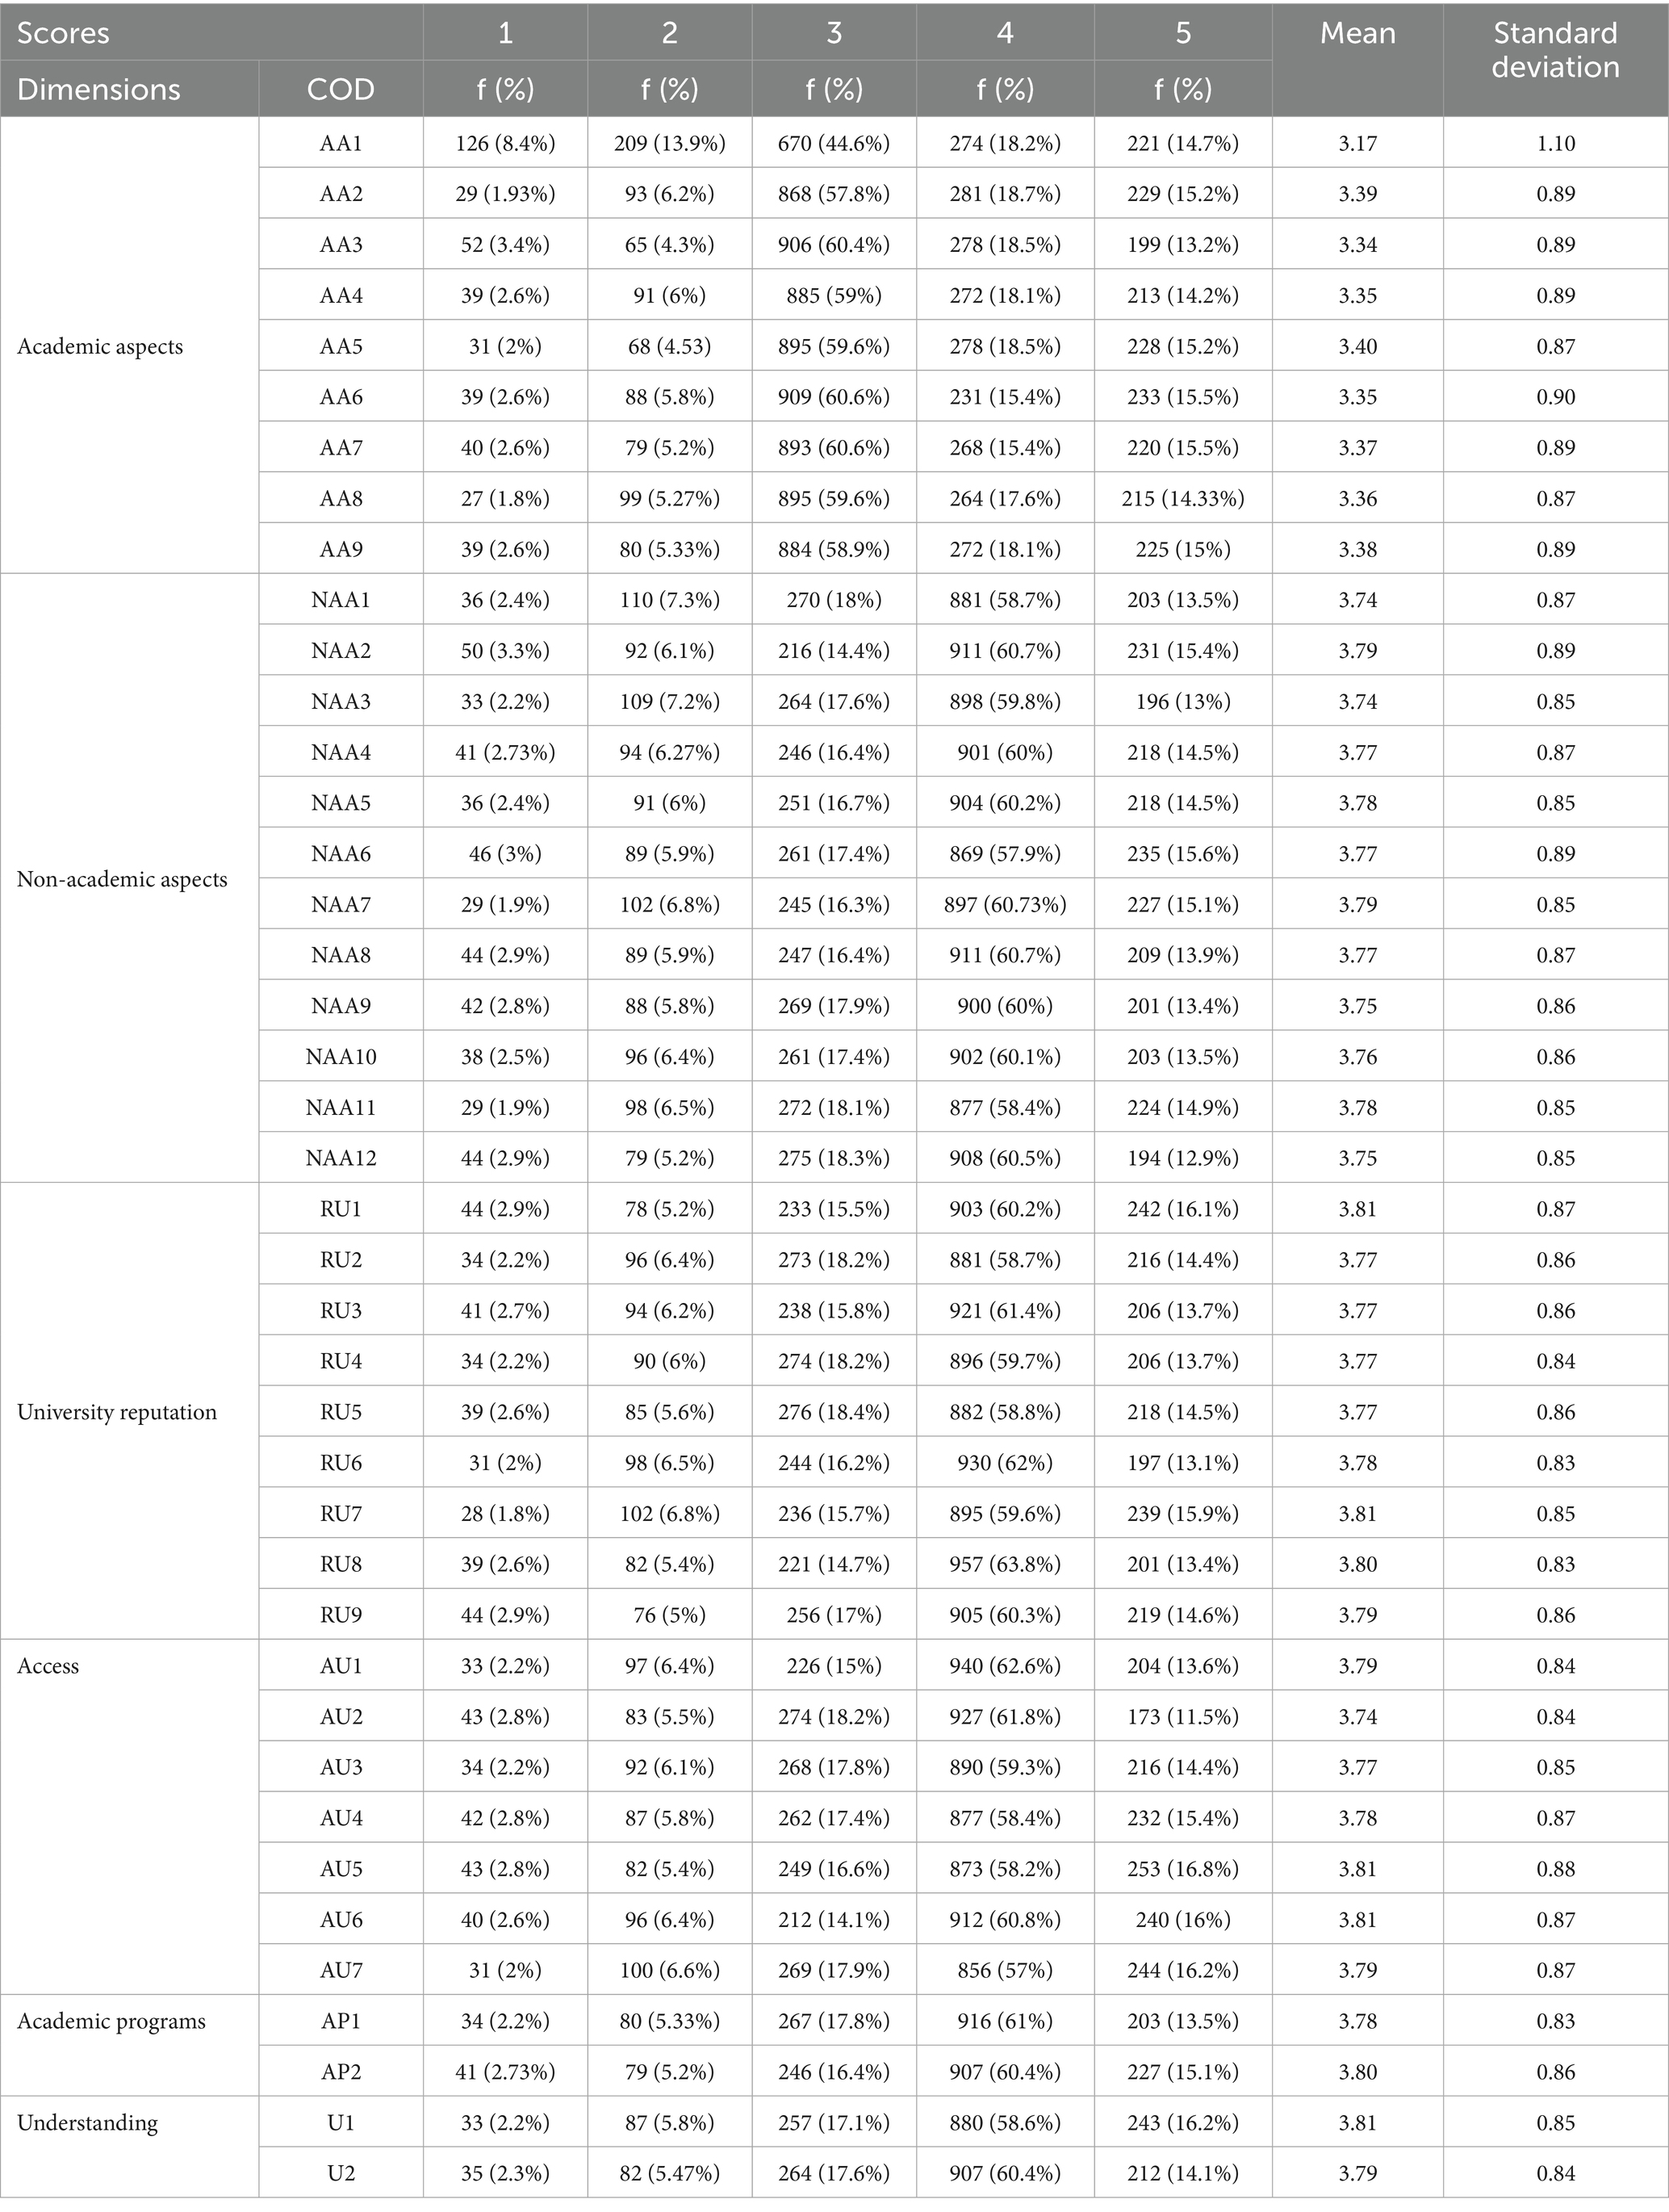
Table 4. Descriptive analysis of the evaluated dimensions.
As shown in Table 1, the dimensions of access, university reputation, and non-academic aspects present the highest average values, indicating a favorable perception in these areas. Conversely, although academic aspects maintain an acceptable rating, they exhibit greater dispersion in responses, suggesting that perceptions of academic quality vary based on individual student experiences. This heterogeneity in responses may be related to differences in teaching methodologies, availability of academic resources, or the perceived quality of faculty members.
4.2 Model adequacy tests
To assess the suitability of the data for factor analysis, the Kaiser-Meyer-Olkin (KMO) test and Bartlett’s sphericity test were applied, confirming the relevance of the model. The KMO test obtained a value of 0.98, indicating excellent sample adequacy for factor analysis (Kaiser, 1974). This value suggests that the correlations between the items are sufficiently high to justify dimensional reduction. Additionally, Bartlett’s test yielded χ2 = 33,623.8 (df = 820, p < 0.001), rejecting the null hypothesis of an identity matrix and confirming the existence of significant correlations between items (Bartlett, 1950).
These results validate the feasibility of and Confirmatory Factor Analysis (CFA), ensuring that the data meet the factorization assumptions. Previous studies have indicated that KMO > 0.90 signifies high cohesion among items, facilitating factor interpretation (Hair et al., 2010). Likewise, the significance of Bartlett’s χ2 supports the factorial structure of the model, ensuring the representativeness of the analyzed constructs (Field, 2024).
4.3 Confirmatory factor analysis (CFA)
Confirmatory Factor Analysis (CFA) was applied to evaluate the factorial structure of the model and determine the validity of the proposed dimensions. The obtained fit indices indicate an excellent model fit to the data, with values falling within the ranges recommended in the literature (Hu and Bentler, 1999).
The main fit indices obtained were CMIN/DF = 1.615, suggesting a good model fit relative to degrees of freedom, as values below 2 indicate an adequate model (Kline, 2015). The RMSEA = 0.020 falls within the acceptable range (≤ 0.05), indicating low approximation error (Browne and Cudeck, 1993). Additionally, incremental fit indices such as CFI = 0.997, TLI = 0.997, and NFI = 0.993 exceed the 0.90 threshold, confirming an optimal model fit with the observed data (Bentler, 1990) (Table 5).
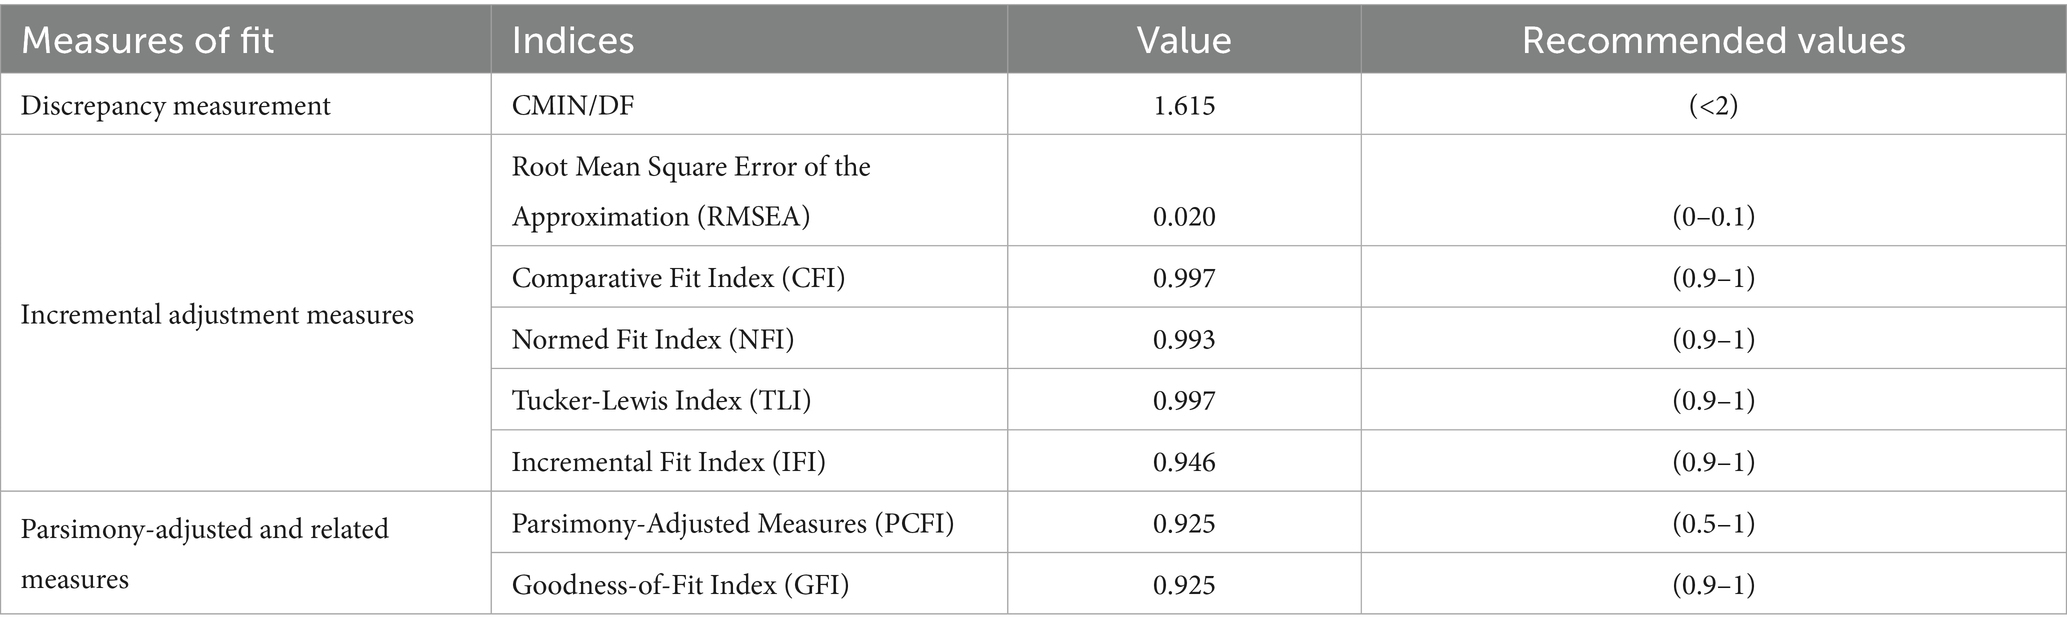
Table 5. Model fit indices.
The results confirm that the factorial model presents a robust and valid structure for measuring the proposed dimensions. The high CFI and TLI values (>0.95) reflect an outstanding fit, while the low RMSEA (<0.05) indicates that the discrepancy between the theoretical model and the observed data is minimal. These findings align with previous studies that have used CFA to validate models in higher education, demonstrating that a welldefined factorial structure enhances result interpretation and measurement instrument reliability (Byrne, 2016).
4.4 Feasibility, validity, and model fit of the measurement model
To assess the reliability of the model, Cronbach’s Alpha (CA) and Composite Reliability (CR) coefficients were calculated. In general, the obtained values exceed the 0.70 threshold, indicating adequate internal consistency of the constructs (Nunnally and Bernstein, 1994). Convergent validity was evaluated using the Average Variance Extracted (AVE), with values exceeding 0.50, suggesting that each construct explains a significant portion of the variance of its indicators (Cronbach, 1951).
Table 6 presents the obtained values for the reliability and convergent validity evaluation of the model:
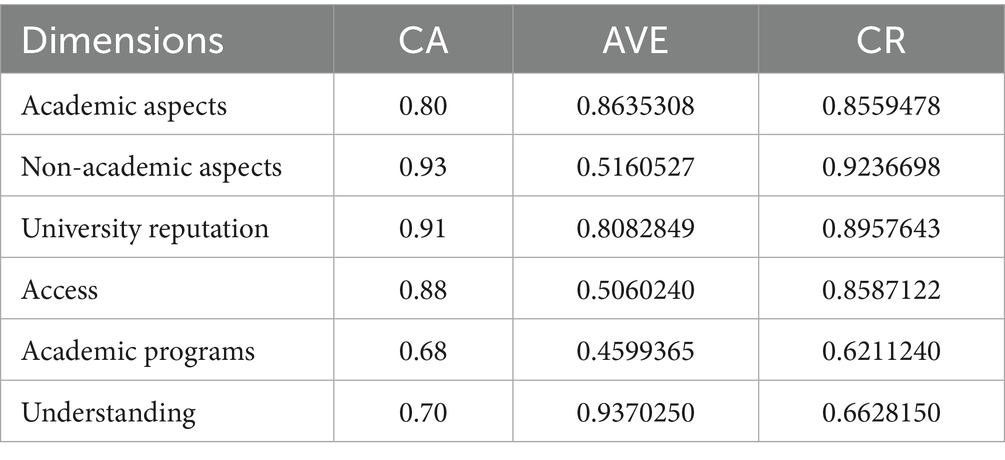
Table 6. Reliability and validity evaluation of the model.
4.4.1 Discriminant validity of the model
The evaluation of the model’s discriminant validity was conducted using two widely recognized approaches in the literature: the Fornell-Larcker matrix and the HTMT (Heterotrait-Monotrait Ratio of Correlations) metric, following the recommendations of (Forero et al., 2009). Both methods help determine whether the constructs measured in the model are empirically distinct, ensuring that each latent variable represents a unique concept.
To ensure model reliability, Composite Reliability (CR) was calculated from the standardized factor loadings obtained in Confirmatory Factor Analysis (CFA). The results show values above 0.70, indicating adequate internal consistency and supporting the model’s reliability (Fornell and Larcker, 1981). Likewise, convergent validity was verified using the Average Variance Extracted (AVE), with values exceeding the 0.50 threshold in most cases, implying that each construct explains a significant proportion of its indicators’ variance.
The Fornell Larcker matrix states that the square root of the AVE of each construct should be greater than the correlations between constructs. In Table 6, it is observed that the diagonal values (representing the square root of the AVE for each construct) are consistently higher than the off-diagonal correlation coefficients, confirming that each dimension is independent and measures a unique concept. For example, in the case of Academic Aspects (AA), the square root of the AVE is 0.929, while its highest correlation with another construct (RU) is 0.898, reinforcing its discriminant validity.
For additional validation, the HTMT criterion was applied to evaluate the correlation relationships between constructs. According to (Forero et al., 2009), HTMT values should be below 0.85 to confirm that the constructs are empirically distinct. In Table 7, it is observed that most relationships comply with this criterion, with values ranging between 0.61 and 0.81, providing further evidence of the model’s discriminant validity.

Table 7. Fornell Larcker correlation matrix.
However, in the case of the Academic Programs (AP) construct, an HTMT value above 1.00 (AP-U: 1.023) was detected, which could indicate a potential lack of discrimination with the Institutional Understanding (U) dimension. This suggests that some items may be measuring similar constructs or that there is a high correlation between these two dimensions, which might require a conceptual review or reformulation of certain items.
4.5 Principal component analysis (PCA)
Principal Component Analysis (PCA) was applied to explore the underlying data structure and reduce the model’s dimensionality, allowing for the identification of variability patterns among the evaluated dimensions. Table 8 presents the factor loading matrix, indicating the relationship of each dimension with the first six principal components (PCs).
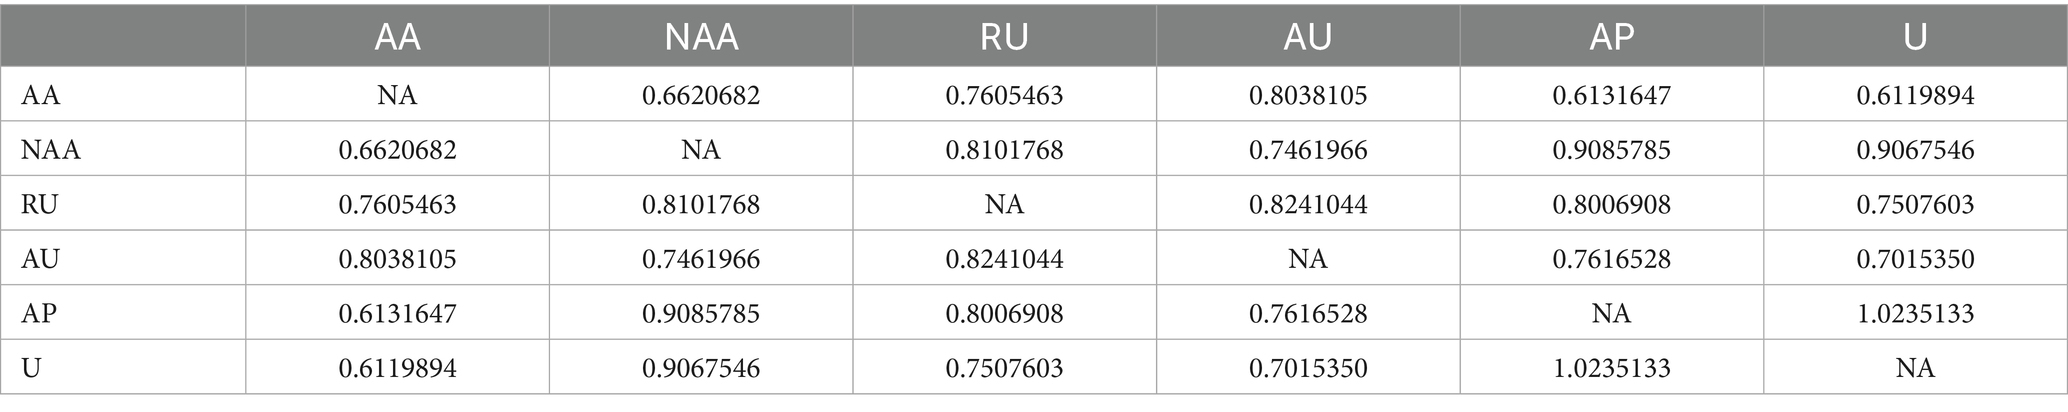
Table 8. HTMT matrix.
The PCA results indicate that PC1 represents a general combination of factors, with a strong influence from Non-Academic Aspects (NAA), Access (AU), Academic Programs (AP), and Understanding (U), suggesting that these elements share variance and could be grouped into a broader construct related to the overall student experience (Table 9).

Table 9. Principal component analysis (PCA) matrix.
On the other hand, PC2 is highly correlated with University Reputation (RU) and Academic Aspects (AA), but with opposite loadings, suggesting that these factors may represent contrasting dimensions in student perception: while university reputation is more homogeneous, academic perception may vary more widely based on individual experience. PC3 and PC4, although with lower loadings, seem to capture differences in the academic structure and the accessibility of programs, while PC5 and PC6 have a more dispersed influence, reflecting specific aspects of lower variance in the model.
5 Discussion, limitations, and further research
The validation of the HEdPERF model in the context of an Ecuadorian public university provides a solid framework for understanding the multidimensional factors that influence students’ perception of the quality of educational service. The results obtained through Confirmatory Factor Analysis (CFA) support the first hypothesis (H1), confirming that the factor structure of the model presents an adequate fit in this context (Bentler, 1990; Byrne, 2016; Astin, 1984). Fit indices such as CFI, TLI and RMSEA are within the recommended thresholds, indicating that the six dimensions proposed in the original instrument-Academic Aspects, Non-Academic Aspects, University Reputation, Access, Academic Programs and Understanding and Support-maintain their structural validity in the Ecuadorian context (Kuh, 2009; Pascarella and Terenzin, 2005).
With respect to the second hypothesis (H2), the findings reveal significant associations between the dimensions of the model and students’ general perception of quality. It is noteworthy that the dimensions of Access and University Reputation showed the greatest influence, which reinforces the idea that service quality in higher education is not only determined by academic rigor, but also by institutional image, availability of resources, and support services (Sultan and Wong, 2012; Parlamento Europeo y Consejo de la Unión Europea, 2018). These results mirror those of Díaz-Ortiz et al. (2023), who studied institutions in Zone 3 of Ecuador and similarly identified Access and Reputation as critical factors of perceived quality. However, this study provides a more nuanced analysis by integrating updated statistical techniques and a larger sample stratified across multiple faculties and modalities, which improves methodological rigor.
In addition, the third hypothesis (H3) is validated by the consistency demonstrated between the structural relationships of the dimensions and their explanatory capacity in the overall student evaluation. This confirms the contextual relevance of the construct and suggests that the HEdPERF model is a reliable tool for institutional diagnosis in Ecuadorian public universities. These findings support the prioritization of strategic policies aimed at improving infrastructure resources, institutional communication, and service management, especially in contexts with limited public funding and high demand.
A key contribution of this research lies in its emphasis on the importance of non-academic and extracurricular factors in the student experience. While previous regional studies have focused primarily on teaching and curriculum (Díaz-Ortiz et al., 2023; Lounsbury et al., 2005; Wilkins et al., 2016), this study highlights the increasing relevance of institutional responsiveness, administrative efficiency, and reputation management in shaping student satisfaction. In line with findings from Latin American and European contexts (García-Aracil et al., 2021; Heilporn et al., 2024; Tinto, 1994; Wilkins et al., 2012), the results argue for a multidimensional approach to quality improvement, where intangible assets such as trust, image and accessibility to services are considered key institutional priorities.
From a strategic perspective, these results highlight the need for comprehensive quality management that transcends academic delivery and incorporates holistic support systems. This includes the implementation of inclusive access policies, faculty development programs, dynamic curriculum updates, and robust student support services (Byrne and Flood, 2003). By aligning internal improvements with student expectations and perceptions, universities can not only improve satisfaction and retention, but also strengthen their public image and long-term impact (Gibbs and Coffey, 2004).
While this study provides significant information on student perception of educational quality at a large public university in Ecuador, it is essential to recognize certain limitations in generalizing its conclusions. The results reflect student perception in a particular institutional setting, characterized by distinctive infrastructural, academic and administrative characteristics. Therefore, caution is advised when applying these results directly to other public universities in the country, given the diversity of socioeconomic, cultural and administrative contexts present in the Ecuadorian higher education landscape. Future research using comparable methodologies across institutions could improve the external validity of these results and contribute to a more complete understanding of student perception at the national level.
6 Conclusion
This study has identified that the perception of the quality of educational service at a public university in Ecuador is influenced by multiple dimensions, including academic aspects, infrastructure, support services and institutional image. Through the HEDPERF model and statistical-multivariate techniques, the importance of considering both tangible and intangible aspects to understand the needs and expectations of students was evidenced, highlighting the relevance of sustainable and equitable strategies that favor continuous improvements in the educational offer and the student experience. In addition, the analysis highlighted that the perception of quality depends not only on academic content, but also on the institutional environment, accessibility and the perception of fairness and equity in access to resources.
Consequently, it is recommended that higher education institutions implement systematic evaluation mechanisms that integrate robust analytical models to monitor satisfaction and improve institutional management. The adoption of data-driven approaches will facilitate decision-making, promoting a more inclusive, innovative and sustainability-oriented education. Future studies should also expand the indicators evaluated, including variables related to educational innovation and the impact of technologies, as well as inter-institutional and regional comparisons that contribute to strengthening quality and equity in higher education in Ecuador and Latin America.
6.1 Recommendations
1. Enhance teaching quality, update curricula in alignment with labor market trends, and reinforce active learning strategies in the teaching process.
2. Strengthen support services, improve physical and digital infrastructure, and ensure equitable access to academic and extracurricular resources.
3. Universities should ensure that their institutional prestige objectively reflects the quality of their educational offerings.
4. Reinforce scholarship programs, psychological and academic support, and curricular flexibility, with special attention to students in vulnerable conditions.
Data availability statement
The raw data supporting the conclusions of this article will be made available by the authors, without undue reservation.
Ethics statement
Ethical approval was not deemed necessary for this study, as it was conducted exclusively online through an anonymous survey platform. Participants were presented with a detailed description of the study’s objectives and their rights on the introductory page of the survey. By choosing to complete the survey voluntarily, participants provided implicit consent to take part. Nonetheless, we, as researchers, are fully committed to maintaining the highest ethical standards throughout our work. All data collected is kept strictly confidential and is used solely for the purposes described in the study information provided to participants. The studies were conducted in accordance with the local legislation and institutional requirements. The participants provided their written informed consent to participate in this study.
Author contributions
SZ: Supervision, Project administration, Conceptualization, Writing – review & editing, Investigation, Formal analysis, Resources. DN: Conceptualization, Validation, Resources, Writing – review & editing, Project administration, Investigation. RF: Writing – review & editing, Conceptualization, Resources. RP: Validation, Writing – original draft, Methodology, Writing – review & editing. JV: Writing – review & editing, Visualization, Software, Data curation.
Funding
The author(s) declare that financial support was received for the research and/or publication of this article. This research was funded by the Universidad Estatal de Milagro (UNEMI).
Acknowledgments
The authors are grateful to the Universidad Estatal de Milagro (UNEMI).
Conflict of interest
The authors declare that the research was conducted in the absence of any commercial or financial relationships that could be construed as a potential conflict of interest.
Generative AI statement
The authors declare that no Gen AI was used in the creation of this manuscript.
Any alternative text (alt text) provided alongside figures in this article has been generated by Frontiers with the support of artificial intelligence and reasonable efforts have been made to ensure accuracy, including review by the authors wherever possible. If you identify any issues, please contact us.
Publisher’s note
All claims expressed in this article are solely those of the authors and do not necessarily represent those of their affiliated organizations, or those of the publisher, the editors and the reviewers. Any product that may be evaluated in this article, or claim that may be made by its manufacturer, is not guaranteed or endorsed by the publisher.
References
Abdullah, F. (2005). HEdPERF versus SERVPERF: the quest for ideal measuring instrument of service quality in higher education sector. Qual. Assur. Educ. 13, 305–328. doi: 10.1108/09684880510626584
Abdullah, F. (2006). The development of HEdPERF: a new measuring instrument of service quality for the higher education sector. Int. J. Consum. Stud. 30, 569–581. doi: 10.1111/j.1470-6431.2005.00480.x
Adot, E., Akhmedova, A., Alvelos, H., Barbosa-Pereira, S., Berbegal-Mirabent, J., Cardoso, S., et al. (2023). SMART-QUAL: a dashboard for quality measurement in higher education institutions. Int. J. Qual. Reliab. Manag. 40, 1518–1539. doi: 10.1108/ijqrm-06-2022-0167
Alavez Gutiérrez, J. M.., Google forms como instrumento de medición de conocimientos. Revista Vinculando, (2017). Available online at: https://vinculando.org/beta/google-forms-instrumento-medicion-conocimientos-basicos.html
Alves, H., and Raposo, M. (2007). Conceptual model of student satisfaction in higher education. Total Qual. Manag. Bus. Excell. 18, 571–588. doi: 10.1080/14783360601074315
Amado Mateus, M., and Juarez Acosta, F. (2022). Reputation in higher education: a systematic review. Front. Educ. 7:925117. doi: 10.3389/feduc.2022.925117
Anderson, J. C., Rungtusanatham, M., and Schroeder, R. G. (1994). A theory of quality management underlying the Deming management method. Acad. Manag. Rev. 19:472. doi: 10.2307/258936
Arambewela, R., Hall, J., and Zuhair, S. (2006). Postgraduate international students from Asia: factors influencing satisfaction. J. Mark. High. Educ. 15, 105–127. doi: 10.1300/J050v15n02_05
Astin, A. (1984). Student involvement: a development theory for higher education. J. Coll. Stud. Dev. 40, 518–529.
Bartlett, M. S. (1950). Tests of significance in factor analysis. Br. J. Stat. Psychol. 3, 77–85. doi: 10.1111/j.2044-8317.1950.tb00285.x
Béltran, P. (2021). EDUCACIÓN SUPERIOR ECUATORIANA: una mirada desde la política pública, previo a la Ley Orgánica de Educación Superior, Primera. Ecuador: Universidad Espíritu Santo.
Bentler, P. M. (1990). Comparative fit indexes in structural models. Psychol. Bull. 107, 238–246. doi: 10.1037/0033-2909.107.2.238
Betavia, A., Sanusi, A., Muda, I., and Kusuma, S. A. (2023). Performance Measurement at Universities: Systematic Literature Review. J. Soc. Sci. 4:1032–1042.
Bisquerra Alzina, R. (2012). Orientación, tutoría y educación emocional. en Educar, instruir. Madrid: Síntesis.
Brochado, A. (2009). Comparing alternative instruments to measure service quality in higher education. Qual. Assur. Educ. 17, 174–190. doi: 10.1108/09684880910951381
Browne, M. W., and Cudeck, R. (1993). “testing structural equation models, en alternative ways of assessing model fit” in Testing structural equation models (pp. 136–162). eds. K. A. Bollen and J. S. Long (Newbury Park, CA: Sage Publications), 136–162.
Byrne, B. (2016). Structural equation modeling with AMOS: Basic concepts, applications, and programming. New York and London: Routledge.
Byrne, M., and Flood, B. (2003). Assessing the teaching quality of accounting Programmes: an evaluation of the course experience questionnaire. Assess. Eval. High. Educ. 28, 135–145. doi: 10.1080/02602930301668
Cadima, I. T. J. J. (2016). Principal component analysis: a review and recent developments. Philos. Trans. R. Soc. Math. Phys. Eng. Sci. 374:20150202. doi: 10.1098/rsta.2015.0202
Camilleri, M. A. (2021). Evaluating service quality and performance of higher education institutions: a systematic review and a post-COVID-19 outlook. Int. J. Qual. Serv. Sci. 13, 268–281. doi: 10.1108/IJQSS-03-2020-0034
Carlson, B. A. (2001). Education and the labour market in Latin America: why measurement is important and what it tells us about policies, reforms and performance. en Serie Desarrollo productivo, no. 114. Santiago, Chile: Naciones Unidas, CEPAL, Division of Production, Productivity and Management, Restructuring and Competitiveness Network.
Carvajal-Morales, J. M., León-Plúas, E. E., Valenzuela-Cobos, J. D., and Guevara-Viejó, F. (2024). Educational Design in the Adoption of ICT for sustainable digital learning in social and business sciences: a structural equation model. Sustainability 16:10674. doi: 10.3390/su162310674
Clemes, M., Gan, C., Kao, T.-H., and Choong, M. (2008). An empirical analysis of customer satisfaction in international air travel. Innov. Mark. 4, 49–62.
Creswell, J. W., Creswell, J. D., Creswell, J. W., and Creswell, J. D. (2018). Research design: Qualitative, quantitative, and mixed methods approaches. Fifth Edn. Los Angeles London New Delhi Singapore Washington DC Melbourne: SAGE.
Cronbach, L. J. (1951). Coefficient alpha and the internal structure of tests. Psychometrika 16, 297–334. doi: 10.1007/BF02310555
Cronin, J. J., and Taylor, S. A. (1992). Measuring service quality: a reexamination and extension. J. Mark. 56, 55–68. doi: 10.1177/002224299205600304
Deming, W. E.. The essential Deming: Leadership principles from the father of quality. McGraw-Hill:Orsini, Joyce. Cambridge, Massachusetts: MIT Press. (2010).
Díaz-Ortiz, A., Durand-Rill, R., and Robinson-Jay, F.. La educación colaborativa interprofesional en los estudios de pre y posgrado en Ciencias de la Salud. Geneva, Switzerland: Zenodo. (2023). doi: 10.5281/ZENODO.7942994
Field, A. (2024). Discovering statistics using IBM SPSS statistics. London: Sage publications limited.
Forero, C. G., Maydeu-Olivares, A., and Gallardo-Pujol, D. (2009). Factor analysis with ordinal indicators: a Monte Carlo study comparing DWLS and ULS estimation. Struct. Equ. Model. Multidiscip. J. 16, 625–641. doi: 10.1080/10705510903203573
Fornell, C., and Larcker, D. F. (1981). Evaluating structural equation models with unobservable variables and measurement error. J. Mark. Res. 18, 39–50. doi: 10.1177/002224378101800104
García-Aracil, A., Monteiro, S., and Almeida, L. S. (2021). Students’ perceptions of their preparedness for transition to work after graduation. Act. Learn. High. Educ. 22, 49–62. doi: 10.1177/1469787418791026
Gbadamosi, G., and De Jager, J. (2009). ‘what you see is what you get’: service quality, students’ perceptions and satisfaction at south African universities, south Afr. J. High. Educ. 23, 877–893. doi: 10.4314/sajhe.v23i5.48806
Gibbs, G., and Coffey, M. (2004). The impact of training of university teachers on their teaching skills, their approach to teaching and the approach to learning of their students. Act. Learn. High. Educ. 5, 87–100. doi: 10.1177/1469787404040463
Gonzalez, R., and Padilla, A. M. (1997). The academic resilience of Mexican American high school students. Hisp. J. Behav. Sci. 19, 301–317. doi: 10.1177/07399863970193004
Guevara-Viejó, F., Valenzuela-Cobos, J., Coello-Viejó, J., Pacheco-Olea, F., and Yuqui-Ketil, M.. Innovative methodological framework for personalizing education through learning analytics and multivariate statistics, en EDULEARN Proceedings, Palma, Spain: IATED, (2025), pp. 8372.
Hadjistavropoulos, T. (2020). Discussing and debating the American Psychological Association’s ethical principles of psychologists and code of conduct. Ethics Behav. 30, 247–248. doi: 10.1080/10508422.2020.1738232
Hair, J. F., Black, W. C., Babin, B. J., Anderson, R. E., and Tatham, R. L. (2010). Multivariate data analysis. 7th Edn. New York: Pearson.
Hambleton, R. K., Merenda, P. F., and Spielberger, C. D., Eds., Adapting educational and psychological tests for cross-cultural assessment, 0 ed. New York, NY, USA: psychology press, (2004).
Harvey, L., and Green, D. (1993). defining quality, assess. Eval. High. Educ. 18, 9–34. doi: 10.1080/0260293930180102
Heilporn, G., Raynault, A., and Frenette, É. (2024). Student engagement in a higher education course: a multidimensional scale for different course modalities. Soc. Sci. Humanit. Open 9:100794. doi: 10.1016/j.ssaho.2023.100794
Henseler, J., Ringle, C. M., and Sarstedt, M. (2015). A new criterion for assessing discriminant validity in variance-based structural equation modeling. J. Acad. Mark. Sci. 43, 115–135. doi: 10.1007/s11747-014-0403-8
Hernández, R., Fernández, C., and Baptista, P. (2014). Metodología de la investigación. 6th Edn. México: McGraw-Hill, Ciudad de México.
Hernandez-Diaz, P. M., Polanco, J.-A., and Escobar-Sierra, M. (2021). Building a measurement system of higher education performance: evidence from a Latin-American country. Int. J. Qual. Reliab. Manag. 38, 1278–1300. doi: 10.1108/ijqrm-04-2020-0133
Hu, L., and Bentler, P. M. (1998). Fit indices in covariance structure modeling: sensitivity to underparameterized model misspecification. Psychol. Methods 3, 424–453. doi: 10.1037/1082-989X.3.4.424
Hu, L., and Bentler, P. M. (1999). Cut off criteria for fit indexes in covariance structure analysis: conventional criteria versus new alternatives. Struct. Equ. Model. Multidiscip. J. 6, 1–55. doi: 10.1080/10705519909540118
Kaiser, H. F. (1974). An index of factorial simplicity. Psychometrika 39, 31–36. doi: 10.1007/BF02291575
Kline, R. (2015). Principles and practice of structural equation modeling. New York: Guilford Publications.
Kucińska-Landwójtowicz, A., Czabak-Górska, I. D., Lorenc, M., Domingues, P., and Sampaio, P. (2023). Performance measurement model for technical universities – case study. Int. J. Qual. Reliab. Manag. 40, 2632–2663. doi: 10.1108/ijqrm-04-2021-0107
Kuh, G. D. (2009). What student affairs professionals need to know about student engagement. J. Coll. Stud. Dev. 50, 683–706. doi: 10.1353/csd.0.0099
Ladhari, R. (2009). A review of twenty years of SERVQUAL research. Int. J. Qual. Serv. Sci. 1, 172–198. doi: 10.1108/17566690910971445
Lounsbury, J. W., Saudargas, R. A., Gibson, L. W., and Leong, F. T. (2005). An investigation of broad and narrow personality traits in relation to general and domain-specific life satisfaction of college students. Res. High. Educ. 46, 707–729. doi: 10.1007/s11162-004-4140-6
Maldonado, M., and Moreta, X. (2017). Medición de Calidad del Servicio mediante Modelo SERPERF en Envasadora Ecuatoriana S.A. Guayaquil, Ecuador: Universidad de Guayaquil.
Mayuri-Ramos, E., Almazan-Rivera, E. S., Jesus-Cardenas, M. A., and Cordova-Buiza, F. (2023). Innovative strategies to maximize customer loyalty in the banking system: a systematic review. Eur. Conf. Innov. Entrep. 18, 587–595. doi: 10.34190/ecie.18.1.1781
Muñiz, J., and Fonseca-Pedrero, E. (2019). Diez pasos para la construcción de un test. Psicothema 1, 7–16. doi: 10.7334/psicothema2018.291
Muñoz-Alvarado, M. A., and Puente-Riofrío, M. I. (2025). Calidad del servicio en la universidad pública: un análisis de la satisfacción del estudiante universitario de posgrado. MQRInvestigar 9:e18. doi: 10.56048/MQR20225.9.1.2025.e18
Neyestani, B.. (2017). Principles And Contributions Of Total Quality Mangement (Tqm) Gurus On Business Quality Improvement. Geneva, Switzerland: Zenodo.
Nguyen, H. V., Vu, T. D., Saleem, M., and Yaseen, A. (2024). The influence of service quality on student satisfaction and student loyalty in Vietnam: the moderating role of the university image. J. Trade Sci. 12, 37–59. doi: 10.1108/JTS-12-2023-0032
Oldfield, B. M., and Baron, S. (2000). Student perceptions of service quality in a UK university business and management faculty. Qual. Assur. Educ. 8, 85–95. doi: 10.1108/09684880010325600
Parasuraman, A. P., and Zeithaml, V., y Berry, L.. SERVQUAL a multiple-item scale for measuring consumer perceptions of service quality. J. Retail., 64, 12–40, (1988).
Parlamento Europeo y Consejo de la Unión Europea. (2018). Reglamento General de Protección de Datos (GDPR). Bruselas, Bélgica, Parlamento Europeo y Consejo de la Unión Europea, Reglamento (UE) 2016/679. (En línea)
Pascarella, T. y Terenzin, P. How college affects students: A third decade of research. 2a edición. San Francisco: Jossey-Bass, (2005).
Perkins, M., Roe, J., Postma, D., McGaughran, J., and Hickerson, D. (2024). Detection of GPT-4 generated text in higher education: combining academic judgement and software to identify generative AI tool misuse. J. Acad. Ethics 22, 89–113. doi: 10.1007/s10805-023-09492-6
Petersen, P. B. (1999). Total quality management and the Deming approach to quality management. J. Manag. Hist. 5, 468–488. doi: 10.1108/13552529910290520
Posso-Pacheco, R. J., Gómez-Rodríguez, V.-G., Delgado-Álvarez, N.-B., Caicedo-Quiroz, R., Maqueira-Caraballo, G., and Barba-Miranda, L. C. (2024). Comparative analysis of infrastructure and resources for inclusive education: Ecuador and international perspectives. J. Infrastruct. Policy Dev. 8:8866. doi: 10.24294/jipd.v8i10.8866
Ramírez Valladares, C. O., Merino Flores, I., Carbajal Llauce, C. T. de J., Miguel Alberto, V. S., and Sandra Maribel, D. U. (2024). Modelo de gestión para la prestación de servicios administrativos del personal de un instituto tecnológico en piura. Barquisimeto 5, 1199–1219. doi: 10.5281/zenodo.13890692
Sahney, S., Banwet, D. K., and Karunes, S. (2008). An integrated framework of indices for quality management in education: a faculty perspective. TQM J. 20, 502–519. doi: 10.1108/17542730810898467
Silva, D. S., Moraes, G. H. S. M. D., Makiya, I. K., and Cesar, F. I. G. (2017). Measurement of perceived service quality in higher education institutions: a review of HEdPERF scale use. Qual. Assur. Educ. 25, 415–439. doi: 10.1108/QAE-10-2016-0058
Soutar, G. N., and Turner, J. P. (2002). Students’ preferences for university: a conjoint analysis. Int. J. Educ. Manag. 16, 40–45. doi: 10.1108/09513540210415523
Sultan, P., and Wong, H. Y. (2012). Service quality in a higher education context: an integrated model. Asia Pac. J. Mark. Logist. 24, 755–784. doi: 10.1108/13555851211278196
Teeroovengadum, V., Nunkoo, R., Gronroos, C., Kamalanabhan, T. J., and Seebaluck, A. K. (2019). Higher education service quality, student satisfaction and loyalty: validating the HESQUAL scale and testing an improved structural model. Qual. Assur. Educ. 27, 427–445. doi: 10.1108/QAE-01-2019-0003
Tinto, V. (1994). Leaving college: Rethinking the causes and cures of student attrition. Chicago: University of Chicago Press.
Trow, M.. Reflections on the transition from elite to mass to universal access: forms and phases of higher education in modern societies since WWII, en International handbook of higher education, vol. 18, J. J. F. Forest and P. G. Altbach, Dordrecht: Springer Netherlands, (2006), pp. 243–280
Wilkins, S., Butt, M. M., Kratochvil, D., and Balakrishnan, M. S. (2016). The effects of social identification and organizational identification on student commitment, achievement and satisfaction in higher education. Stud. High. Educ. 41, 2232–2252. doi: 10.1080/03075079.2015.1034258
Wilkins, S., Stephens Balakrishnan, M., and Huisman, J. (2012). Student satisfaction and student perceptions of quality at international branch campuses in the United Arab Emirates. J. High. Educ. Policy Manag. 34, 543–556. doi: 10.1080/1360080X.2012.716003
World Medical Association (2013). Declaration of Helsinki: ethical principles for medical research involving human subjects. JAMA 310:2191. doi: 10.1001/jama.2013.281053
Keywords: educational quality, student perception, higher education, HEdPERF, confirmatory factor analysis (CFA), principal component analysis (PCA), sustainable education, academic self-efficacy
Citation: Zapatier Castro SV, Noriega Verdugo DD, Farías Lema RM, Peña Holguín RR and Valenzuela Cobos JD (2025) Quality of educational service in public universities in Ecuador: a sustainable and equitable education approach. Front. Educ. 10:1595257. doi: 10.3389/feduc.2025.1595257
Edited by:
Pinaki Chakraborty, Netaji Subhas University of Technology, IndiaReviewed by:
Rudina Lipi, University of Vlora Ismail Qemali, AlbaniaPaula M. Hernandez-Diaz, Universidad EAFIT Escuela de Administracion, Colombia
Copyright © 2025 Zapatier Castro, Noriega Verdugo, Farías Lema, Peña Holguín and Valenzuela Cobos. This is an open-access article distributed under the terms of the Creative Commons Attribution License (CC BY). The use, distribution or reproduction in other forums is permitted, provided the original author(s) and the copyright owner(s) are credited and that the original publication in this journal is cited, in accordance with accepted academic practice. No use, distribution or reproduction is permitted which does not comply with these terms.
*Correspondence: Juan Diego Valenzuela Cobos, anZhbGVuenVlbGFjQHVuZW1pLmVkdS5lYw==