 Haidee A. Jackson
 Angela Starrett
 Bryndle Bottoms
- 1University of Texas Permian Basin, Odessa, TX, United States
- 2Educational and Developmental Science, University of South Carolina, Columbia, MO, United States
Introduction: This study examines how motivational processes in STEM education differ for rural students with and without Individualized Education Programs (IEPs) using Situated Expectancy-Value Theory (SEVT). The study advances theoretical understanding of STEM motivation in underrepresented populations and provides practical recommendations for creating inclusive rural STEM programs that leverage community strengths while meeting diverse learner needs.
Methods: Analyzing data from 1,957 rural high school students (444 with IEPs) in the HSLS:09 dataset, we established measurement invariance for four SEVT constructs-intrinsic value, utility value, expectancies for success, and teacher perceptions-confirming their equivalent measurement across groups.
Results: Results revealed students with IEPs reported slightly higher expectancies for success (β = 0.145, p < 0.05) but showed no differences in other motivational factors compared to peers without IEPs. Structural analyses demonstrated intrinsic value significantly predicted math effort (β = 0.219) and STEM aspirations (OR = 1.45) only for students without IEPs, while no motivational constructs predicted outcomes for IEP students despite their stronger baseline expectancies. Indirect effects with teacher perceptions were significant for both groups, suggesting educators play a crucial role in shaping motivation.
Discussion: These findings challenge assumptions about motivation deficits in special education populations while highlighting the need for differentiated interventions that address the unique barriers preventing rural students with IEPs from translating motivation into STEM engagement.
Introduction
STEM education serves as a critical driver of economic opportunity and national competitiveness, yet persistent disparities in access and achievement continue to marginalize rural students and those with disabilities—two populations that face intersecting systemic barriers (National Science Board, National Science Foundation, 2022). Approximately 20% of U.S. public school students attend rural schools (Showalter et al., 2023), where they encounter limited access to advanced coursework, STEM role models, and specialized instructional resources (Davis et al., 2023; Byun et al., 2012). These challenges are compounded for the 7.3 million students (15% of total enrollment) who qualify for special education services under the Individuals with Disabilities Education Act [(Individuals with Disabilities Education Act (IDEA), 2004)] through one of thirteen disability categories, including specific learning disabilities, autism spectrum disorder, emotional disturbance, and other health impairments (National Center for Education Statistics, 2024).
All public school students receiving special education services must also have an Individualized Education Program (IEP). An IEP is a personalized instructional planning document that facilitates educators in planning instruction to meet the learning needs of an individual student with a disability. As such, IEPs are unique to each student, and are routinely modified and adjusted through student, parental, and school involvement (i.e., special education services; educators; administrators) throughout the educational process. Despite spending at least 80% of their school day in general education settings (National Center for Education Statistics, 2024), students with IEPs remain dramatically underrepresented in STEM fields (Thurston et al., 2017; Kolne and Lindsay, 2020)—a disparity that is particularly acute in rural areas where remote schools serve higher proportions of students with disabilities than the national average (National Center for Education Statistics, 2024).
The complex nature of rurality itself presents unique challenges for educational research and practice. Definitions of rural vary substantially across federal agencies, reflecting the multidimensional nature of this construct. The U.S. Census Bureau employs an exclusionary approach, classifying any territory not meeting urban thresholds as rural, while the National Center for Education Statistics (NCES) uses a nuanced continuum ranging from “fringe rural” (within 5 miles of an urban area) to “remote rural” (more than 25 miles from urban centers) (Hartman and Klein, 2023; National Academies of Sciences Engineering and Medicine, 2024). This definitional complexity mirrors the substantial diversity among rural communities in terms of economic conditions, educational resources, and postsecondary opportunities. Recent data reveal stark disparities: 27% of remote rural households lack broadband access (National Center for Education Statistics, 2024), only 45% of rural high schools offer calculus compared to 72% of urban schools (Wolfe et al., 2023), and rural districts experience STEM teacher vacancy rates that are 300% higher than their urban counterparts (Peterson, 2017). Compounding these challenges, rural students with IEPs face additional barriers including limited access to special education specialists and assistive technologies (Provasnik et al., 2007).
Despite these systemic obstacles, rural schools possess unique strengths that may foster positive motivational development. Strong community ties, favorable student-teacher ratios, and opportunities for place-based learning represent potentially powerful assets (Echazarra and Radinger, 2019). Research suggests that close-knit rural communities often provide robust social capital and contextualized learning opportunities that can enhance student engagement (Byun et al., 2012; Hardré, 2011). However, these strengths remain underutilized in most motivational interventions, which are typically designed for urban and suburban contexts without consideration for rural cultural values or resource constraints (Hardré, 2011; Starrett et al., 2022).
For students with disabilities, the challenges in STEM participation are particularly severe. National data indicate they enroll in advanced mathematics courses at half the rate of their peers without disabilities (American Association for the Advancement of Science, 2014) and comprise just 1% of STEM degree recipients despite representing 15% of the K-12 student population [National Center for Science and Engineering Statistics (NCSES), 2023]. In addition to underrepresentation, students with disabilities face structural and cultural barriers that undermine their engagement, such as inaccessible instructional formats, stigma, and lack of institutional support. For example, Gin (2021) documented how evolving learning environments, including active learning, online instruction, and undergraduate research, can exacerbate or mitigate barriers for students with disabilities depending on how inclusively they are implemented. These challenges are further compounded for rural students with IEPs, who often experience geographic isolation from STEM enrichment opportunities and specialized services (Saw and Agger, 2021). These disparities persist despite multiple federal initiatives emphasizing STEM inclusion, including the White House STEM Initiative (2024), IDEA mandates for access to rigorous curricula, and the National Rural Education Association's research priorities focusing on college and career readiness (National Rural Education Association, 2022). The current study addresses these critical gaps by examining how motivational processes operate differently for rural students with and without IEPs using Situated Expectancy-Value Theory (SEVT; Eccles and Wigfield, 2020).
SEVT provides an ideal theoretical framework for this investigation as it extends traditional Expectancy-Value Theory (EVT; Eccles et al., 1983) by emphasizing how contextual factors shape motivation (Eccles and Wigfield, 2020). While EVT focuses primarily on individual beliefs about their abilities and the value they place on academic tasks, SEVT incorporates three key additional elements: (1) situational influences (e.g., teacher relationships, classroom climate), (2) developmental changes in motivation across adolescence, and (3) sociocultural filters that affect how students perceive opportunities. This expanded framework is particularly well-suited to rural special education contexts where teacher relationships take on heightened importance due to small school sizes (Wentzel, 2016), community values strongly shape career aspirations (Starrett et al., 2022), and resource constraints fundamentally alter students' cost-benefit calculations about STEM participation.
Notably, most special education motivation research has focused on Self-Determination Theory (Deci and Ryan, 1985) or goal orientation frameworks (Meece et al., 2006), largely neglecting the potential of SEVT despite its stronger predictive power for STEM-related choices (Wang, 2013). Self-Determination Theory emphasizes universal psychological needs for autonomy, competence, and relatedness, while goal orientation theory examines students' mastery vs. performance approaches to learning (Anderman and Wolters, 2006). Although valuable, these frameworks often fail to account for the situated, contextual factors that SEVT explicitly incorporates—a limitation that may explain their inconsistent success when applied to rural special education contexts (Louick and Muenks, 2022).
Our study examines four core SEVT constructs that may function differently for rural students with IEPs compared to their peers without disabilities. First, intrinsic value (enjoyment of mathematics) may be systematically lower for students with IEPs due to accumulated negative learning experiences (Wigfield and Ponnock, 2020). Second, utility value (perceived usefulness of mathematics) could be higher in rural areas with visible STEM employment opportunities in fields like agriculture technology or healthcare (Zilberman and Ice, 2021). Third, expectancies for success are often undermined by stereotype threat and repeated academic struggles for students with disabilities (Louick and Muenks, 2022). Fourth, teacher perceptions take on amplified importance in rural schools where educators frequently fill multiple roles and have enduring relationships with students across grade levels (Hardré, 2011).
The current research addresses three significant limitations in existing literature. First, an urban bias pervades educational research, with ~78% of motivation studies sampling exclusively from urban and suburban schools (Lubke and Muthén, 2004). Second, students with disabilities are strikingly absent from STEM motivation research, comprising only about 5% of participants in major studies [National Center for Science and Engineering Statistics (NCSES), 2023]. Third, most interventions use Self-Determination Theory or goal orientation frameworks rather than SEVT's more contextually-sensitive approach (Louick and Muenks, 2022), despite evidence that SEVT better predicts STEM course-taking and career choices (Wang, 2013).
Our study advances the field in four key ways. First, we test measurement invariance of SEVT constructs across IEP groups to ensure these motivational factors are being measured equivalently. Second, we compare latent means in motivational beliefs between rural students with and without IEPs. Third, we analyze structural relationships between motivational beliefs and STEM outcomes (math effort and career aspirations). Fourth, we examine indirect pathways through teacher perceptions that may differentially mediate outcomes for students with IEPs. These analyses will inform both universal design principles for rural STEM motivation interventions and differentiated strategies that address the specific needs of students with disabilities.
Four research questions guide our study:
1. Do SEVT constructs demonstrate measurement invariance across rural students with and without IEPs, ensuring these motivational factors are being measured equivalently?
2. Are there significant group differences in latent means for intrinsic value, utility value, expectancies for success, or teacher perceptions?
3. How do structural relationships between motivational beliefs and outcomes (math effort and STEM aspirations) differ between groups?
4. Do indirect pathways through teacher perceptions mediate outcomes differently for students with IEPs?
By addressing these questions, we move beyond the current “one-size-fits-all” approach to STEM motivation that dominates both research and practice. Our findings will support the development of targeted strategies that respect both the unique aspects of rural contexts and the specific needs of students with disabilities. Moreover, this work will provide much-needed theoretical clarity about how motivation operates at the intersection of rural education and special education—two fields that have rarely been studied in tandem despite their practical connections in schools.
Globally, filling STEM fields is critical to ensuring the economic and technological progress of all societies. Students' affective and physiological responses to math, generative of math anxiety and lack of confidence in math performance, may impact whether they choose to enter into STEM fields (Furner and Duffy, 2022). Notably, individuals with disabilities have been found to be highly underrepresented in STEM fields in the U.S. (Thurston et al., 2017). Students with disabilities disparately enroll in math courses in high school as compared to students without disabilities, in addition to pursuing post-secondary STEM areas of study (American Association for the Advancement of Science, 2014; Kolne and Lindsay, 2020). Hence, understanding how motivational factors may be associated with students' interest in pursuing STEM fields presents a key issue to be addressed within the educational process for all students within general and special education.
The ultimate goal of this research is to inform interventions that unlock the potential of rural students with and without disabilities as contributors to the STEM workforce. In doing so, we aim to advance both educational equity and national competitiveness while providing concrete guidance for teachers working in rural special education contexts. Our focus on SEVT represents a deliberate choice to employ the motivational framework best suited to understanding how rural contexts and disability status interact to shape students' STEM trajectories. The findings will have important implications for teacher education programs, IEP development processes, and rural STEM initiatives seeking to broaden participation among traditionally underserved populations.
Methods
Data
The High School Longitudinal Study of 2009 [(National Center for Science and Engineering Statistics (NCSES), 2023) HSLS:09] is a nationally representative, longitudinal dataset developed by the National Center for Education Statistics (NCES) to examine students' trajectories from the beginning of high school into postsecondary education and the workforce (Ingels et al., 2011). The study began with a cohort of more than 23,000 ninth-grade students from 944 public and private schools across the United States in fall 2009. HSLS:09 is unique among large-scale federal datasets in its emphasis on STEM aspirations and achievement, with a particular focus on mathematics and science coursework, student attitudes, and career interests. The dataset includes extensive information collected from students, parents, teachers, counselors, and school administrators, with follow-up data collected in 2012 and 2016. HSLS:09 also includes transcript records, test scores, and information on students' postsecondary enrollment and employment. The study incorporates rich contextual variables related to school characteristics, instructional practices, and student experiences, making it an ideal resource for examining the development of academic motivation and career aspirations over time. The current study draws on the base-year (2009) and second follow-up (2012) data to explore math motivation and STEM career interests among rural students, comparing those with and without IEPs.
Participants
As shown in Table 1, the final sample included 444 students with IEPs and 1,513 students without IEPs, resulting in a total sample size of 1,957 students attending rural schools. Classification of IEP status and rural location are detailed in Variables. For students with IEPs, 36% were female compared to 52% for students without IEPs. For students with IEPs, 58% identified as White, 18% as non-Hispanic Black or African-American, 12% as Hispanic, and 11% as Asian. For students without IEPs, 60% identified as White, 17% as Hispanic, 16% as Black or African-American, and 7% as Asian.
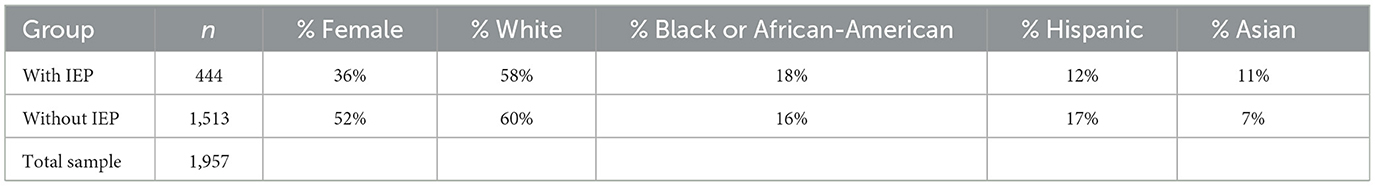
Table 1. Participant demographics.
Variables
Rural classification
To focus the analysis on rural students, the study used the X1LOCALE variable, which indicates the locale (or urbanicity) of each student's base year school based on data from the 2005–2006 Common Core of Data (CCD) and Private School Survey (PSS). This variable categorizes schools into four types: City (1), Suburb (2), Town (3), and Rural (4). For the purposes of this study, only students attending schools classified as “Rural” (coded as 4) were included in the analytic sample. This allowed for the examination of motivational constructs and STEM-related outcomes specifically within rural educational contexts.
IEP status
Students' disability status was determined using the variable X1IEPFLAG, which identified whether a student had an IEP in place during 9th grade. This information was obtained from official school enrollment records or sampled student rosters provided by school personnel. In some cases, IEP status was inferred from parent responses indicating the student was receiving special education services. However, students could still be coded as having an IEP even if parents did not report special education services, provided that schools confirmed the presence of an IEP. This variable was used to create a binary indicator distinguishing students with IEPs (coded as 1) from those without IEPs (coded as 0), allowing for comparative analyses of motivational constructs and outcomes across these two groups.
Intrinsic value
Students' intrinsic motivation toward math in 9th grade was measured using a three-item scale that captured their affective responses to math class. The items included whether students enjoyed their math class (S1MENJOYING), whether they found it boring (S1MBORING), and whether they felt it was a waste of time (S1MWASTE). Responses were provided on a four-point Likert scale ranging from 1 (Strongly agree) to 4 (Strongly disagree). The enjoyment item was reverse-coded so that higher values reflected greater enjoyment of math, while the boredom and waste items were coded such that higher values indicated more positive affect. The scale demonstrated acceptable internal consistency (α = 0.77) and served as a key motivational construct within the SEVT framework.
Utility value
Students' perceptions of the usefulness of math in 9th grade were assessed through a three-item scale reflecting the perceived relevance of math for various aspects of their lives. The items asked how useful students believed math was for everyday life (S1MUSELIFE), for succeeding in college (S1MUSECLG), and for achieving success in a future career (S1MUSEJOB). Each item was rated on a four-point Likert scale from 1 (Strongly agree) to 4 (Strongly disagree), and responses were reverse-coded so that higher values indicated greater perceived utility of math. The scale demonstrated acceptable internal consistency (α = 0.79) and was included as one of the core components of the SEVT framework applied in the study.
Expectancies for success
Students' beliefs about their ability to succeed in math in 9th grade were measured using a four-item scale reflecting their self-perceptions of competence and confidence in the subject. The items included: perceived ability to acquire new skills in math (S1MSKILLS), to perform well on math assignments (S1MASSEXCL), to perform well on math tests (S1MTESTS), and to understand the math textbook (S1MTEXTBOOK). Each item was rated on a four-point Likert scale ranging from 1 (Strongly agree) to 4 (Strongly disagree), and reverse-coded so that higher scores represented stronger expectancies for success. This construct demonstrated strong internal reliability (α = 0.89) and was used as one of the core components of the SEVT model in this study.
Perception of their math teacher
Students' perceptions of their 9th-grade math teacher were assessed using a five-item scale capturing how valued and supported they felt in the classroom. Items included: whether students believed their math teacher valued or listened to students' ideas (S1MVALUES), treated students with respect (S1MTCHRESPCT), treated every student fairly (S1MTCHFAIR), believed all students could be successful (S1MTCHCONF), and thought mistakes were acceptable if students learned from them (S1MTCHMISTKE). All items were measured on a four-point Likert scale ranging from 1 (Strongly agree) to 4 (Strongly disagree), and were reverse-coded so that higher values indicated more positive perceptions of the teacher. The five items demonstrated strong internal consistency with a Cronbach's alpha of 0.90. This construct was included as a situated influence in the larger SEVT framework, representing students' perceptions of their learning environment and the support they receive from their math teacher.
Math effort
Students' self-reported effort in their 11th-grade math class was measured using the variable X2MEFFORT, a standardized composite scale created through principal components factor analysis. This scale incorporated responses from four items: attentiveness in math class (S2MATTENTION), time spent on math homework (S2MONTIME), tendency to give up (S2MSTOPTRYING), and tendency to do the minimum to get by (S2MGETBY). The resulting scale has a mean of 0 and standard deviation of 1, with higher scores indicating greater effort and engagement in math.
STEM aspirations
Students' STEM career aspirations in 11th grade were measured using a recoded version of the HSLS:09 variable X2STU30OCC_STEM1, which captures students' expected occupation at age 30 and categorizes it by STEM sub-domain. The original variable classified responses into six STEM sub-domains (e.g., life and physical sciences, social sciences, health, etc.), along with non-STEM occupations (coded as 0) and uncodeable responses (coded as 9). For this study, the variable was dichotomized to indicate whether a student aspired to a STEM career: responses indicating any STEM sub-domain (values 1–6) were recoded as 1 (STEM aspirations), and a value of 0 was retained to indicate no STEM aspirations. Responses coded as uncodeable (9) were treated as missing. This binary indicator allowed for clear comparison of STEM vs. non-STEM occupational expectations among students.
Data analysis
To assess measurement invariance, multi-group confirmatory factor analysis (MG-CFA) was conducted separately for students with and without IEPs. While the sample sizes were unbalanced (444 students with IEPs and 1,513 without IEPs), this degree of imbalance is considered acceptable for testing factorial invariance (Yoon and Lai, 2017). The four motivational constructs—intrinsic value, utility value, expectancies for success, and teacher perceptions—were modeled using confirmatory factor analysis, with multiple levels of invariance tested: configural, metric, scalar, and residual.
To assess model fit, we considered the root mean square error of approximation (RMSEA), standardized root mean square residual (SRMR), and the comparative fit index (CFI). RMSEA values ≤ 0.08 indicate acceptable fit and ≤ 0.05 good fit (Bandalos, 2018). SRMR values ≤ 0.08 are acceptable, and values ≤ 0.05 are considered good (Bandalos, 2018). CFI values ≥0.95 indicate good fit, while values >0.90 are acceptable (Bandalos, 2018). Mplus version 8.10 was used for analysis, employing maximum likelihood with robust standard errors (MLR) and incorporating Balanced Repeated Replication (BRR) weights to account for the complex survey design of HSLS:09 (Stapleton, 2008). MLR provides robust standard errors and chi-square corrections, and the approach is suitable for unequal group sizes and non-normal data.
The invariance assessment proceeded sequentially, beginning with configural invariance to establish whether the same factor structure was present across both groups. Metric invariance was then tested to determine if factor loadings were equivalent, indicating that students with and without IEPs conceptualized the motivational constructs similarly. Next, scalar invariance was assessed to examine whether item intercepts were equivalent, allowing for meaningful comparisons of latent means between groups. Finally, residual invariance was evaluated to determine if measurement errors differed systematically between groups.
Measurement invariance was evaluated based on established criteria: ΔCFI ≤ 0.01, ΔRMSEA ≤ 0.015, and ΔSRMR ≤ 0.04 between nested models (Cheung and Rensvold, 2002). The Satorra-Bentler chi-square difference test utilized the adjusted chi-square for design effects following Stapleton's (2008) recommendation by dividing by the average design effect. If these thresholds were exceeded, modifications would be explored to establish partial invariance while maintaining interpretability. Upon establishing scalar invariance, latent mean differences would be examined to compare motivational beliefs between students with and without IEPs. Additionally, after establishing invariance, structural relationships between motivational constructs and outcomes (math effort and STEM aspirations) were examined. Additionally, indirect effects among motivational constructs were assessed using bias-corrected bootstrapped confidence intervals to provide robust estimates of mediation effects. The analysis of indirect effects focused on identifying specific motivational pathways that differed or were consistent between groups. The model used full information maximum likelihood for missing data and BRR weights for variance estimation. This rigorous approach ensured that any observed group differences reflected true variation in motivational perceptions rather than measurement artifacts.
Results
We conducted a series of multi-group confirmatory factor analyses to assess measurement invariance for the SEVT constructs (i.e., intrinsic value, utility value, expectancies for success, and perceptions of the teacher) across students with and without IEPs. Following established guidelines (Cheung and Rensvold, 2002; Chen, 2007), we compared increasingly constrained models (configural, metric, scalar, and residual) and examined changes in the CFI, RMSEA, SRMR. Although we report the scaled chi-square difference test (Satorra-Bentler adjusted), we primarily relied on changes in CFI, RMSEA, and SRMR for invariance decisions, as chi-square tests can be overly sensitive to sample size (Cheung and Rensvold, 2002; Chen, 2007). See Table 2 for results.
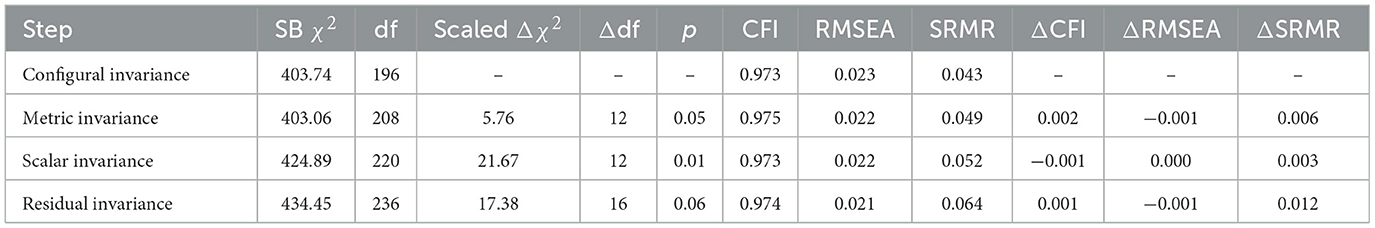
Table 2. Multi-group measurement invariance results for students with and without IEPs.
Configural invariance
The configural model, which tests whether the factor structure is equivalent across groups, demonstrated good fit (CFI = 0.973, RMSEA = 0.023, SRMR = 0.043), supporting the baseline factor structure for both groups.
Metric invariance
Constraining factor loadings to be equal across groups resulted in a non-significant chi-square difference (Δχ2 = 5.76, Δdf = 12, p = 0.05) and minimal changes in fit (ΔCFI = +0.002, ΔRMSEA = −0.001, ΔSRMR = +0.006). The overall fit remained strong (CFI = 0.975, RMSEA = 0.022, SRMR = 0.049), with the change in CFI well below the |0.01| threshold (Cheung and Rensvold, 2002) and RMSEA decreasing slightly. While SRMR increased, it was still below the |0.04| threshold. Thus, metric invariance was supported, indicating that factor loadings were equivalent across groups.
Scalar invariance
Further constraining item intercepts yielded a small but significant chi-square difference (Δχ2 = 21.67, Δdf = 12, p = 0.01), yet the practical changes in fit indices were negligible (ΔCFI = −0.001, ΔRMSEA = 0.000, ΔSRMR = +0.003). The model retained good fit (CFI = 0.973, RMSEA = 0.022, SRMR = 0.052), supporting scalar invariance. This allows for meaningful comparisons of latent means between groups.
Residual invariance
Finally, constraining residual variances led to a non-significant chi-square difference (Δχ2 = 17.38, Δdf = 16, p = 0.06), with minimal changes in fit (ΔCFI = +0.001, ΔRMSEA = −0.001, ΔSRMR = +0.012). The model maintained acceptable fit (CFI = 0.974, RMSEA = 0.021, SRMR = 0.064), though the SRMR increase suggested minor group differences in item-level variability. Given the emphasis on ΔCFI and ΔRMSEA, residual invariance was deemed reasonable.
The results support full metric and scalar invariance, confirming that the SEVT constructs were measured equivalently across students with and without IEPs. Residual invariance was also largely supported, with only minor deviations in SRMR. These findings justify further comparisons of structural relationships between motivational factors and outcomes (math effort and STEM career aspirations) across groups.
Latent mean comparisons
After establishing scalar invariance, we compared latent means between groups by constraining the non-IEP group's means to zero and freely estimating the IEP group's means. Results revealed a small but statistically significant difference in expectancies for success, with students with IEPs scoring 0.149 units higher on the unstandardized latent scale (SE = 0.071, p = 0.037), corresponding to a standardized effect size of β = 0.145. No significant group differences emerged for intrinsic value (b = −0.048, SE = 0.091, β = −0.053, p = 0.596), utility value (b = 0.043, SE = 0.086, β = 0.039, p = 0.615), or teacher perceptions (b = 0.020, SE = 0.080, β = 0.021, p = 0.802). These findings suggest that while both groups generally held similar motivational beliefs, students with IEPs reported slightly stronger expectancies for success in mathematics.
Structural path analysis
After establishing invariance, structural paths from motivational constructs to math effort and STEM aspirations were analyzed for each group separately (Figures 1, 2). For students without IEPs, the structural equation model revealed distinct patterns of association between motivational beliefs and academic outcomes. Regarding math effort (a continuous outcome), intrinsic value emerged as the only significant predictor (b = 0.294, SE = 0.128, p = 0.022; β = 0.219, SE = 0.090, p = 0.015), and the effect was small. Neither expectancies (b = 0.168, p = 0.287) nor utility value (b = −0.105, p = 0.366) demonstrated significant relationships with math effort.

Figure 1. Structural equation model depicting the direct effects of 9th-grade math motivation on 11th-grade math effort and STEM career aspirations for rural students without IEPs. Standardized estimates are presented. Solid lines represent paths that were significant (p < 0.001).
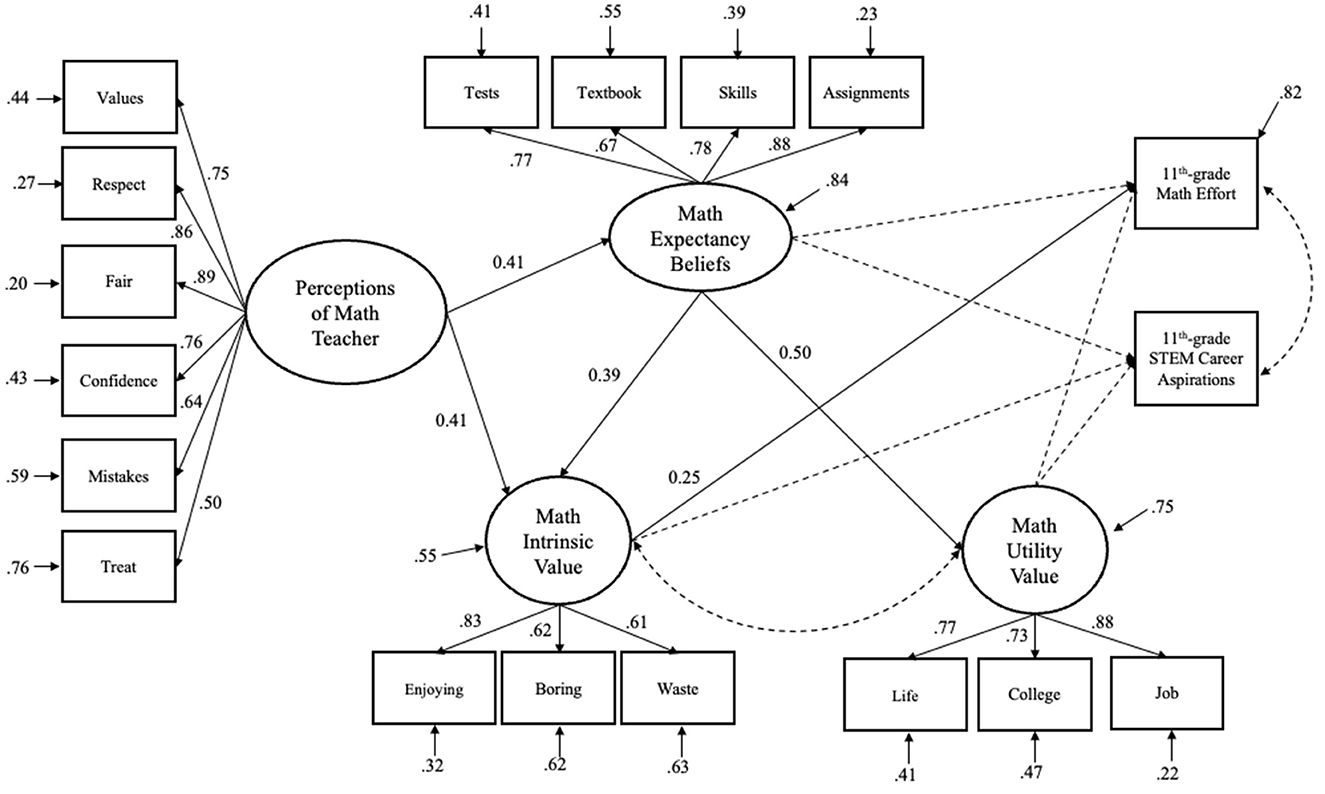
Figure 2. Structural equation model depicting the direct effects of 9th-grade math motivation on 11th-grade math effort and STEM career aspirations for rural students with IEPs. Standardized estimates are presented. Solid lines represent paths that were significant (p < 0.001).
For the binary STEM aspirations outcome, logistic regression results showed that intrinsic value significantly predicted higher odds of STEM career interest [log-odds = 0.375, SE = 0.109, p = 0.001; OR = 1.45, 95% CI [1.17, 1.80]]. This indicates that each one-unit increase in intrinsic value was associated with 45% greater odds of having STEM aspirations. Expectancies (log-odds = −0.104, p = 0.494; OR = 0.90) and utility value (log-odds = 0.097, p = 0.454; OR = 1.10) did not significantly predict STEM aspirations.
For students with IEPs, different patterns emerged. For math effort, no significant paths emerged for expectancies (b = 0.380, SE = 0.214, p = 0.076), intrinsic value (b = 0.354, SE = 0.196, p = 0.072), or utility value (b = 0.020, SE = 0.179, p = 0.912). For STEM aspirations, none of the motivational beliefs reached statistical significance: expectancies showed a negative but non-significant association (log-odds = −0.399, p = 0.168; OR = 0.67), while intrinsic value (log-odds = 0.197, p = 0.413; OR = 1.22) and utility value (log-odds = 0.251, p = 0.379; OR = 1.29) showed positive but non-significant relationships.
Indirect effects
Analysis of indirect effects revealed significant motivational pathways for students both with and without IEPs. For students without IEPs, the total indirect effect of teacher perceptions on math effort was significant [β = 0.069, 95% CI [0.032, 0.126]], with the expectancies and intrinsic value pathway emerging as notably important [β = 0.041, 95% CI [0.015, 0.069]]. The indirect pathway from teacher perceptions to intrinsic value was also significant [β = 0.188, 95% CI [0.134, 0.245]].
Similarly, students with IEPs showed significant total indirect effects of teacher perceptions on math effort [β = 0.136, 95% CI [0.067, 0.226]]. Specific significant pathways included the expectancies and intrinsic value pathway [β = 0.039, 95% CI [0.001, 0.115]] and the indirect effect through expectancies alone [β = 0.095, 95% CI [0.005, 0.229]]. Additionally, the indirect path from teacher perceptions to intrinsic value was significant for students with IEPs [β = 0.160, 95% CI [0.067, 0.280]]. Notably, all confidence intervals for these indirect effects overlapped between students with and without IEPs, indicating that despite minor numeric differences, the strength and significance of these indirect motivational pathways were statistically similar across groups.
Discussion
This study examined how motivational factors related to mathematics and STEM career aspirations differ between rural students with and without IEPs, guided by the Situated Expectancy-Value Theory (SEVT). Our findings provide important insights into the motivation of rural students, highlighting both similarities and differences across student groups.
Key findings and theoretical implications
The measurement invariance analyses confirmed that the SEVT constructs operate equivalently across rural students with and without IEPs, establishing the psychometric validity of comparing motivational beliefs between these groups. This demonstrates that both groups conceptualize these motivational constructs similarly, supporting the universal applicability of SEVT in rural educational contexts. Our findings extend prior research by highlighting the value of SEVT in rural and special education contexts. Historically, motivational research in special education has predominantly relied upon Self-Determination Theory and goal orientation frameworks (Louick and Muenks, 2022; Meece et al., 2006). However, our study demonstrates that SEVT provides a comprehensive framework capable of capturing both universal motivational elements (e.g., the significance of intrinsic enjoyment in math) and the nuanced motivational dynamics present among students with disabilities (Wigfield and Ponnock, 2020).
Despite this overall consistency, we observed subtle yet important differences in how motivational beliefs influenced students' math effort and STEM aspirations. The latent mean comparisons revealed that students with IEPs reported slightly but significantly higher expectancies for success compared to their peers without IEPs, while showing no differences in intrinsic value, utility value, or teacher perceptions. This finding represents an important asset: students with IEPs reported stronger expectancies for success than their non-IEP peers, suggesting that despite systemic barriers, some students with disabilities in rural schools hold high academic self-beliefs. This aligns with asset-based approaches that seek to identify and leverage students' internal strengths and challenges deficit assumptions about disability and motivation (Gin, 2021; Louick and Muenks, 2022). Additionally, this finding suggests that rural contexts may foster unique expectancy patterns, perhaps through stronger teacher-student relationships or community support systems (Byun et al., 2012; Hardré, 2011).
The structural analyses revealed striking group differences in how motivational beliefs predicted outcomes. Students without IEPs who enjoyed math more (intrinsic value) tended to invest greater effort in math classes and were more likely to aspire to STEM careers. This finding aligns with prior research emphasizing the critical role of intrinsic motivation in promoting engagement and long-term interest in STEM fields (Wigfield and Eccles, 2020; Furner and Duffy, 2022). In contrast, none of the motivational constructs significantly predicted outcomes for students with IEPs, despite their higher baseline expectancies. This motivational disconnect may reflect deeper structural barriers that inhibit students with disabilities from translating interest or self-efficacy into academic engagement or long-term STEM participation. For example, Gin et al. (2021) found that undergraduates with disabilities often struggle to access accommodations, are underestimated by instructors, and experience epistemic marginalization in STEM contexts. These systemic challenges may limit how effectively internal motivation translates into active engagement or persistence in STEM fields among rural students with disabilities.
Moreover, our analysis of indirect effects illustrates the essential role teachers play in shaping students' intrinsic motivation and expectancy beliefs, consistent with prior findings regarding teacher-student relationships (Wentzel, 2016; Hardré, 2011). Regardless of IEP status, students who felt their teachers respected, supported, and believed in them showed stronger intrinsic value and expectancy beliefs, which indirectly boosted their math effort. This underscores the powerful influence teachers hold, particularly within rural schools where close teacher-student relationships are common due to smaller class sizes and greater continuity across grades (Starrett et al., 2022).
Implications for policy and practice
The findings from this study offer several critical implications for enhancing STEM education in rural schools. First, IEP teams should explicitly integrate SEVT constructs into goal-setting and accommodation planning. For example, IEPs could include specific strategies to strengthen expectancies for success (e.g., “The teacher will provide advance organizers and scaffolded practice to build confidence in problem-solving”) and utility value (e.g., “Math lessons will incorporate real-world applications relevant to local agricultural or healthcare careers”). Such intentional documentation may help bridge the motivation-engagement gap observed among students with IEPs, ensuring that their higher baseline expectancies translate into meaningful participation in STEM learning.
Second, given the significant indirect effects of teacher perceptions on student motivation, rural school districts should prioritize professional development that equips educators with evidence-based strategies. Training should focus on cultivating growth mindsets, particularly for students with IEPs, by emphasizing effort-based praise and mastery-oriented feedback. Additionally, teachers need support in making explicit connections between STEM content and future career pathways, as well as leveraging place-based learning opportunities that align with rural community values (Zilberman and Ice, 2021). For instance, professional learning communities could collaborate to design math lessons that apply geometric concepts to local trades like construction or engineering challenges in regional industries.
While some educators may already implement these strategies, our findings highlight the importance of making them more intentional and directly tied to students' motivational profiles. These recommendations are not based on observed classroom practice but emerge from theory-driven analysis of student beliefs. Additional supports, such as structured goal-setting activities, scaffolded project-based learning, and explicit career mapping, may help students with IEPs translate high expectancies into meaningful engagement with STEM learning and planning.
Third, STEM intervention programs could adopt differentiated approaches tailored to the distinct motivational profiles of rural students. For general education populations, interventions should emphasize fostering intrinsic value through inquiry-based and hands-on pedagogies that spark curiosity. For students with IEPs, programs should pair expectancy-building strategies (e.g., incremental skill development, peer modeling) with structured goal-setting supports to help them connect their beliefs to concrete outcomes. Across both groups, interventions should capitalize on rural strengths, such as close-knit community networks, by developing mentorship programs that link students with local STEM professionals who share similar backgrounds.
Finally, these findings underscore the need for policy actions at the federal and state levels. Initiatives like the White House STEM Initiative (2024) and IDEA implementation grants should allocate funding for research on rural-specific motivational interventions, particularly those serving students with disabilities. Policymakers should also incentivize partnerships between rural schools and STEM employers to create pipelines for work-based learning experiences. Additionally, addressing persistent technology gaps, such as expanding broadband access and providing devices for students in remote areas, is essential to ensure equitable access to digital STEM resources. By aligning these policy, pedagogical, and IEP-based strategies, stakeholders can create ecosystems that nurture STEM motivation and participation for all rural learners, regardless of disability status. This multi-tiered approach, spanning classroom practice, teacher development, and systemic policy, offers a roadmap for transforming rural STEM education in ways that honor the unique assets and needs of these communities while advancing equity for students with disabilities.
Limitations and future directions
Several limitations should be considered when interpreting findings from this study. First, the reliance on self-reported survey data introduces the possibility of response bias, such as social desirability, meaning students may have answered questions based on what they believed was favorable rather than providing accurate reflections of their actual beliefs or behaviors. Additionally, treating students with IEPs as a homogeneous group may obscure important variability, as this group includes diverse disability categories, each with unique educational needs and motivational profiles. Although the study used a nationally representative dataset of rural students, results may not generalize fully across all rural contexts due to localized nuances in rural communities. Moreover, the study did not account for several potentially influential factors, such as parental influences, peer relationships, or community attitudes toward STEM, any of which could impact students' motivational beliefs and outcomes. Finally, because the study focused exclusively on mathematics motivation, it does not provide insight into students' motivational beliefs or career aspirations in other STEM disciplines like science, technology, engineering, or interdisciplinary contexts.
Future studies might also explore moderating variables, such as gender, socioeconomic status, parental involvement, or extracurricular STEM opportunities, to more comprehensively understand motivational dynamics. Given the significance of intrinsic value, interventions explicitly designed to enhance students' enjoyment and perceived relevance of math should be tested rigorously within rural educational contexts.
Additionally, future research could examine how evolving policy environments and political discourse affect access to STEM opportunities and motivation for rural students with disabilities. Legislative changes related to education funding, inclusive practices, or STEM curriculum requirements may shape the resources available to schools and influence how students experience math instruction. Understanding how these macro-level dynamics interact with local rural conditions would enrich the field's understanding of how to sustain motivation and equity in diverse political climates.
As the STEM policy and workforce landscape continues to evolve, future studies might integrate emerging conceptual models, such as the braided river model (Alemán-Díaz et al., 2025), to better situate students' motivational trajectories within broader understandings of rural labor markets and inclusive pathways into STEM. These models may be particularly useful in exploring how rural students with IEPs can pursue diverse forms of STEM participation that reflect both academic and workforce-based engagement.
Conclusion
The findings of this study highlight the nuanced ways in which math motivation manifests among rural students with and without IEPs, revealing both universal patterns and group-specific dynamics in STEM education. The successful establishment of measurement invariance confirms that key SEVT constructs (i.e., intrinsic value, utility value, expectancies for success, and teacher perceptions) are measured consistently across both populations, validating the applicability of this theoretical framework in rural special education contexts. Importantly, our results challenge deficit assumptions about students with disabilities by demonstrating their comparable (and in some cases stronger) motivational profiles, while simultaneously identifying critical gaps in how these beliefs translate to STEM engagement. This dual insight underscores the need for interventions that both capitalize on shared motivational mechanisms and address the unique barriers faced by rural students with IEPs, particularly in connecting their academic confidence to concrete participation in STEM pathways.
This research makes significant contributions to advancing equitable STEM education by demonstrating how SEVT can illuminate motivational processes at the intersection of rurality and disability. The psychometrically rigorous approach—combining measurement invariance testing with analyses of structural and indirect effects—provides a replicable model for future studies examining educational disparities in under-researched populations. As policymakers and educators work to address STEM workforce shortages (National Science Board, National Science Foundation, 2022), these findings offer actionable guidance: interventions must leverage rural communities' strengths, such as close teacher-student relationships and place-based learning opportunities, while implementing targeted strategies to help students with IEPs bridge the motivation-engagement gap. Ultimately, this study advocates for an inclusive approach to rural STEM education—one that recognizes the universal applicability of motivational theory while responding to the distinctive needs of diverse learners in these underrepresented communities.
Data availability statement
Publicly available datasets were analyzed in this study. This data can be found here: https://nces.ed.gov/surveys/hsls09/hsls09_data.asp.
Ethics statement
Ethical approval was not required for the study involving humans in accordance with the local legislation and institutional requirements. Written informed consent to participate in this study was not required from the participants or the participants' legal guardians/next of kin in accordance with the national legislation and the institutional requirements.
Author contributions
HJ: Writing – original draft, Writing – review & editing. AS: Writing – original draft, Writing – review & editing. BB: Writing – original draft, Writing – review & editing.
Funding
The author(s) declare that financial support was received for the research and/or publication of this article. This research was supported in part by the Institute for Measurement Methodology in Rural STEM Education (IMMERSE- NSF#2126060) through NSF EHR Core Research: Building Capacity in STEM Education Research and in part by the Institute for Rural Education and Development, which was funded by the University of South Carolina Office of the Vice President for Research.
Conflict of interest
The authors declare that the research was conducted in the absence of any commercial or financial relationships that could be construed as a potential conflict of interest.
Generative AI statement
The author(s) declare that no Gen AI was used in the creation of this manuscript.
Publisher's note
All claims expressed in this article are solely those of the authors and do not necessarily represent those of their affiliated organizations, or those of the publisher, the editors and the reviewers. Any product that may be evaluated in this article, or claim that may be made by its manufacturer, is not guaranteed or endorsed by the publisher.
References
Alemán-Díaz, A., Hussen, S., Siam, A., Etson, C. M., Greenler, R. M., Lightner, T., et al. (2025). The adoption of the braided river model toward an inclusive STEM workforce for all. Mol. Biol. Cell 36, 1–8. doi: 10.1091/mbc.E24.09.0416
American Association for the Advancement of Science (2014). From college to careers: fostering inclusion of persons with disabilities in STEM. Science 344, 765–765. doi: 10.1126/science.2014.344.6185.344_765c
Anderman, E. M., and Wolters, C. A. (2006). “Goals, values, and affect: influences on student motivation,” in Handbook of Educational Psychology, eds. P. A. Alexander and P. H. Winne (Mahwah, NJ: Lawrence Erlbaum Associates Publishers), 369–389.
Bandalos, D. L. (2018). Measurement Theory and Applications for the Social Sciences. New York, NY: The Guilford Press.
Byun, S. Y., Meece, J. L., and Irvin, M. J. (2012). Rural-nonrural disparities in postsecondary educational attainment revisited. Am. Educ. Res. J. 49, 412–437. doi: 10.3102/0002831211416344
Chen, F. F. (2007). Sensitivity of goodness of fit indexes to lack of measurement invariance. Struct. Equat. Model. 14, 464–504. doi: 10.1080/10705510701301834
Cheung, G. W., and Rensvold, R. B. (2002). Evaluating goodness-of-fit indexes for testing measurement invariance. Struct. Equat. Model. 9, 233–255. doi: 10.1207/S15328007SEM0902_5
Davis, J., Cromartie, J., Farrigan, T., Genetin, B., Sanders, A., and Winikoff, J. (2023). Rural America at a Glance. USDA Economic Research Service, Bulletin Number 261. Available online at: https://www.ers.usda.gov/webdocs/publications/107838/eib-261.pdf (Accessed January 3, 2025).
Deci, E. L., and Ryan, R. M. (1985). Intrinsic Motivation and Self-Determination in Human Behavior. New York, NY: Plenum.
Eccles, J., Adler, T. F., Futterman, R., Goff, S. B., Kaczala, C. M., Meece, J. L., et al (1983). “Expectancies, values, and academic behaviors,” in Achievement and Achievement Motivation, ed. J. T. Spence (San Francisco, CA: W.H. Freeman), 75–146.
Eccles, J. S., and Wigfield, A. (2020). From expectancy-value theory to situated expectancy-value theory: a developmental, social cognitive, and sociocultural perspective on motivation. Contemp. Educ. Psychol. 61:101859. doi: 10.1016/j.cedpsych.2020.101859
Echazarra, A., and Radinger, T. (2019). Learning in Rural Schools: Insights from PISA, TALIS and the Literature. OECD Education Working Papers, No. 196. Paris: OECD Publishing.
Furner, J. M., and Duffy, M. L. (2022). Addressing math anxiety in a STEM world: preventative, supportive, and corrective strategies for the inclusive classroom. Eur. J. STEM Educ. 7:11. doi: 10.20897/ejsteme/12645
Gin, L. E. (2021). Challenges and Opportunities for Students With Disabilities in Evolving Learning Environments: Active Learning, Online Instruction, and Undergraduate Research [Order No. 28862023]. Arizona State University.
Gin, L. E., Guerrero, F. A., Brownell, S. E., and Cooper, K. M. (2021). COVID-19 and undergraduates with disabilities: challenges resulting from the rapid transition to online course delivery for students with disabilities in undergraduate STEM at large-enrollment institutions. CBE Life Sci. Educ. 20:ar36. doi: 10.1187/cbe.21-02-0028
Hardré, P. L. (2011). Motivation for math in rural schools: student and teacher perspectives. Math. Educ. Res. J. 23, 213–233. doi: 10.1007/s13394-011-0012-5
Hartman, S. L., and Klein, B., (eds.). (2023). The Middle of Somewhere: Rural Education Partnerships And Innovation. Cambridge, MA: Harvard Education Press.
Individuals with Disabilities Education Act (IDEA) (2004). Part B, Subpart A, Section §300.8. Child With a Disability. Available online at: https://sites.ed.gov/idea/regs/b/a/300.8 (Accessed January 3, 2025).
Ingels, S. J., Pratt, D. J., Rogers, J. E., Siegel, P. H., and Stutts, E. S. (2011). High School Longitudinal Study of 2009 (HSLS:09) Base-Year Data File Documentation (NCES 2011-328). National Center for Education Statistics. Available online at: https://nces.ed.gov/use-work/resource-library/data/data-file/high-school-longitudinal-study-2009-hsls09-base-year-data-file-documentation?pubid=2011328 (Accessed January 3, 2025).
Kolne, K., and Lindsay, S. (2020). A systematic review of programs and interventions for increasing the interest and participation of children and youth with disabilities in STEM education or careers. J. Occup. Sci. 27, 525–546. doi: 10.1080/14427591.2019.1692692
Louick, R., and Muenks, K. (2022). Leveraging motivation theory for research and practice with students with learning disabilities. Theory Pract. 61, 102–112. doi: 10.1080/00405841.2021.1932154
Lubke, G. H., and Muthén, B. O. (2004). Applying multigroup confirmatory factor models for continuous outcomes to likert scale data complicates meaningful group comparisons. Struct. Equ. Model. 11, 514–534. doi: 10.1207/s15328007sem1104_2
Meece, J. L., Anderman, E. M., and Anderman, L. H. (2006). Classroom goal structure, student motivation, and academic achievement. Annu. Rev. Psychol., 57, 487–503. doi: 10.1146/annurev.psych.56.091103.070258
National Academies of Sciences Engineering and Medicine (2024). K-12 STEM Education and Workforce Development in Rural Areas. Washington, DC: The National Academies Press.
National Center for Education Statistics (2024). Students With Disabilities. Condition of Education. U.S. Department of Education, Institute of Education Sciences. Available online at: https://nces.ed.gov/programs/coe/indicator/cgg (Accessed January 3, 2025).
National Center for Science and Engineering Statistics (NCSES) (2023). Diversity and STEM: Women, Minorities, and Persons with Disabilities 2023. Special Report NSF 23-315. Alexandria, VA: National Science Foundation. Available online at: https://ncses.nsf.gov/wmpd (Accessed January 3, 2025).
National Rural Education Association (2022). National Rural Education Association research agenda: 2022-2027. Rural Educ. 37, 5–7. doi: 10.55533/2643-9662.1349
National Science Board National Science Foundation. (2022). Science and Engineering Indicators 2022: The State of U.S. Science and Engineering. NSB-2022-1. Alexandria, VA. Available online at: https://ncses.nsf.gov/pubs/nsb20221 (Accessed January 3, 2025).
Provasnik, S., Kewal-Ramani, A., Coleman, M. M., Gilbertson, L., Herring, W., and Xie, Q. (2007). Status of Education in Rural America. Available online at: https://nces.ed.gov/pubs2007/2007040.pdf (Accessed January 3, 2025).
Saw, G. K., and Agger, C. A. (2021). STEM pathways of rural and small-town students: opportunities to learn, aspirations, preparation, and college enrollment. Educ. Res. 50, 595–606. doi: 10.3102/0013189X211027528
Showalter, D., Hartman, S. L., Eppley, K., Johnson, J., and Klein, R. (2023).Why Rural Matters 2023: Centering Equity and Opportunity. National Rural Education Association.
Stapleton, L. M. (2008). Variance estimation using replication methods in structural equation modeling with complex sample data. Struct. Equat. Model. 15, 183–210. doi: 10.1080/10705510801922316
Starrett, A., Irvin, M. J., Lotter, C., and Yow, J. A. (2022). Understanding the relationship of science and mathematics place-based workforce development on adolescents' motivation and rural Aspirations. Am. Educ. Res. J. 59, 1090–1121. doi: 10.3102/00028312221099009
Thurston, L. P., Shuman, C., Middendorf, B. J., and Johnson, C. (2017). Postsecondary STEM education for students with disabilities: lessons learned from a decade of NSF funding. J. Postsec. Educ. Disability 30, 49–60.
Wang, X. (2013). Modeling entrance into STEM fields of study among students beginning at community colleges and four-year institutions. Res. Higher Educ. 54, 664–92. doi: 10.1007/s11162-013-9291-x
Wentzel, K. R. (2016). “Teacher-student relationships,” in Handbook of Motivation at School (Routledge), 211–230. doi: 10.4324/9781315773384-18
Wigfield, A., and Eccles, J. S. (2020). “35 years of research on students' subjective task values and motivation: a look back and a look forward,” in Advances in Motivation Science, ed. A. J. Elliot (Amsterdam: Elsevier Academic Press), 161–198. doi: 10.1016/bs.adms.2019.05.002
Wigfield, A., and Ponnock, A. (2020). “The relevance of expectancy-value theory to understanding the motivation and achievement of students with cognitive and emotional special needs: focus on depression and anxiety,” in Handbook of Educational Psychology and Students With Special Needs, eds. A. J. Martin, R. A. Sperling, and K. J. Newton (Routledge; Taylor and Francis Group), 388–425. doi: 10.4324/9781315100654-19
Wolfe, R., Steiner, E., and Schweig, J. (2023). Getting Students to (and Through) Advanced Math. RAND Corporation. Available online at: https://www.rand.org/pubs/research_reports/RRA827-10.html (Accessed January 3, 2025).
Yoon, M., and Lai, M. H. C. (2017). Testing factorial invariance with unbalanced samples. Struct. Equat. Model. 25, 201–213. doi: 10.1080/10705511.2017.1387859
Keywords: STEM motivation, rural education, students with disabilities, Situated Expectancy-Value Theory, measurement invariance
Citation: Jackson HA, Starrett A and Bottoms B (2025) Motivation in rural math education within general and special education settings. Front. Educ. 10:1611869. doi: 10.3389/feduc.2025.1611869
Received: 15 April 2025; Accepted: 27 June 2025;
Published: 21 July 2025.
Edited by:
Gladys Sunzuma, Bindura University of Science Education, ZimbabweReviewed by:
Fadie Coleman, Harvard University, United StatesErika Nadile, Northwestern University, United States
Copyright © 2025 Jackson, Starrett and Bottoms. This is an open-access article distributed under the terms of the Creative Commons Attribution License (CC BY). The use, distribution or reproduction in other forums is permitted, provided the original author(s) and the copyright owner(s) are credited and that the original publication in this journal is cited, in accordance with accepted academic practice. No use, distribution or reproduction is permitted which does not comply with these terms.
*Correspondence: Haidee A. Jackson, amFja3Nvbl9oYUB1dHBiLmVkdQ==