 Yuanyuan Ma
 Lifang Liu
- 1School of Computer Engineering, Hubei University of Arts and Science, Xiangyang, China
- 2Hubei Key Laboratory of Power System Design and Test for Electrical Vehicle, Hubei University of Arts and Science, Xiangyang, China
- 3School of Physics and Electronic Engineering, Hubei University of Arts and Science, Xiangyang, China
Introduction: College students face different levels of anxiety, depression, and other psychological problems due to various factors such as academic stress, excess workload, and family responsibilities. The state of mind plays a crucial role in shaping individuals' daily behaviors and academic performance. To comprehensively analyze the psychological health status of college students and research domains related to psychological health education, it is urgently needed to develop effective tools and models.
Methods: In this study, we proposed a novel framework called hypergraph-induced semi-orthogonal nonnegative matrix factorization (HSNMF). By using this framework, we can effectively evaluate the college students' psychological health levels.
Results: We implemented the proposed algorithm on two real datasets, and the results showed that the proposed algorithm outperformed other competing methods. The identified research domains provided insights into psychological health education. We also implemented a depression-level classification task on the student life dataset. The results showed that the low-dimensional latent variables learned from HSNMF contained rich semantic information, further improving the performance of traditional machine learning models. Clustering and regression analyses performed on the student life dataset showed that the depression status of students was significantly correlated with their performance in class and social life, as indicated by variables such as “Number of friends (p-value = 0.000598),” “Gender (p-value = 0.000034),” and “Taking notes in class (p-value = 0.03).”
Discussion: The significance of student psychological health study is discussed.
1 Introduction
The psychological wellbeing of college students is of great significance because the state of mind plays a crucial role in shaping individuals' daily behaviors and academic performance, consequently affecting their learning outcomes and willingness to engage in educational activities (Jao et al., 2019). Accurately and timely assessing the psychological health status of students is crucial to ensure the smooth progress of their learning activities and serves as a basis for implementing intelligent psychological health education in colleges (Liu et al., 2020; Kontoangelos et al., 2020; Lu, 2022). The rapid accumulation of data on student education and student behavior provides us with an unprecedented opportunity to analyze the relationships between students' psychological health levels and their life behaviors.
Yi et al., established an association between risk behaviors and psychological health and physical activity using two-step clustering and regression analysis and found that a specific behavior cluster was significantly correlated with psychological health and physical activity (Yi et al., 2020). Opoku Asare et al., utilized smartphone data to analyze the relationships between human behaviors and depression, and identified some behavior markers related to depression (Opoku et al., 2021). Wang et al., conducted a Student Life study and found significant correlations among the following variables: lifecycle and stress, conversation, and activity (Wang et al., 2014). These studies have provided some valuable insights into students' psychological health problems; however, the clustering performance and extension of algorithms are poor, especially for high-dimensional sparse data analysis tasks.
Recently, non-negative matrix factorization (NMF)-based methods have attracted wide interests in data mining and visualization. Cai et al., proposed a graph regularized non-negative matrix factorization algorithm for data representation and clustering (Cai et al., 2010). Jiang et al., developed an NMF-based framework to analyze metagenomic data, and identified some canonical sample types (Jiang et al., 2012). Chavoshinejad et al., proposed an effective semi-supervised NMF algorithm to learn discriminative representations (Chavoshinejad et al., 2023). These studies have taken full advantages of NMF, and obtained the better part-based representation that can be used for data clustering and visualization. To the best of our knowledge, however, NMF-based methods are seldom used for the students' psychological health education data analysis and student life data analysis. Compared to other methods, the advantages of NMF lies in 2 folds: (1) It provides better explanation for many real-world problems. Specifically, NMF factories a non-negative data matrix into two low-rank factor matrices and . For the entries in the coefficient matrix H, it presents the probability of one sample belonging to a certain cluster. However, for other clustering methods, such as spectral clustering and singular value decomposition (SVD), the factorized low rank matrices may contain negative elements, which are difficult to be viewed as probabilities. (2) NMF cannot only cluster rows in a data matrix, but also simultaneously groups columns in the data matrix. Hence, it can naturally capture associations between samples (students) and features (variables), and is further used to analyze the behaviors of the students.
In this study, we proposed a novel unsupervised learning framework called hypergraph-induced semi-orthogonal non-negative matrix factorization (HSNMF) to analyze the students' psychological health education data. HSNMF could evaluate their psychological health status. HSNMF is a versatile toolkit that enables data clustering and visualization and facilitates the analysis of the association between student depression levels and their daily behaviors. Unlike spectral clustering methods based on pairwise interaction relationships, HSNMF uses hypergraphs to encode the high-order interactions between more than two nodes. In addition, a semi-orthogonal constraint on the low-dimensional factor representation matrix ensures the uniqueness and interpretability of the solution. By implementing the HSNMF framework on two real students' psychological datasets, we demonstrated the effectiveness of HSNMF in identifying topic domains and student depression levels. HSNMF achieved superior performance in clustering and captured clear and meaningful clustering structures based on the learned similarity matrix. Figure 1 shows an overview of the proposed HSNMF framework.
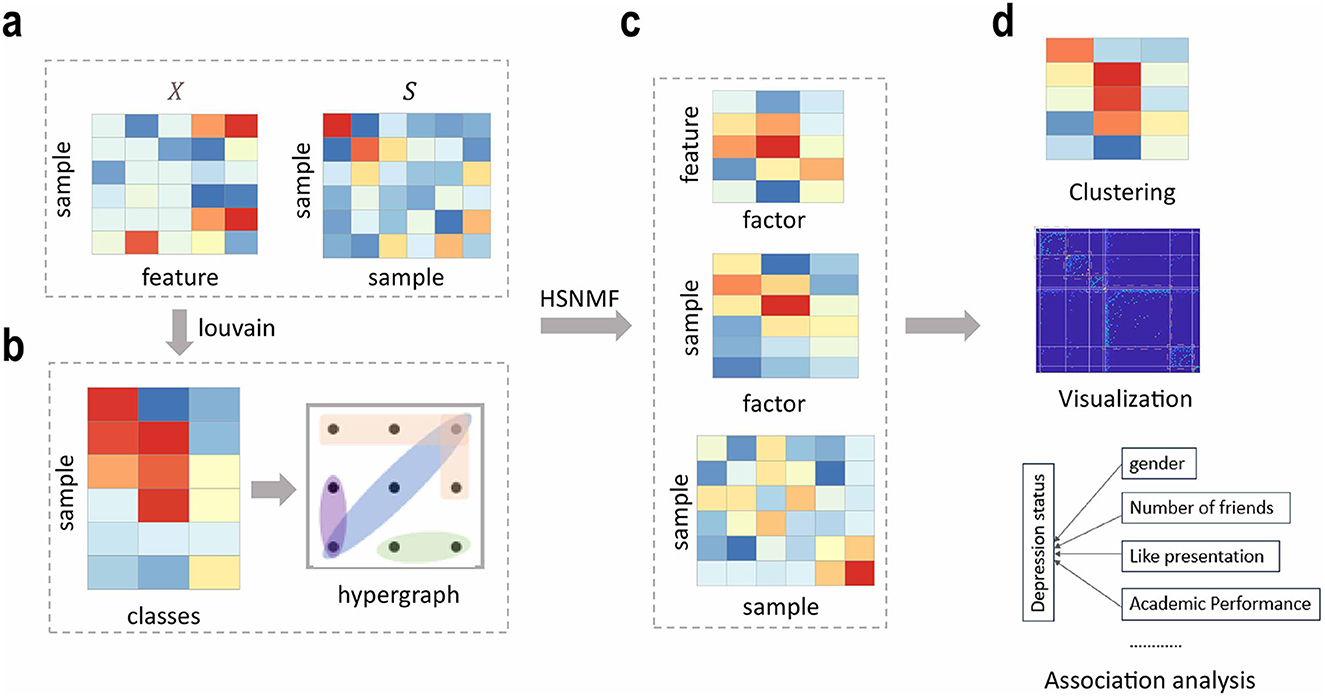
Figure 1. The flowchart of HSNMF. HSNMF is developed for analyzing students' psychological data. (a) The original data matrix X and sample-sample similarity matrix S that were used as inputs of HSNMF. (b) Hypergraph construction based the initially sample clustering matrix obtained by louvain algorithm. (c) The outputs of HSNMF, including the low-dimensional factor representation matrices W, H, and the consensus sample-sample similarity matrix S. (d) Based on the outputs of HSNMF, downstream analysis tasks can be implemented, including clustering, data visualization, and association analysis between depression status and students' behaviors.
2 Materials and methods
2.1 Datasets and data preprocessing
The college students' psychological health education dataset downloaded from China national knowledge infrastructure (CNKI, https://www.cnki.net), consisted of 865 articles. The terms “college students' psychological” and “education” were used as retrieve articles based on the Chinese social sciences citation Index (CSSCI), the Chinese science citation database (CSCD) and the Chinese core journal criterion of PKU. The time range was set between 1994 and 2024. We excluded the articles that were irrelevant to the current research or not an original research article (e.g., reviews, newsletters, or conference reports). Finally, 676 articles with bibliographic data including titles, keywords, authors and publish data were retained, and then these data were imported into the Bibliographic items co-occurrence matrix builder (Bicomb) software (Guo et al., 2015; Li and Cheng, 2021). Via Bicomb we extracted keywords from these articles, and generated a term-document matrix and a term-term co-occurrence matrix that were used to conduct downstream analysis tasks.
The student life dataset downloaded from Kaggle site (https://www.kaggle.com/datasets) comprised survey results from 100 computer science students. Demographic data, depression status, and performance variables, such as academic performance, taking notes in class, and presentation frequency, were collected. These variables have been measured before this study and are publicly accessibly (https://www.kaggle.com/datasets).
For the college students' psychological health education dataset, we implemented statistical analysis on keywords that appeared in each record, and obtained keyword rankings, in which high frequency indicated close attentions on the corresponding field. Keywords that occurred <2 times across all records were removed. For student life dataset, the Python toolkit package Scikit-learn was used to transform numerical variables and categorical variables.
2.2 Construction of hypergraph
Different from traditional graph where an edge can only connect to two nodes, in hypergraph an edge can connect more than two nodes. This mechanism of hypergraph effectively handles with information loss problem. For example, to group a set of articles into different topics, the common practice is to first construct a pairwise interaction network (simple graph) where two nodes are linked with an edge if there is at least one common author writes them, and then graph clustering method is implemented on this graph to obtain the final cluster assignments (Zhou et al., 2006). However, the graph constructing strategy above obviously ignore some useful information when the same author contributes more than two articles. Such unexpected lost information is important to clustering or knowledge findings.
A natural approach to address information loss issue is to use hypergraph to organize data relationships. Figure 2 gives an illustrative example to construct hypergraph. Given the weighted hypergraph G = (V, E, W), where V is the set of nodes and E denotes the of hyperedges. For each hyperedge e, we used w(e) to represent its weight. In this manuscript, the gaussian kernel function is used to compute the weights of hyperedges. The incidence matrix P∈R|V| × |E| corresponding to G with entry p(v, e) is defined as follows:
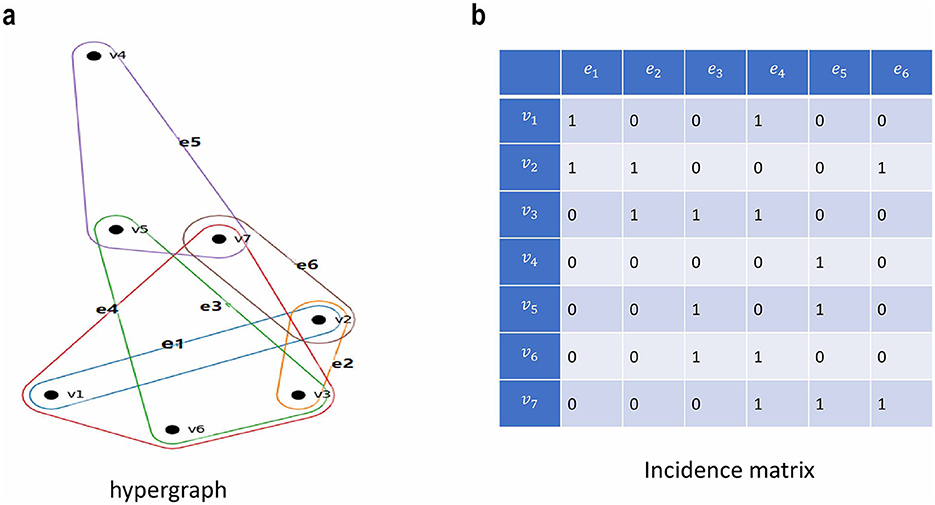
Figure 2. An illustrative example for hypergraph organization. (a) Hyperedges contains more than two nodes in hypergraph. vi denotes ith nodes, ej denotes jth hyperedge. (b) The incidence matrix of hypergraph. The entry (vi, ej) is set to be 1 when vi belongs to ej, and 0 otherwise.
where |V| and |E| represent the number of nodes and hyperedges, respectively. The degree of node v is defined as . The degree of hyperedge e is defined as . Let Dv and De denote degree matrices of nodes and hyperedges, respectively. The hypergraph Laplacian matrix Lhg can be defined as follows:
Note that in this manuscript we used Louvain community detection algorithm (Blondel et al., 2008) instead of k-nearest neighbors (KNN) to generate hyperedges, i.e., each cluster represents a hyperedge. By using this strategy, noisy information or outliers are filtered out to some extent. The hypergraph captures the high-order interaction among nodes. The hypergraph regularization can be defined as follows:
Here, H denotes the low-dimensional representation matrix of nodes.
Next, we will introduce the proposed HSNMF algorithm by integrating hypergraph into this objective.
2.3 HSNMF model
To identify the college students' psychological health education research topics, we introduce hypergraph induced semi-orthogonal non-negative matrix factorization (HSNMF) model. Let denote the original data matrix, HSNMF aims to learn two low-dimensional representation matrices (basis matrix) and (coefficient matrix), and a feature similarity matrix , where p, n denote the numbers of features and samples, respectively. k≪min(p, n) is the rank of factorized matrix. The objective function of HSNMF can be written as follows:
where I is identity matrix, 1 is a column vector with all its elements to be 1s. S is the learned feature similarity matrix that can be used for clustering and data visualization. α, β and γ are hyperparameters to be tuned. We will discuss how to select their values in the later section.
In the object of HSNMF, the first term, , is standard non-negative matrix factorization (NMF) loss function for student psychological education or student life data. The second term, , is a consensus graph factorization strategy which regularizes kernel WWT toward a consensus graph S, and generating a meaningful factorization. Through iterative training, the first two terms in Equation 4 can learned the low-dimensional representation for samples and features, however, the high-order relationships among nodes may be ignored. For example, the depression level of student may be correlated to the mixed effects of academic pressure, numerous work, and family responsibilities (Opoku et al., 2021; Wang et al., 2014). Hence, modeling high-order interactions among variables with hypergraph is important to mine the latent feature associations. Therefore, we include the third term, , in HSNMF model. The fourth term, , encourages W to be column-orthogonal. One of the advantages is the uniqueness and interpretability of solution W. The term, S1=1, is a constraint term on S that enforces each row of S to have summation close to 1.
Unlike other clustering methods based on spectral graph theory including spectral clustering and its variants which used the eigenvectors corresponding to large eigenvalues to conduct clustering (White and Smyth, 2005; Ng et al., 2001; Law et al., 2017), HSNMF adopts hypergraph Laplacian to explore the complicated interaction relationships among variables. The low-dimensional factor matrices obtained from HSNMF own stronger representation ability. In addition, orthogonal constraints on basis matrix W leads to better clustering solution and interpretability: the columns in W will tend to be sparse. The optimization algorithm of HSNMF is presented in the next subsection.
2.4 Optimization of HSNMF model
The optimal problem of objective function (Equation 4) can be divided into three sub-problems and can be solved alternately.
2.4.1 Fixing W and S, updating H
For H, the constrained optimization problem of Equation 4 can be solved easily by multiplicative update rule as traditional NMF did (Lee and Seung, 2000, 1999). Based on trace operation, Equation 4 can be rewritten as follows:
We only consider the terms related to H, and introduced Lagrange multiplier Φ(1) to solve the optimal problem. Taking the partial derivatives of L with respect to H gives:
Using KKT condition, we can obtain the following updating rule for H:
2.4.2 Fixing H and S, updating W
Similarly, we can obtain the updating rule for W:
where , .
2.4.3 Fixing W and H, updating S
2.5 Parameter selection
In HSNMF, there are three parameters α, β and γ that need to be determined. First, we used NNDSVD (Boutsidis and Gallopoulos, 2008) to solved the optimization problem and obtain the initial solutions and . Second, we used Ochiai coefficients (Vancraeynest et al., 2024; Kalgotra et al., 2020) to set the initial value of S. Finally, α, β and γ are set as:
Noting that for the sake of fairness we adopted parameter selection rules defined in Equations 10–12 across all the experiments. The ablation experiments in the following subsection also demonstrated the effectiveness of the objection of HSNMF algorithm.
2.6 Evaluation metrics
Unsupervised clustering metric silhouette coefficient (Kaufman and Rousseeuw, 2009), Calinski-Harabasz index (CHI; José-García and Gómez-Flores, 2023; Caliński and Harabasz, 1974), and Davies-Bouldin index (DBI; José-García and Gómez-Flores, 2023; Davies and Bouldin, 1979) are used to evaluate the performance of the clustering methods.
Let a(i) denote the average distance of data point i to all other data within the same cluster with i, and b(i) denote the average distance of i to all data points to the neighboring cluster, i.e., the smallest average distance to the cluster of i. The silhouette coefficient for data point i is defined as:
High silhouette score indicates good clustering performance. The average values of silhouette scores of all the data points are reported.
Let n, k denote the number of data points and clusters, respectively, the CHI is defined as follows:
where ni is the number of data points belonging to ith cluster, Ci is the data set belonging to ith cluster, ci is the centroid of ith cluster, c is the centroid of all data points.
The DBI is defined as follows:
where |Ci| denotes the number of data points in Ci, d(x, ci) denotes the distance between x and ci.
3 Results and discussion
3.1 HSNMF achieves superior performance on the college students' psychological health education dataset
In the college students' psychology health education dataset, we used the term-document matrix and the term-term co-occurrence matrix as inputs for HSNMF, and obtained the low-dimensional representation matrices W, H and a similarity matrix S. Clustering and data visualization were implemented using S. We compared the HSNMF algorithm with other competing methods, including NMF (Lee and Seung, 2000, 1999), spectral clustering (SC; White and Smyth, 2005; Jia et al., 2014), and symmetric non-negative matrix factorization (SNMF; Kuang et al., 2012; Ma et al., 2020), for the topic analysis of students' psychological health research. For SC, we first constructed similarity matrix with the cosine function, and then implemented spectral clustering on the similarity matrix. For HSNMF, we first constructed a k-nearest neighbor (KNN) graph based on the learned similarity matrix S, and then implemented Louvain clustering on the KNN graph.
The clustering performance evaluated by CHI, DBI and silhouette scores are presented in Figure 3.
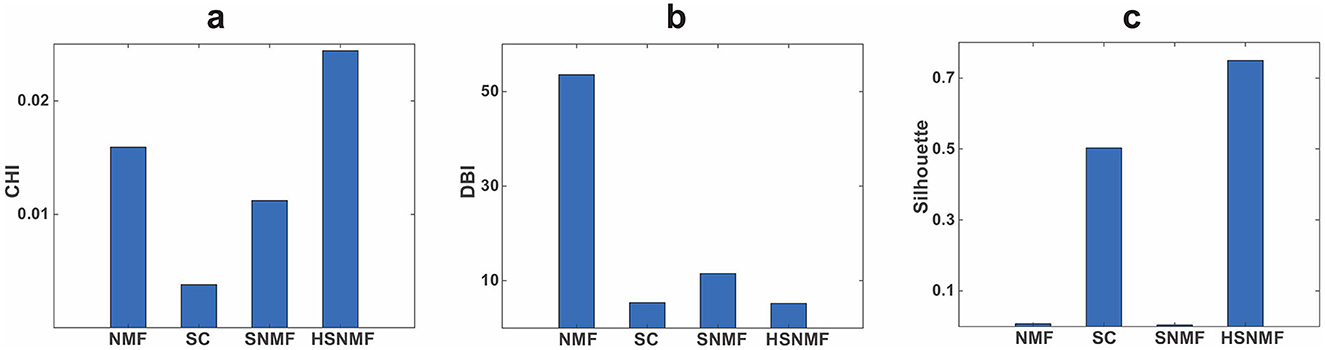
Figure 3. Comparison of clustering performance in the college students' psychological health education data. (a) Assessment of clustering performance in terms of CHI. (b) Assessment of clustering performance in terms of DBI. (c) Assessment of clustering performance in terms of the averaged silhouette scores. These three unsupervised metrics were computed based on the original term-document matrix and cluster results obtain from each method. For CHI and silhouette score metrics, high values indicate good clustering performance. For DBI, The smaller the values of the DBI, the better the performance of the algorithms.
As shown in Figure 3, HSNMF achieved the best performance on the college students' psychological health education dataset in terms of CHI, DBI and silhouette scores. NMF achieves the second-best performance in terms of CHI. SC also performed well in terms of silhouette score. The results demonstrate that the proposed HSNMF algorithm is effective on students' psychological health education dataset. One of the possible reasons is that the introducing hypergraph regularization term and the semi-orthogonal constraints on the low-dimensional representation W into the HSNMF objective function.
3.2 Ablation study
We further validate the effectiveness of HSNMF via ablation experiments. We set α, β and γ to 0 in turn. When α = 0, the values of CHI and DBI were 2.7e-5 and 45.87, respectively. When β = 0, the values of CHI and DBI were 0.0075 and 17.51, respectively. When γ = 0, the values of CHI and DBI were 0.0082 and 19.05, respectively, and the averaged silhouette score was 0.7206. The results demonstrate that the effectiveness of introducing the hypergraph regularization term, consensus graph factorization strategy, and semi-orthogonal constraints on the columns of W into the object of the HSNMF algorithm.
3.3 HSNMF facilitates visualization for topic terms of psychological health education fields
HSNMF can not only be used to cluster, but also be used to data visualization. Based on the learned the low-dimensional factor matrix W, the term similarity matrix S, and the clustering indices of all terms, we implemented visualization analysis, and the term clusters were represented in Figures 4a, b. We can see that the learned the low-dimensional factor matrix W and similarity matrix S had clear clustering structures. The terms in pink box in the figure consist of research topics related to psychological health education. As Figure 4 shown, W and S had consistent clustering structures in some topics.
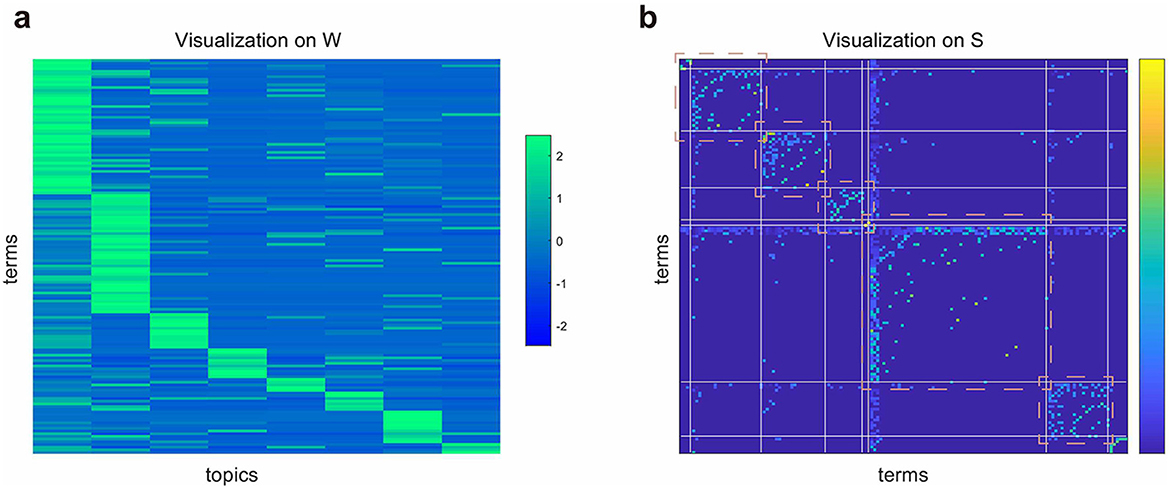
Figure 4. Visualization of terms in the psychological health education research fields. (a) Visualization on W. (b) Visualization on S. The ranges in pink boxes indicate five main research topics in the psychological health education research fields.
We conducted further investigation into the five topics and found that they primarily focused on the following several fields: 1) Psychological health problem, including psychological characteristics, psychological capital, and psychological stress. 2) Psychological health education and teaching, including psychological health education for college students, teaching reform, psychological counseling, art education, curriculum system, moral education, frustration education. 3) Strategy and service system, including growth path, student psychological health services, and education strategy.
3.4 HSNMF identified the latent associations between depression levels and student class behavior
We further validated the performance of HSNMF on student life dataset. Figures 5a, b show the visualization results for the original data matrix and the learned low-dimensional factor matrix W (the averaged silhouette score equals 0.9128). We can see that the individuals with different depression levels show the clearly clustering structure (Figure 5b). Additional analysis was conducted on the factor matrices W and H, where we inspected the rows of H with the large entries, and identified several features related to student depression status. The experimental results showed that three kinds of behaviors including “Academic performance,” “Taking note in class” and “Number of friends” were related to student depression status (depression). “Gender,” “Taking note in class” and “Like presentation” are related to student depression status (sometimes depression).
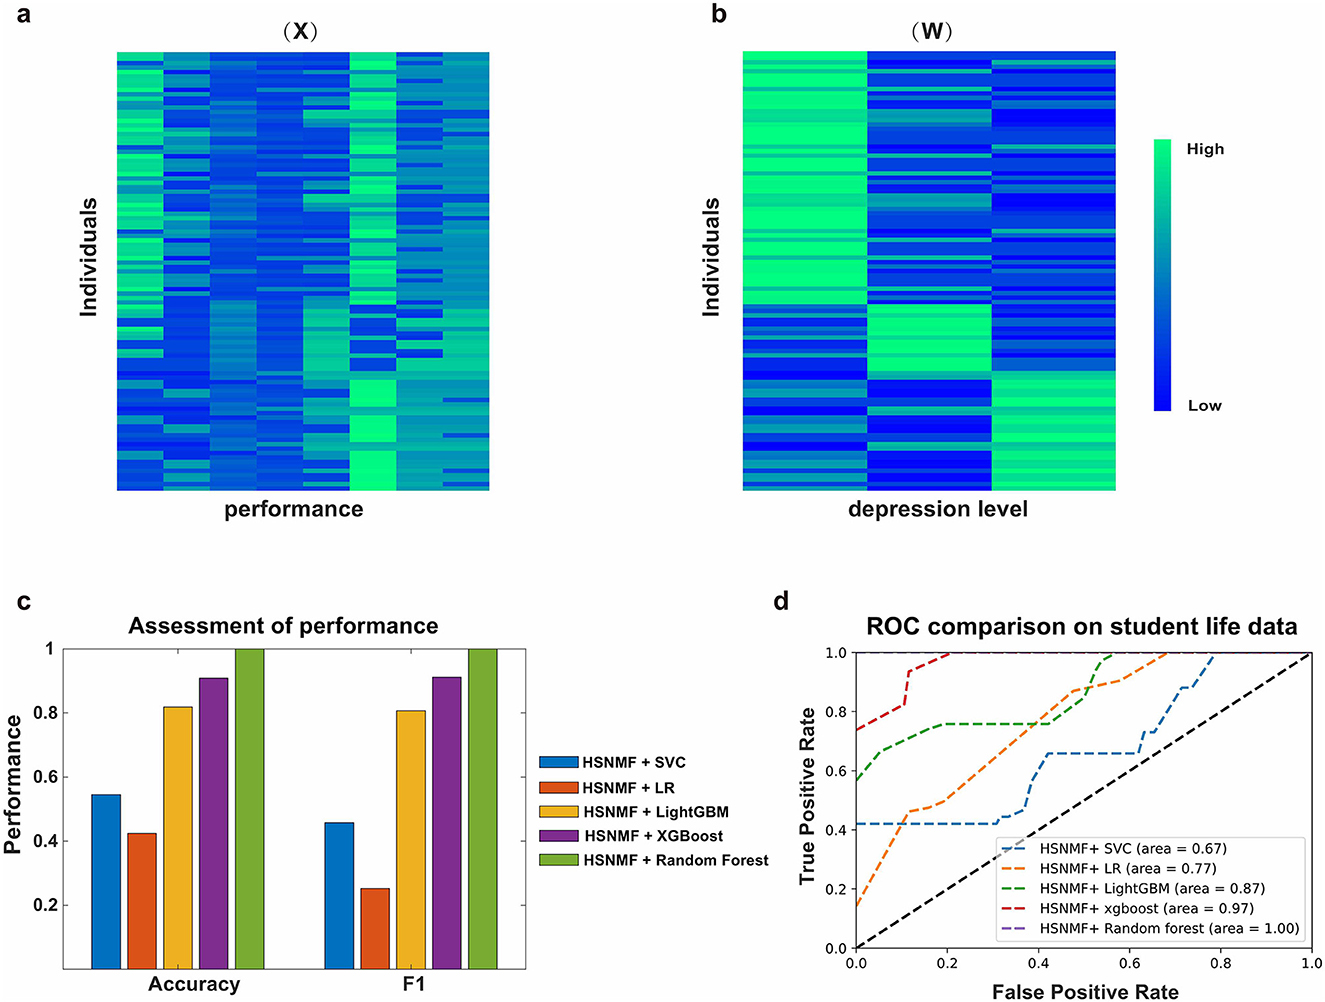
Figure 5. Analysis on student life data. (a) Visualization on the original student life dataset. Row represents the individual, and column represents the student behavior. (b) Visualization on the low-dimensional factor matrix W. Column represents the latent depression levels of students. (c) Performance assessment of different methods in terms of accuracy and f1 score. (d) Macro-average ROC curves of different methods.
Next, we implemented an association analysis between depression levels and student class behaviors based on student life data. Logistic regression analysis (LogisticRegression function in Sklearn package) was implemented to measure the associations between student depression level and behavior variables. The regression coefficients for features “Number of friends,” “Gender” and “Taking note in class” are −1.32 (p-value = 0.000598), −0.97(p-value = 0.000034) and −0.27(p-value = 0.03), respectively. The results indicate that students' depression level is significantly correlated to their class performance and social communication strength (number of friends).
HSNMF can not only be used for sample clustering, but also be used for classification. We further validate the effectiveness of HSNMF via cross-validation where the original data are divided into two parts. The one is used to train model, the other is used to test. The results were presented in Figures 5c, d. We can see that “HSNMF + random forest” achieves the best performance compared to other competing methods in terms of accuracy, F1, and AUC metrics. Different from random forest, we used the low-dimensional factor matrix W obtained from HSNMF to train classification models, and obtain the better performance (random forest, accuracy 0.85). The results demonstrate that integrating HSNMF into the traditional machine learning algorithms can effectively improves the model's performance. One of the possible reasons is that the learned low-dimensional latent variable W contain more semantic information that can guide the training process for more effective classification tasks.
Although HSNMF achieves better performance in terms of accuracy, F1, and AUC metrics, it still needs to be further validated in more student life data. In this manuscript, we aimed to develop a novel algorithm to analyze the students' behaivour, and explored the relationships between depression levels and student class behaviors. For other questions, such as population study and behavior variables measurement, they are beyond the scope of our research.
4 Conclusion
The rapid accumulation of student education data and student behavior data provides us an unprecedented chance to analyze the relationships between students' psychological health levels and their life behaviors. To this end, we proposed an effective analysis framework HSNMF, which utilizes hypergraph to learn the low-dimensional factor representation and sample-sample similarity matrix. One advantage of hypergraph lies that it can encode the high-order interaction relationships between objects, thus leading to better clustering qualities. Extensive experiments were implemented on two real datasets. The experimental results showed that the proposed HSNMF algorithm achieved the best performance compared to other competing methods. We also implemented depression level classification task on student life dataset by cross-validation experiments. The experimental results showed that integrating HSNMF into the traditional machine learning models can effectively improve their performance, which indicated that the low-dimensional latent variables learned from HSNMF may contain more semantic information. In terms of the versatileness of HSNMF, we can use it in various fields for different populations and purposes, such as informetric, knowledge graph, and so on.
Analysis on the college students' psychology health education data identified several meaningful topic domains, including psychological health problem, psychological health education and teaching, and the psychological teaching strategies and service system. Clustering analysis and regression analysis on the student life dataset showed student depression status is significantly correlated to their performance in class and social life, such as “Number of friends (p-value = 0.000598),” “Gender (p-value = 0.000034)” and “Taking note in class (p-value = 0.03).”
The college students' psychological health is one of the most important problems in current higher education. This study aimed to develop a novel framework to group students with various mental statuses into different clusters and further identify the latent associations between depression status and behavior variables based on the college student life data. The conclusions from association analysis help to shine a light on student life, and help teachers and parents to preliminarily assess the status of mental of the students in the college. So, some interventions can be timely adopted to improve the mental health of students.
The limitations of this study lie in: 1) for the college students' psychological health education data, we only analyzed the CNKI data source, other source including Web of Science, Scopus, Engineering Index (EI) were not included in the study. So, extensive data analysis based on different data sources is necessary to validate the generalization performance of HSNMF. 2) For student depression status analysis, more complicated interactions relationships between variables may exist. The interplay among these variables may be beyond the interaction between two variables, high-order interaction relationships may be ubiquitous in student behavior analysis. In this study, we used hypergraph to encode the high-order interactions, however, the association analysis was still based on the correlation between two variables.
The future directions of HSNMF framework mainly focus on the following aspects. 1) Identification of depression risk factors from health surveys and biomedicine data (Jamali et al., 2024). 2) Extending HSNMF to multi-modality student psychological health data, including psychological health survey, biomedicine image data, metagenomics data (Lai et al., 2022), microbiome data (Rong et al., 2019), and so on.
Data availability statement
Publicly available datasets were analyzed in this study. This data can be found at: https://github.com/chonghua-1983/student_life_analysis.
Author contributions
YM: Conceptualization, Methodology, Software, Writing – review & editing. LL: Data curation, Validation, Writing – original draft.
Funding
The author(s) declare that financial support was received for the research and/or publication of this article. This work was supported by Hubei Provincial Key Project of Educational Science Planning “Research on the Construction and Measurement of Indicator System, and Improvement Strategies of the Aesthetic Education Integration Campus” [24GA095] and Hubei Superior and Distinctive Discipline Group of “New Energy Vehicle and Smart Transportation.”
Acknowledgments
The authors thank LetPub (https://www.letpub.com.cn) for its linguistic assistance during the preparation of this manuscript.
Conflict of interest
The authors declare that the research was conducted in the absence of any commercial or financial relationships that could be construed as a potential conflict of interest.
Generative AI statement
The author(s) declare that no Gen AI was used in the creation of this manuscript.
Publisher's note
All claims expressed in this article are solely those of the authors and do not necessarily represent those of their affiliated organizations, or those of the publisher, the editors and the reviewers. Any product that may be evaluated in this article, or claim that may be made by its manufacturer, is not guaranteed or endorsed by the publisher.
References
Blondel, V. D., Guillaume, J.-L., Lambiotte, R., and Lefebvre, E. (2008). Fast unfolding of communities in large networks. J. Stat. Mech. Theory Exp. 2008:10008. doi: 10.1088/1742-5468/2008/10/P10008
Boutsidis, C., and Gallopoulos, E. S. V. D. (2008). based initialization: a head start for nonnegative matrix factorization. Pattern recognition. 41, 1350–1362. doi: 10.1016/j.patcog.2007.09.010
Cai, D., He, X., Han, J., and Huang, T. S. (2010). Graph regularized nonnegative matrix factorization for data representation. IEEE Trans. Pattern Anal. Mach. Intell. 33, 1548–1560. doi: 10.1109/TPAMI.2010.231
Caliński, T., and Harabasz, J. (1974). A dendrite method for cluster analysis. Commun. Stat. Theory Methods 3, 1–27. doi: 10.1080/03610927408827101
Chavoshinejad, J., Seyedi, S. A., Tab, F. A., and Salahian, N. (2023). Self-supervised semi-supervised nonnegative matrix factorization for data clustering. Pattern Recognit. 137:109282. doi: 10.1016/j.patcog.2022.109282
Davies, D. L., and Bouldin, D. W. (1979). A cluster separation measure. IEEE Trans. Pattern Anal. Mach. Intell. 1, 224–227. doi: 10.1109/TPAMI.1979.4766909
Guo, R., Hu, Y., Fan, L., Li, J., and Wang, Z. (2015). Mapping knowledge domain of counseling and psychotherapy researches in China. Chin. Ment. Health J. 12, 510–515.
Jamali, A. A., Berger, C., and Spiteri, R. J. (2024). Identification of depression predictors from standard health surveys using machine learning. Curr. Res. Behav. Sci. 2024:100157. doi: 10.1016/j.crbeha.2024.100157
Jao, N. C., Robinson, L. D., Kelly, P. J., Ciecierski, C. C., and Hitsman, B. (2019). Unhealthy behavior clustering and mental health status in United States college students. J. Am. Coll. Health 67, 790–800. doi: 10.1080/07448481.2018.1515744
Jia, H., Ding, S., Xu, X., and Nie, R. (2014). The latest research progress on spectral clustering. Neural Comput. Appl. 24, 1477–1486. doi: 10.1007/s00521-013-1439-2
Jiang, X., Weitz, J. S., and Dushoff, J. (2012). A non-negative matrix factorization framework for identifying modular patterns in metagenomic profile data. J. Math. Biol. 64, 697–711. doi: 10.1007/s00285-011-0428-2
José-García, A., and Gómez-Flores, W. C. V. I. K. (2023). A Matlab-based cluster validity index toolbox for automatic data clustering. SoftwareX 22:101359. doi: 10.1016/j.softx.2023.101359
Kalgotra, P., Sharda, R., and Luse, A. (2020). Which similarity measure to use in network analysis: impact of sample size on phi correlation coefficient and ochiai index. Int. J. Inf. Manag. 55:102229. doi: 10.1016/j.ijinfomgt.2020.102229
Kaufman, L., and Rousseeuw, P. J. (2009). Finding Groups in Data: An Introduction to Cluster Analysis. Hoboken, NJ: John Wiley & Sons.
Kontoangelos, K., Economou, M., and Papageorgiou, C. (2020). Mental health effects of COVID-19 pandemia: a review of clinical and psychological traits. Psychiatry Investig. 17:491. doi: 10.30773/pi.2020.0161
Kuang, D., Ding, C., and Park, H. (2012). “Symmetric nonnegative matrix factorization for graph clustering,” in Proceedings of the 2012 SIAM International Conference on Data Mining (SIAM) (Anaheim, CA: Society for Industrial and Applied Mathematics (SIAM)), 106–117. doi: 10.1137/1.9781611972825.10
Lai, J., Li, A., Jiang, J., Yuan, X., Zhang, P., Xi, C., et al. (2022). Metagenomic analysis reveals gut bacterial signatures for diagnosis and treatment outcome prediction in bipolar depression. Psychiatry Res. 307:114326. doi: 10.1016/j.psychres.2021.114326
Law, M. T., Urtasun, R., and Zemel, R. S. (2017). “Deep spectral clustering learning,” in International Conference on Machine Learning (Sydney, NSW: PMLR), 1985–1994.
Lee, D., and Seung, H. S. (2000). Algorithms for non-negative matrix factorization. Adv. Neural Inf. Process. Syst. 13, 556–562.
Lee, D. D., and Seung, H. S. (1999). Learning the parts of objects by non-negative matrix factorization. Nature 401, 788–791. doi: 10.1038/44565
Li, M., and Cheng, Y. (2021). Bibliometric analysis of researches of orem self-care model in China based on BICOMB. TMR Integr. Nurs. 2021:5. doi: 10.53388/TMRIN20191214
Liu, S., Yang, L., Zhang, C., Xiang, Y., Liu, Z., Hu, S., et al. (2020). Online mental health services in China during the COVID-19 outbreak. Lancet Psychiatry 7, e17–e18. doi: 10.1016/S2215-0366(20)30077-8
Lu, Z. (2022). Analysis model of college students' mental health based on online community topic mining and emotion analysis in novel coronavirus epidemic situation. Front. Public Health 10:1000313. doi: 10.3389/fpubh.2022.1000313
Ma, Y., Zhao, J., and Ma, Y. (2020). MHSNMF: multi-view hessian regularization based symmetric nonnegative matrix factorization for microbiome data analysis. BMC Bioinformatics 21, 1–18. doi: 10.1186/s12859-020-03555-w
Ng, A., Jordan, M., and Weiss, Y. (2001). On spectral clustering: analysis and an algorithm. Adv. Neural Inf. Process. Syst. 14, 849–856.
Opoku, A. K., Terhorst, Y., Vega, J., Peltonen, E., Lagerspetz, E., and Ferreira, D. (2021). Predicting depression from smartphone behavioral markers using machine learning methods, hyperparameter optimization, and feature importance analysis: exploratory study. JMIR Mhealth Uhealth 9:e26540. doi: 10.2196/26540
Rong, H., Xie, X-h., Zhao, J., Lai, W-t., Wang, M-b., et al. (2019). Similarly in depression, nuances of gut microbiota: evidences from a shotgun metagenomics sequencing study on major depressive disorder versus bipolar disorder with current major depressive episode patients. J. Psychiatr. Res. 113, 90–99. doi: 10.1016/j.jpsychires.2019.03.017
Vancraeynest, B., Pham, H-S., and Ali-Eldin, A. (2024). A new approach to computing the distances between research disciplines based on researcher collaborations and similarity measurement techniques. J. Informetr. 18:101527. doi: 10.1016/j.joi.2024.101527
Wang, R., Chen, F., Chen, Z., Li, T., Harari, G., Tignor, S., et al. (2014). “StudentLife: assessing mental health, academic performance and behavioral trends of college students using smartphones,” in Proceedings of the 2014 ACM International Joint Conference on Pervasive and Ubiquitous Computing (New York, NY: Association for Computing Machinery), 3–14. doi: 10.1145/2632048.2632054
White, S., and Smyth, P. (2005). “A spectral clustering approach to finding communities in graphs,” in Proceedings of the 2005 SIAM International Conference on Data Mining (Newport Beach, CA: SIAM), 274–285. doi: 10.1137/1.9781611972757.25
Yi, X., Liu, Z., Qiao, W., Xie, X., Yi, N., Dong, X., et al. (2020). Clustering effects of health risk behavior on mental health and physical activity in Chinese adolescents. Health Qual. Life Outcomes 18, 1–10. doi: 10.1186/s12955-020-01468-z
Keywords: psychological health education, matrix factorization, hypergraph learning, data visualization, depress status association analysis
Citation: Ma Y and Liu L (2025) HSNMF enables accurate and effective analysis for the college students' psychological health education data and student life data. Front. Educ. 10:1624827. doi: 10.3389/feduc.2025.1624827
Received: 09 May 2025; Accepted: 23 July 2025;
Published: 13 August 2025.
Edited by:
Jingpu Zhang, Henan University of Urban Construction, ChinaReviewed by:
Yingjun Ma, Xiamen University of Technology, ChinaPing Yu, Shanxi Normal University, China
Copyright © 2025 Ma and Liu. This is an open-access article distributed under the terms of the Creative Commons Attribution License (CC BY). The use, distribution or reproduction in other forums is permitted, provided the original author(s) and the copyright owner(s) are credited and that the original publication in this journal is cited, in accordance with accepted academic practice. No use, distribution or reproduction is permitted which does not comply with these terms.
*Correspondence: Yuanyuan Ma, Y2hvbmdodWFfMTk4M0AxMjYuY29t