 Patricio Sebastián Henriquez Ritchie1
 Juan Carlos Pérez-Morán2*
 Carlos Javier del Cid García1
 Brenda Boroel Cervantes1
- 1Autonomous University of Baja California, Baja California, Mexico
- 2Promoter Network of Diagnostic Evaluation Methods and Educational Innovation, Baja California, Mexico
The purpose of this study is to measure higher education students' perceptions of their teachers' performance, as well as to analyze differences by sex, age, type of degree, and academic stage. To this end, the responses of 1,422 students from a higher education institution in northwestern Mexico who completed the EEDDocente 2023-1 were analyzed. The properties of the instrument's measurement model were verified. In this sense, the original three-factor model was reconfigured by a two-factor solution. The two-factor model explains 68% of the observed variance and has adequate fit indices (x2 = 2,661.58, df = 989, p < 0.0, CFI = 0.995, TLI = 0.995, GFI = 0.993, NFI = 0.993, RMSEA = 0.034 [IC 95% = 0.033–0.035], SRMR = 0.051). The measurement model was also found to be invariant across the grouping variables. Overall, the items had high mean scores (mean > 3), suggesting that students perceived their teachers as highly effective. Significant differences (p < 0.01) were reported between participants' scores based on their age and academic stage; however, the effect size was low (η2 < 0.10). Finally, the contributions, scope, and limitations of the study are discussed.
1 Introduction
In Mexico, the evaluation of university professors' performance through student feedback questionnaires began to proliferate in the 1990s, at the same time that questions and concerns about the use of evaluations based solely on a single source of information (students) regarding teaching quality began to emerge (Cisneros-Cohernour and Stake, 2010). Indeed, the use of this information is generally associated with summative purposes (teaching evaluations are conducted at the end of the semester or academic year) and is analyzed with normative references (the results are used to compare professors' performance, according to the opinions of their students).
However, given the above concerns, a large number of studies have defended the reliability and validity of the results derived from research carried out based on instruments applied only to students (Cisneros-Cohernour and Stake, 2010; Wang and Guan, 2017; Feistauer and Richter, 2018; Gómez and Valdés, 2019; Bazán-Ramírez et al., 2021; Zamora, 2021; Mohammadi, 2021; Henríquez et al., 2023) and have managed to identify a set of variables associated with the evaluation of teacher performance: sex, age, areas of knowledge, grades, formative stage, among others. However, more evidence is needed to determine to what extent the scores yielded by these types of instruments truly reflect the quality of teaching in higher education contexts.
In this sense, both internationally and nationally, a variety of data collection instruments have been developed regarding the performance of university professors, in the form of student opinion questionnaires (Chan, 2018; Wellein et al., 2009; Montoya et al., 2014; Salinas, 2017; Gómez and Valdés, 2019). Most of these are descriptive questionnaires that aim to characterize students' opinions about some aspects of their professors' performance (content mastery, group interaction, use of pedagogical strategies, learning assessment methods, among others). However, along with this variety of instruments, other studies have advanced toward construct validation, correlation with other variables and the identification of factors surrounding teacher performance (Cortés et al., 2014; Durán-Aponte and Durán-García, 2015; Henríquez et al., 2023; Márquez and Madueño, 2016; Luna Serrano and Arámburo Vizcarra, 2013). Given this scenario, (Gómez and Valdés 2019) assert that there is still a long way to go in relation to the technical aspects of the aforementioned questionnaires, mainly referring to validity, interpretations and the uses given to the information collected.
In the global context, the model based on student opinions, through the application of questionnaires regarding the planning, implementation, and evaluation of teaching and learning processes by teachers, is undoubtedly the most widely used in university institutions. However, from the perspective of some authors (Gómez and Valdés, 2019; Kimball et al., 2004; Murillo-Gordón et al., 2024; Zabaleta, 2007), this model presents some problems associated with the real institutional purposes behind teacher performance evaluation processes, the formative usefulness of the information retrieved through these instruments, and the possibility of possible biases in the information collected. In this sense, some current perspectives highlight the need to use more comprehensive models that combine multiple sources of information and indicators to enrich the teacher performance evaluation process and give it a more formative and reliable connotation (Morales, 2022; Zhao et al., 2022).
In turn, other studies, such as the one reported by (Bazán-Ramírez et al. 2021), have aimed to compare students' opinions on some aspects of their teachers' performance based on sociodemographic and school context variables (age, gender, and academic stage), revealing significant differences in this regard. Similarly, (Feistauer and Richter 2018) determined that variables associated with the teacher's personality (generating sympathy and popularity among their students), as well as the student's prior interest in the subject, also generate significant comparative contrasts in some dimensions of teacher performance evaluation. For his part, (Chan 2018) reaffirms that university students' perceptions of good teaching and a good teacher are strongly associated with personal treatment, enthusiasm and sense of humor, as well as the establishment of friendly relationships with their students. Regarding the comparison of students' perceptions regarding the quality of teacher performance, (Scherer and Gustafsson 2015) report that the ease with which students understand the teacher and achieve satisfactory academic achievement in their subjects are determining factors in the evaluation they carry out regarding teaching.
At a global level, other research has focused on identifying teachers' personal and academic factors that influence the assessment of student performance. Indeed, some personal factors highlighted in the literature include teachers' motivation, commitment, and passion for teaching (Rua Pomahuacre et al., 2025), their communication and language skills (Flores et al., 2024), as well as their empathy, respect for students, and ability to listen to their needs and concerns (Sánchez Rincón, 2021; Olmedo-Rodriguez et al., 2024). On the other hand, within the academic factors, the ability of teachers to explain the contents in a clear, organized and understandable way (Guzmán, 2016; Valencia Torres, 2019), the adequate organization and structuring of their courses in terms of objectives, materials and learning activities (Ochoa Sierra and Moya Pardo, 2019), along with the strategies, methods and evaluation instruments that teachers use regarding their students' learning (Guzmán-Loria, 2013; Punéz Lazo, 2015) stand out.
Specifically, some studies have been carried out, on the analysis of invariance and the comparison of university students according to their opinion about the performance of their teachers (Scherer et al., 2016; André et al., 2020; Baños et al., 2022). In a study conducted by (Baños et al. 2022), they analyzed the psychometric properties and invariance of a scale for assessing physical education teacher competencies in secondary education in Mexico. They concluded that their instrument is effective in measuring invariance in teacher competencies based on the variable of student sex. On the other hand, (Scherer et al. 2016) examine the factorial structure and invariance of students' perceptions of instructional quality in three countries (Australia, Canada and the USA) within the area of mathematics, considering three main dimensions: teacher support, cognitive activation and classroom management. In their results, they confirm the invariance of the scores across the three countries, where the general opinion regarding instructional quality was positively related to students' motivation and self-concept, while the classroom management dimension turned out to be the strongest predictor of student mathematics achievement. Finally, (André et al. 2020) (2020) examined the measurement invariance of student perceptions of secondary school teachers' performance in six countries (Spain, Turkey, South Africa, South Korea, Indonesia, and the Netherlands), based on six domains: learning climate, classroom management, clarity of instruction, activating teaching, differentiation, and learning strategies. Among their main findings, they confirmed the invariance of the scale used to measure students' perceptions of their teachers' performance, observing significant differences between the participating countries and confirming the cultural and contextual differences surrounding teaching practices.
Given the above, the present work aims to obtain evidence of factorial invariance of the Teacher Performance Evaluation Scale (EEDDocente) and compare the perception of university students about the performance of their teachers in the areas of social and administrative sciences of the Faculty of Administrative and Social Sciences (FCAYS) of the Autonomous University of Baja California (UABC), based on personal and academic variables (sex, age, type of degree and academic stage).
2 Method
2.1 Participants
For the purposes of this study, the database resulting from the application of the Scale for the Evaluation of Teacher Performance (EEDDocente) for the 2023-1 school stage was analyzed. In total, the database consisted of 1,490 of the 4,180 students enrolled in the Faculty of Administrative and Social Sciences (FCAyS) of the Autonomous University of Baja California (UABC). To define the students participating in the EEDDocente 2023-1, the FCAyS Teacher Evaluation Coordination (TEC-FCAyS) selected a school group from each shift (morning and afternoon) of each educational program. Particularly when educational programs have only one group per semester, all students from all semesters of the educational program participate in the EEDDocente. The FCAyS offers eight undergraduate programs, covering three areas of study: a Bachelor's degree in Law (legal sciences); Bachelor's degrees in Business Administration (LAE), Accounting, and Computer Science (administrative sciences); and Bachelor's degrees in Psychology, Communication Sciences, Education Sciences, and Sociology (social sciences). Additionally, two core programs are offered for students wishing to enroll in a program in the administrative (TC-Adm) or social (TC-Soc) areas, covering the first two semesters of university studies. Of the total number of cases in the EEDDocente 2023-1 database, 68 cases with Global Index (GI = sum of raw scores) considered atypical were eliminated. The atypical GI scores identified were those with total scores below 70. Of the 1,422 cases, 913 (64.20%) are men and 509 (35.80%) are women, with an average age of 22.18 years and a standard deviation of 5.12. Table 1 shows the distribution of students participating in the EEDDocente 2023-1 according to the educational program in which they were enrolled.
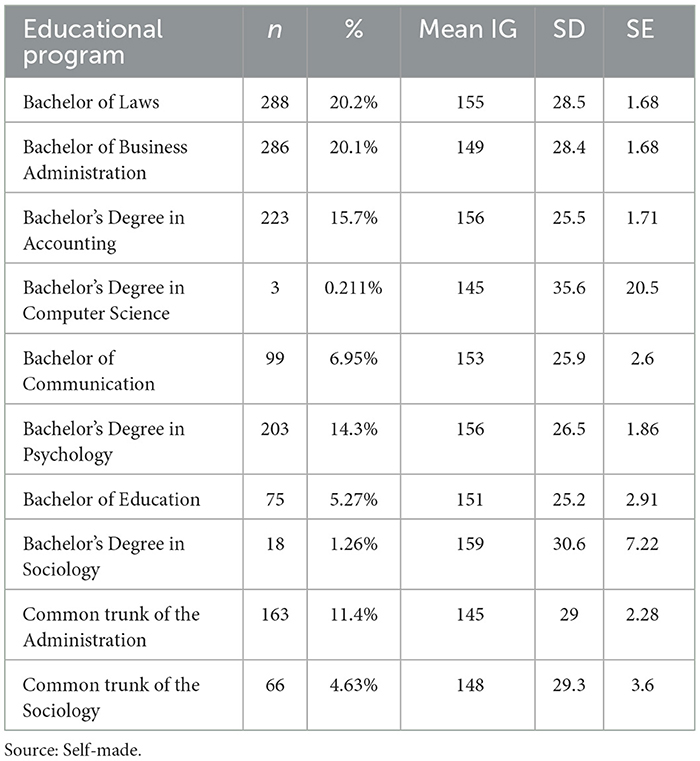
Table 1. Distribution and Mean IG of students participating in the EEDDocente 2023-1 according to the educational program in which they were enrolled.
2.2 Measurement
For the study, the EEDDocente designed by (Henríquez et al. 2017), (Henríquez and Arámburo 2021) and adjusted by (Pérez-Morán et al. 2024) was applied. The EEDDocente aims to provide, at the end of each school stage, information based on the opinions of students about the performance of teachers who teach classes in the educational programs currently at the FCAyS. Currently, the EEDDocente v2023 is composed of 46 ordinal scale items with four response categories: (1) Strongly disagree, (2) Disagree, (3) Agree, and (4) Strongly agree. Likewise, the scale items are distributed into 3 dimensions (subscales): (a) Course organization, (b) Teaching quality, and (c) Assessment and feedback of learning (Pérez-Morán et al., 2024). In particular, the EEDDocente has design and validation studies (Henríquez et al., 2023; Pérez-Morán et al., 2024). (Pérez-Morán et al. 2024) carried out a design and construct validity study of the content aspect of the EEDDocente where they present evidences of the design of its items using the elements of the Universal Design Evaluation Model (MEDU, Thompson et al., 2002; Pérez-Morán et al., 2024), and evidence of the content validity of the scale through committees of specialists and judges, and the application of Content Validation Indices (CVI) with favorable results (PAJ = 0.90, V = 0.90, RVC = 0.82, RVC' = 0.91) (Aiken, 1985; Lawshe, 1975; Tristán-López, 2008). For their part, (Henríquez et al. 2023) carried out a study of reliability, validity of the internal structure and invariance of the scale where adequate reliability and adjustment indices are presented (α = 0.92, ρ = 0.92 and ω = 0.93; χ2 = 251.21; df = 87, p = 0.000; CFI = 0.868; TLI = 0.841; GFI = 0.936; NNFI = 0.814; RMSEA = 0.034; SRMR = 0.057). However, this study reports the elimination of 10 items that did not meet the criteria of kurtosis and skewness coefficients between −1 and + 1 recommended by (Hair et al. 2019) and the cutoff criterion of rpbis ≥ 0.2 (Brown, 2015). For this reason, a bifactor model was implemented for the present study with all the items from the EEDDocente (k = 46), which presented adequate fit indices for the study population. Table 2 presents the subscales and the number of items that comprise the adjusted bifactor model of the EEDDocente.
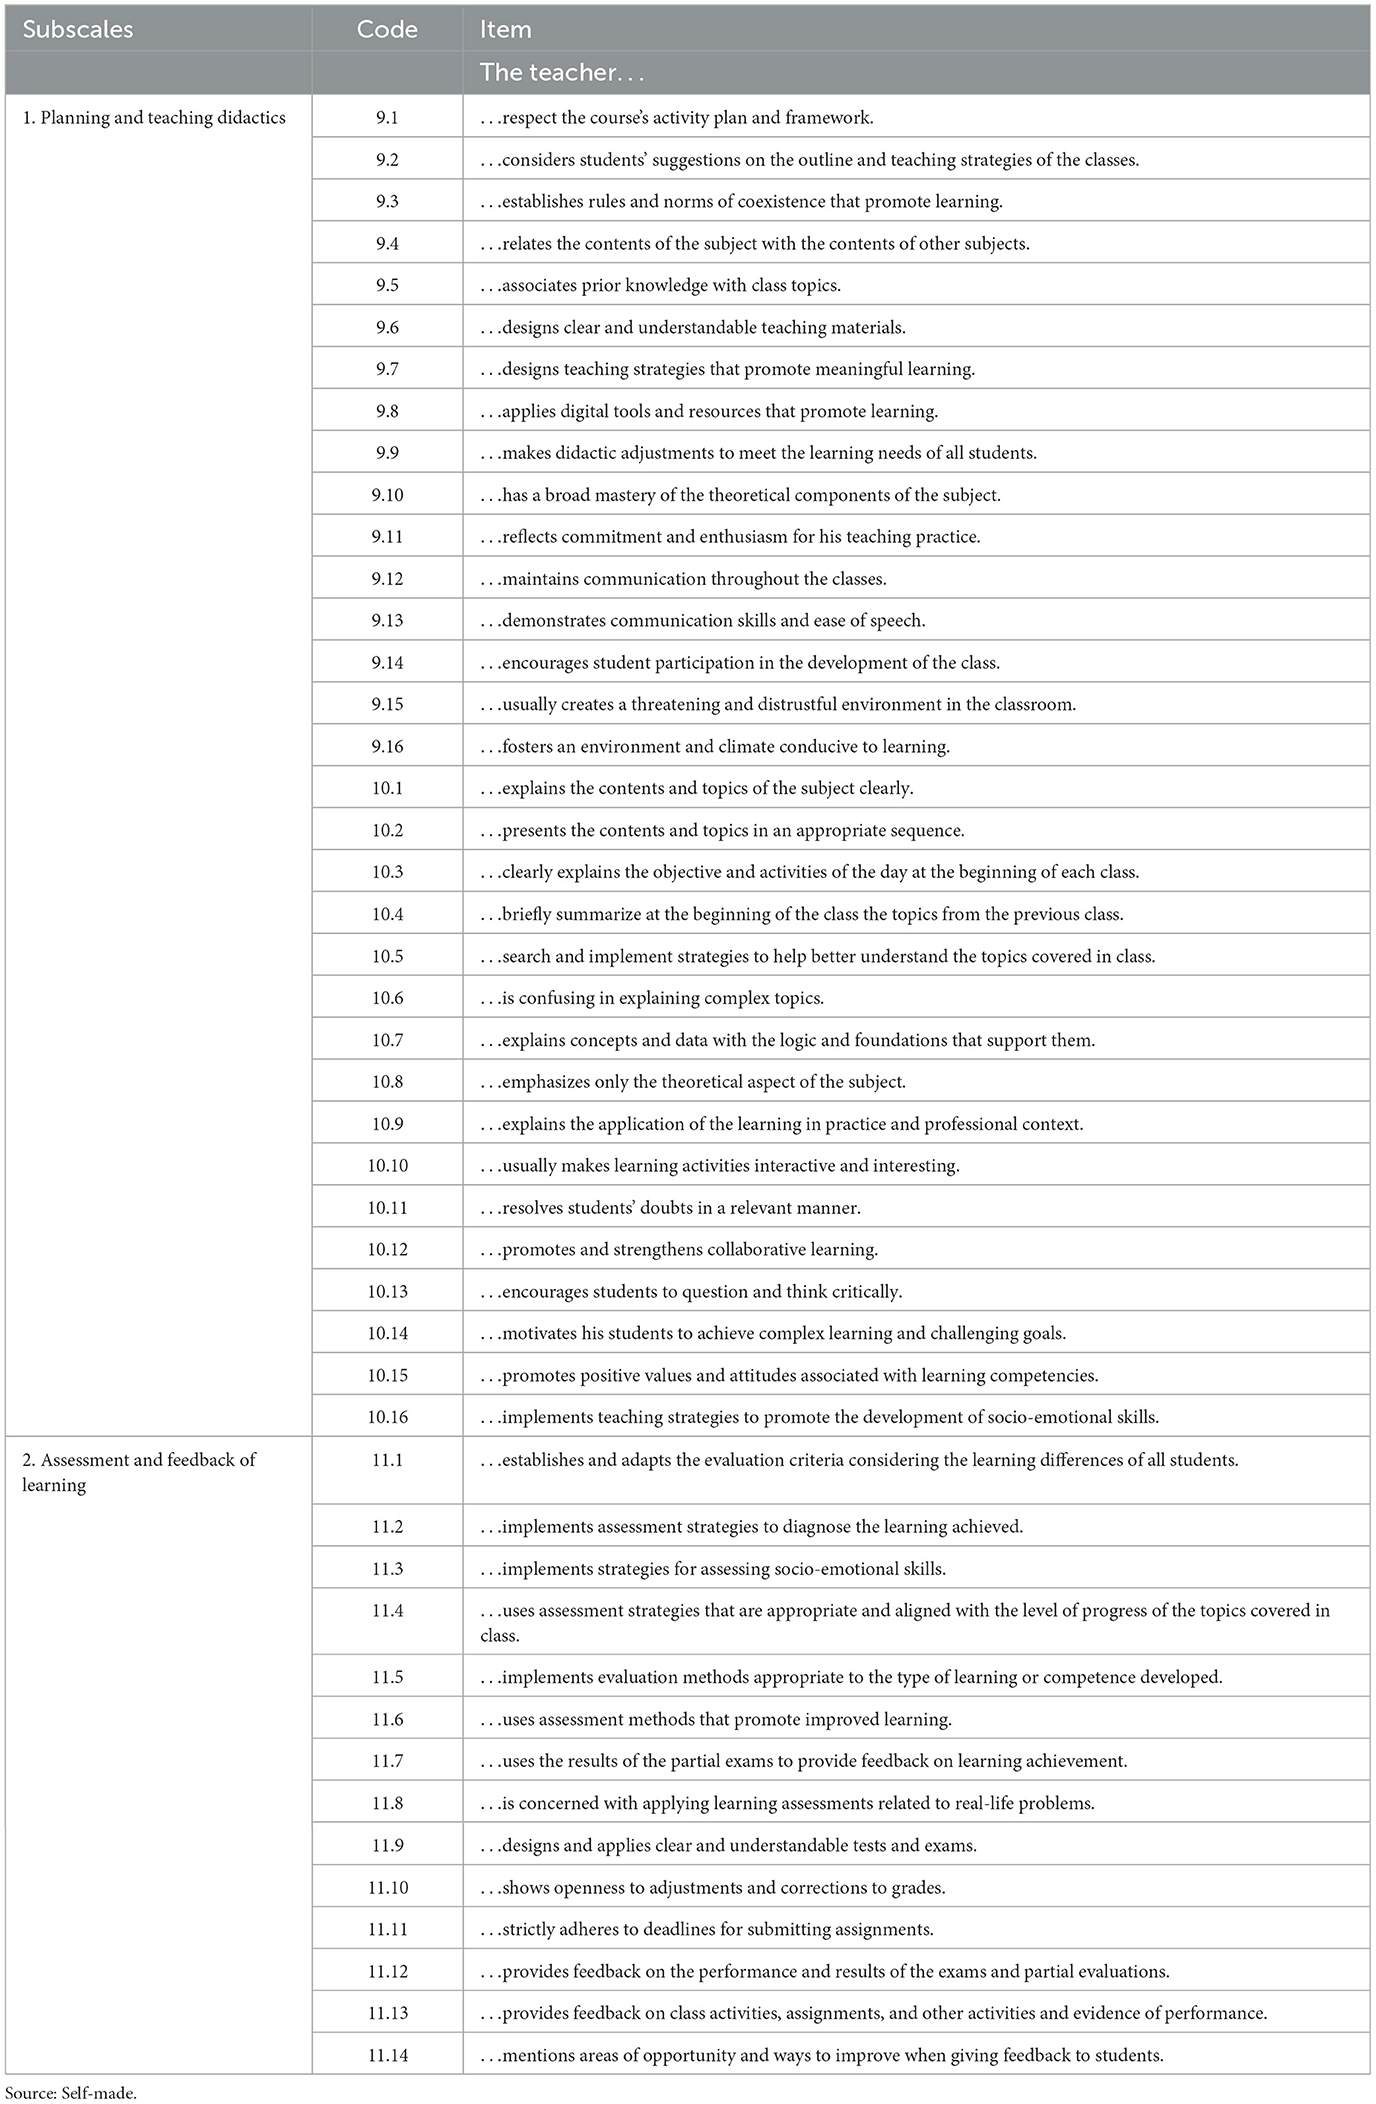
Table 2. Structure and subscales of the EEDDocentes.
2.3 Procedure
For the implementation of the EEDDocente in the 2023-1 school year, the FCAyS-UABC Directorate approved the procedure protocol in accordance with current institutional research ethics standards. It should be noted that the FCAyS Teacher Evaluation Coordination oversees the implementation of the EEDDocente during the internal teacher performance evaluation strategy implemented in this academic unit at the end of each academic year. The instrument was administered during school hours in a sample of 80 randomly selected groups. To encourage students to respond honestly, the staff administering the instrument was trained to explain the purpose of the teacher evaluation. Furthermore, at the end of the EEDDocente administration, it was ensured that the students completed all the questions. At the FCAyS, a teaching performance evaluation process is conducted semiannually, based on student opinions, both internally and in parallel with the UABC institutional teaching evaluation. During the 2023-1 period, the EEDDocente instrument was made available electronically, using Google Forms: students who supported the data collection requested permission from the teacher on duty to enter the classroom with the electronic link and a QR code, which allowed access to the instrument through any technological device (laptop, tablet, smartphone).
2.4 Data analysis
To achieve the study objectives, various statistical analyses were carried out in five main stages: (1) data preparation, (2) obtaining preliminary and descriptive statistics, (3) checking the factor structure, (4) verifying measurement invariance, and (5) comparing mean scores between independent groups. To achieve this, the recommendations of (Hu and Bentler 1999) and (Hirschfeld and Von-Brachel 2014) were followed. Data analysis was carried out using the R programming language version 4.3.1 using the RStudio integrated development environment (Team, 2022). Specifically, the tidyverse, psych, lavaan, MVN, semTools, and rstatix packages were used for data manipulation and statistical calculations.
Several steps were taken to prepare and clean the data. Once the database was loaded, the study variables were defined (EEDDocente items, sex, age, type of degree, and academic stage) and the presence of missing data was checked. Subsequently, the evaluations of two items that were written in reverse order (i10 and i15) were recategorized. Various composite indices were then calculated: (1) the Global Index (IG = the sum of the raw scores of the 46 EEDDocente items) and the indices of each of the subscales (ÍS = the sum of the raw scores of each EEDDocente subscale). Finally, cases with atypical scores on the IG were identified and eliminated. This procedure was carried out following the criteria established by Tukey Fences. To do so, two limits were calculated, using the formula Q1-1.5(Q3–Q1) as a reference for the lower limit and Q3 + 1.5(Q3–Q1) for the upper limit, where Q1 and Q3 represent the values of the first and third quartiles, respectively. This process was carried out systematically until no atypical cases were detected. As a result, cases with IG scores ranging from 71 to 184 were retained, retaining 1,422 typical cases for analysis.
After data preparation and cleaning, descriptive statistics were calculated and graphs were drawn. First, the mean score, standard deviation, skewness, kurtosis, standard error, and item-total offset (rpbis) were calculated for the overall sample and reference groups by sex, age, type of degree, and academic stage. The assumption of normality was subsequently verified by applying the Kolmogorov-Smirnov test with Lilliefors correction to verify the normal distribution of the IG scores, and the Mardia and Henze-Zikler kurtosis and skewness tests to verify multivariate normality in the data (Mecklin and Mundfrom, 2004). The criterion for accepting univariate and multivariate normality were non-significant p-values p > 0.05) in the tests applied (Mecklin and Mundfrom, 2004). To conclude this stage, the intercorrelation measure between the items of the EEDDocente (Hair et al., 2019) was verified. In this sense, Bartlett's sphericity test was applied, so the correlation matrix was analyzed in search of significant correlations between the items. Likewise, the Kaiser-Meyer-Olkin (KMO) test was applied to calculate the degree of sampling adequacy between the variables (MSA). The criteria for assuming adequate intercorrelation measures between variables were established with a p-value > 0.05 in the Bartlett test and an MSA statistic > 0.50 in the KMO test (Hair et al., 2019).
For the reliability analysis of the EEDDocente, Cronbach's alpha (α), standardized alpha (αs), and McDonald's omega coefficient (ω) were calculated (McNeish, 2018). To obtain evidence of the validity of the internal structure, a Confirmatory Factor Analysis (CFA) was performed. The internal consistency verification criterion was set at reliability indices greater than 0.70 (α, αs, ω ≥ 0.70). Regarding the CFA, the procedures recommended by (Brown 2015) and (Hair et al. 2019) were followed. Based on the violation of the multivariate normality assumption and the ordinal measurement level of the data, the Weighted Least Squares with Adjusted Means and Variances (WLSMV) estimation method was applied. A two-factor model (Teaching Planning and Didactics [F1] and Learning Assessment and Feedback [F2]) was tested for the EEDDocente. Consecutively, the recommendations of (Hu and Bentler 1999) were considered for the selection and evaluation of the fit indices of the model under test. For this purpose, CFI, TLI and GFI values equal to or greater than 0.90 and RMSEA and SRMR values equal to or less than 0.08 were considered as model fit criteria.
The recommendations of (Dimitrov 2010) and (Putnick and Bornstein 2016) for measurement invariance analyses were followed. A multigroup CFA (MGCFA) was applied to obtain evidence of equivalence of conditions based on a series of increasingly restrictive models for the participant subgroups. These models were used to assess the invariance of the model configuration (M0), factor loadings (M1), item intercepts (M2), and residuals (M3). The criterion for verifying invariance was the presence of a difference less than .01 for the CFI index (Δ < 0.01) and a variance less than 0.015 for the TLI and SRMR indices (Δ < 0.015). Subgroups were created based on the responses to the sociodemographic variables (independent variables): sex, age, type of degree, and academic stage. For the sex variable, two groups were considered: men (n = 913) and women (n = 509). For the age variable, three subgroups were configured: low age, which includes participants between 17 and 21 years of age (n = 891); middle age, which includes participants between 22 and 30 years of age (n = 445); and upper age, which are those participants equal to or older than 31 years of age (n = 86). For the type of degree variable, participants who reported belonging to the communication, psychology, education, sociology, and social sciences core programs were coded as students of social sciences programs (n = 461), while students of law, business administration, accounting, computer science, and the common core of administration were categorized as students of economics-administrative sciences programs (n = 961). For the academic stage variable, three subgroups were created, grouped by stage of education. The basic stage includes students who reported being between the first and third semester of their degree (n = 461); the disciplinary stage includes those between the fourth and sixth semester (n = 650); and the terminal stage includes those in their seventh semester or higher (n = 311).
Finally, the mean scores of the subgroups that showed evidence of measurement invariance were compared. Neuhauser's (2021) recommendations were followed, using the Kruskal-Wallis rank-sum test to compare two groups, and the Wilcoxon rank-sum and signed-rank tests to compare more than two groups. Differences were calculated using nonparametric analysis techniques for ordinal variables. The criterion for determining significant differences was a p-value ≤ 0.05. The effect size was subsequently verified by calculating the eta-squared (η2) for variables that showed significant differences (Tomczak and Tomczak, 2014). Four comparative hypotheses were tested: the first working hypothesis (H1) considers that women, on average, are more likely to give high scores to their teachers. The second hypothesis (H2) proposes that middle-aged and upper-aged students have higher average scores than the younger group. The third hypothesis (H3) proposes that students in the disciplinary and terminal stages give higher average scores to their teachers than students in the basic stage. The fourth working hypothesis (H4) considers that students enrolled in programs belonging to the Social Sciences give higher average scores than students enrolled in programs belonging to the Economic and Administrative Sciences. By testing these comparative hypotheses, we aim to contrast and follow up on the studies carried out by (Baños et al. 2022), and (Bazán-Ramírez et al. 2021) in the line of research related to the differences in teacher performance from the perception of students according to sociodemographic and the educational context variables.
3 Results
3.1 Descriptive analysis and assumption of normality
The mean GI score obtained in this study was 152.34 with a standard deviation (SD) of 27.74. The scores for each subscale of the EEDDocente were 53.23 (SD = 9.80) for the first, 52.95 (SD = 9.96) for the second, and 46.15 (SD = 9.48) for the third. Regarding the items, mean scores ranged from 2.31 (item 10_6) to 3.46 (item 9_10). The descriptive statistics for the items can be seen in Table 3.
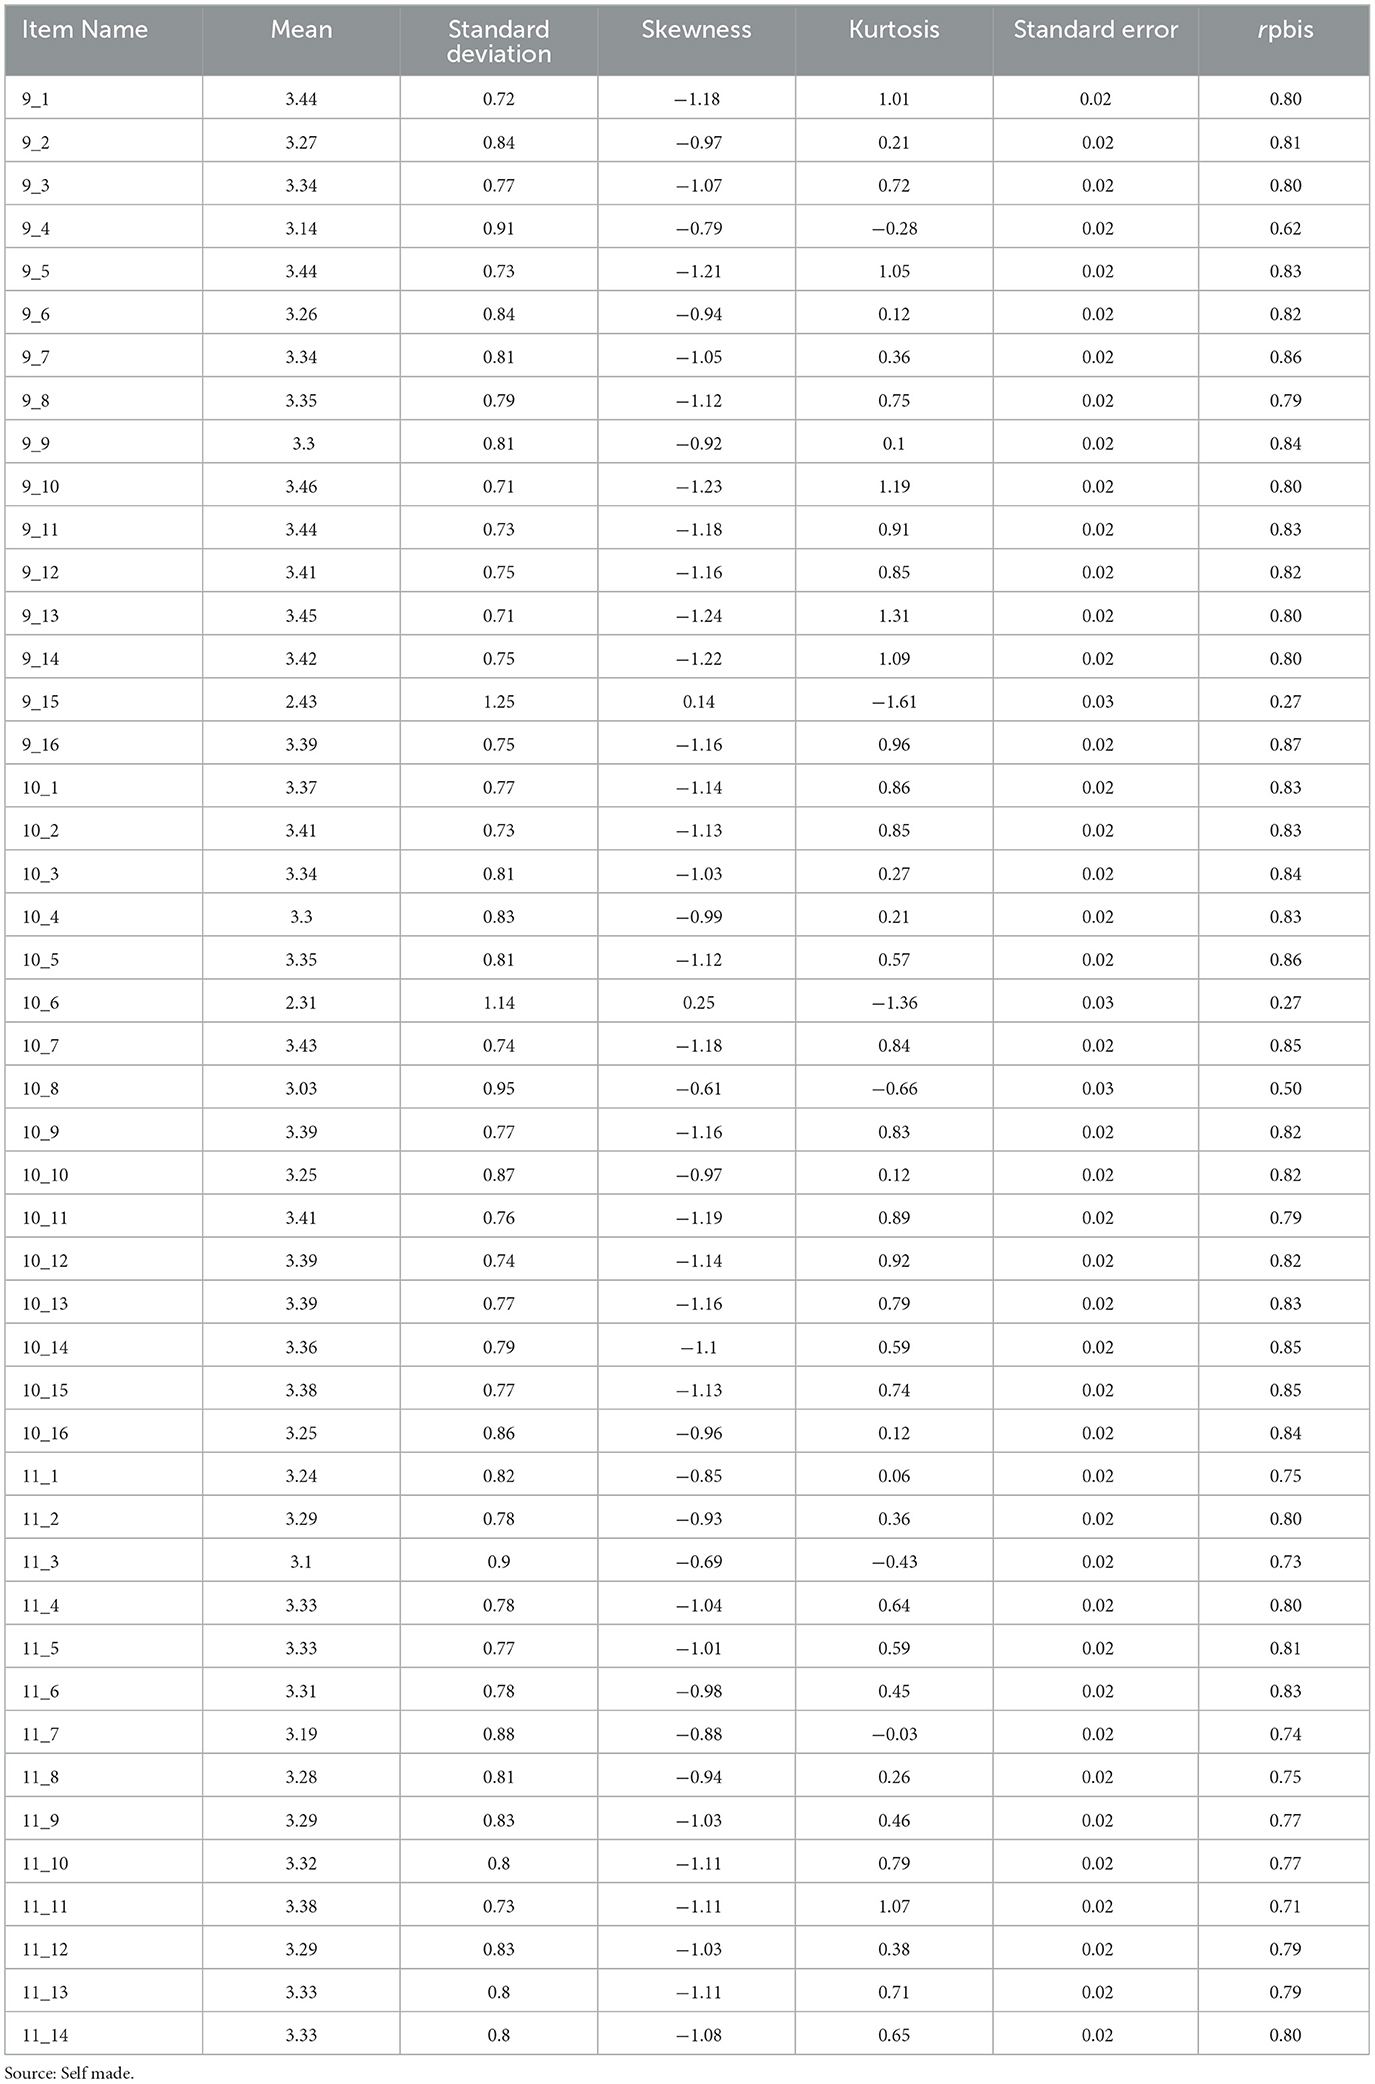
Table 3. Descriptive statistics of the EEDDocente items.
Likewise, statistics were obtained regarding the normality of data distribution. The Kolmogorov-Smirnov test with Lilliefors correction showed a significant p-value (D = 0.14, p < 0.05). Similarly, significant values were found in the Mardia (skewness = 1,26,321.97, p < 0.05; kurtosis = 660.27, p < 0.05) and Henze-Zirkler (hz = 50.16, p < 0.05) skewness and kurtosis tests. Therefore, the assumption of normal distribution of the data, whether univariate or multivariate, is not supported. Regarding the intercorrelation analysis between the variables, a significant value was obtained in Bartlett's sphericity test (K2 = 1,780, df = 45, p < 0.05) and high indices in the sampling adequacy of the variables (global MSA = 0.99).
3.2 Internal structure and reliability
The two-factor model of the EEDDocente explained 68% of the observed variance. With the exception of items 9_15 and 10_6, the factor loadings and variances were adequate (Brown, 2015). The latent factor covariance index between factors was also found to be high (standardized r = 0.82), but theoretically possible. The model also met the criteria for a good fit (Hu and Bentler, 1999). The calculated indices suggest that the two-factor model has a good fit (x2 = 2,661.58, df = 989, p < 0.0, CFI = 0.995, TLI = 0.995, GFI = 0.993, NFI = 0.993, RMSEA = 0.034 [95% CI = 0.033–0.035], SRMR = 0.051). In addition, it is reported that the internal consistency indices are adequate in both factors with values above the established criterion of 0.70 (see Figure 1 and Table 4).
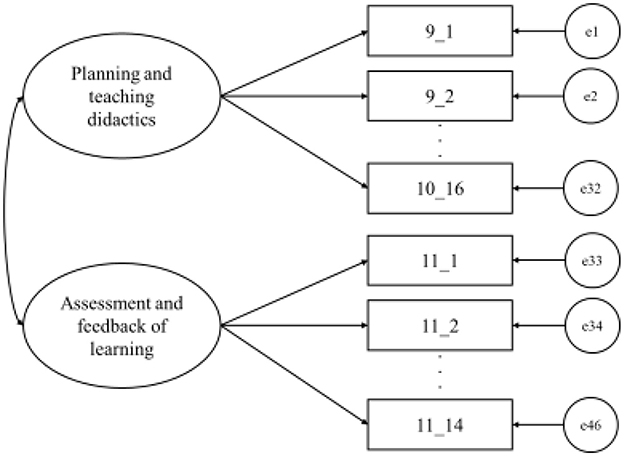
Figure 1. Two-factor first-order CFA model of EEDDocente.
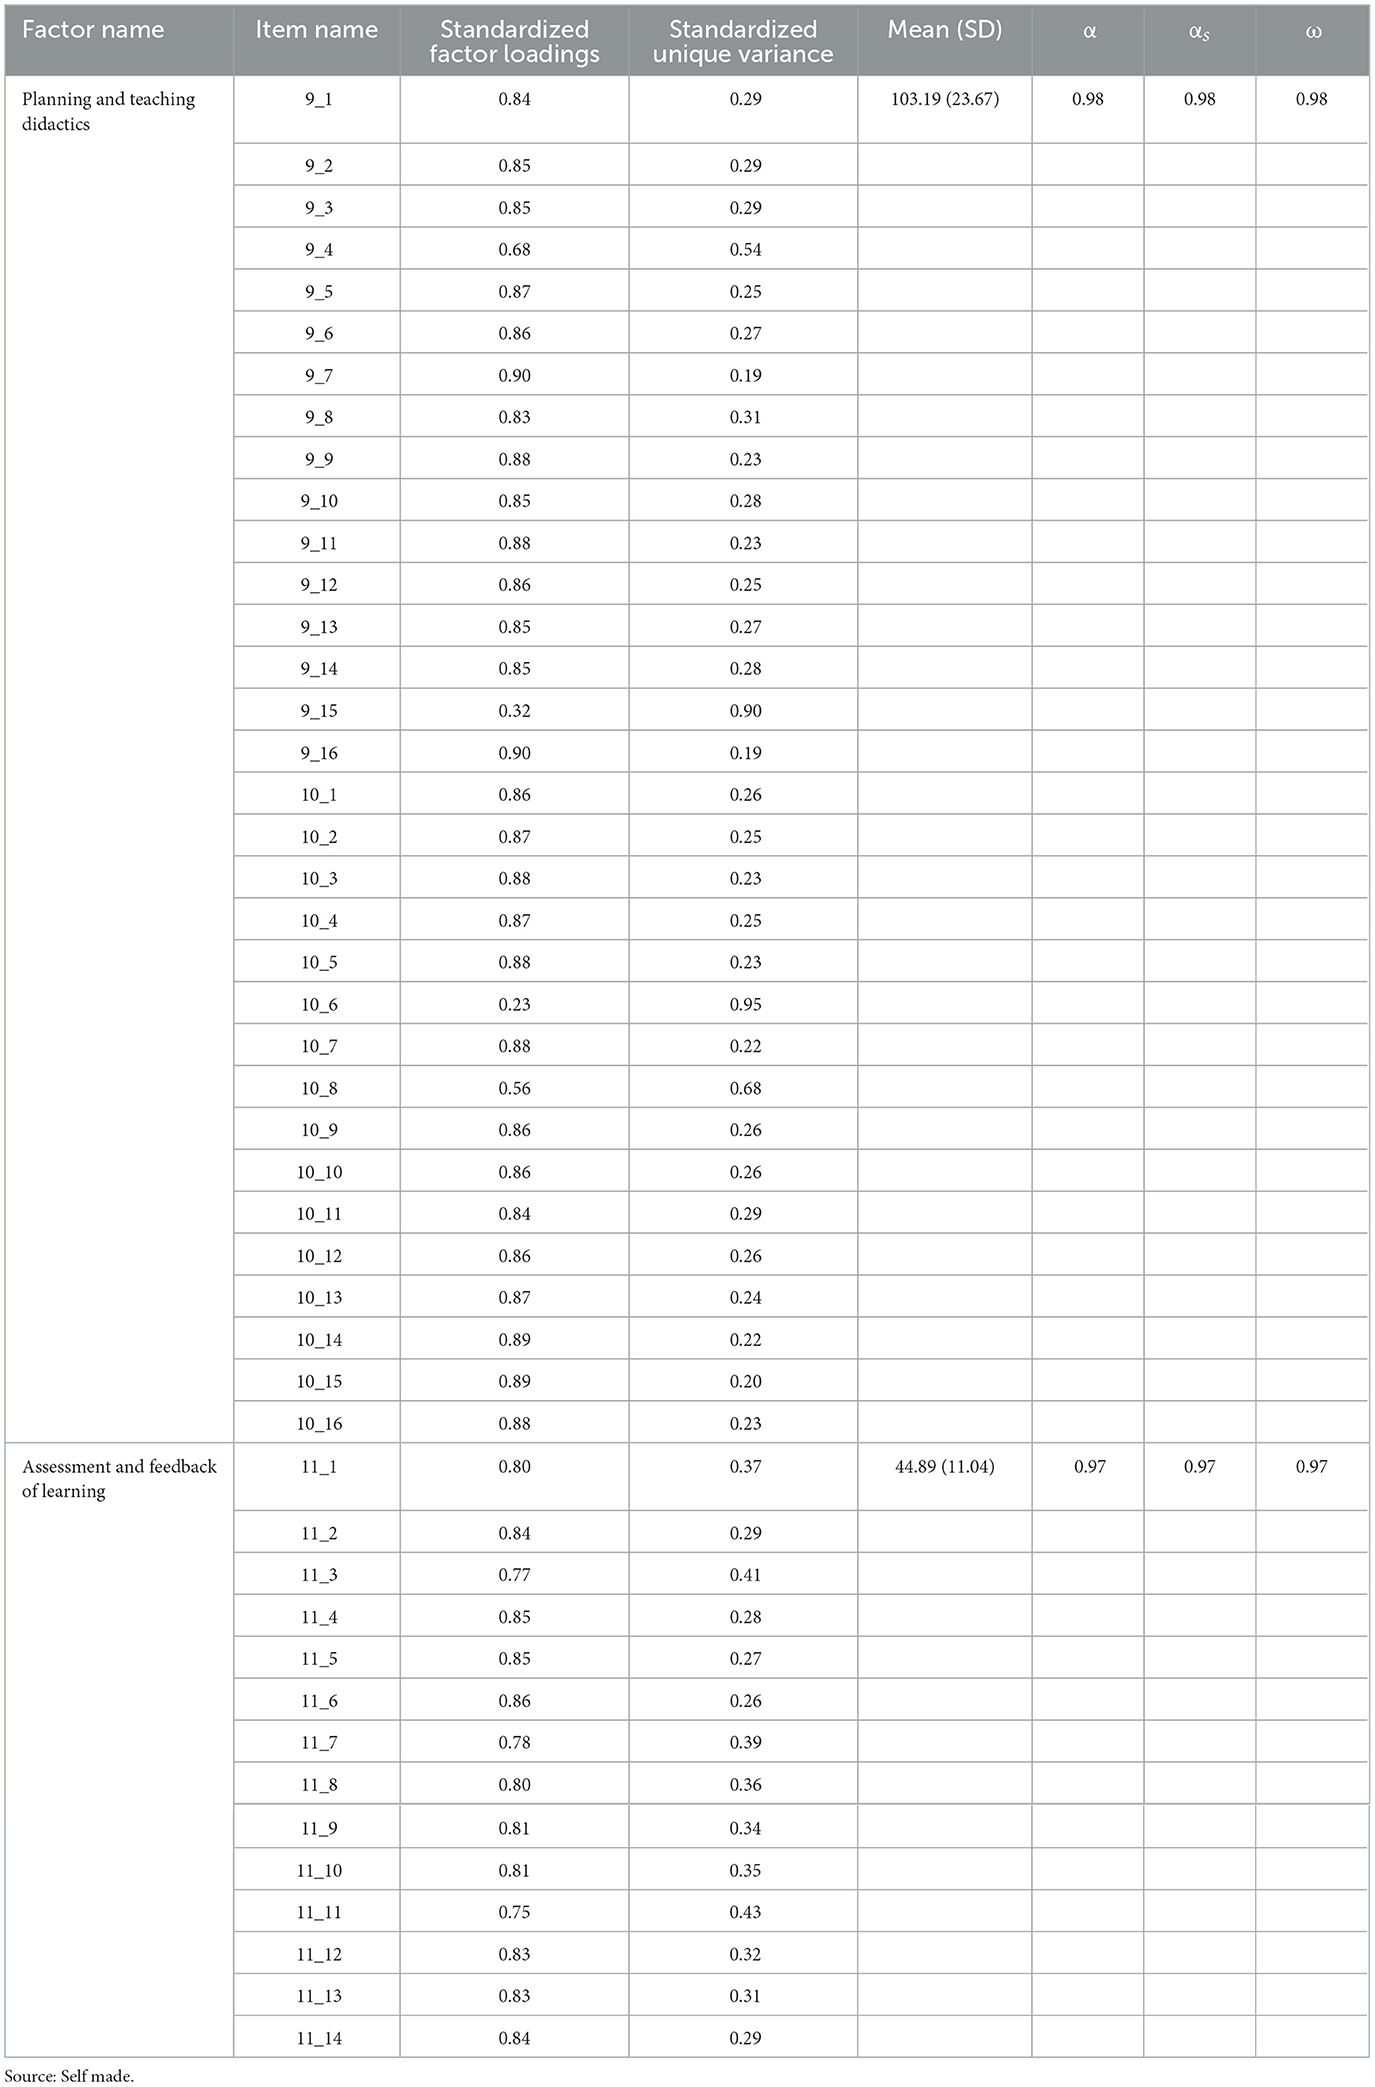
Table 4. Standardized factor loadings, mean scores, and internal consistency indices of the two-factor model.
3.3 Factorial invariance
Factorial invariance of the two-factor model was verified based on the sociodemographic variables of sex, age, type of degree, and academic stage. Four models (M0-M3) were evaluated, providing evidence of invariance between the mean scores. In this regard, Table 5 shows adequate variation in the CFI (Δ < 0.01), as well as the TLI and SRMR (Δ < 0.015), across the four models of the variables analyzed. Based on the results, it can be assumed that the measurement is invariant across subgroups, and it is appropriate to compare their mean scores.
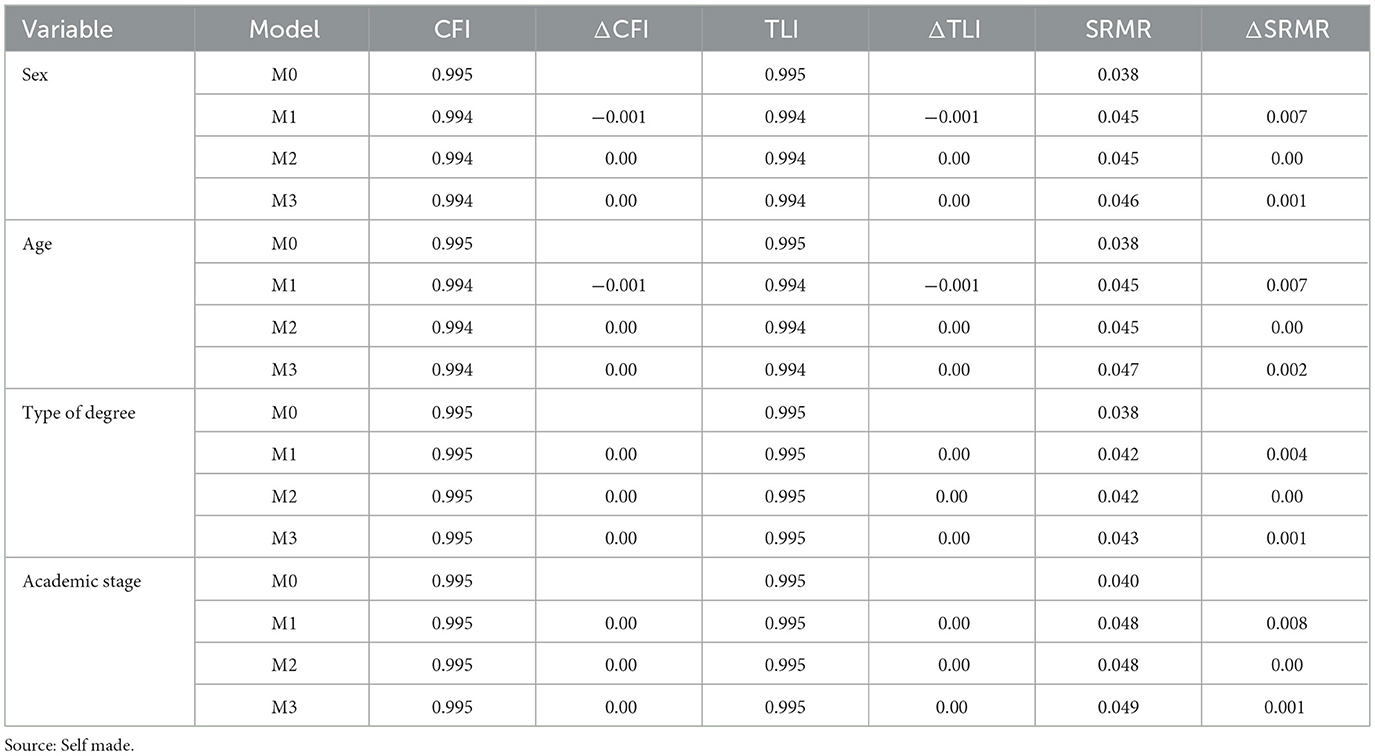
Table 5. Comparison of fit indices between invariance models based on sociodemographic variables.
3.4 Comparative analysis
The GI of the subgroups that showed evidence of residual invariance (M3) was compared: sex (male and female), age (low and medium), academic stage (basic, disciplinary, and terminal), and type of degree (social sciences and economic and administrative sciences). Significant differences (p < 0.05) were found according to the age group and academic stage of the group. It was observed that the mean score of the low-age group (Mig = 150) was significantly lower than that of the middle-age group (Mig = 153). It was also observed that those participants in the basic stage had significantly lower scores (Mig = 148) than those in the disciplinary (Mig = 152) and terminal stages (Mig = 154). However, despite the statistical significance, the effect sizes were considered very low (< 0.01; see Table 6).
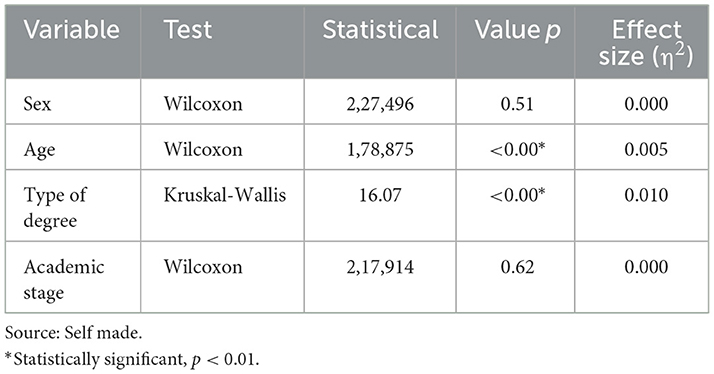
Table 6. Comparison of mean scores based on sociodemographic variables.
4 Discussion and conclusions
Understanding the relationships and differences in teacher evaluations from the students' perspective is an important task because they are considered one of the main components for improving educational quality at the levels of educational systems, schools, and classrooms. To achieve the objectives of this study, various statistical analyses of the differences in teacher evaluation results were conducted, considering the variables of sex, age, type of degree, and academic stage of the FCAyS-UABC students. To verify that the interpretations of the comparisons of the EEDDocente scores between student groups are a result of differences in their perception of teacher performance, factorial invariance was measured based on the sociodemographic variables of sex, age, type of degree, and academic stage. Invariance studies provide validity evidence that guarantees that a measurement instrument such as the EEDDocente evaluates the same construct uniformly among different subgroups (Dimitrov, 2010). The results obtained from this analysis showed an adequate difference in CFI (Δ < 0.01), as well as in TLI and SRMR (Δ < 0.015), across the four models of the variables analyzed (see Table 3). Based on this, it was assumed that the measurement is invariant across subgroups, and it was deemed appropriate to compare the mean scores on the EEDDocente.
The results of the internal structure and invariance studies carried out agree with those reported by (Márquez and Madueño 2016) and (Henríquez et al. 2023). These studies present a reliable and stable multidimensional structure for measuring teacher performance using scales from the student's perspective, which allows for the identification of the integration of theoretical components and dimensions of teacher performance related to planning and teaching, and the evaluation and feedback of learning. In particular, the invariance results agree with the results obtained by (Henríquez et al. 2023) in that the multivariate model of the EEDDocente can be interpreted independently of the group given by the reference sociodemographic and academic variables. Furthermore, the results obtained provide evidence of the possibility of generalizing the multivariate structure of the EEDDocente two-factor model from the student perspective for different groups according to their sex, age, type of program or area of knowledge, and academic stage. Thus, this research provides results that support the relevance of performing invariance tests from a multigroup approach to measure and validate multidimensional variables (Byrne, 2008; Milfont and Fischer, 2010; Marsh, 1984).
Among the main findings of the comparative analysis, it was found that the student's sex variable does not influence the evaluation of teacher performance, so H1 is rejected. These results agree with the research of (Baños et al. 2022), and (Bazán-Ramírez et al. 2021). Likewise, no significant differences were found in the scores of the teacher performance evaluation by students enrolled in careers belonging to the Social Sciences and students enrolled in careers belonging to the economic-administrative sciences, so H4 is rejected. On the other hand, H1 and H3 are accepted since significant differences (p < 0.05) were found between the age groups of the students and the academic stage they are studying. In particular, the findings related to differences in teacher performance evaluations from the students' perspective depending on their academic stage or cycle coincide with the findings of other researchers (Marsh and Hocevar, 1984; Kalender and Berberoglu, 2019; Bazán-Ramírez et al., 2021). These findings on the differences in the results of teacher performance evaluations from the student perspective according to their academic stage coincide with other studies in higher education (Marsh and Hocevar, 1984; Kalender and Berberoglu, 2019; Bazán-Ramírez et al., 2021). In this regard, (Feistauer and Richter 2018) point out that these differences can be explained because students change their expectations and interests in the performance and actions of their teachers and the teaching process as they advance in their university career.
One of the limitations of the study is that the sampling method used to compile the EEDDocente 2025-1 database cannot be controlled, as it is the result of decisions made by university authorities. It is important to remember that, for logistical reasons, the FCAyS administration, together with the TEC-FCAyS, selected one school group from each educational program for each shift (morning and afternoon). Furthermore, it is important to highlight that the student sample represents approximately 36% of the total FCAyS student population, which is not negligible for the purposes of the EEDDocente (see Henríquez and Arámburo, 2021; and Pérez-Morán et al., 2024).
For future studies it is recommended: (a) apply a stratified random sampling method by study program and academic stage that ensures the representativeness and significance of the study samples, (b) due to the high correlation between the latent factors it is considered relevant to analyze the theoretical foundations of the EEDDocente measurement model to identify adjustments to its structure and subscales, (c) to evaluate the membership and relevance of items 9_15 and 10_16 of the EEDDocente because the parameters obtained from the two-factor model indicate that they provide little information for the measurement, (d) to increase a greater number of participants by study subgroups that ensure the preliminary criteria of the estimation methods used, and (e) to compare the internal structure of the two-factor model of the EEDDocente with other large-scale studies and in contrast to models with three or more factors.
Data availability statement
The datasets presented in this article are not readily available because the raw data and the R script on which the analyses and conclusions of this article are based will be shared without reservation upon request to the author by correspondence and approval by the ethics committee of the FCAyS-UABC. Requests to access the datasets should be directed to cGhlbnJpcXVlekB1YWJjLmVkdS5teA==.
Ethics statement
Data collection using the EEDDocente was carried out in accordance with the protocols and procedures approved by the Director and the Teacher Evaluation Coordinator of the FCAyS-UABC, in compliance with current institutional research ethics standards. To this end, students from the final semesters were recruited and trained to administer the EEDDocente to volunteer students from each FCAyS-UABC educational program. These students were previously informed about the study's objectives and procedures.
Author contributions
PH: Conceptualization, Data curation, Formal analysis, Investigation, Methodology, Project administration, Supervision, Visualization, Writing – original draft, Writing – review & editing. JP-M: Conceptualization, Data curation, Formal analysis, Investigation, Methodology, Supervision, Validation, Visualization, Writing – original draft, Writing – review & editing. CG: Investigation, Methodology, Visualization, Writing – review & editing. BB: Investigation, Methodology, Visualization, Writing – review & editing.
Funding
The author(s) declare that no financial support was received for the research and/or publication of this article.
Conflict of interest
The authors declare that the research was conducted without any commercial or financial relationships that could be construed as a potential conflict of interest.
Generative AI statement
The author(s) declare that no Gen AI was used in the creation of this manuscript.
Any alternative text (alt text) provided alongside figures in this article has been generated by Frontiers with the support of artificial intelligence and reasonable efforts have been made to ensure accuracy, including review by the authors wherever possible. If you identify any issues, please contact us.
Publisher's note
All claims expressed in this article are solely those of the authors and do not necessarily represent those of their affiliated organizations, or those of the publisher, the editors and the reviewers. Any product that may be evaluated in this article, or claim that may be made by its manufacturer, is not guaranteed or endorsed by the publisher.
References
Aiken, L. (1985). Three coefficients for analyzing the reliability and validity of ratings. Educ. Psychol. Meas. 45, 131–142. doi: 10.1177/0013164485451012
André, S., Maulana, R., Helms-Lorenz, M., Telli, S., Chun, S., Fernández-García, C-. M., et al. (2020). Student perceptions in measuring teaching behavior across six countries: a multi-group confirmatory factor analysis approach to measurement invariance. Front. Psychol. 11:273. doi: 10.3389/fpsyg.2020.00273
Baños, R., Machado-Parra, J. P., Barretos-Ruvalcaba, M., Pérez-Morán, J. C., and Baena-Extremera, A. (2022). Propiedades psicométricas y medición de la invarianza por género de la Escala de Evaluación de Competencias Digitales de Educación Física en el contexto mexicano [Psychometric properties and gender invariance measurement of the physical education digital competencies assessment scale in the Mexican context]. Retos 46, 349–357. doi: 10.47197/retos.v46.93958
Bazán-Ramírez, A., Pérez-Morán, J. C., and Bernal-Baldenebro, B. (2021). Criteria for teaching performance in psychology: invariance according to age, sex, and academic stage of peruvian students. Front. Psychol. 12:764081. doi: 10.3389/fpsyg.2021.764081
Brown, T. A. (2015). Confirmatory Factor Analysis for Applied Research, 2nd Edn. New York, NY: Guilford Publications.
Byrne, B. M. (2008). Testing for multigroup equivalence of a measuring instrument: a walk through the process. Psicothema 20, 872–882.
Chan, W. M. (2018). Teaching in HIGHER education: students' perceptions of effective teaching and good teachers. Soc. Sci. Educ. Res. Rev. 5, 40–58.
Cisneros-Cohernour, E., and Stake, R. (2010). La evaluación de la docencia en educación superior: de evaluaciones basadas en opiniones de estudiantes a modelos por competencias [Teaching evaluation in higher education: from student-based assessments to competency-based models]. Revista Iberoamericana de Evaluación Educativa, 3, 219–231. doi: 10.15366/riee2010.3.1.017
Cortés, E., Campos, M., and Moreno, M. P. (2014). Priorización de las dimensiones de evaluación al desempeño docente por el estudiante, en tres áreas del conocimiento [Prioritization of the dimensions of evaluation of teaching performance by the student, in three areas of knowledge]. Formación Universitaria 7, 3–10. doi: 10.4067/S0718-50062014000200002
Dimitrov, D. M. (2010). Testing for factorial invariance in the context of construct validation. Meas. Eval. Couns. Dev. 43, 121–149. doi: 10.1177/0748175610373459
Durán-Aponte, E., and Durán-García, M. (2015). Adaptación y validez de un instrumento para la evaluación de docencia universitaria: escala de desempeño docente institucional (EDDI) [Adaptation and validity of an instrument for the evaluation of university teaching: institutional teaching performance scale (EDDI)]. Perspectiva Educacional, Formación de Profesores 54, 75–89. doi: 10.4151/07189729-Vol.54-Iss.1-Art.306
Feistauer, D., and Richter, T. (2018). Validity of students' evaluations of teaching: biasing effects of likability and prior subject interest. Stud. Educ. Eval. 59, 168–178. doi: 10.1016/j.stueduc.2018.07.009
Flores, L., Salazar, T., Roca, K., and Quisirumbay, G. (2024). Rol docente en el fortalecimiento del proceso de enseñanza-aprendizaje de los estudiantes de educación general básica. Polo Conocimiento 9, 1807–1823. doi: 10.23857/pc.v9i11.8426
Gómez, L., and Valdés, M. (2019). The evaluation of teacher performance in higher education. J. Educ. Psychol. Propósitos y Representaciones 7, 499–515. doi: 10.20511/pyr2019.v7n2.255
Guzmán, J. C. (2016). ¿Qué y cómo evaluar el desempeño docente? Una propuesta basada en los factores que favorecen el aprendizaje. Propósitos Representaciones 4, 285–358. doi: 10.20511/pyr2016.v4n2.124
Guzmán-Loria, P. I. (2013). La evaluación de los aprendizajes en la sección de química general de la Escuela de Química, de la Universidad de Costa Rica. Actual. Investig. Educ. 13, 1–28. Available online at: https://www.scielo.sa.cr/pdf/aie/v13n3/a13v13n3.pdf (Accessed February 3, 2025).
Hair, J. F., Babin, B. J., and Anderson, R. E. (2019). Multivariate Data Analysis. New Jersey: Cengage.
Henríquez, P., and Arámburo, V. (2021). Evaluación del desempeño docente por áreas de conocimiento: El Caso de la Facultad de Ciencias Administrativas y Sociales de la Universidad Autónoma de Baja California, México. [Evaluation of teaching performance by areas of knowledge: the case of the Faculty of Administrative and Social Sciences of the Autonomous University of Baja California, Mexico]. Act. Investig. Educ. 21, 1–20. doi: 10.15517/aie.v21i3.46294
Henríquez, P., Arámburo, V., and Dávila, E. (2017). “Percepción de los estudiantes universitarios acerca de las estrategias pedagógicas y de evaluación del aprendizaje utilizadas por sus profesores: el Caso de la FCAYS de la UABC. [Perception of university students about the pedagogical and learning assessment strategies used by their professors: the case of the FCAYS at UABC],” in Memorias electrónicas del XIV Congreso Nacional de Investigación Educativa, COMIE (San Luis Potosí), 1–14. Available online at: https://www.comie.org.mx/congreso/memoriaelectronica/v14/doc/1956.pdf (Accessed August 16, 2025).
Henríquez, P., Pérez-Morán, J. C., del Cid, C. D., and Zamora, J. E. (2023). Factor structure and invariance of the scale to measure teaching performance in the area of social sciences. Front. Educ. 8:1229129. doi: 10.3389/feduc.2023.1229129
Hirschfeld, G., and Von-Brachel, R. (2014). Multiple-group confirmatory factor analysis in R - a tutorial in measurement invariance with continuous and ordinal indicators. Pract. Assess. Res. Eval. 19, 1–12. doi: 10.7275/qazy-2946
Hu, L., and Bentler, P. M. (1999). Cutoff criteria for fit indexes in covariance structure analysis: conventional criteria versus new alternatives. Struct. Equation Model. Multidiscip. J. 6, 1–55. doi: 10.1080/10705519909540118
Kalender, I., and Berberoglu, G. (2019). The measurement invariance of University students' ratings of instruction. Hacet. Univ. J. Educ. 34, 402–417. doi: 10.16986/HUJE.2018045408
Kimball, S., White, B., Milanowski, A., and Borman, G. (2004). Examining the relationship between teacher evaluation and student assessment results in washoe county. Peabody J. Educ. 79, 54–78. doi: 10.1207/s15327930pje7904_4
Lawshe, C. (1975). A quantitative approach to content validity. Personnel Psychol. 28, 563–575. doi: 10.1111/j.1744-6570.1975.tb01393.x
Luna Serrano, E., and Arámburo Vizcarra, V. (2013). Variables asociadas a la competencia docente universitaria en la opinión de los estudiantes [Variables associated with university teaching competence in the opinion of students]. Archivos Analíticos de Políticas Educativas, 21:1. doi: 10.14507/epaa.v21n1.2013
Márquez, L., and Madueño, M. L. (2016). Propiedades psicométricas de un instrumento Para apoyar el proceso de evaluación del docente universitario. [psychometric properties of an instrument to support the evaluation process of the university professor]. Rev. Electrón. Investig. Educ. 18, 53–61.
Marsh, H. W. (1984). Students' evaluations of University teaching: dimensionality, reliability, validity, potential biases, and utility. J. Educ. Psychol. 76, 707–754. doi: 10.1037/0022-0663.76.5.707
Marsh, H. W., and Hocevar, D. (1984). The factorial invariance of student evaluations of college teaching. Am. Educ. Res. J. 21, 341–366. doi: 10.3102/00028312021002341
McNeish, D. (2018). Thanks coefficient alpha, we'll take it from here. Psychol. Methods 23, 412–433. doi: 10.1037/met0000144
Mecklin, C. J., and Mundfrom, D. J. (2004). An appraisal and bibliography of tests for multivariate normality. Int. Stat. Rev. 72, 123–138. doi: 10.1111/j.1751-5823.2004.tb00228.x
Milfont, T. L., and Fischer, R. (2010). Testing measurement invariance across groups: applications in cross-cultural research. Int. J. Psychol. Res. 3, 111–130. doi: 10.21500/20112084.857
Mohammadi, M. (2021). Dimensions of teacher performance evaluation by students in higher education. Shanlax Int. J. Educ. 9, 18–25. doi: 10.34293/education.v9i2.3673
Montoya, J., Arbesú, I., Contreras, G., and Conzuelo, S. (2014). Evaluación de la docencia universitaria en México, Chile y Colombia: análisis de experiencias [Evaluation of university teaching in Mexico, Chile and Colombia: analysis of experiences]. Revista Iberoamericana de Evaluación Educativa 7, 15–42. doi: 10.15366/riee2014.7.2.001
Morales, J. (2022). The evaluation of teacher performance in higher education. Int. J. Sci. Soc. 4, 140–150. doi: 10.54783/ijsoc.v4i3.507
Murillo-Gordón, S., Siquihua-Avilés, M., Vargas-Montealegre, A., and Raigosa-Lara, A. (2024). Evaluación del desempeño docente en la educación superior: un análisis biométrico. KAIRÓS, Revista de Ciencias Económicas, Jurídicas, y Administrativas, 7, 25–45. doi: 10.37135/kai.03.13.02
Neuhauser, M. (2021). Nonparametric Statistical Tests. New York, NY: CRC Press and Taylor & Francis Group.
Ochoa Sierra, L., and Moya Pardo, C. (2019). La evaluación docente universitaria: retos y posibilidades. Folios 49, 41–60. Available online at: https://www.redalyc.org/journal/3459/345962834003/html/ (Accessed August 20, 2025).
Olmedo-Rodriguez, E., Berrú Torres, C., and Escaleras Encarnación, V. (2024). Innovación en métodos de enseñanza: estrategias y desafíos para el compromiso y motivación estudiantil. Rev. INVECOM Estud. Transdiscipl. Comun. Soc. 4, 1–16. Available online at: https://ve.scielo.org/pdf/ric/v4n2/2739-0063-ric-4-02-e040251.pdf (Accessed March 22, 2025).
Pérez-Morán, J. C., Henriquez, P., and Márquez, M. (2024). Validación de Contenido de la Escala de Evaluación del Desempeño Docente (EEDDocente) para el Área de las Ciencias Sociales [Content Validation of the Teacher Performance Evaluation Scale (EEDDocente) for the Area of Social Sciences]. Revista Internacional de Aprendizaje 10, 37–54. doi: 10.18848/2575-5544/CGP/v10i02/37-54
Punéz Lazo, N. (2015). Evaluación para el aprendizaje: una propuesta para una cultura evaluativa. Horiz. Cienc 5, 87–96. doi: 10.26490/uncp.horizonteciencia.2015.8.124
Putnick, D. L., and Bornstein, M. H. (2016). Measurement invariance conventions and reporting: the state of the art and future directions for psychological research. Dev. Rev. 41, 71–90. doi: 10.1016/j.dr.2016.06.004
Rua Pomahuacre, S., Aguire Macavilca, R., Miraval Márquez, J., and Rivera Muñoz, J. (2025). Relación entre desempeño docente y la motivación para aprender en la carrera de Ingeniería en Alimentos. Tribunal Rev. Cienc. Educ. Cienc. Juríd. 5, 365–382. doi: 10.59659/revistatribunal.v5i10.119
Salinas, M. I. (2017). Gestión de la evaluación del desempeño docente en aulas virtuales de un proyecto de Blended-Learning. Ciencia, Docencia y Tecnología 28, 100–129.
Sánchez Rincón, R. (2021). Los rasgos a evaluar en el desempeño docente. La voz de los estudiantes. Espacio I + D Innov. Desarrollo 10, 102–118. doi: 10.31644/IMASD.28.2021.a05
Scherer, R., and Gustafsson, J. E. (2015). Student assessment of teaching as a source of information about aspects of teaching quality in multiple subject domains: an application of multilevel bifactor structural equation modeling. Front. Psychol. 6:1550. doi: 10.3389/fpsyg.2015.01550
Scherer, R., Nilsen, T., and Jansen, M. (2016). Evaluating individual students' perceptions of instructional quality: an investigation of their factor structure, measurement invariance, and relations to educational outcomes. Front. Psychol. 7:110. doi: 10.3389/fpsyg.2016.00110
Team, R. C. (2022). Writing R extensions. R foundation for statistical computing. 1–208. Available online at: https://cran.r-project.org/doc/manuals/R-exts.html (Accessed March 25, 2024).
Thompson, S., Johnstone, C., and Thurlow, M. A. (2002). Universal Design Applied to Large Scale Assessments (Synthesis Report 44). Minneapolis, MN, United States: National Center on Educational Outcomes, University of Minnesota.
Tomczak, M., and Tomczak, E. (2014). The need to report effect size estimates revisited. An overview of some recommended measures of effect size. Trends Sport Sci. 1, 19–25.
Tristán-López, A. (2008). Modificación al modelo de Lawshe para el dictamen de validez de contenido de un instrumento objetivo. Avances en Medición 6, 37–48.
Valencia Torres, H. (2019). La competencia gestión académica en los docentes de Educación Física de la secundaria básica colombiana. Transformación 15, 297–315. Available online at: http://scielo.sld.cu/pdf/trf/v15n3/2077-2955-trf-15-03-297.pdf (Accessed August 20, 2025).
Wang, D. F., and Guan, L. (2017). Higher education quality evaluation from the perspective of students: theoretical construction and reflection. J. Nat. Inst. Educ. Admin. 5:75. doi: 10.1007/s11516-018-0014-0
Wellein, M. G., Ragucci, K. R., and Lapointe, M. (2009). A peer review process for classroom teaching. Am. J. Pharm. Educ. 73, 1–7. doi: 10.1016/S0002-9459(24)00133-5
Zabaleta, F. (2007). The use and misuse of student evaluations of teaching. Teach. High. Educ. 12, 55–76. doi: 10.1080/13562510601102131
Zamora, E. (2021). La evaluación del desempeño docente mediante cuestionarios en la universidad: Su legitimidad según la literatura y los requerimientos Para que sea efectiva [The evaluation of teaching performance through questionnaires at the university: its legitimacy according to the literature and the requirements for it to be effective]. Rev. Actual. Investig. Educ. 21, 1–23. doi: 10.15517/aie.v21i3.46221
Keywords: evaluation, teacher, higher education, validity, internal structure, factorial invariance
Citation: Henriquez Ritchie PS, Pérez-Morán JC, del Cid García CJ and Boroel Cervantes B (2025) Evaluation of teaching performance by university students of social and administrative sciences: a comparative study. Front. Educ. 10:1629540. doi: 10.3389/feduc.2025.1629540
Received: 16 May 2025; Accepted: 08 September 2025;
Published: 08 October 2025.
Edited by:
Girum Tareke Zewude, Wollo University, EthiopiaReviewed by:
Alemayehu Berhanu Areda, Dilla University, EthiopiaLiberty Gay Manalo, Rizal Technological University, Philippines
Copyright © 2025 Henriquez Ritchie, Pérez-Morán, del Cid García and Boroel Cervantes. This is an open-access article distributed under the terms of the Creative Commons Attribution License (CC BY). The use, distribution or reproduction in other forums is permitted, provided the original author(s) and the copyright owner(s) are credited and that the original publication in this journal is cited, in accordance with accepted academic practice. No use, distribution or reproduction is permitted which does not comply with these terms.
*Correspondence: Juan Carlos Pérez-Morán, anVhbi5jYXJsb3MucGVyZXoubW9yYW44NkB1YWJjLmVkdS5teA==