 Julian M. Siebert
- Graduate School of Education, Stanford University, Stanford, CA, United States
This paper addresses the use of narrative visualizations as an effective way to improve communication, engagement, and knowledge transfer in research-practice partnerships (RPPs). I report on the experience of developing a narrative visualization reporting research findings to educators/school leaders in an RPP focused on providing more equitable access to high school mathematics courses for multilingual students [referred to as English learners (ELs) in the US]. The narrative visualization was intended to allow easy interpretation of information on: (i) student rates of completion of courses that are critical to becoming eligible for college admission; (ii) student mathematics course trajectories; and (iii) mathematics course placement decisions. Using the notion of graphical excellence, I identify specific visualization strategies and features that improve the quality of the narrative visualization and support practitioners use of them. Drawing on liberatory design thinking, I discuss how this form of reporting findings builds trust and facilitates engagement between partners, increases practitioners' agency, and thus creates more equitable power dynamics in RPPs and for the multilingual students at the core of the one discussed here.
1 Introduction
Since Coburn et al.'s (2013) paper introducing RPPs to the field of education, the number of RPPs has steadily increased and research on them has grown into a sub-field of its own (Arce-Trigatti et al., 2018; Penuel and Hill, 2019). Defined as “long-term collaboration aimed at educational improvement or equitable transformation through engagement with research […] intentionally organized to connect diverse forms of expertise and shift power relations in the research endeavor to ensure that all partners have a say in the joint work” (Farrell et al., 2021, p. 5), RPPs are focused on creating and using research; are usually multi-year projects, often tackling different and changing research questions and practice problems at different stages; tend to have a direct and measurable goal in terms of achieving educational improvement or equitable transformation; and are intentionally built around different areas of expertise and experience and center all stakeholders (also see Penuel et al., 2020).
While knowledge synthesis, dissemination, and application are cornerstones of RPPs (Coburn et al., 2013), the way knowledge is produced, communicated, and used, differs between research and practice contexts. This challenge, often described as the research-practice gap (see, e.g., Farrell et al., 2022; Hays et al., 2019), is addressed by some RPPs by working with brokers charged with facilitating collaboration and communication between researchers and practitioners (Wentworth et al., 2021). While brokerage can help closing the part of the research-practice gap referred to as the knowledge gap—the mismatch in the format, channels, and degree of technicality in sharing and discussing information (Wentworth et al., 2021)—through ensuring smooth onboarding, coordinating regular exchanges, and maintaining awareness of historical developments, translating the research produced in universities to school contexts remains a challenge.
An important step in closing the knowledge gap in RPPs is knowledge translation, defined by the Canadian Institutes of Health Research (2016) as
a dynamic and iterative process that includes synthesis, dissemination, exchange, and ethically-sound application of knowledge [and as a process that] takes place within a complex system of interactions between researchers and knowledge users which may vary in intensity, complexity and level of engagement depending on the nature of the research and the findings as well as the needs of the particular knowledge user (Knowledge Translation—Definition section, para. 1).
One promising strategy of tackling the knowledge transfer gap and achieving successful knowledge translation is the use of visualization tools (Cooper and Shewchuk, 2015; Kothari and Wathen, 2017). Complex issues such as translational research on linguistic equity is multidimensional in nature and therefore notoriously difficult to communicate in a straightforward and static manner. Interactivity can help overcome the limitations of static graphs by harness perception to amplify cognition (Card et al., 1999).
When well-designed (interactive) visualizations are complemented with and embedded in a written narrative, the product is called a narrative visualization (Segel and Heer, 2010). Narrative visualizations for reporting results from RPPs are somewhat of a middle ground between elaborate and detailed written research reports—favored by academics—and concise summaries of actionable points that can help guide practice—often favored by practitioners. They can help translate complex research outputs into accessible output formats and allow for interactive knowledge exploration, thereby helping to close the knowledge transfer gap. They are flexible, they can be built upon and changed throughout an RPP lifespan so that they can serve as communication devices at different stages of RPP communication, from ideation and exploration to the final summary of findings.
In such tools, users can repeatedly explore the data, develop a sense of the relationships between variables, and hypothesize about causal patterns. Modern and well-designed interactive graphics can help users reason about—rather than simply consume—the information presented to them and empowers people to engage in data exploration in their own pace and manner (Heer and Shneiderman, 2012; Murray, 2013; Tufte, 2001). All the while, it is imperative to accurately represent the complexity of the underlying data and to make obvious any definitions, aggregation procedures, and simplifications.
The availability of modern technologies and software, such as the D3 library for javascript (Bostock et al., 2011), as well as large-language models for coding make building complex interactive visualizations a viable reporting format for an increasing number of researchers. However, thoughtless use of such tools poses the risk of overloading on functionality and information, thereby undoing the beneficial effect of interactive visualizations. This calls for a structured study of the benefits and pitfalls of narrative visualizations in RPPs, as well the proposition of some best practices.
In this paper, I share lessons learned from an effort to address the knowledge gap in an RPP focused on increasing opportunities for multilingual students to access high school mathematics courses required for college admission. This effort was based on the development of a narrative visualization intended to provide educators and school leaders with information on students' rates of completion of courses that are critical to becoming eligible for college admission, mathematics course trajectories, as well as course placement decisions.
First, I offer a conceptual framework on narrative visualizations and the liberatory design process. Then, after describing the RPP context in which the narrative visualization was developed, I discuss in detail the features of the visualizations developed and the rationale supporting their design. Finally, I provide a summary of the lessons learned as well as some suggestions for future research and design of visualizations as tools for effective communication in RPPs.
2 Conceptual framework
The development of the narrative visualization was informed by two important sets of concepts—graphical excellence and liberatory design. The former allows description and evaluation of the visualizations; the latter allows identification of the social goals those features should serve.
2.1 Graphical excellence
Tufte (2001) introduced the notion of graphical excellence, according to which well-designed graphics ought to “reveal” the data, to show it without any distortion, as space-efficiently and coherently as possible, in all its levels, and in such a way that the viewer is not distracted by factors of the production process (methods, graphic design, etc.). To accomplish this, the graphic display ought to have a clear purpose, be logically and methodologically integrated in its context, and encourage active engagement. “What is to be sought in designs for the display of information is the clear portrayal of complexity. Not the complication of the simple; rather the task of the designer is to give visual access to the subtle and the difficulty—that is, the revelation of the complex” (Tufte, 2001, p. 191).
Shneiderman's (1996, p. 336) “Visual Information-Seeking Mantra: overview first, zoom and filter, then details on demand” serves as a useful guideline to achieve graphical excellence, especially when dealing with audiences with different (levels of) knowledge and experience with data. The use of user-controlled drill-down allows different audiences to move past the overview and zone in on different questions at appropriate levels of the data through filter and zoom functionalities (Murray, 2013). The use of personas, the creation of “fictitious users to guide decision making regarding features, interactions, and aesthetics” (Lidwell et al., 2010, p. 182) helps visualization developers to appropriately understand and prioritize users' needs and behaviors.
Understanding user needs, in turn, influences the flexibility-usability trade-off, which states that an increase in flexibility requires additional features that increase complexity and thus decrease usability (Steinebach et al., 2009). High flexibility can be achieved through interactivity—the user's ability to directly manipulate the amount, granularity, and level of the data displayed in a visualization (Heer and Shneiderman, 2012). Interactivity has been found to increase trust and transparency in the data being presented, as the format allows for active investigation (Aisch, 2017) through “an iterative process of view creation, exploration, and refinement” (Heer and Shneiderman, 2012, p. 1). Combined with the selection of default views, interactivity can go hand in hand with the explicit presentation of and direction of attention to crucial information.
2.2 Liberatory design
This work is broadly grounded in the tradition of social design, which arose as a counterpoint to commercially motivated design practices and is characterized by “participatory approaches to researching, generating and realizing new ways to make change happen toward collective and social ends” (Armstrong et al., 2014, p. 15). Its origin is commonly traced back to Papanek (1971), who called for design (and designers) to be socially responsible, ecologically sound, economically viable, aesthetically pleasing, and technologically appropriate. According to this view, designers carry the moral and social responsibility of creating products that solve real problems, primarily for marginalized communities (Margolin and Margolin, 2002; Papanek, 1971).
More specifically, this work draws on the concept of liberatory design, a which was recently developed as a collaboration between the K12 Lab at the Stanford d.school and the National Equity Project. The framework was created in response to their experiences and need for a strong, action-oriented, and equity-focused design process for work in and with school districts. Liberatory design is a practice geared toward (i) creating the self-awareness necessary to help designers overcome behaviors and practices that perpetuate inequity; (ii) changing dynamics to include those with power to design and those affected; (iii) fostering agency and learning for all participants in the design process; and (iv) paving the way for collective liberation (Anaissie et al., 2021).
3 RPP context and setting
3.1 Multilingual students in the US education system
In the US education system, all students receive an English language proficiency designation (ELPD). The official term to describe multilingual students deemed not fully proficient in English is English learners (ELs). I, however, refer to students who grow up speaking more than one language as multilingual (a broader term including those who are bilingual), in order to explicitly denote their competency in more than one language (Callahan et al., 2021; Martínez, 2018). I use the term EL only when referring to students classified as such in comparison to students with other ELPDs.
Students classified as ELs make up about 10% of the K-12 student population in the US (21% in California, McFarland et al., 2018). They are required to undergo regular English proficiency testing; local education authorities are required to monitor their progress using a wide range of standardized assessments, not all of which are sufficiently valid and up to date (National Academices for Science, Engineering, and Medicine, 2017). Depending on their development from identification as ELs onward, students may be Reclassified as fully English-proficiency (RFEP) (U.S. Department of Education, 2017). The term long-term ELs (LTELs) refers to students who have not achieved RFEP status after more than 6 years (Menken et al., 2012; WestEd, 2016). Because 6 years exceeds the time an individual naturally takes to develop a second language through simple social interaction, the term LTEL was originally coined with the intent to point at the limitations of the US education system to properly support students classified as ELs.
Regardless of ELPD, multilingual students are minoritised, meaning they are regarded as speakers of a first language other than the most widely used and dominant language of their society and educational system (Solano-Flores and Li, 2013). This view implies a power imbalance, where those minoritised hold less power and hence have less representation in their societies. Multilinguals in the US face the circumstantial need to learn the majority language, in addition to their first language, and are, on average, more likely to belong to grow up in lower socioeconomic environments (Valdés and Figueroa, 1994; Wardhaugh, 2002). This combination constitutes a double-burden for multilinguals and their support systems and presents a challenge to school districts leadership and teachers who seek to support their students classified as ELs.
Multilingual students in the US primary and secondary education system have been widely shown to face barriers to educational opportunity and equitable outcomes (Robinson-Cimpian et al., 2016; Umansky, 2016b). Addressing these issues is challenging for educational practitioners, because the inequity is caused by a combination of factors, including categorical English proficiency classification, limited access to academic content, and linguistically biased assessment practices (see, e.g., Callahan and Shifrer, 2016; Solano-Flores, 2021). At the same time, studying these issues is challenging for educational researchers, due to their multi-faceted nature. This is, in part, because multilingualism is a heterogeneous phenomenon and often intersects with socio-economic status, which make it difficult to isolate consequences of multilingualism from broader structural forces (Baharav and Gerstein, 2019; Solano-Flores, 2016).
3.2 The Tri-District project
The Tri-District (3D) Project formed part of the Stanford-Sequoia K-12 Research Collaborative, a RPP between the Stanford Graduate School of Education and the Sequoia Union High School District and its feeder districts, overseen and managed by California Education Partners (California Education Partners, n.d.). Consistent with the goals of other RPPs focused on educational inequities afflicting multilingual students (see, e.g., Arce-Trigatti, 2019; McClain et al., 2021; Weddle et al., 2024), the 3D Project aimed at improving the sets of opportunities made available for multilingual students to access high school courses. Through an investigation of important problems of practice, researchers and district leaders worked together to improve the partner schools' capabilities of serving their students labeled as ELs. The central goals of the broader collaborative were to (i) understand ELs' school experiences, (ii) improve their academic outcomes and graduation rate, and (iii) ensure all students labeled as ELs are reclassified before entering 9th grade.
One of the project's main challenges was overcoming the knowledge gap: finding an efficient yet comprehensive way of communicating project findings to district leaders in such a way that they can be processed and implemented in the best possible fashion, though with the least possible additional effort for already strained district staff and teachers. Especially during the COVID-19 pandemic, district leaders and teachers faced many other practical and more urgent challenges, which made respecting their time commitments even more important (Coburn et al., 2021).
The 3D Project aimed to understand the course enrolment patterns and school experiences of students labeled as LTELs, as well as systemic factors that limit their meeting of the mathematics course requirements for college eligibility. Specific goals were to describe and evaluate (i) the different patterns of meeting the mathematics requirement for college admission, (ii) the mathematics course sequences taken by LTELs in comparison to their peers, and (iii) the practice of using summative assessment scores to make mathematics course placement decisions. Building on work done in the first 4 years of the project, the research zoned in on (LT)ELs' access to advanced mathematics course content, which was found to be a key hurdle to achieving college eligibility. To better understand the factors influencing mathematics course access, the research team investigated the course prerequisites and assessment practices relevant to students labeled as LTELs.
From the beginning, work in the 3D Project was not meant to stop after the production of an academic research report but to end once findings are easily accessible to all stakeholders and collaboration continued until real-world solutions were developed based on those findings. In other words, the goal was closing the knowledge transfer gap—that is, addressing the oft-lacking or slow transfer of knowledge into the realm of practice (Waeckerle et al., 1997). For the 3D Project, that meant ensuring ELs in the partner districts can directly and immediately benefit from the project findings.
Analyses drew on data from three school districts, one high school district and two of its feeder districts. The database contains ~30,000 students' basic demographics, ELPD, California Assessment of Student Performance and Progress (CAASPP) standardized scores, and their mathematics course-taking histories. Given that the 3D Project's work was explicitly focused on combined analyses of middle and high school data, analyses drew on the subset of students with records of either of the two partner primary districts for some time and records of the partner high school district (N = 7,727). However, the different analyses presented required additional inclusion criteria (discussed below).
The data showed considerable student fluctuation, both between partner primary school districts, as well to and from other districts, or out of the education system. Therefore, in both sample descriptions, I chose to assign students to one of the two partner primary school districts, based on the district they were part of in 8th grade. This mirrors the way in which both primary and high schools group students by district when evaluating students whom they “send off to” or “received from” the respective other district.
4 The narrative visualization
4.1 General structure
It is important to reiterate that most of the 3D Project's different analyses were carried out by our group of researchers over the last 5 years, already, as reported in past project reports (Solano-Flores et al., 2022, 2024; Solano-Flores and Valdés, 2020, 2021). Rather than (re-)conducting these analyses, the aim of the present project was to (i) integrate them into a meaningful whole and (ii) present them in a visualization-driven, accessible way. This required a structured comparison of past analyses to clearly determine overlaps and dissimilarities. To achieve that, I created a data “map”—a tabulation summarizing the methods (level of analysis, sample size, etc.), results (disaggregation levels, etc.), and outputs (charts, summary tables, etc.), which informed the development of the narrative visualization presented here.
I developed the narrative visualization for the purpose of facilitating communication of ongoing research progress and final research findings to district leadership and staff—in addition to traditional written annual reports. It comprises a set of visualizations—static ones, animated ones, and interactive ones—embedded in a written narrative drawn from the reports. Given data privacy requirements, the narrative visualization is not publicly listed and only accessible to RPP partners via a shared link and is currently hosted in an Observable notebook (Observable, Inc., n.d.).
The narrative begins with a broad bird's eye view situating the problem and providing the necessary context to those users less familiar with the problem and/or data. This is described below as Issue 1, the inequitable mathematics-related college eligibility rates. Following that, the tool takes a step-by-step approach toward exploring the causes—described as Issues 2 and 3, examining course trajectories and course placement practices, respectively.
4.2 Issue 1: comparing mathematics-related college eligibility rates
Not all students graduating from high school are automatically eligible to attend college, as high school graduation requirements are less strict than college admissions criteria [using University of California (UC) admissions criteria]. The UC admission requirements stipulate that students ought to have taken a minimum of “three years of college-preparatory mathematics that include the topics covered in elementary and advanced algebra and two- and three-dimensional geometry,” where each year needs to be completed with a grade C or higher (University of California, n.d., Mathematics section, para. 1). In our partner districts, this minimum requirement, for the most part, corresponded to the courses Algebra I, Geometry, and Algebra II, though other credit-bearing courses were permitted. Past work in this RPP and beyond has identified patterns of college eligibility rates with regard to ELPD. ELs, particularly LTELs, have statistically significantly lower rates of college eligibility compared to their English-only peers (see, e.g., Biernacki et al., 2023; Johnson, 2019).
In line with our district partners, I report mathematics-related college eligibility in three categories: ineligibility (insufficient number of mathematics courses passed with a C or higher); eligibility (passing only the required 3 years and courses outlined above with a C or higher); and competitive eligibility (passing the required 3 years and courses, as well as a recommended fourth year/course). Drawing on all students with complete (9th–12th grade) transcripts available (n = 4,012), I classified students as having achieved one of the three levels based on the number of total mathematics credits accumulated (regardless of which courses they took). Table 1 shows the proportions of students with different ELPDs at each eligibility level.
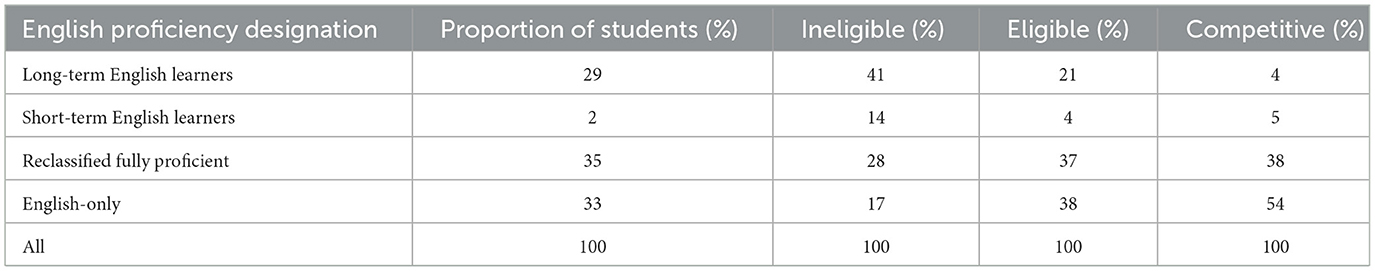
Table 1. Mathematics-related college eligibility by english language proficiency designation at the beginning of 9th grade (n = 4,012).
ELs in the partner high school district, and LTELs in particular, were much less likely to attain competitive college eligibility (also reported in Solano-Flores and Valdés, 2021). While only 29% of students entered 9th grade as LTELs, they made up 41% of those students who finished high school without meeting the UC mathematics requirements. In contrast, even though only a third of students in the partner districts were native English-speakers, they made up more than 50% of those with competitive eligibility.
In other words, the distribution of ELPDs in the ineligibility and competitive eligibility groups was not representative of the distribution of ELPDs in the sample. Students classified as ELs were over-represented in the ineligibility group and under-represented in the competitive eligibility group (see Biernacki et al., 2023 for a more in-depth analysis of the larger Collaborative's data). Though this analysis does not shed light on why this is the case, it serves as the starting point for the RPP's further analyses. It shows that findings of inequity elsewhere hold true locally, too, and warrant further investigation.
The corresponding section in the narrative visualization serves as a starting point and introduction to the overall narrative visualization. The visual depiction of this inequality sets the scene for the remainder of the document, and the RPP's overall research agenda. Figure 1 shows a screenshot of this animated visualization. The use of animation here serves to illustrate the temporal nature and highlights the different paths (toward college eligibility) students with different ELPDs followed.
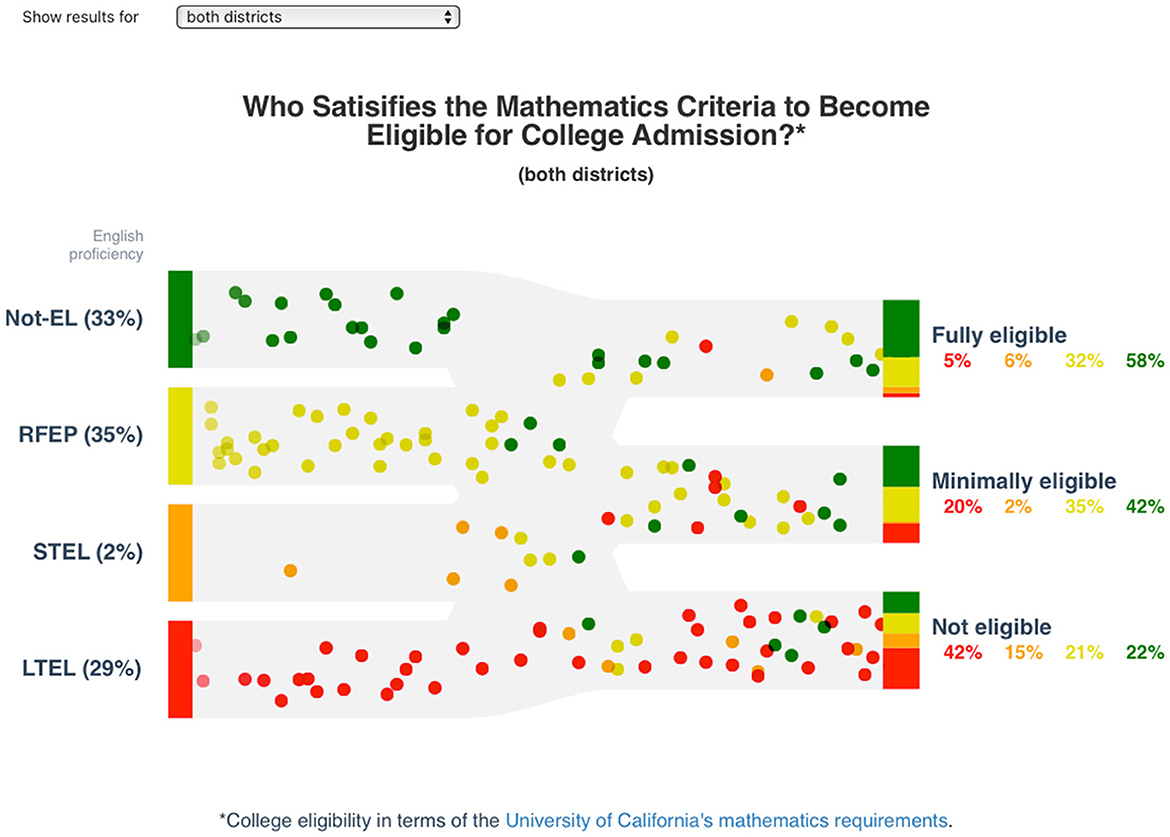
Figure 1. A screenshot of the visualization showing different rates of meeting the mathematics requirements for college eligibility by English language proficiency designation.
4.3 Issue 2: mathematics course trajectories
The findings described in Issue 1 raised questions about the causes of the unequal rates of meeting the mathematics requirements for college eligibility. Thus, we needed to understand whether the lack of sufficient mathematics credits is a function of (a) taking the required credit-bearing courses, but not meeting the minimum passing criteria, or (b) taking other, non-credit-bearing courses or repeating courses. Therefore, we next investigated course-taking trajectories—the sequences of mathematics courses taken in middle and high school to ascertain whether findings of tracking reported elsewhere (see, e.g., Callahan, 2005; Umansky, 2016a) occurred.
For inclusion in the course trajectories analyses, students had to have completed 6th to 8th grade in one of the feeder districts and the remainder of their schooling (9th to 12th grade) in the high school district (n = 3,718; hereafter the trajectories sub-sample). This criterion meant that data from students who transferred into or out of any of the relevant districts (or both) between 6th and 12th grade could not be included in this analysis. The varying course offerings between schools in the districts and the large number of observed course trajectories, as well as concurrent enrolments in more than one course resulted in a high degree of complexity (as illustrated in Altavilla et al., 2020).
Therefore, I undertook several simplifying steps. Such simplifications are warranted for three reasons. First, because the focus lies on the (timing or sequence of) completion of the common core courses Algebra I, Geometry, and Algebra II. Second, because variations within the trajectories leading to ineligibility or full eligibility are of secondary interest. Third, they result in a cleaner and more readable visualization.
To put the emphasis on those courses relevant to attaining the mathematics requirements (Algebra I, Geometry, Algebra II), I collapsed all courses below grade-level Math/Algebra I into groups within grade called Remedial Math (for 6th to 8th grade) or Readiness/Support (for 9th to 12th grade). Then, again within grade, I collapsed all courses ranked higher than Algebra II into an AP/Advanced category. For example, courses such as Business Math, which do not count toward the UC requirements, are recoded as Readiness/Support, while courses such as Trigonometry or AP Statistics were grouped together in the AP/Advanced category. Integrated Math was kept as a separate course even though it does not satisfy college eligibility criteria, because it is a credit-bearing course preparing students for Geometry.
Moreover, some students were enrolled for two sequential courses (e.g., Algebra I + Geometry) in the same school year—this can be the case if one of them was taken as an additional online or summer quarter course. Examples of frequently observed and likely double-enrolments are grade-level Math + Remedial Math, grade-level Math + Algebra I (as an elective) in primary school or Algebra I + Algebra I Support in high school. In cases where students were listed as enrolled in more than one mathematics course per year, I selected only the highest course.
Prior to these simplifications, we observed 1,913 unique mathematics course trajectories (6th to 12th grade) and still more than 431 different ones when restricting the analysis to the high school years (Altavilla et al., 2020; Biernacki et al., 2023). This illustrates the degree of complexity in this seemingly straightforward analysis. Even when simplified, many different trajectories remained, though they could be grouped in ways that aid interpretation.
Naturally, when grouping trajectories by whether or not they result in college eligibility, patterns described in Issue 1 re-appear. Additionally, we observed that, in any given academic year, students classified as ELs were more likely to (i) enroll in non-credit-bearing mathematics courses; (ii) repeat a course they had taken in a previous year; and/or (ii) not enroll in any mathematics courses, at all, in later high school years. Additionally, when grouping trajectories based on a specific enrolment pattern in a specific grade—such as by mathematics course taken in 9th grade—, differences between students with different ELPDs became most apparent.
Even those students classified as LTELs upon entry into high school who had taken grade-level mathematics courses with their peers were much more likely to be enrolled in readiness and support classes (as opposed to Algebra I) in 9th grade. Unless a student double-enrolled or completed summer courses, enrolment in such non-credit-bearing course in one of the 4 years of high school already prevented them from achieving competitive college eligibility. That is to say, placing students in pre-Algebra/remedial/support courses in early high school has severe downstream consequences in terms of meeting the mathematics requirements for college eligibility. This points to the need to investigate prerequisites, as well as practices and policies governing mathematics course placement (Biernacki et al., 2023; Solano-Flores et al., 2022).
The narrative visualization section on the trajectories analyses is centered around a sankey chart (Figure 2). Such “flowcharts” simultaneously show the (still many) trajectories remaining after the simplification steps outlined above. The visualization illustrates the plethora of observed (simplified) course trajectories for each ELPD group (ELPD fixed at the entry into high school). The width of each band along the first horizontal bar mirrors the ELPD distribution. At all subsequent horizontal bars, the width of each band indicates the number of students from that LPD band who took a certain mathematics course (see labels on chart). Bands become thinner toward the right side of the chart, as they denote unique combinations of courses tracked throughout the chart (from left to right).
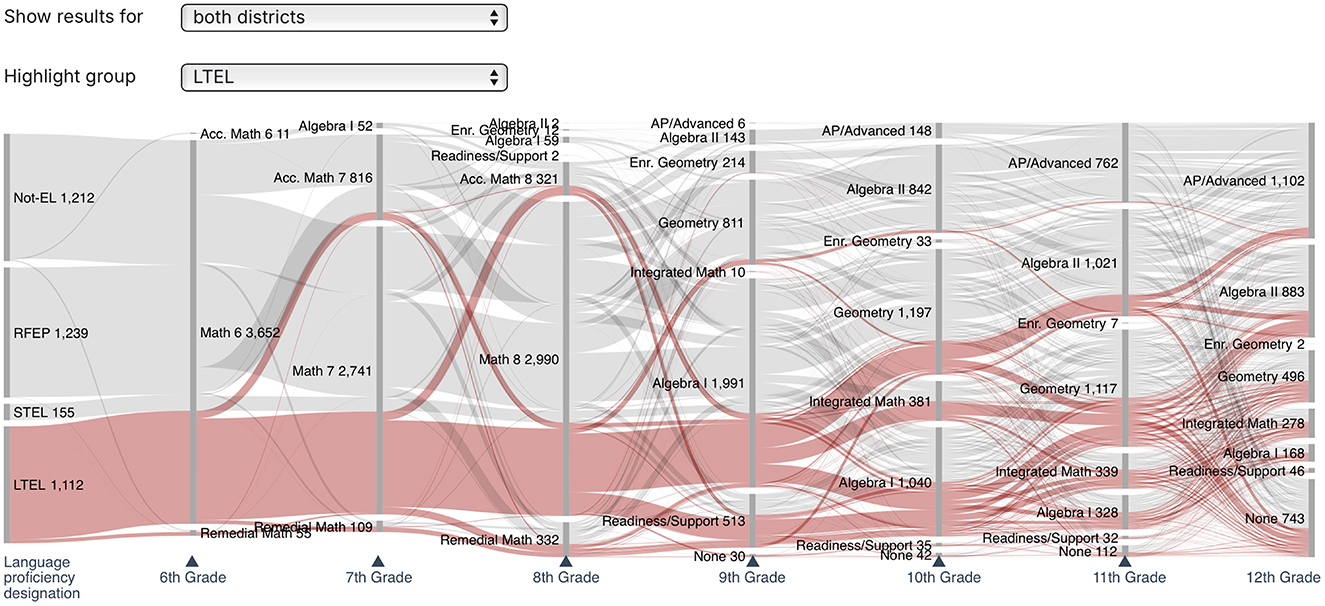
Figure 2. Screenshot of the sankey chart showing mathematics course trajectories from 6th to 12th grade with long-term English learner group highlighted.
To bring to the foreground the differences in course trajectories by ELPD, users can select to highlight a single group at a time, which is then shown in a different color. Courses are ranked hierarchically (with the highest-level courses at the top). Thereby, the visualization immediately shows how particular ELPD groups fare regarding course-taking at each grade level. The broader the highlighted band, the more students fall into that specific trajectory (i.e., taking a specific course in specific grade and sequence of courses). When taking a closer look, upon hovering over a specific band, district staff can view a tooltip showing both the trajectory taken (i.e., the sequence of courses up to the point of the cursor), as well as the band size, which corresponds to the number of students in the sample who followed this trajectory. Such interactivity allows for an easy focus on a given (highlighted) subgroup.
4.4 Issue 3: mathematics course placement decisions
Following from the observed differences in mathematics course trajectories along the lines of ELPD, particularly in 9th grade, we shifted the RPP focus toward investigating course placement policies and practices. When starting this investigation, the partner high-school district made course placement decisions based on students CAASPP scores in prior years (these were since changed in response to our RPP's work). Especially for placements in freshman year, they relied on these standardized assessment scores as a comparable measure available for all students, regardless of feeder district. This stage of the RPP was marked by the dynamic of both jointly investigating the reasons for the unequal college eligibility rates and researchers conveying caution against the (widespread) use of summative assessment scores for purposes they were not developed for.
To assess the utility of this CAASPP-based course placement policy, we investigated whether or not there were observed differences in the distribution of CAASPP scores for students who had passed a given mathematics course, in comparison to those who had not passed. By repeating these analyses separately for each ELPD, we were able to show patterns of differential utility based on English proficiency. Likewise, rather than focusing on freshman year, we broadened the focus of the analysis and described the extent to which students' middle school CAASPP scores were related to their passing of any high school mathematics courses.
For the descriptive analyses of the relationship between middle school CAASPP scores and high school mathematics success, students need not have finished high school yet. Thus, the sample contains 6th grade CAASPP data from cohorts who graduated in or after 20/21, 7th grade data from cohorts who graduated in or after 19/20, and 8th grade CAASPP data for cohorts who graduated in or after 18/19. For those who graduated earlier, no middle school CAASP scores are available. To increase the sample size for those comparisons looking at courses usually taken early in high school (e.g., Algebra I, typically taken in 9th grade, or Geometry, typically taken in 10th grade), I included data from students who had not yet graduated high school, but had taken at least one of the mathematics courses.
The CAASPP was first administered in the 2014/15 academic year, which restricted the sub-sample for this analysis to those students who had records of CAASPP scores for at least one of the middle school grades for them (n = 3,280; hereafter the CAASPP sub-sample). It is important to note here that this means that CAASPP score distributions in specific grades drew on significantly smaller numbers than the overall sub-sample size suggests. For these analyses, I worked with two definitions of passing a mathematics course: passing regardless of grade; and passing with a C or higher, as required to meet the college eligibility criteria. For each student and course, I created dummy variables indicating whether or not the student had ever taken and passed that course or taken and failed that course.
While other analyses undertaken as part of the project used logistic regressions to analyse the degree to which middle school CAASPP scores were predictive of subsequent passing of Algebra I/II (Solano-Flores et al., 2022), the focus here lay not on statistical comparisons, but on a descriptive analysis. Naturally, course placement decisions are made before course results are available, so a cut-off score was often chosen based on proficiency categories obtained from the standardized assessment or arbitrarily defined. And because placement policies changed frequently, little evaluation work of such policies was done.
Therefore, the narrative visualization first entertains the concept of a “useful” score cut-off: one that distinguishes between students who pass a given course and those who do not. For most courses, the distribution of CAASPP scores for students who ever took and passed that course almost completely overlapped with the distribution of those who never did. Put differently, there were students with very low middle school CAASPP scores that went on to successfully complete courses such as Algebra II, and there were also students with very high middle school CAASPP scores who never took or passed that course. The main takeaway is that, for reasons beyond the scope of this paper, CAASPP scores were not a suitable option to make mathematics course placement decisions.
The third set of visualizations (Figures 3–5) addresses the relationship challenges the utility of middle school CAASPP scores in determining high school mathematics course placements using a series of (overlapping) histograms. Given that some of the practitioners may not have interacted with this type of chart or the graphical representation of a cut-off score, I chose a scaffolded approach. The narrative visualization first shows a chart with an overall CAASPP score distributions filterable by district, ELPD group, graduation year, and CAASPP-year (Figure 3). This serves to familiarize the user with the type of chart, as well as with the filtering tools available. Then, after having illustrated the concept of a perfect cut-off score (in the form of two simulated distinct, non-overlapping distributions; Figure 4), the final visualization in this section depicts the score distributions for those who ever/never passed a user-selected mathematics course (Figure 5).
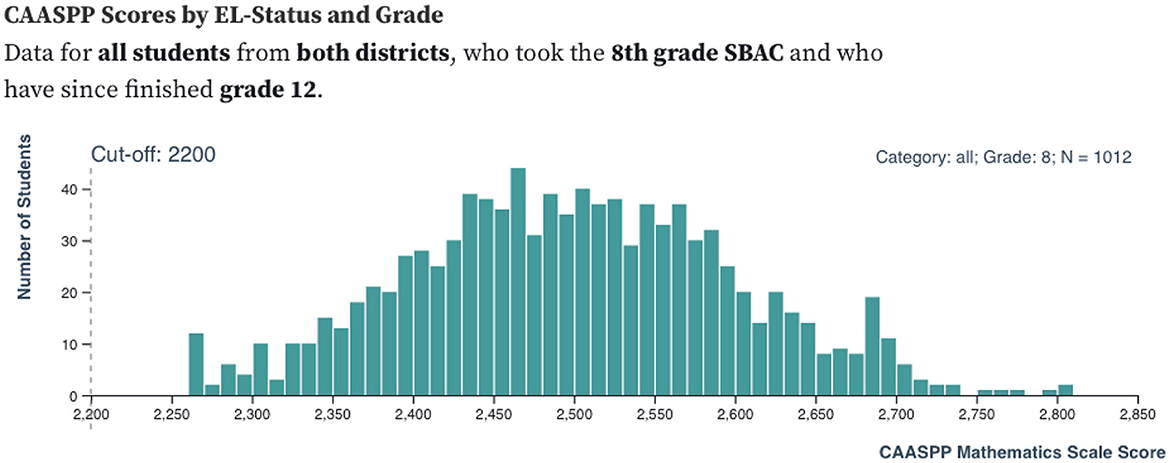
Figure 3. Screenshot of the histogram showing the overall CAASP score distribution for the purpose of familiarizing the user with the tool.
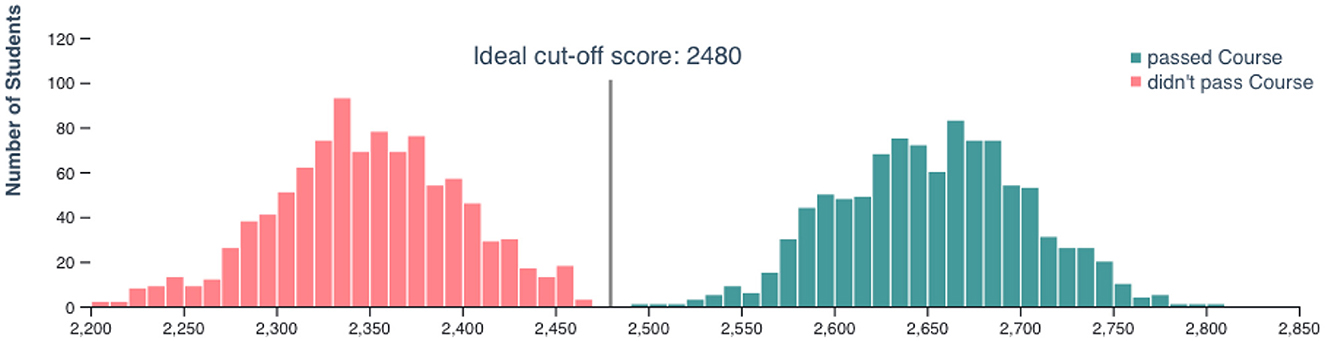
Figure 4. Screenshot of the set of histograms illustrating a (simulated) ideal cut-off score.
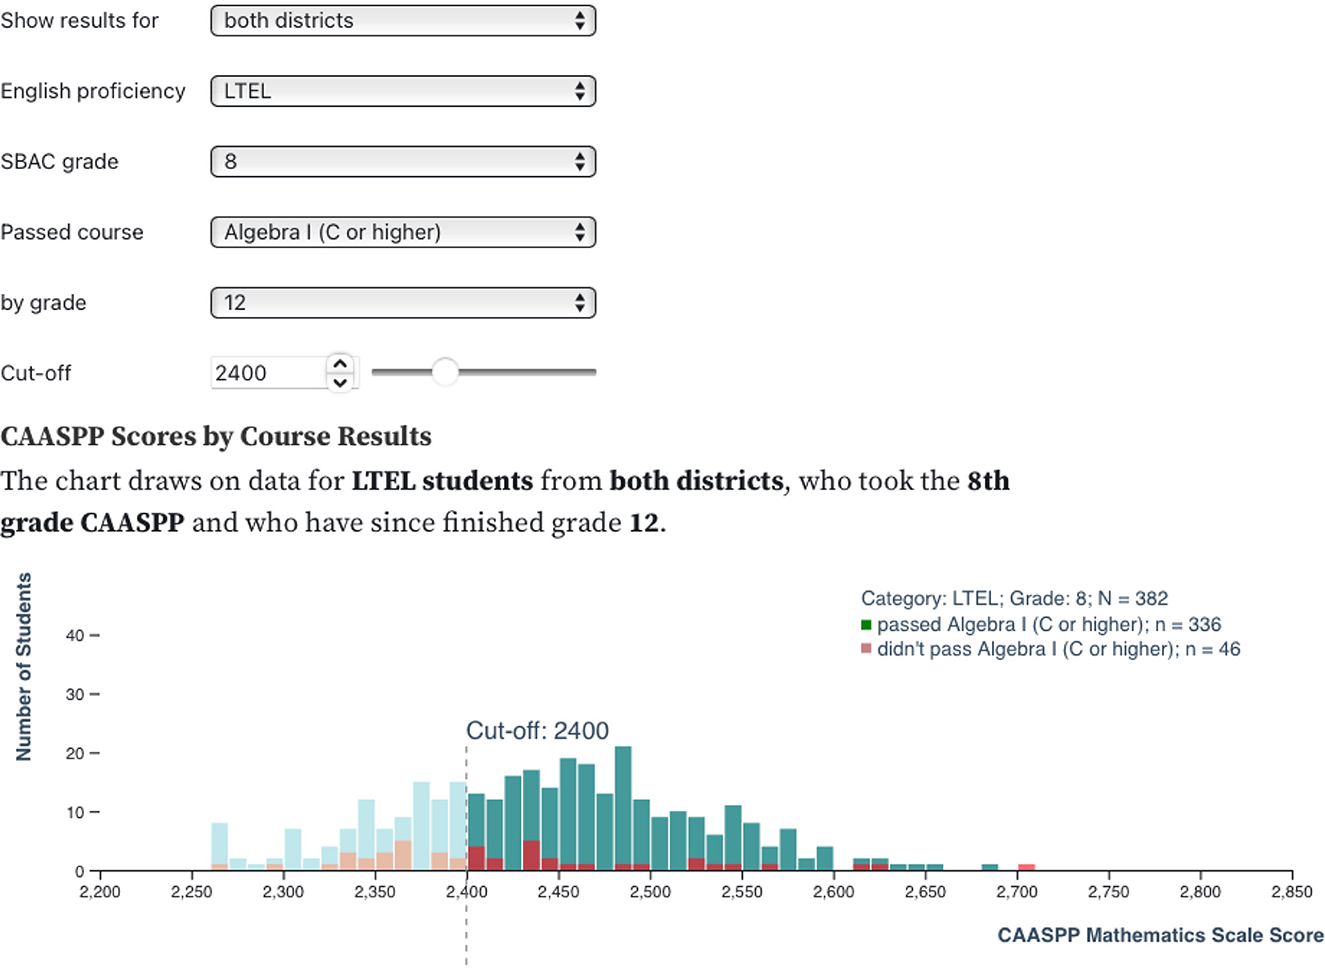
Figure 5. Screenshot of the overlaying histograms showing CAASP score distribution by course pass status and menu of user filtering options.
The CAASPP's discriminative power (or lack thereof) is illustrated through overlapping histograms of CAASPP scores from students who ever/never passed the selected course. Users can manipulate the various filters (district, ELPD group, graduation year, and CAASPP-year) and select from all available mathematics courses to self-explore the relationship between CAASPP scores and course-passing for their selected sub-group. The tool also provides inquiry-specific sample sizes to aid credibility judgements. Additionally, a draggable cut-off line allows the user to play around with different hypothetical cut-off scores or to recreate the effects of their placement policy. The chart then illustrates the effects of a hypothetical cut-off score through re-coloring the two distributions.
While earlier sections of the tool primarily serve to provide context, this section speaks directly to the project's research questions. It can be used in a standalone fashion, but also to emulate college eligibility levels by, for example, grouping students by whether or not they had passed Algebra II with a C or higher, to distinguishes between those with college ineligibility and (competitive) eligibility. With its many subsetting options, this set of visualizations allows for interactive knowledge exploration at the user's preferred pace (Murray, 2013; Tufte, 2006).
5 Discussion
The goal of this paper was to share lessons learned from the development of a narrative visualization intended to enable and facilitate communication, engagement, and knowledge exchange between the research staff and district leadership teams in an RPP and, ultimately, to tackle the complex challenge of achieving equitable outcomes for multilingual students. The analysis of this case study using a liberatory design conceptual frameworks yielded a number of takeaways that are likely to generalize to other RPPs.
5.1 Improving RPP engagement
In the present project, the liberatory design approach manifests in two primary ways. One is a stakeholder-led approach, where requirements and preferences regarding both analysis questions and the presentation of findings raised by practitioners from the partner districts play a central role. The participatory design process continues through the interactive elements in RPP communications, which facilitates practitioners' own hypothesis building and their informed contributions to the future RPP agenda.
Therefore, using appropriate communications tools as proposed in this paper are not only crucial to ensure efficient communication, but also to avoid inadvertent erroneous interpretation, which can potentially lead to adverse outcomes. Like in many other products and systems, the tool initially provided an inefficient combination of both flexibility and usability (Lidwell et al., 2010), though fast iterations within RPP meetings resulted in a focus on flexibility—an explicit ask from the partner district staff. That said, it is important to maintain absolute transparency and not censor findings, but always present them with the appropriate cautionary comment, qualifications, and context.
Especially in RPPs, well designed narrative visualization have the potential to form the foundation of the communications connecting the different stakeholders, while allowing each audience to manipulate them in response to their own expertise and interest. And, returning to the goal of providing accessible and actionable outputs: “[O]f all methods for analyzing and communicating statistical information, well-designed data graphics are usually the simplest and at the same time the most powerful” (Tufte, 2001, p. 10).
Importantly, while creating RPP reports as narrative visualizations requires more time and specialized programming skills on the side of the research team, compared to writing a conventional report, it has the potential to save time in later stages of RPP collaboration, such as meetings discussing in-progress research, as well as final reporting. Our case study has shown that the having the ability to quickly iterate between different views and subgroup analyses within a meeting between researchers and practitioner saved time and outweighed the initial development efforts of the tool. Despite the additional burdens in the era of COVID-19, using narrative visualizations helped us respect practitioners precious time, so that they were still able and willing to commit to our RPP work.
5.2 Increased agency for practice partners
Another benefit arises from the narrative visualisation's interactive nature. First, it has the potential to become a one-stop-shop for district partners to access new findings and to refresh their memory on past findings. Second, it allows district staff to explore ancillary and specific questions they might have in addition to the project's main research questions and the default views chosen by the researchers. Being able to zoom, filter, and drill-down on results allows them to engage with the data, as well as to develop and evaluate their own hypotheses (Heer and Shneiderman, 2012). Subsequent meetings between researchers and practitioners can then be guided by practitioners' prior explorations with the tool, making communication more efficient.
Exactly how useful and time-saving the narrative visualization will turn out to be remains to be determined in further investigations. However, in an informal preview session with representatives from the partner districts, the narrative visualization was met with great excitement for the full roll-out and elicited positive feedback. Two particularly welcome features of the interactive tool were (i) the possibility to alternate between different views (e.g., comparing different ELPDs or different cohorts) and (ii) the flexibility to explore the data beyond pre-select views and view CAASPP score distributions for scores from all available grades, for students with different ELPDs, and for different course pass statuses. Especially the latter was considered advantageous compared to written reports, where the research team would usually select a small number of views to illustrate a point, thereby glossing over information from other combinations of variables.
5.3 Limitations
One limitation to the adaptation of narrative visualizations as RPP reporting format is practical in nature. Creating such documents requires coding skills beyond those usually present in research teams. Moreover, it require a hosting infrastructure for the application. That said, there are many affordable and easy-to-use web-based tools available, such as the one used for this project, these are not necessarily within researchers' standard tool kit. Though this format of RPP reporting requires more time and specialized skills on the side of the research team in the initial phase of preparing the narrative visualization, it has the potential to save time in later stages of project work.
Another caveat is the fact that this project was realized in a mature (5-year) RPP and with the support from a broker. Therefore, research and practice partners had established a trusting relationship, were well acquainted with each other and each others' ways of working and communicating, and could rely on the broker to facilitate the collaboration process whenever needed. In newer and non-brokered RPPs, time, resources, and stakeholder buy-in are likely less available. Nonetheless, given the benefits of improved quality and efficiency of communication observed, using narrative visualizations as the mode of reporting in new RPPs might propel them forward much faster than they would develop otherwise.
Additionally, knowledge translation processes are context specific (Estabrooks et al., 2006). Therefore, future work needs to assess the generalizability of this work to other RPPs in the educational sector and beyond. Such work could start with adaptations of the products presented here and should then be extended to other formats and types of visualizations.
6 Conclusions
This paper showed how narrative visualizations were an effective way for our RPP to improve communication, practice partner agency, and researcher-practitioner engagement toward the collective goal of addressing inequitable high school outcomes for multilingual students. By analyzing our efforts through a liberatory design lens, I showed how the focus on equity design did not only improve engagement and collaboration between researchers and practitioners within the RPP, but also resulted in changes to the districts' practice resulting in more equity for multilingual students. This approach can serve as a blueprint for other RPPs to follow in their efforts to close the research-practice gap.
By illustrating complex phenomena visually and in a user-centric manner, well-developed narrative visualizations can make key points directly available to practitioners, hence saving them time in processing often unnecessarily complex research products, such as long written reports. By adhering to the design principles and making use of the visual communications strategies outlined above, narrative visualizations can transform research-practice communication from a unidirectional transfer of information to a collaborative knowledge-generation process. This is particularly pertinent when RPPs are formed to address challenging and complex issues, such as the issues of inequity faced by multilingual students.
Data availability statement
The data analyzed in this study is subject to the following licenses/restrictions. The existing datasets used in this article cannot be made publicly available due to privacy agreements reached with partner school districts. Requests to access these datasets should be directed to anVsaWFuLm0uc2llYmVydEBhbHVtbmkuc3RhbmZvcmQuZWR1.
Ethics statement
The studies involving humans were approved by Stanford University Research Compliance Office. The studies were conducted in accordance with the local legislation and institutional requirements. Written informed consent for participation was not required from the participants or the participants' legal guardians/next of kin in accordance with the national legislation and institutional requirements.
Author contributions
JS: Conceptualization, Investigation, Methodology, Resources, Software, Visualization, Writing – original draft, Writing – review & editing.
Funding
The author(s) declare that financial support was received for the research and/or publication of this article. This investigation was funded by the Stanford-Sequoia K-12 Research Collaborative through the Tri-District Project.
Acknowledgments
The author thanks the funding organisation for its support; the superintendents, teachers, and administrators in the partner school districts for their input and comments on earlier versions of the narrative visualization tool; Laura Wentworth, Michelle Neyfack, and Diana Mercado-Garcia at California EdPartners for brokering the research-practice partnership reported here. The author thanks Guillermo Solano-Flores for his very helpful comments on earlier versions of this manuscript.
Conflict of interest
The author declares that the research was conducted in the absence of any commercial or financial relationships that could be construed as a potential conflict of interest.
Generative AI statement
The author(s) declare that no Gen AI was used in the creation of this manuscript.
Publisher's note
All claims expressed in this article are solely those of the authors and do not necessarily represent those of their affiliated organizations, or those of the publisher, the editors and the reviewers. Any product that may be evaluated in this article, or claim that may be made by its manufacturer, is not guaranteed or endorsed by the publisher.
References
Aisch, G. (2017). In Defense of Interactive Graphics. Available online at: https://www.vis4.net/blog/2017/03/in-defense-of-interactive-graphics/ (Accessed December 12, 2024).
Altavilla, J. M., Biernacki, P. J., Solano-Flores, G., Valdés, G., and Fontana, R. M. G. (2020). Disentangling educational structural inequity: spanning tree of mathematics course-taking trajectories in a high school. Educ. Meas. Pract. 39:6.
Anaissie, T., Cary, V., Clifford, D., Malarkey, T., and Wise, S. (2021). Liberatory Design. Available online at: http://www.liberatorydesign.com (Accessed December 12, 2024).
Arce-Trigatti, P. (2019). Exploring english learners' time to proficiency through two research-practice partnerships. Natl. Netw. Educ. Res.-Pract. Partnersh. Extra 1, 2–5. doi: 10.1007/978-3-319-76694-2
Arce-Trigatti, P., Chukhray, I., and Turley, R. N. L. (2018). “Research-practice partnerships in education,” in Handbook of the Sociology of Education in the 21st Century, ed. B. Schneider (Cham: Springer), 561–579. doi: 10.1007/978-3-319-76694-2_25
Armstrong, L., Bailey, J., Julier, G., and Kimbell, L. (2014). Social Design Futures: HEI Research and the AHRC. Technical report. Brighton: University of Brighton.
Baharav, H., and Gerstein, A. (2019). Understanding English Learners and their Trajectories in the Nine Sequoia Collaborative Districts: Final Report. Technical report. Stanford, CA: Stanford Sequoia K-12 Research Collaborative.
Biernacki, P. J., Altavilla, J., Kanopka, K., Hsieh, H., and Solano-Flores, G. (2023). Long-term English learners' mathematics course trajectories: downstream consequences of early remediation on college preparation. Int. Multiling. Res. J. 17, 122–138. doi: 10.1080/19313152.2022.2137910
Bostock, M., Ogievetsky, V., and Heer, J. (2011). D3: data-driven documents. IEEE Trans. Vis. Comput. Graph. 17, 2301–2309. doi: 10.1109/TVCG.2011.185
California Education Partners (n.d.). Available online at: https://www.caedpartners.org/ (Accessed December 12, 2024).
Callahan, R. M. (2005). Tracking and high school English learners: limiting opportunity to learn. Am. Educ. Res. J. 42, 305–328. doi: 10.3102/00028312042002305
Callahan, R. M., Humphries, M., and Buontempo, J. (2021). Making meaning, doing math: high school English learners, student-led discussion, and math tracking. Int. Multilingu. Res. J. 15, 82–103. doi: 10.1080/19313152.2020.1778957
Callahan, R. M., and Shifrer, D. (2016). Equitable access for secondary english learner students. Educ. Adm. Q. 52, 463–496. doi: 10.1177/0013161X16648190
Canadian Institutes of Health Research (2016). Knowledge Translation. Canadian Institutes of Health Research. Available online at: https://cihr-irsc.gc.ca/e/documents/kt_lm_ktplan-en.pdf
Card, S. K., Mackinlay, J. D., and Schneiderman, B. (1999). “Information visualization,” in Readings in Information Visualization: Using Vision to Think, eds. S. K. Card, J. D. Mackinlay, and B. Schneiderman (San Francisco, CA: Morgan Kaufmann Publishers), 1–34.
Coburn, C. E., Penuel, W. R., and Farrell, C. C. (2021). Fostering educational improvement with research-practice partnerships. Phi Delta Kappan 102, 14–19. doi: 10.1177/00317217211007332
Coburn, C. E., Penuel, W. R., and Geil, K. E. (2013). Research-Practice Partnerships: A Strategy for Leveraging Research for Educational Improvement in School Districts. Technical report. New York, NY: William T. Grant Foundation.
Cooper, A., and Shewchuk, S. (2015). Knowledge brokers in education: how intermediary organizations are bridging the gap between research, policy and practice internationally. Educ. Policy Anal. Arch. 23:118. doi: 10.14507/epaa.v23.2355
Estabrooks, C. A., Thompson, D. S., Lovely, J. J. E., and Hofmeyer, A. (2006). A guide to knowledge translation theory. J. Contin. Educ. Health Prof. 26, 25–36. doi: 10.1002/chp.48
Farrell, C. C., Penuel, W. R., Allen, A., Anderson, E. R., Bohannon, A. X., Coburn, C. E., et al. (2022). Learning at the boundaries of research and practice: a framework for understanding research-practice partnerships. Educ. Res. 51, 197–208. doi: 10.3102/0013189X211069073
Farrell, C. C., Wentworth, L., and Nayfack, M. (2021). What are the conditions under which research-practice partnerships succeed? Phi Delta Kappan 102, 38–41. doi: 10.1177/00317217211007337
Hays, D. G., Bolin, T., and Chen, C. (2019). Closing the gap: fostering successful research-practice partnerships in counselor education. Couns. Educ. Superv. 58, 278–292. doi: 10.1002/ceas.12157
Heer, J., and Shneiderman, B. (2012). Interactive dynamics for visual analysis: a taxonomy of tools that support the fluent and flexible use of visualizations. ACM Queue 10, 1–26. doi: 10.1145/2133416.2146416
Johnson, A. (2019). The effects of English learner classification on high school graduation and college attendance. AERA Open 5:2332858419850801. doi: 10.1177/2332858419850801
Kothari, A., and Wathen, C. N. (2017). Integrated knowledge translation: digging deeper, moving forward. J. Epidemiol. Community Health 71:619. doi: 10.1136/jech-2016-208490
Lidwell, W., Holden, K., and Butler, J. (2010). Universal Principles of Design. Beverly, MA: Rockport.
Margolin, V., and Margolin, S. (2002). A social model of design: issues of practice and research. Des. Issues 18, 24–30. doi: 10.1162/074793602320827406
Martínez, R. A. (2018). Beyond the English learner label: recognizing the richness of bi/multilingual students' linguistic repertoires. Read. Teach. 71, 515–522. doi: 10.1002/trtr.1679
McClain, J. B., Oh, M. H., and Mancilla-Martinez, J. (2021). Questioning the monolingual norm with conceptually scored bilingual vocabulary assessments: findings from a research-practice partnership. TESOL J. 12:e585. doi: 10.1002/tesj.585
McFarland, J., Hussar, B., Wang, X., Zhang, J., Wang, K., Rathbun, A., et al. (2018). The Condition of Education 2018. Technical report. Washington, DC: National Center for Education Statistics.
Menken, K., Kleyn, T., and Chae, N. (2012). Spotlight on “long-term english language learners”: characteristics and prior schooling experiences of an invisible population. Int. Multiling. Res. J. 6, 121–142. doi: 10.1080/19313152.2012.665822
National Academices for Science Engineering, and Medicine. (2017). Promoting the Educational Success of Children and Youth Learning English. Washington, DC: The National Academies Press. doi: 10.17226/24677
Observable, Inc. (n.d.). Observable Notebooks. Available online at: https://observablehq.com/platform/notebooks (Accessed December 12, 2024).
Papanek, V. (1971). Design for the Real World; Human Ecology and Social Change. New York, NY: Bantam Books.
Penuel, W. R., and Hill, H. C. (2019). Building a knowledge base on research-practice partnerships: introduction to the special topic collection. AERA Open 5:2332858419891950. doi: 10.1177/2332858419891950
Penuel, W. R., Riedy, R., Barber, M. S., Peurach, D. J. LeBouef, W. A., and Clark, T. (2020). Principles of collaborative education research with stakeholders: toward requirements for a new research and development infrastructure. Rev. Educ. Res. 90, 627–674. doi: 10.3102/0034654320938126
Robinson-Cimpian, J. P., Thompson, K. D., and Umansky, I. M. (2016). Research and policy considerations for english learner equity. Policy Insights Behav. Brain. Sci. 3, 129–137. doi: 10.1177/2372732215623553
Segel, E., and Heer, J. (2010). Narrative visualization: telling stories with data. IEEE Trans. Vis. Comput. Graph. 16, 1139–1148. doi: 10.1109/TVCG.2010.179
Shneiderman, B. (1996). “The eyes have it: a task by data type taxonomy for information visualizations,” in Proceedings 1996 IEEE Symposium on Visual Languages (Boulder, CO: IEEE), 336–343. doi: 10.1109/VL.1996.545307
Solano-Flores, G. (2016). Assessing English Language Learners: Theory and Practice. London: Routledge. doi: 10.4324/9780203521953
Solano-Flores, G. (2021). Boolean analysis of interobserver agreement: formal and functional evidence sampling in complex coding endeavors. Educ. Meas. Issues Pract. 40, 26–36. doi: 10.1111/emip.12409
Solano-Flores, G., Hsieh, H., and Siebert, J. M. (2024). Learning English, Learning in English, and Learning About English: Year 2 Report Submitted to the Sequoia Union High School District. Technical report. Stanford, CA: Stanford University, Graduate School of Education & Stanford-Sequoia K-12 Research Collaborative.
Solano-Flores, G., and Li, M. (2013). Generalizability theory and the fair and valid assessment of linguistic minorities. Educ. Res. Eval. 19, 245–263. doi: 10.1080/13803611.2013.767632
Solano-Flores, G., Martínez, R. A., Biernacki, P. J., Hsieh, H., Nalbandyan, R., Siebert, J. M., et al. (2022). Comprehensive Analysis of Systemic Practices and Individual Critical Events in Mathematics Instruction and Assessment of English Learners. Year 5 (2021-2022) Report. Technical report. Stanford, CA: Stanford University, Graduate School of Education & Stanford-Sequoia K-12 Research Collaborative.
Solano-Flores, G., and Valdés, G. (2020). Long Term English Language Learners (LTELs): Policy and Practice Implications of a New Category. Year 3 (2019-2020) Report: Cohort Analysis and Case Studies. Technical report. Stanford, CA: Graduate School of Education, Stanford University.
Solano-Flores, G., and Valdés, G. (2021). Systemic Practices and Individual Critical Events in Elementary and Middle School Mathematics Instruction and Assessment for English Learners: Year 4 Report. Technical report. Stanford, CA: Stanford University, Graduate School of Education.
Steinebach, G., Guhathakurta, S., and Hagen, H. (2009). Visualizing Sustainable Planning. Berlin: Springer. doi: 10.1007/978-3-540-88203-9_1
Tufte, E. R. (2006). Beautiful Evidence. Cheshire, CT: Graphics Press, Canadian Institutes of Health Research.
U.S. Department of Education (2017). English Learner Toolkit for State and Local Education Agencies. U.S. Department of Education. Available online at: https://www.readcube.com/library/e74ac823-82ef-4a96-bccf-2c3f2e9d5059:a51821ed-45ad-4aad-bb91-ba8461bcb6fc (Accessed December 12).
Umansky, I. M. (2016a). Leveled and exclusionary tracking. Am. Educ. Res. J. 53, 1792–1833. doi: 10.3102/0002831216675404
Umansky, I. M. (2016b). To be or not to be EL. Educ. Eval. Policy Anal. 38, 714–737. doi: 10.3102/0162373716664802
University of California (n.d.). Observable Notebooks. Available online at: https://admission.universityofcalifornia.edu/admission-requirements/freshman-requirements/subject-requirement-a-g.html (Accessed December 12, 2024).
Valdés, G., and Figueroa, R. A. (1994). Bilingualism and Testing: A Special Case of Bias. Norwood, NJ: Ablex.
Waeckerle, J. F., Cordell, W. H., Wyer, P., and Osborn, H. H. (1997). Evidence-based emergency medicine: integrating research into practice. Ann. Emerg. Med. 30, 626–628. doi: 10.1016/S0196-0644(97)70081-7
Weddle, H., Hopkins, M., and Goldstein, H. (2024). How can research-practice partnerships advance multilingual learner equity? A case study of partnership with state-education-agency leaders. Peabody J. Educ. 99, 345–362. doi: 10.1080/0161956X.2024.2357036
Wentworth, L., Khanna, R., Nayfack, M., and Schwartz, D. (2021). Closing the Research-Practice Gap in Education. Stanford, CA: Stanford Social Innovation Review.
Keywords: narrative visualizations, research-practice partnerships, linguistic equity, multilingual students, liberatory design, graphical excellence
Citation: Siebert JM (2025) Closing the knowledge gap with narrative visualizations: lessons from a research-practice partnership promoting multilingual students' academic success. Front. Educ. 10:1632345. doi: 10.3389/feduc.2025.1632345
Received: 21 May 2025; Accepted: 03 July 2025;
Published: 01 August 2025.
Edited by:
Sereyrath Em, Suranaree University of Technology, ThailandReviewed by:
Rany Sam, National University of Battambang, CambodiaVânia Soares Barbosa, Universidade Federal do Piauí (UFPI), Brazil
Copyright © 2025 Siebert. This is an open-access article distributed under the terms of the Creative Commons Attribution License (CC BY). The use, distribution or reproduction in other forums is permitted, provided the original author(s) and the copyright owner(s) are credited and that the original publication in this journal is cited, in accordance with accepted academic practice. No use, distribution or reproduction is permitted which does not comply with these terms.
*Correspondence: Julian M. Siebert, anVsaWFuLm0uc2llYmVydEBhbHVtbmkuc3RhbmZvcmQuZWR1
†Present address: Julian M. Siebert, Department of Neurology, University of California, San Francisco, San Francisco, CA, United States
‡ORCID: Julian M. Siebert orcid.org/0000-0002-0472-4677