 Yuanyuan Wang
 Nina Xie
 Yujun Liu
- 1Department of Management and Strategy, Hong Kong Metropolitan University, Ho Man Tin, Hong Kong SAR, China
- 2Department of Management, Lingnan University, Tuen Mun, Hong Kong SAR, China
- 3Faculty of Businesingnan University, Tuen Mun, Hong Kong SAR, China
Introduction: Educators need real time evidence of how students process pre class quiz items in flipped courses, not just whether answers are right or wrong. We examined whether two classroom feasible eye tracking metrics—fixation intensity (total dwell time) and regression rate (proportion of backward saccades)—provide interpretable, item level signals of cognitive engagement once surface text features are taken into account.
Methods: Thirty four undergraduates completed 320 analysable attempts on 55 multiple choice items coded by Bloom’s taxonomy while a 60 Hz tracker recorded gaze. Crossed mixed effects models included a covariate for each item’s total word count. A logistic mixed model tested whether fixation intensity and regression rate predicted correctness beyond Bloom level, gender, and length. After each block, students reported perceived mental effort to compare subjective and gaze based indicators.
Results: After controlling for total word count, Bloom category did not uniquely predict fixation intensity or regression rate, suggesting that previously observed demand patterns largely reflected text length. In the accuracy model, fixation intensity showed a small, positive association with being correct, whereas regression rate showed a small, negative association.
Discussion: In authentic flipped class quizzes, fixation intensity and regression rate can serve as complementary, real time indicators of engagement, but only when item length and layout are standardised or statistically modelled. Claims about differences across Bloom levels should be made cautiously. We outline design guidance for future item banks—length matched stems, fixed numbers of options, and pre registered word count covariates—to enable firmer inferences and practical classroom diagnostics.
1 Introduction
Digital technologies have broadened when and where students learn, yet instructors still have limited access to real-time engagement evidence during pre-class work. In flipped courses, weekly formative multiple-choice (MC) quizzes help surface misconceptions before class, but right–wrong scores alone miss how items are processed. We examine whether economical eye-tracking can supply response-process evidence in this formative context. The flipped classroom is an educational methodology in which traditional lecture content is delivered outside of class, typically via pre-recorded videos or readings, while in-class time is dedicated to active, collaborative, and higher-order learning tasks (Zainuddin and Halili, 2016). It is not a prescriptive model but rather a flexible approach that can be adapted with various instructional activities, such as problem-solving, discussions, simulations, and quizzes. While our study uses quizzes as the primary pre-class activity, these are just one of many possible modalities in flipped pedagogy. Flipped designs seek to enhance learning and increase motivation by shifting exposition to pre-class assignments and allocating contact hours to higher-order tasks (Akçayır and Akçayır, 2018; Hew et al., 2021). Meta-analyses validate these advantages but caution that the benefits are most pronounced when educators can identify misconceptions promptly and modify classroom activities accordingly (Lundin et al., 2018). Conventional right–wrong quiz scores inform instructors about students’ correct responses but fail to capture their cognitive processing of items—an oversight that eye-tracking data can overcome by providing detailed insights into visual attention and engagement patterns, essential for delivering personalized feedback and adaptive learning sequences (Tehranchi et al., 2020).
While eye-tracking can index on-task processing in real time, routine classroom use hinges on pragmatic constraints—calibration, cost, and privacy. We therefore frame eye tracking here as a classroom-compatible research instrument whose outputs can inform design rules and, in the longer run, lightweight diagnostics. Following the eye–mind and immediacy assumptions (Just and Carpenter, 1976), fixations can reflect ongoing processing at the fixated location, and regressions can mark re-inspection; however, these links are context-dependent and sensitive to text features (Hyönä, 2010). We therefore use the term visual effort to denote gaze-based indicators—Fixation Intensity (FI) and Regression Rate (RR)—and reserve subjective mental effort for self-reports. Across domains, fixation-based metrics index intrinsic and extraneous cognitive load (Lai et al., 2013). These measures remain reliable at 60 Hz on affordable trackers (Beatty and Lucero-Wagoner, 2000) and can flag learners needing support before errors surface (Alemdag and Cagiltay, 2018). Yet few studies align gaze behavior with Bloom-coded demand or test whether item-specific effort predicts immediate success, leaving the effort–complexity link unsettled. We operationalize visual effort as fixation intensity and regression rate (i.e., effort inferred from eye movements).
In our setting, weekly pre-class multiple-choice quizzes were strictly formative—informing instruction and self-regulation rather than grades—within a flipped design that assigns lower-order processes to preparation and higher-order reasoning to class time (Krathwohl, 2002; Zainuddin and Halili, 2016). Prior findings on Bloom-aligned gaze demand are mixed. A key design risk is surface text: higher-order items are often more concise, so raw dwell time may confound conceptual demand with total word count across stem and options. We therefore model Total Word Count in all primary analyses and treat Bloom effects as interpretable only when surface features are standardized or statistically controlled (Özdemir and Tosun, 2025), while others observe no significant difference when controlling for stem length. These inconsistencies underscore a design quandary: higher-order items tend to be more concise in terms of text length, potentially conflating conceptual complexity with the amount of reading required for each item. This study examines whether visual effort correlates with conceptual difficulty in real classroom settings by categorizing remember/understand objects as low demand and apply/analyze item as high demand.
Grounded in engagement theory, we target cognitive engagement—the effort devoted to comprehension—which relates most strongly to achievement (Fredricks et al., 2019). We treat Fixation Intensity (longer dwell times) and Regression Rate (backward saccades/re-reading) as behavioral traces of that effort (van Gog and Jarodzka, 2013). Because subjective mental-effort ratings often diverge from objective process measures (Paas and Van Merriënboer, 1994), we examine their correspondence: convergence supports construct validity, whereas systematic gaps clarify what each metric captures under cognitive load theory and how to interpret them for classroom analytics. We distinguish (a) cognitive load as a theoretical construct; (b) gaze-based effort as objective, procss-level indicators derived from Fixation Intensity (FI) and Regression Rate (RR); and (c) self-reported mental effort as a block-level subjective rating. FI and RR are interpreted as load-sensitive rather than direct measures of intrinsic or extraneous load; their validity depends on task control (e.g., text length) and statistical adjustment (here, Total word count included as a covariate). In addition, women generally exhibit slightly longer fixations and more regressions, whereas men tend to scan faster at comparable accuracy. While these effects are overshadowed by skill disparities, incorporating gender as a covariate facilitates an exploratory examination.
Accordingly, we examine whether higher-order items elicit more visual effort when controlling for TotalWC; test whether Fixation Intensity (FI) and Regression Rate (RR) predict item-level success over and above Bloom level, gender, and TotalWC; quantify the alignment between gaze-based effort and block-level subjective effort; and explore baseline gender differences in speed/strategy.
Classroom eye-tracking on multiple-choice tasks remains largely descriptive. In a systematic review of 17 studies, Paskovske and Klizienė (2024) note that most work still correlates mean dwell time with achievement; reviews in STEM education echo the need for multilevel modeling to separate student from item variance. We address this by using crossed mixed-effects models that nest attempts within students and items (Barr et al., 2013), allowing us to test whether effort on a specific item predicts success on that item—rather than only unit-level aggregates. To our knowledge, this is among the first Bloom-aligned, mixed-effects analyses of gaze in routine flipped-class quizzes. Recent STEM work shows gaze patterns can reveal strategies and misconceptions, not just accuracy (Becker et al., 2023; Becker et al., 2022; Fehlinger et al., 2025).
We embedded economical eye-tracking in weekly flipped-quiz sessions: undergraduates answered Bloom-coded items while FI and RR were logged. We model (a) whether higher-order demand increases visual effort controlling TotalWC, (b) whether FI/RR add predictive value for item correctness beyond Bloom, gender, and TotalWC, (c) correspondence between gaze-based and subjective effort, and (d) baseline gender differences in speed/strategy. By pinpointing when FI and RR are valid and actionable signals, the study supplies instructors—and adaptive algorithms—with item-level evidence of visual effort vs. confusion, enabling targeted support without displacing in-class collaborative learning central to flipped pedagogy.
Advances in learning analytics make it feasible to pair real-time gaze data with AI to trigger just-in-time scaffolds (D’Mello et al., 2017). We treat AI-assisted use as a future pathway that depends on matched-length item banks, clear data-use policies, and replication across classes. In the present paper, eye tracking serves primarily to derive design guidance and to benchmark lighter proxies for eventual classroom diagnostics. At-scale use, however, hinges on affordable hardware, validated item banks, transparent data policies, and LMS integration.
2 Literature review
2.1 Transitioning from flipped classroom to process analytics
The flipped classroom is an educational methodology rather than a fixed model; early work emphasized affective benefits (e.g., satisfaction, attendance) and used online quizzes primarily for pre-class compliance checks (Akçayır and Akçayır, 2018). Meta-analyses now show medium achievement gains, conditional on tight alignment between pre-study work and in-class higher-order tasks (Hew et al., 2021; Lundin et al., 2018). Significantly, most outcome studies continue to depend on binary accuracy or final unit grades. Such product-centric metrics obscure how answers were produced. Neutrosophic cognitive diagnosis extends classical CDMs by representing knowledge, misconception, and uncertainty on the same scale, yielding richer profiles for adaptation (Ma H. et al., 2023). Unlike conventional models that classify student responses into simply correct or incorrect, neutrosophic cognitive diagnosis captures the degree of uncertainty in students’ knowledge states, thereby offering a more nuanced and diagnostically rich profile for adaptive interventions. This approach aligns with the broader movement toward fine-grained, process-aware analytics in education. Likewise, models predicting cognitive presence in MOOCs achieve 92.5% accuracy by analyzing discussion traces instead of relying on sparse clickstreams alone (Lee et al., 2022), while Gijsen et al. (2024) demonstrate that combining clickstream data with think-aloud protocols in video-based learning uncovers deeper processing patterns that binary metrics miss. Intelligent Tutoring System (ITS) diagnostic engines refer to automated systems that analyze learner interactions (e.g., responses, clickstreams, or gaze data) to infer knowledge states, misconceptions, or areas of struggle and then adapt instruction accordingly. ITS aims to provide timely, personalized feedback but are limited by the granularity and specificity of the available process data (Graesser et al., 2012). Its that depend solely on clickstreams or delayed self-reports falter in detecting misconceptions promptly and cannot direct limited instructional time to areas of greatest need.
Eye tracking is especially complementary to flipped education, as pre-class activities occur on-screen, making the integration of a low-cost tracker minimally burdensome. The emergence of AI-driven learning analytics has further raised the possibility of real-time, gaze-informed adaptations. Such systems can leverage eye-movement patterns—such as prolonged fixations or frequent regressions—to infer moments of struggle or disengagement, triggering tailored scaffolds before errors manifest (Alemdag and Cagiltay, 2018). However, transforming these research prototypes into robust, classroom-ready tools remains a non-trivial engineering and validation challenge. Real-time gaze traces reveal the specific components of a question stem that capture immediate attention, the systematic comparison of options, and the moments when a learner experiences a “stall” on a challenging segment. Pilot implementations within learning management systems have demonstrated that identifying the pattern “low fixation + high error” enables instructors to provide follow-up explanations more effectively (Alemdag and Cagiltay, 2018). Nonetheless, these proof-of-concept studies seldom correlate gaze behavior with Bloom-coded cognitive demand, nor do they associate process data with immediate in-class performance—two deficiencies that constrain both theoretical understanding and practical application.
Rectifying these inadequacies provides two advantages. Initially, trial-level gaze evidence enhances the response-process dimension of validity highlighted—but infrequently substantiated—in the Standards for Educational and Psychological Testing (American Educational Research Association, American Psychological Association, & National Council on Measurement in Education, 2014) and in contemporary digital assessment frameworks. Secondly, affluent process signals provide actionable inputs for AI-driven personalisation frameworks: recommendation systems can activate timely scaffolds, and predictive dashboards can identify students in need of human intervention. This study incorporates eye tracking into standard flipped-class quizzes and correlates gaze patterns with Bloom’s taxonomy, accuracy, and self-reported effort, advancing the development of a process-aware, AI-enhanced future.
The rise of process data analytics in education—fueled by advances in educational technology and artificial intelligence—now allows researchers and instructors to move beyond snapshots of achievement (scores, grades) to continuous, longitudinal analysis of learning behaviors (D’Mello et al., 2017). For example, AI-driven analytics can detect subtle patterns in eye movements, keystrokes, or physiological signals that precede errors or signal conceptual breakthroughs, enabling just-in-time scaffolding or adaptive task sequencing. However, the reliable implementation of such systems requires robust evidence for the validity and generalizability of process-based indicators, a focus of the present study.
2.2 Cognitive-engagement framework
Student engagement is widely conceptualized as a triad of behavioral, emotional, and cognitive dimensions (Fredricks et al., 2019). Cognitive engagement—the strategic and meta visual effort learners dedicate to comprehending and mastering content—exhibits the most consistent correlation with long-term success, surpassing both time-on-task and emotional enthusiasm (Lei et al., 2018). Cognitive engagement also refers to the depth of student involvement in learning tasks; mental effort denotes the subjective experience of cognitive exertion. Time-on-task has long been recognized as a robust indicator of engagement and learning success. In digital environments, efficient gaze allocation—such as longer fixations and fewer regressions—reflects focused visual effort, whereas fragmented or hesitant reading patterns may signal confusion or disengagement (Spichtig et al., 2017). Tracking these metrics enables a more nuanced understanding of how students allocate effort during formative assessments, beyond simple accuracy scoring. Flipped pedagogy is designed to enhance cognitive engagement: learners self-regulate during content preview and thereafter utilize contact hours to study, apply, or evaluate topics (Zainuddin and Halili, 2016). In this paper, we use “gaze-based effort” to denote FI and RR (objective, process-level), and “self-reported mental effort” to denote the block-level subjective ratings; “cognitive load” is treated as the broader theoretical construct.
Student engagement in flipped classrooms is often measured using retrospective self-report instruments, such as the Motivated Strategies for Learning Questionnaire (MSLQ; Pintrich, 2004), the Flipped Learning Student Engagement Scale (FLSES; Yan and Lv, 2023), or single-item post-activity questionnaires administered after the learning experience. However, these retrospective measures are vulnerable to recall bias and social desirability effects, which may lead students to overestimate or misremember their actual engagement (Fuller et al., 2018). In contrast, real-time process data—such as gaze patterns or interaction logs—offer a more immediate and objective window into cognitive engagement.
Self-report scales like the Student Engagement Instrument (SEI: Appleton et al., 2006) and Psychological State of Cognitive Presence Cognitive Engagement Scale (PSCP: Özek and Fer, 2025) have demonstrated strong validity and reliability in capturing sub-factors such as cognitive attention and effort. However, such retrospective measures correlate only modestly with process data (Han, 2023).
To overcome these limitations, researchers advocate integrating established frameworks and automated methods. The ICAP Model (Interactive, Constructive, Active, Passive; Chi and Wylie, 2014) increases the reliability of engagement measurement by providing a theoretically grounded framework that distinguishes qualitatively different levels of cognitive involvement. Higher ICAP modes (Interactive, Constructive) are consistently associated with deeper learning outcomes, supporting the use of process data to infer engagement quality rather than mere time-on-task (Xu et al., 2023), distinguishing quality beyond time-on-task. Advanced, Analytic, Automated (AAA) approaches further enrich measurement by inferring cognitive engagement from real-time behavioral and physiological signals—such as facial expressions, eye tracking, and clickstream data—offering fine-grained insights that self-reports miss (D’Mello et al., 2017). While these automated techniques require robust infrastructure and raise privacy considerations, their combination with self-report instruments and observational checklists yields the most comprehensive assessment of cognitive engagement in flipped classrooms (Barlow and Brown, 2020; Liu et al., 2022).
2.3 Eye-movement metrics as cognitive load proxies
Eye-tracking may serve as indirect, load-sensitive indicators of processing effort under specified task conditions (e.g., text length and layout controlled), rather than direct measures of intrinsic or extraneous load (Spichtig et al., 2017; Inhoff et al., 2019; Lai et al., 2013). However, these metrics should not be interpreted as direct or unambiguous measures of specific cognitive load components (e.g., intrinsic, extraneous), as fixation duration and regressions are influenced by multiple factors, including reading skill, task familiarity, and item complexity (Becker et al., 2022).
Fixation intensity and regression rate may serve as indirect, behaviorally observable indicators of visual effort under specific conditions, particularly when text complexity and task demands are carefully controlled. Accordingly, in our study FI/RR are interpreted as load-sensitive only after statistically controlling for Total word count (stem+options) at the attempt level and reporting item-level checks.
Fixation-based metrics provide a sensitive window on processing effort. Longer fixations and more regressions typically signal greater cognitive demand or lower reading efficiency; regressions, in particular, index comprehension difficulty and, in modeling studies, help predict individual differences in reading comprehension (Inhoff et al., 2019; Kim et al., 2022; Man and Harring, 2019). Proficiency contrasts are robust: efficient readers show shorter/ fewer fixations and fewer regressions, whereas struggling readers maintain elevated levels into high school (Spichtig et al., 2017). Beyond description, fixation counts and regression patterns have been used to estimate item-specific attention and difficulty, highlighting how process data discriminate effortless from effortful reading in ways outcome scores cannot (Man and Harring, 2019).
For classroom use, practicality matters. Pupillometry can index effort but typically requires ≥120 Hz to separate effort-related changes from light reflexes (Beatty and Lucero-Wagoner, 2000). By contrast, fixation intensity (FI) and regression rate (RR) are stable at 60 Hz, the sampling rate of economical trackers (van Gog and Jarodzka, 2013), so we focus on these signals here. FI reflects prolonged, high-resolution processing of stems and options—sometimes accompanying conceptual reorganization in expository text (Ma X. et al., 2023). RR captures strategic re-inspection when learners confront contradictions across representations (Abt et al., 2024). Although pupil diameter was recorded, it was not analyzed due to expected noise at 60 Hz. Embedding FI and RR in flipped-course quizzes yields time-stamped evidence of engagement that self-reports and clickstreams miss, enabling instructors—and adaptive algorithms—to identify confusion and deliver targeted, just-in-time support.
2.4 Bloom demand and item characteristics
Bloom’s new taxonomy categorizes cognitive activities in a continuum ranging from remembering to comprehending, applying, analysing, and ultimately producing (Krathwohl, 2002). Meta-analytic research suggests that flipped courses achieve the greatest professional competency improvements when classroom time is allocated to application and analysis rather than to rote memorisation (Lundin et al., 2018). The extent to which higher-order things provoke more visual effort remains ambiguous. A persistent risk is confounding conceptual demand with surface reading: higher-order items in MC banks are often shorter because they presume context, making raw dwell time uninterpretable unless length is controlled. Özdemir and Tosun (2025) observed prolonged fixation durations on analysis-level questions, but Abt et al. (2024) found no demand impact after adjusting for stem length, underscoring the risk of confounding conceptual complexity with textual superficiality. Research utilizing multiple-choice formats indicates that higher-Bloom stems are frequently intentionally concise, since they assume prior context, rendering raw dwell time an unreliable indicator until length is taken into account. This dichotomy mirrors flipped sequencing (pre-class fundamentals vs. in-class application/analysis).
To achieve a discernible contrast while maintaining statistical power, we categorize Bloom levels 1–2 (Remember, Understand) as low demand and levels 3–4 (Apply, Analyse) as high demand. This division reflects the instructional cadence of flipped classrooms—fundamentals before class versus in-depth exploration during class—and aligns with systematic evaluations categorizing levels 3–4 as “higher-order cognition” (Zainuddin and Halili, 2016). By examining whether gaze-based effort increases or unexpectedly decreases on these higher-order items, we directly investigate the prevalent notion that heightened load-sensitive indicators invariably results in prolonged fixation and increased regressions.
2.5 Gender as a exploratory moderator
Minor yet consistent sex differences in eye movement behavior can skew demand or accuracy estimates if not properly managed. Gabel et al. (2025) demonstrate that eye-tracking uncovers teachers’ implicit gender biases—pre-service teachers fixate more on female students in ways that mirror their IAT-measured attitudes—while Argunsah et al. (2025) reveal that female medical students exhibit stronger visual learning preferences and higher GPAs, suggesting gendered differences in attention and performance. Meta-analyses report small, task-dependent sex differences (women: slightly longer fixations/more regressions; men: faster scanning at comparable accuracy). Given our unbalanced cohort (≈ 76% female), Gender is treated as a covariate; all moderation is exploratory.
2.6 Development of research questions
Current learning analytics roadmaps emphasize the integration of multimodal, fine-grained process data—such as eye tracking, keystroke logging, and physiological sensors—to complement traditional outcome measures (D’Mello et al., 2017). These frameworks highlight a paradigm shift toward real-time, data-informed personalization in digital learning environments, where actionable insights are derived not only from what learners answer but also from how they engage, hesitate, or struggle during task performance. Guided by the preceding review, the present study addresses four interrelated questions concerning cognitive demand, visual engagement, performance, and learner characteristics.
2.6.1 Research questions (model-explicit)
We study trial-level relations among Bloom demand (High vs. Low), two gaze metrics—Fixation Intensity (zFI) and Regression Rate (zRR)—and Accuracy, while statistically controlling item text length with TotalWC_z (z-scored word count of stem+options). Gender is included as a covariate and all gender findings are exploratory. Grounded in the flipped-learning context and prior evidence that fixation duration and regressions can index processing effort under appropriate controls, we asked four questions:
2.6.1.1 Research question 1 – demand and gaze-based effort
Do higher-order items (Apply/Analyse) elicit greater visual effort than lower-order items (Remember/Understand) once item length is taken into account? Visual effort is operationalized by Fixation Intensity (FI)—total dwell time on stem + options—and Regression Rate (RR)—the proportion of backward saccades. This analysis will determine whether higher cognitive demand is reflected not only in eventual correctness but also in the moment-by-moment allocation of visual attention during task performance.
2.6.1.2 Research question 2 – gaze-based effort and performance
RQ2 (Gaze-based effort → performance). Do FI and RR, above and beyond Bloom demand and Total word count (stem + options), predict the probability of answering an item correctly? This approach helps disentangle the effects of genuine conceptual challenge from other item features (e.g., text length or surface layout).
2.6.1.3 Research question 3 – objective versus subjective load
RQ3 (Objective vs. subjective effort). To what extent do block-level self-reports of mental effort (SR_LOAD) align with objective, trial-level gaze indicators (FI, RR) and block accuracy? This approach allows us to compare fine-grained, moment-by-moment gaze data with learners’ retrospective, aggregate perceptions of effort for each block, highlighting the strengths and limitations of each measurement strategy.
2.6.1.4 Research question 4 – exploratory gender check
Do females and males differ in average FI or RR, and does gender moderate the relation between FI and success? Given the small and imbalanced subsample, all gender analyses are treated as exploratory.
These questions were addressed with crossed mixed-effects models at the attempt level (trials nested within both students and items). Length was modeled with a z-standardized TotalWC covariate; item-level word-count diagnostics are provided in the Supplement.
3 Method
3.1 Participants and ethical procedures
Forty-five undergraduate volunteers (29 women, 16 men; M age = 20.4 years, SD = 1.2) enrolled in an English-medium business-skills course (Organizational Behavior) at a research-intensive university took part in the eye-tracking study. After the data cleaning, we left 34 with analysable record. All participants were familiar with flipped classroom instruction through previous module experiences, but none had prior exposure to eye-tracking technology. Gender was included as a covariate primarily to control for known differences in eye-movement patterns, as prior research has shown that gender can influence fixation duration and regression rates. Due to our small sample size and unbalanced gender distribution, all findings related to gender should be interpreted as exploratory and hypothesis-generating rather than confirmatory. Participation was elective and rewarded with course credit plus shopping coupons (≈ US$15) if students completed at least three of the scheduled laboratory sessions. The institutional review board approved all procedures (Ref. 2023-EC134-2324). Students signed written consent that described data uses, anonymity safeguards, and their right to withdraw at any time without penalty. All data were de-identified at source and analysed only in aggregate, in accordance with the Standards for Educational and Psychological Testing (American Educational Research Association, American Psychological Association, & National Council on Measurement in Education, 2014).
3.2 Course context, session structure, and multiple-choice bank
This course is a second-year core module on organisational behavior delivered in a flipped format. Before each contact session, students studied a chapter in the McGraw-Hill Connect e-book, short screencasts, and self-check quizlets. During the 11-week laboratory phase that forms the present dataset, students attended weekly 30-min eye-tracking blocks scheduled immediately before the regular lesson. Each block comprised five Bloom-coded multiple-choice (MC) questions (one remembers, two understand, one apply, one analyse) drawn without replacement from an expert-reviewed bank of 55 items. The stems tested the chapter of the week; distractors targeted common misconceptions identified in earlier cohorts.
Two instructional designers first classified every item according to the revised Bloom taxonomy: inter-rater κ = 0.82 (96% agreement). To maximize statistical power in the mixed-models analysis, we later collapsed the four categories into Low-Demand (remember + understand) and High-Demand (apply + analyse). Power analysis was conducted prior to data collection using the variance components observed in a pilot sample. With a projected intraclass correlation coefficient (ICC) of approximately 0.20, the planned 320 item attempts were estimated to provide 80% power to detect medium fixed effects, given the observed intraclass correlation. This design deliberately maximized within-subject contrasts while recognizing the trade-off in generalisability due to a modest N for demographic subgroup comparisons.
3.3 Apparatus and area-of-interest (AOI) definition
Eye movements were recorded with a Tobii Pro Nano eye tracker (60 Hz; manufacturer-reported accuracy < 0.4°) mounted below a 14-inch laptop display (1,920 × 1,080 px). Each session began with a five-point calibration; data collection proceeded only when the average gaze-position error was ≤ 0.8°, otherwise calibration was repeated.
Items were presented in a fixed HTML layout. Using Tobii Pro Lab v1.204, we drew non-overlapping rectangular AOIs that were coextensive with each on-screen component: the stem and the five options (A–E). AOI coordinates were held constant across items. Fixations were attributed to the AOI entered at the first in-bounds sample; fixations that straddled boundaries were assigned to the recipient AOI at entry. Transitions between successive fixations located in different AOIs were logged to characterize navigation among question components (e.g., stem ↔ option back-tracking).
3.4 Event parsing
Fixations and saccades were parsed with Tobii Pro Lab’s dispersion-based algorithm (dispersion threshold = 30 px; minimum fixation duration = 60 ms). These settings are reported once here to avoid duplication elsewhere.
Item characteristics and text-length control.
Item word-counting and covariate. To disentangle conceptual demand from surface reading, we operationalized item length at three levels: StemWC (stem words), OptionsWC (sum across retained options), and TotalWC = StemWC + OptionsWC. Word counts were computed on the rendered HTML (whitespace-delimited tokens), then merged back to trial records. For modeling, TotalWC was z-standardized across attempts (TotalWC_z) and entered as a covariate in all primary models.
Item-level check. Because length is an item property, we compared per-item means (each QuestionID counted once) between Low- vs. High-Bloom items using Welch tests. Effects were small and not statistically significant at the item level; for transparency we report Low/High means, High–Low differences, and t (df), p in Supplementary Table S1. Given attempt-level differences and to be conservative, TotalWC_z is retained as a control in the primary mixed-effects analyses.
Pre-registration / power note. The planned ≥300 attempts with ICC ≈ 0.20 were expected (Monte-Carlo) to provide ~80% power to detect medium fixed effects (β ≈ 0.35 SD). Length control does not change this power calculation but reduces bias in the Bloom coefficient.
3.5 Self-report instruments
Immediately after each eye-tracking block, students completed a four-item, 5-point Likert checklist adapted from the NASA-TLX mental-effort dimension and the Paas and Van Merriënboer (1994) single-item scale:
“How much mental effort did you exert to understand the questions?”
“How difficult were the underlying concepts?”
“How complex were the questions?”
We adapted three block-level prompts (5-point Likert) from the NASA-TLX mental-effort dimension and Paas & Van Merriënboer’s single-item index. The self-reported cognitive-load index (SR_LOAD) is the mean of the three items (α = 0.86). We acknowledge that NASA-TLX does not separate intrinsic from extraneous load; our choice prioritized brevity and ecological validity during weekly labs. In line with reviewer guidance, we treat SR_LOAD as a coarse, block-level comparator to objective gaze signals rather than as a multidimensional load diagnostic; future work should add instruments such as the Cognitive Load Scale for load-type decomposition. Self-report ratings were collected at the block level to reduce participant burden and better reflect the overall visual effort required for each 5-item set, recognizing that this approach limits the per-item, fine-grained correspondence with gaze-based indicators but maintains ecological validity for classroom settings. While our self-reported cognitive load index (SR_LOAD) was adapted from established scales, it does not differentiate between intrinsic and extrinsic cognitive load, as do more recently developed instruments such as the Cognitive Load Scale. Future studies should incorporate these validated tools for finer-grained analysis of cognitive load types in educational settings.
3.6 Eye-movement metrics
We computed two load-sensitive gaze measures per attempt by summing across stem and options AOIs: Fixation Intensity (FI)—total dwell time (ms); and Regression Rate (RR)—the proportion of backward saccades relative to total saccades. To reduce leverage of extreme scan-paths, both metrics were winsorised at the 98th percentile, then z-standardized within participant (grand-mean = 0, SD = 1) to remove baseline speed differences. Saccade-velocity and pupil signals were exploratory and are not analysed due to known noise at 60 Hz.
Following prior work, we treat Fixation Intensity and Regression Rate as “load-sensitive” metrics: longer fixations often reflect deeper semantic processing or greater integrative demand, and more regressions tend to accompany ambiguity or inconsistency (Spichtig et al., 2017; Inhoff et al., 2019; Lai et al., 2013; van Gog and Jarodzka, 2013). These associations are context-dependent, influenced by text complexity, prior knowledge, reading skill, and task design (Becker et al., 2022; Becker et al., 2023). Notably, when items differ in length or layout—as in this study—Fixation Intensity may not cleanly index load-sensitive indicators. We therefore interpret these measures as indicators of processing effort when task characteristics are held constant, while cautioning that they are not direct, unambiguous measures of load-sensitive indicators. Their validity as proxies hinges on controlling extraneous factors and aligning use with the empirical contexts in which they were originally validated (e.g., Lai et al., 2013; Spichtig et al., 2017).
3.7 Data structure and analytic power
After excluding 12 trials with >30% data loss, the analytic file comprises 320 item attempts completed by 34 students across 55 items (median = 9 attempts per learner). The crossed structure yields most precision from the large number of level-1 observations. This structure is well suited for multilevel models, which gain precision primarily from the number of level-1 (item) observations rather than the number of level-2 (person) units (Barr et al., 2013).
Post-hoc power analysis (reported in Methods, Section 3.6) indicates that, with the observed intraclass correlation coefficient (ICC ≈ 0.20), this design provides >80% power to detect medium-sized fixed effects (β ≈ 0.35 SD, OR ≈ 1.4) for our primary gaze metrics. However, subgroup analyses (e.g., gender interactions) and detection of small effects remain underpowered, as expected with modest N. We therefore interpret all subgroup and interaction findings as exploratory and hypothesis-generating, not confirmatory.
3.8 Analysis plan
All predictors were grand-mean centered. Fixation Intensity (FI) and Regression Rate (RR) were winsorized at the 98th percentile and standardized within participant (zFI, zRR). TotalWC_z denotes the z-scored total word count of each item (stem + options) and was included as a covariate in all primary models.
RQ1: Demand → gaze-based effort. We estimated two linear mixed-effects models in which zFI and zRR were the dependent variables. Fixed effects were Bloom demand (High vs. Low; effects-coded ±0.5), Gender (male = 1), and TotalWC_z. Each model included crossed random intercepts for Student and Item to account for clustering of attempts within persons and questions.
RQ2: Gaze-based effort → success. Item-level correctness (0/1) was modeled with a binomial logit generalized linear mixed-effects model. Predictors were zFI, zRR, Bloom demand, Gender, and TotalWC_z, with crossed random intercepts for Student and Item. An exploratory zFI × Gender term tested moderation; given limited power, this interaction is interpreted cautiously while the main Gender effects are retained in the fixed-effects set.
RQ3: Objective vs. subjective load. Because self-reported mental effort (SR_LOAD) was collected at the block level, trial data were aggregated to Student × Block (mean zFI, mean zRR, and block accuracy). Associations were summarized with Pearson correlations and Fisher-transformed 95% confidence intervals for the pairs SR_LOAD × mean zFI, SR_LOAD × mean zRR, and SR_LOAD × accuracy.
Estimation and inference. Linear mixed models were fitted with lme4/lmerTest using REML = FALSE for comparability; denominator degrees of freedom followed the Satterthwaite approximation. The GLMM was estimated by Laplace approximation (optimizer bobyqa, maxfun = 2 × 10^5). For LMMs we report unstandardized coefficients (β), standard errors, 95% CIs, and random-effect variances; for the GLMM we report odds ratios with 95% Wald CIs in addition to variance components. Potential singular fits (near-zero random-effect variance) are flagged and interpreted with caution. Robustness was further evaluated via 2,000 non-parametric bootstraps on fixed-effect estimates.
Software and reproducibility. All analyses were conducted in R (version [fill in]; R Core Team), using the following packages: lme4 for mixed models (Bates et al., 2015), lmerTest for Satterthwaite degrees of freedom (Kuznetsova et al., 2017), dplyr for data manipulation (Wickham et al., 2023), and effsize for standardized mean-difference estimates. Exact package versions and the R session details are reported in Supplementary S5 (Computing environment). Replicable model formulas are given in Section 3.6; code to re-run the models is supplied in the Supplement.
Descriptive statistics for attempt-level zFI, zRR, and accuracy by Bloom level appear in Table 1. Item-level length characteristics and Welch tests are provided in Supplementary Table S1.
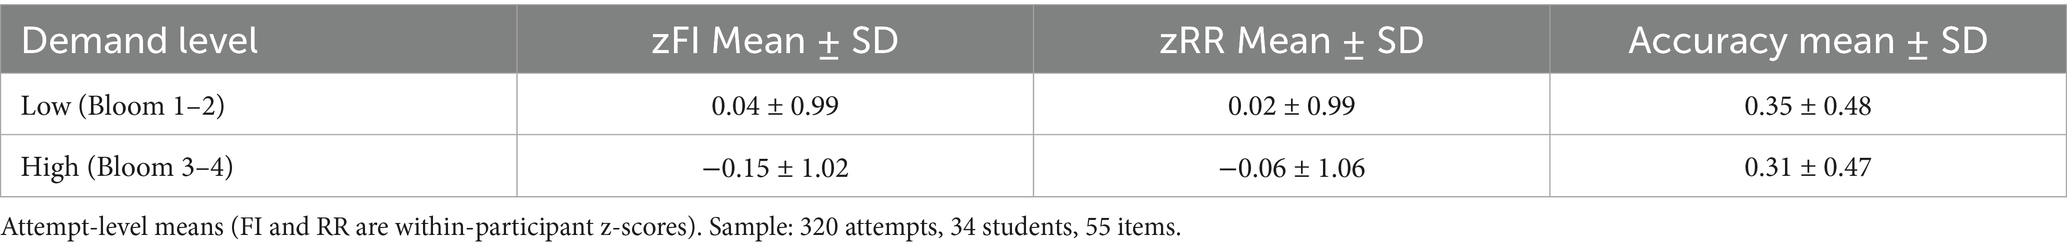
Table 1. Descriptive statistics by Bloom demand (attempt-level).
3.9 Rationale for the gender term
Small but systematic gender differences in reading and STEM eye-movements have been reported (e.g., slightly longer fixations and more regressions for females), potentially confounding demand effects (Zhan et al., 2020; Huang and Chen, 2016). Women typically show slightly longer fixations and more regressions, whereas men scan more quickly while achieving comparable accuracy. We therefore include Gender (male = 1) as a covariate in all primary models to absorb speed/strategy differences. Given the unbalanced sample (26F, 8 M) and Monte-Carlo power ≤5% for small interactions under our variance structure, all gender findings—including zFI × Gender—are labeled exploratory. Gender here is included primarily as a covariate to control for known speed-accuracy trade-offs.
4 Results
4.1 Portrait of the dataset
Students attempted 320 items (34 learners; 55 items). At the descriptive level (Table 1), higher-order items were answered slightly less often and received shorter fixation times (≈0.2 SD lower FI). RR and block-level SR_LOAD were very similar across Bloom levels. These patterns already suggest that text length may be driving dwell-time differences more than conceptual demand, motivating the inclusion of TotalWC in the primary models.
4.2 Research questions 1: Does demand alter gaze-based effort once length is controlled?
Two LMMs regressed zFI and zRR on Bloom demand (High vs. Low), Gender, and TotalWC_z, with crossed random intercepts for Student and Item. When FI and RR were modeled from Bloom demand with TotalWC and Gender as covariates (random intercepts for students and items), item length—not Bloom level—was the reliable predictor of FI. Longer/shorter items were associated with correspondingly lower/greater FI (TotalWC term, p = 0.004), and the nominal Bloom contrast no longer reached significance after this control. RR showed no detectable change by Bloom. Thus, in this authentic quiz bank, how much text students had to process mattered more for dwell time than whether the item targeted lower- or higher-order cognition. Full coefficients appear in Table 2.
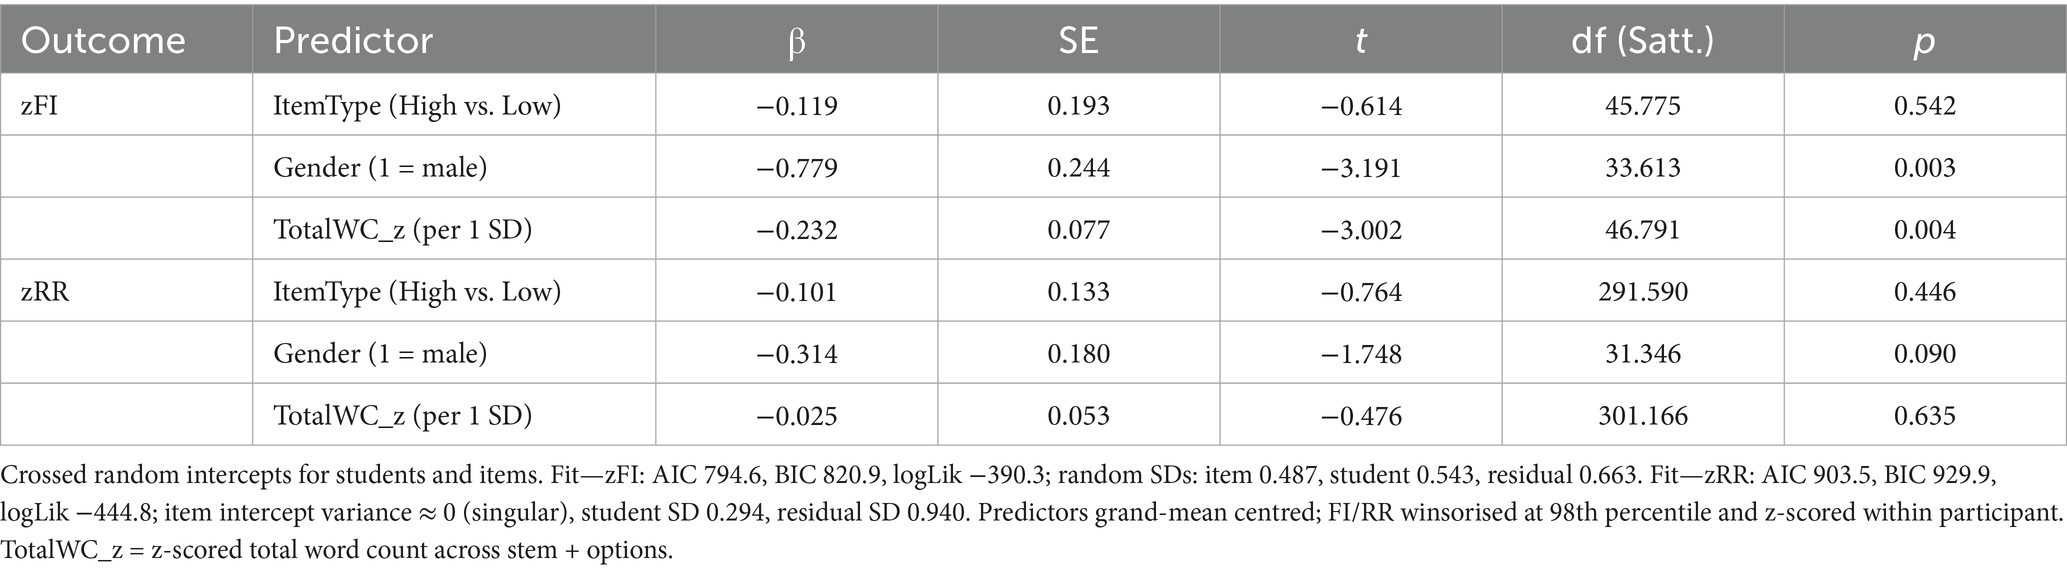
Table 2. Linear mixed-effects models for gaze metrics (zFI, zRR) controlling total word count.
A note on sensitivity: A stem-only specification (using StemWC in place of TotalWC) produced the expected positive association between stem length and FI and a small negative Bloom contrast, underlining that text-surface features can easily masquerade as “demand effects.” Details of this check are reported beneath Table 2.
4.3 Research questions 2: Do gaze metrics predict correctness?
A logistic GLMM with crossed random intercepts (Student, Item) predicted accuracy from FI, RR, Bloom demand, and gender (Table 3).
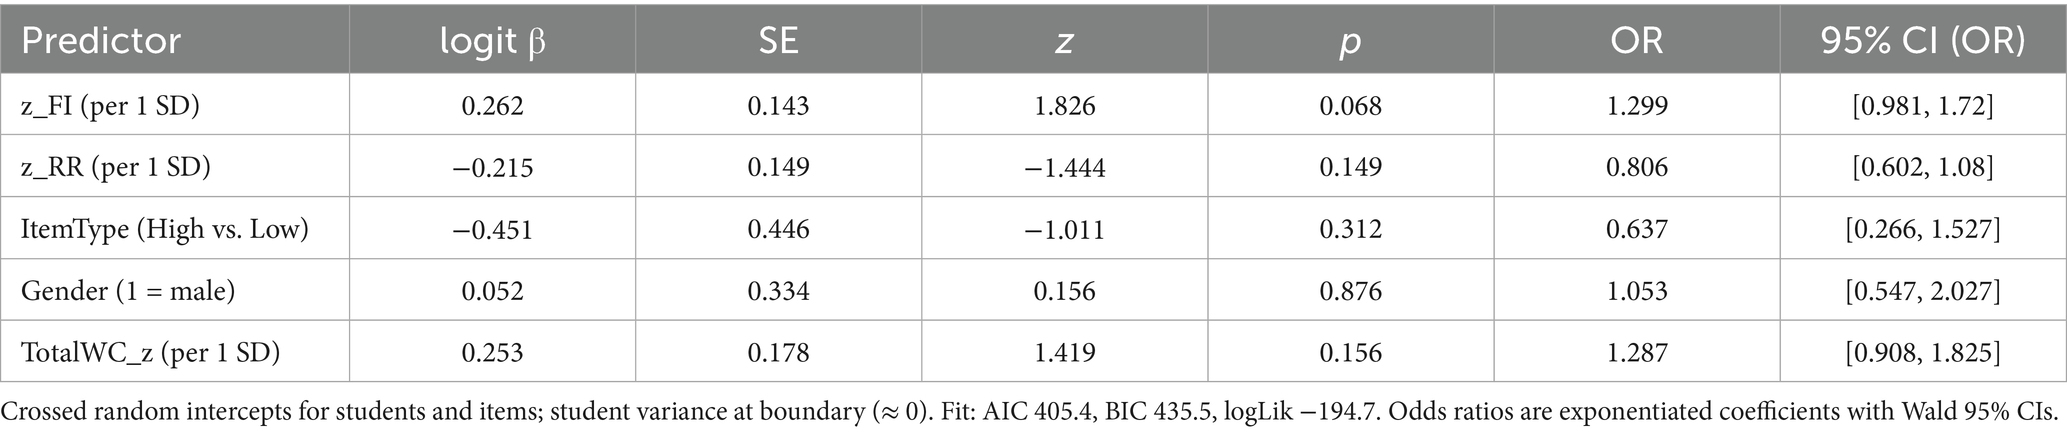
Table 3. Logistic GLMM predicting item accuracy.
A logistic GLMM (logit link) predicted Accuracy from zFI, zRR, Bloom demand, Gender, and TotalWC_z, with the same random-effects structure (Question random intercept retained; Student random intercept at boundary). The accuracy model (GLMM) indicated a clear tendency: items on which students fixated longer were more likely to be answered correctly (≈1.30 × odds per +1 SD FI), whereas more frequent regressions tended to accompany lower odds (≈0.81 × per +1 SD RR).
With this small sample these effects approached but did not meet conventional significance levels; nevertheless, effect sizes were educationally meaningful and consistent with theory. Bloom demand, gender, and length did not add unique predictive value once FI and RR were in the model. Notably, the student random intercept sat on the boundary while the item intercept was substantial, indicating that items varied more in difficulty than students varied in overall performance. See Table 3 for model summaries.
4.4 Research questions 3: How do objective and subjective load relate?
Block-level SR_LOAD showed near-zero correlations with mean FI, mean RR, and block accuracy; Fisher 95% CIs exclude even modest associations. In other words, the retrospective “how hard did that block feel?” rating did not track the micro-fluctuations captured by gaze. This reinforces the value of unobtrusive process signals for formative diagnostics. Supplementary correlation estimates appear in Supplementary Table S4.
4.5 Research questions 4: exploratory gender effects
Males exhibited shorter fixation times on average (faster processing) with no reliable difference in RR. Crucially, gender neither predicted accuracy nor changed the beneficial slope of FI. Given the small and imbalanced male subgroup, these observations are treated as controls rather than confirmatory findings. Relevant terms are reported alongside the fixed-effect tables.
4.6 Result summary
Contrary to the simple “harder → longer” expectation, higher-order items did not demand more dwell time once length was controlled. Instead, item length was the proximate driver of FI. Yet visual effort still mattered: longer fixation tended to help and frequent regressions tended to hinder success, pointing to two complementary process cues that conventional correctness scores miss. Paired with the divergence between self-reports and gaze, these results support the use of classroom-friendly eye-tracking as a response-process lens for flipped-class diagnostics, while also highlighting the necessity of length-matched item banks for clean causal interpretation. Tables 1–3 and Supplementary Tables (word-count checks; SR_LOAD correlations) document the underlying estimates.
5 Discussion
5.1 General discussion
This study adds response-process evidence to flipped-class assessment by showing that two simple gaze metrics—fixation intensity (FI) and regression rate (RR)—carry complementary instructional signals during authentic, pre-class MCQs. In our crossed mixed-effects models, longer dwell time tended to help (OR≈1.30 per SD), whereas frequent back-tracking tended to hurt (OR≈0.81), while block-level self-reports showed near-zero correspondence with either gaze metric. Equally important, the apparent “higher-Bloom ⇒ more time” intuition did not hold once surface text was considered: with total word count (stem+options) entered as a covariate, the Bloom–fixation association attenuated to non-significance, revealing a “harder-but-shorter” design pattern rather than a pure demand effect. Together, these findings reframe classroom eye tracking as measurement-aware diagnostics: FI and RR are informative when surface features are standardized or modeled, and they illuminate moment-to-moment engagement that correctness and retrospective ratings miss. The small gender speed difference we observed (men fixated less without an accuracy penalty) did not alter the fixation–performance link, suggesting that process-aware feedback rules can be applied equitably in similar cohorts.
Practically, the results point to a concrete design protocol for future item banks and for scalable analytics: (i) standardize total word count in narrow bands; (ii) equalize option lengths and hold the number of options fixed; (iii) pre-register TotalWC as a covariate in primary models; and (iv) replace block-level self-reports with brief, item-level, multidimensional load measures. Under these conditions, classroom-friendly 60 Hz trackers can provide response-process validity evidence and serve as a “gold reference” to benchmark lighter-weight proxies (e.g., response-time distributions, option-comparison sequences, click/keystroke traces, or privacy-preserving webcam gaze approximations). A conservative pathway—standardized bank → small-class pilots → multi-class validation—can move flipped-class diagnostics toward a practical balance of cost, usability, and validity, complementing (not displacing) human instruction.
5.2 Limitations
We note four limitations:
(1) Surface-text confound (interpretation risk).
The Bloom–fixation link vanished once TotalWC (stem + options) was controlled, and TotalWC negatively predicted Fixation Intensity (FI). High-Bloom stems were, on average, shorter, so the earlier “harder-but-shorter” pattern is best explained by text length rather than conceptual demand. Without balancing or adjusting for length/layout, gaze metrics may misrepresent difficulty. Future work should: (a) construct length-matched item pairs within Bloom levels or (b) statistically adjust for characters/words and layout complexity; (c) include a manipulation check to verify parity before analysis.
(2) Sampling and power (generalizability).
With 34 students and ~320 attempts, trial-level fixed effects were estimated with acceptable precision; however, subgroup contrasts (e.g., Gender × FI) were under-powered and should be treated as exploratory. Replications across courses and institutions—with larger, more balanced cohorts—are needed to confirm demographic patterns and strengthen external validity. In the present study, gender served primarily as a covariate to account for known speed–accuracy differences; all gender-related inferences remain hypothesis-generating.
(3) Self-report granularity (construct alignment).
Block-level self-reported effort (SR_LOAD) showed near-zero correlations with FI/RR, consistent with a level-of-analysis mismatch (block vs. item). To test convergent validity with process data, subsequent studies should collect item-level, multidimensional cognitive-load ratings (e.g., intrinsic vs. extraneous) and align their timing with each response. Where feasible, triangulate with brief, low-friction prompts embedded in the quiz flow.
(4) Signals and sampling (measurement scope).
The 60 Hz tracker was sufficient for aggregate FI and regression counts (RR) but too coarse for micro-saccades or fine-grained pupillometry. We therefore restrict inference to fixation- and regression-based indicators. Replicating with ≥120 Hz devices would test robustness when higher-frequency information is available. For richer load diagnostics, future work should add multimodal signals (e.g., luminance-corrected pupil dilation, electrodermal activity) to improve sensitivity while monitoring privacy and classroom burden.
5.3 Implications and design suggestions
The analytical strategy—including random intercepts for both students and items, and robust estimation of confidence intervals via bootstrapping—was specifically selected to address the data’s hierarchical structure and mitigate the limitations imposed by a modest participant sample. These choices align with current best practices for analyzing nested educational data with small to moderate samples (Snijders and Bosker, 2012).
This study shows that classroom-friendly eye tracking can yield actionable process signals during routine formative work. Scaling such use requires plug-and-play integration with LMSs, clear privacy/consent policies, and—most importantly—validated item banks so that adaptive algorithms respond to genuine cognitive demand rather than surface features. In near-term classroom practice, gaze can flag low-dwell/high-regression episodes for targeted scaffolds during pre-class study, while recognizing that reliable triggers require length-matched items or TotalWC-aware rules.
Because the Bloom–fixation association disappeared once TotalWC (stem + options) was controlled—and TotalWC negatively predicted fixation intensity—future banks should: (i) standardize TotalWC within narrow bands by Bloom level; (ii) equalize option lengths and fix the number of options; (iii) pre-register TotalWC (and layout features) as covariates; and (iv) replace block-level self-reports with item-level, multidimensional load prompts to separate intrinsic and extraneous load. Practically, gaze metrics remain useful when surface features are either balanced by design or explicitly modeled.
An economical 60 Hz tracker, or a high-resolution webcam with model-based gaze estimation is sufficient for fixation- and regression-based indicators. Embed the device in the pre-class quiz interface and stream two z-scored signals to an analytics microservice: dwell time and back-tracking frequency. Flag a potential struggle episode when dwell time falls >1 SD below a student’s baseline and regressions rise >1 SD above baseline. Trigger just-in-time scaffolds (e.g., “re-read stem,” concise glossary, or a worked example) before submission. In borderline cases (short dwell without excessive regressions), surface low-cost supports (definitions/examples) rather than full hints. For finer-grained pupillometry or micro-saccades, consider ≥120 Hz devices in future iterations.
Use these pipelines to strengthen response-process validity as outlined in the Standards for Educational and Psychological Testing: confirm that students attend to the intended elements of higher-order items. Pair the gaze assessments with per-item micro self-reports (single-tap confidence or perceived difficulty). Joint modeling of objective (gaze) and subjective (self-report) evidence will reveal which nudges (extra time, hints, recap videos) best close gaps between perceived and actual effort and will iteratively refine personalisation over semesters.
However, certain compliance and ethical expectations must be taken into considerations. Adopt data-minimisation, local processing where feasible, opt-in consent, and transparent learner dashboards. Provide instructor controls to disable interventions, export diagnostics, and review item-level balance checks. Before real-time, gaze-informed interventions are deployed at scale, invest first in high-quality, standardized item banks and a light-touch analytics layer that privileges measurement integrity over automation speed. Careful design and staged validation will prevent text-length artefacts from being misread as cognitive struggle and will make adaptive support both responsible and reliable.
5.4 Future research direction
Future work should implement parallel, length-matched forms at each Bloom level—equating word/character count, layout, and option length—and counterbalance presentation order across students. A preregistered analysis plan should include equivalence tests to determine whether Bloom effects remain negligible once TotalWC is controlled, alongside re-estimation of Fixation Intensity (R1) and Regression Rate (R2) using crossed mixed-effects models. Prospective power analyses should be calibrated for small effects and incorporate item- and student-level ICCs to ensure adequate precision for both fixed and random components.
To evaluate construct convergence at the appropriate grain size, block-level self-reports ought to be replaced with item-level, multidimensional prompts (e.g., intrinsic vs. extraneous load, single-tap confidence/difficulty). Analyses should prioritize within-person associations between R1/R2 and self-reports and use ROC and precision–recall curves to identify data-driven thresholds for flagging “struggle” episodes. Reporting convergent and discriminant validity will clarify what each metric uniquely captures and the conditions under which it is most informative.
Finally, the field needs evidence for causal impact. We recommend randomized A/B experiments or within-student micro-randomized trials in which hints, definitions, or worked examples are triggered by prespecified R1/R2 thresholds. Primary outcomes should include next-item accuracy, time-to-mastery, and delayed retention; secondary outcomes should track false-positive/negative rates and any latency costs to ensure that supports are beneficial and efficient. Decision rules (including stopping boundaries) should be preregistered to prevent analytical flexibility.
6 Conclusion
This exploratory study set out to recover what conventional flipped-class metrics miss: the moment-to-moment visual effort students expend while answering routine multiple-choice questions. Using a classroom-friendly 60 Hz eye tracker and crossed mixed-effects models, we found that fixation time and regression frequency behave as complementary process signals—longer dwell time tends to support success (OR ≈ 1.30 per +1 SD), whereas frequent back-tracking tends to undermine it (OR ≈ 0.81)—while block-level self-reports add little diagnostic value. Critically, once total word count across stem + options (TotalWC) is entered as a covariate, the high- vs. low-Bloom difference in fixation time attenuates to non-significance, indicating that the earlier “harder-but-shorter” pattern is largely a surface-text effect rather than a pure demand effect. Gender introduced a small speed difference but neither predicted accuracy nor moderated the fixation–performance link, supporting equitable interpretation of the gaze-performance association in this sample.
Taken together, these results reframe classroom eye tracking as a measurement-aware diagnostic: gaze metrics are informative when surface features are standardized or explicitly modeled. Practically, we recommend that future MCQ banks (i) standardize total word count in narrow bands, (ii) equalize option lengths and hold the number of options fixed, and (iii) pre-register TotalWC as a covariate in primary models. With these controls in place, fixation intensity and regression rate provide distinct, actionable cues (productive deep processing vs. struggle/inefficient re-inspection) for formative diagnostics. This positioning also clarifies the contribution of the present work: not a universal Bloom effect on gaze, but conditions under which gaze signals can be valid and useful for flipped-class assessment and for benchmarking affordable proxies (e.g., response-time distributions, option-comparison sequences).
A conservative next step is a “standardized bank → small-class pilots → multi-class validation” programme: replicate with length-matched, layout-matched items, expand to larger and more balanced cohorts, and test lightweight multimodal signals alongside item-level self-reports to confirm that the observed patterns are not artifacts of surface features or sampling noise. Even as a pilot, however, the workflow charts a feasible pathway from 60 Hz gaze capture to actionable diagnostics in flipped learning, advancing response-process validity without consuming class time and pointing toward AI-assisted personalisation that complements—rather than replaces—human teaching.
Data availability statement
The original contributions presented in the study are included in the article/Supplementary material, further inquiries can be directed to the corresponding authors.
Ethics statement
The studies involving humans were approved by Office of Research and Knowledge Transfer, Lingnan University. The studies were conducted in accordance with the local legislation and institutional requirements. The participants provided their written informed consent to participate in this study.
Author contributions
YW: Conceptualization, Data curation, Formal analysis, Funding acquisition, Methodology, Project administration, Supervision, Validation, Writing – original draft, Writing – review & editing. NX: Conceptualization, Data curation, Formal analysis, Funding acquisition, Investigation, Project administration, Resources, Supervision, Validation, Writing – original draft, Writing – review & editing. YL: Data curation, Formal analysis, Resources, Software, Visualization, Writing – review & editing.
Funding
The author(s) declare that financial support was received for the research and/or publication of this article. We gratefully acknowledge the support of the Teaching Development Grant from Lingnan University for the project titled “Navigating the Digital Learning Landscape with Eye-tracking: The Confluence of Flipped Classrooms and Experiential Education under OBATL.”
Conflict of interest
The authors declare that the research was conducted in the absence of any commercial or financial relationships that could be construed as a potential conflict of interest.
Generative AI statement
The authors declare that Gen AI was used in the creation of this manuscript. We used ChatGPT-4o (OpenAI, May 2025 release) for limited language polishing and brainstorming of wording; all content was subsequently fact-checked, edited, and approved by the human authors.
Any alternative text (alt text) provided alongside figures in this article has been generated by Frontiers with the support of artificial intelligence and reasonable efforts have been made to ensure accuracy, including review by the authors wherever possible. If you identify any issues, please contact us.
Publisher’s note
All claims expressed in this article are solely those of the authors and do not necessarily represent those of their affiliated organizations, or those of the publisher, the editors and the reviewers. Any product that may be evaluated in this article, or claim that may be made by its manufacturer, is not guaranteed or endorsed by the publisher.
Supplementary material
The Supplementary material for this article can be found online at: https://www.frontiersin.org/articles/10.3389/feduc.2025.1639273/full#supplementary-material
References
Abt, M., Leuders, T., Loibl, K., Strohmaier, A. R., Van Dooren, W., and Reinhold, F. (2024). How can eye-tracking data be used to understand cognitive processes when comparing data sets with box plots? Front. Educ. 9:1425663. doi: 10.3389/feduc.2024.1425663
Akçayır, G., and Akçayır, M. (2018). The flipped classroom: a review of its advantages and challenges. Comput. Educ. 126, 334–345. doi: 10.1016/j.compedu.2018.07.021
Alemdag, E., and Cagiltay, K. (2018). A systematic review of eye tracking research on multimedia learning. Comput. Educ. 125, 413–428. doi: 10.1016/j.compedu.2018.06.023
American Educational Research Association, American Psychological Association, & National Council on Measurement in Education (2014). Standards for educational and psychological testing. Washington, US: American Educational Research Association.
Appleton, J., Christenson, S., Kim, D., and Reschly, A. (2006). Measuring cognitive and psychological engagement: validation of the student engagement instrument. J. Sch. Psychol. 44, 427–445. doi: 10.1016/J.JSP.2006.04.002
Argunsah, H., Altıntaş, L., and Şahiner, M. (2025). Eye-tracking insights into cognitive strategies, learning styles, and academic outcomes of Turkish medicine students. BMC Med. Educ. 25:276. doi: 10.1186/s12909-025-06855-y
Barlow, A., and Brown, S. (2020). Correlations between modes of student cognitive engagement and instructional practices in undergraduate STEM courses. Int. J. STEM Educ. 7, 1–15. doi: 10.1186/s40594-020-00214-7
Barr, D. J., Levy, R., Scheepers, C., and Tily, H. J. (2013). Random effects structure for confirmatory hypothesis testing: keep it maximal. J. Mem. Lang. 68, 255–278. doi: 10.1016/j.jml.2012.11.001
Bates, D., Mächler, M., Bolker, B., and Walker, S. (2015). Fitting Linear Mixed-Effects Models Using lme4. J. Stat. Softw. 67, 1–48. doi: 10.18637/jss.v067.i01
Beatty, J., and Lucero-Wagoner, B. (2000). The pupillary system. In Handbook of psychophysiology. (eds.) J. T. Cacioppo, L. G. Tassinary, and G. G. Berntson, (Cambridge University Press), 2nd ed., pp. 142–162.
Becker, S., Knippertz, L., Ruzika, S., and Kuhn, J. (2023). Persistence, context, and visual strategy of graph understanding: gaze patterns reveal student difficulties in interpreting graphs. Phys. Rev. Phys. Educ. Res. 19:020142. doi: 10.1103/PhysRevPhysEducRes.19.020142
Becker, S., Küchemann, S., Klein, P., Lichtenberger, A., and Kuhn, J. (2022). Gaze patterns enhance response prediction: more than correct or incorrect. Phys. Rev. Phys. Educ. Res. 18:020107. doi: 10.1103/PhysRevPhysEducRes.18.020107
Chi, M., and Wylie, R. (2014). The ICAP framework: linking cognitive engagement to active learning outcomes. Educ. Psychol. 49, 219–243. doi: 10.1080/00461520.2014.965823
D’Mello, S., Dieterle, E., and Duckworth, A. (2017). Advanced, analytic, automated (AAA) measurement of engagement during learning. Educ. Psychol. 52, 104–123. doi: 10.1080/00461520.2017.1281747
Fehlinger, P., Becker-Genschow, S., and Watzka, B. (2025). Gaze behavior as a key to revealing strategies for identifying indirectly proportional graphs in thermodynamic and mathematical context. Phys. Rev. Phys. Educ. Res. 21:020129. doi: 10.1103/4pn3-fs4y
Fredricks, J. A., Hofkens, T. L., Wang, M.-T., Renninger, K. A., and Hidi, S. E. (2019). Addressing the challenge of measuring student engagement. In The Cambridge handbook of motivation and learning (pp. 689–712). Chapter, Cambridge: Cambridge University Press.
Fuller, K., Karunaratne, N., Naidu, S., Exintaris, B., Short, J., Wolcott, M., et al. (2018). Development of a self-report instrument for measuring in-class student engagement reveals that pretending to engage is a significant, unrecognized problem. PLoS One 13:e0205828. doi: 10.1371/journal.pone.0205828
Gabel, S., Alijagic, A., Keskin, Ö., and Gegenfurtner, A. (2025). Teacher gaze and attitudes toward student gender: evidence from eye tracking and implicit association tests. Soc. Psychol. Educ. 28:72. doi: 10.1007/s11218-025-10036-6
Gijsen, M., Catrysse, L., De Maeyer, S., and Gijbels, D. (2024). Mapping cognitive processes in video-based learning by combining trace and think-aloud data. Learn. Instr. 90:101851. doi: 10.1016/j.learninstruc.2023.101851
Graesser, A. C., Conley, M. W., and Olney, A. (2012). “Intelligent tutoring systems” in APA educational psychology handbook, Vol. 3. Application to learning and teaching. eds. K. R. Harris, S. Graham, T. Urdan, A. G. Bus, S. Major, and H. L. Swanson (Washington, DC: American Psychological Association), 451–473.
Han, F. (2023). Relations between students’ study approaches, perceptions of the learning environment, and academic achievement in flipped classroom learning: evidence from self-reported and process data. J. Educ. Comput. Res. 61, 1252–1274. doi: 10.1177/07356331231162823
Hew, K. F., Bai, S., Dawson, P., and Lo, C. K. (2021). Meta-analyses of flipped classroom studies: a review of methodology. Educ. Res. Rev. 33:100393. doi: 10.1016/j.edurev.2021.100393
Huang, P. S., and Chen, H. C. (2016). Gender differences in eye movements in solving text-and-diagram science problems. Int. J. Sci. Math. Educ. 14, 327–346. doi: 10.1007/s10763-015-9644-3
Hyönä, J. (2010). The use of eye movements in the study of multimedia learning. Learn. Instr. 20, 172–176. doi: 10.1016/j.learninstruc.2009.02.013
Inhoff, A., Kim, A., and Radach, R. (2019). Regressions during reading. Vision 3:35. doi: 10.3390/vision3030035
Just, M. A., and Carpenter, P. A. (1976). Eye fixations and cognitive processes. Cogn. Psychol. 8, 441–480. doi: 10.1016/0010-0285(76)90015-3
Kim, Y., Ademola, A., Ko, J., and Kim, H. (2022). Knuir at the ntcir-16 rcir: Predicting comprehension level using regression models based on eye-tracking metadata. Proceedings of the 16th NTCIR Conference on Evaluation of Information Access Technologies (NTCIR-16). Tokyo, Japan.
Krathwohl, D. R. (2002). A revision of bloom’s taxonomy: an overview. Theory Into Pract. 41, 212–218. doi: 10.1207/s15430421tip4104_2
Kuznetsova, A., Brockhoff, P. B., and Christensen, R. H. B. (2017). lmerTest Package: Tests in Linear Mixed Effects Models. J. Stat. Softw. 82, 1–26. doi: 10.18637/jss.v082.i13
Lai, M. L., Tsai, M. J., Yang, F. Y., Hsu, C. Y., Liu, T. C., Lee, S. W. Y., et al. (2013). A review of using eye-tracking technology in exploring learning from 2000 to 2012. Educ. Res. Rev. 10, 90–115. doi: 10.1016/j.edurev.2013.10.001
Lee, J., Soleimani, F., Hosmer, I. V. J., Soylu, M. Y., Finkelberg, R., and Chatterjee, S. (2022). Predicting cognitive presence in at-scale online learning: MOOC and for-credit online course environments. Online Learn. 26, 58–79. doi: 10.24059/olj.v26i1.3060
Lei, H., Cui, Y., and Zhou, W. (2018). Relationships between student engagement and academic achievement: a meta-analysis. Soc. Behav. Personal. 46, 517–528. doi: 10.2224/sbp.7054
Liu, S., Liu, S., Liu, Z., Peng, X., and Yang, Z. (2022). Automated detection of emotional and cognitive engagement in MOOC discussions to predict learning achievement. Comput. Educ. 181:104461. doi: 10.1016/j.compedu.2022.104461
Lundin, M., Bergviken Rensfeldt, A., Hillman, T., Lantz-Andersson, A., and Peterson, L. (2018). Higher education dominance and siloed knowledge: a systematic review of flipped classroom research. Int J Educ. Technol. Higher Educ. 15:20. doi: 10.1186/s41239-018-0101-6
Ma, H., Huang, Z., Tang, W., Zhu, H., Zhang, H., and Li, J. (2023). Predicting student performance in future exams via neutrosophic cognitive diagnosis in personalized E-learning environment. IEEE Trans. Learn. Technol. 16, 680–693. doi: 10.1109/TLT.2023.3240931
Ma, X., Liu, Y., Clariana, R., Gu, C., and Li, P. (2023). From eye movements to scan-path networks: a method for studying individual differences in expository text reading. Behav. Res. Methods 55, 730–750. doi: 10.3758/s13428-022-01842-3
Man, K., and Harring, J. (2019). Negative binomial models for visual fixation counts on test items. Educ. Psychol. Meas. 79, 617–635. doi: 10.1177/0013164418824148
Özdemir, Ş., and Tosun, C. (2025). Investigation of eighth-grade students’ processes of solving skill-based science questions by eye tracking technique. Educ. Inf. Technol. 30, 2237–2275. doi: 10.1007/s10639-024-12841-6
Özek, F., and Fer, S. (2025). Pscp cognitive engagement scale: a scale development study. Educ. Academic Res. 80–90. doi: 10.33418/education.1527281
Paas, F. G., and Van Merriënboer, J. J. (1994). Instructional control of cognitive load in the training of complex cognitive tasks. Educ. Psychol. Rev. 6, 351–371. doi: 10.1037/0022-0663.86.1.122
Paskovske, A., and Klizienė, I. (2024). Eye tracking technology on children’s mathematical education: systematic review. Front. Educ. 9:Article 1386487. doi: 10.3389/feduc.2024.1386487
Pintrich, P. R. (2004). A conceptual framework for assessing motivation and self-regulated learning. Educ. Psychol. Rev. 16, 385–407. doi: 10.1007/s10648-004-0006-x
Snijders, T. A. B., and Bosker, R. J. (2012). Multilevel analysis: An introduction to basic and advanced multilevel modeling. 2nd Edn. London: Sage Publications.
Spichtig, A. N., Pascoe, J. P., Ferrara, J. D., and Vorstius, C. (2017). A comparison of eye movement measures across Reading efficiency quartile groups in elementary, middle, and high school students in the U.S. J. Eye Mov. Res. 10. doi: 10.16910/jemr.10.4.5
Tehranchi, F., Ritter, F. E., and Chae, C. (2020). Visual attention during e-learning: eye-tracking shows that making salient areas more prominent helps learning in online tutors. Proceedings of the 42nd Annual Meeting of the Cognitive Science Society, 3165–3171
van Gog, T., and Jarodzka, H. (2013). “Eye tracking as a tool to study and enhance cognitive and metacognitive processes in computer-based learning environments” in International handbook of metacognition and learning technologies (pp. 143–156). eds. R. Azevedo and V. Aleven (New York, NY: Springer New York).
Wickham, H., François, R., Henry, L., Müller, K., and Vaughan, D. (2023). dplyr: A grammar of data manipulation (Version 1.1.2). https://dplyr.tidyverse.org
Xu, Q., Wei, Y., Gao, J., Yao, H., and Liu, Q. (2023). ICAPD framework and simAM-YOLOv8n for student cognitive engagement detection in the classroom. IEEE Access 11, 136063–136076. doi: 10.1109/ACCESS.2023.3337435
Yan, J., and Lv, H. (2023). The development of the flipped learning student engagement scale. In 2023 4th international conference on big data and Informatization education (ICBDIE 2023) (pp. 631–646). Atlantis Press.
Keywords: eye tracking, fixation intensity, regression rate, flipped classroom, process data, adaptive assessment
Citation: Wang Y, Xie N and Liu Y (2025) Fixations, regressions, and results: eye-tracking metrics as real-time signals of cognitive engagement in flipped-class quizzes. Front. Educ. 10:1639273. doi: 10.3389/feduc.2025.1639273
Edited by:
Yan Liu, Carleton University, CanadaReviewed by:
Stefan Daniel Keller, University of Teacher Education Zuerich, SwitzerlandSebastian Becker-Genschow, University of Cologne, Germany
Neila Chettaoui, National Engineering School of Sfax, Tunisia
Copyright © 2025 Wang, Xie and Liu. This is an open-access article distributed under the terms of the Creative Commons Attribution License (CC BY). The use, distribution or reproduction in other forums is permitted, provided the original author(s) and the copyright owner(s) are credited and that the original publication in this journal is cited, in accordance with accepted academic practice. No use, distribution or reproduction is permitted which does not comply with these terms.
*Correspondence: Nina Xie, bmluYXhpZUBsbi5lZHUuaGs=; Yujun Liu, eXVqdW5saXVAbG4uaGs=