 Eleni Rachanioti1,2,3*
 Theodora Foti1Aikaterini Rafaella Geitona1Anastasia Tzalla1Anna Dougali1Olga Fragkomichelaki1Christina Bourmpou4Maria Staikopoulou1Aphrodite Papantoniou1Fotini Varlami1Irene Dinaki1Maria Tsiountala1Konstantinos Staikopoulos1,5Magda Dinou1,2Effie Katsadima1,2Tryfon Mavropalias6Harilaos Zaragas7Efthymia Efthymiou8
 Dimitra Katsarou9
 Georgios Kougioumtzis10,11
 Despina Moraitou12,13
 Maria Sofologi1,2,11
 Georgia Papantoniou1,2,13*
- 1Laboratory of Psychology, Department of Early Childhood Education, School of Education, University of Ioannina, Ioannina, Greece
- 2Institute of Humanities and Social Sciences, University Research Centre of Ioannina (U.R.C.I.), Ioannina, Greece
- 3School of Education and Social Sciences, Department of Education, Frederick University, Nicosia, Cyprus
- 4Faculty of Arts and Sciences, Division of Social Science, Department of Psychology, Yale University, New Haven, CT, United States
- 5Department of Computer, Informatics and Telecommunications Engineering, International Hellenic University, Serres, Greece
- 6Department of Primary Education, School of Education, University of Western Macedonia, Florina, Greece
- 7Pedagogy and Teaching Methodology Laboratory, Department of Early Childhood Education, School of Education, University of Ioannina, Ioannina, Greece
- 8College of Interdisciplinary Studies, Zayed University, Dubai, United Arab Emirates
- 9Department of Preschool Education Sciences and Educational Design, University of the Aegean, Rhodes, Greece
- 10Department of Turkish Studies, National and Kapodistrian University, Athens, Greece
- 11Department of Psychology, School of Health Sciences, Neapolis University Pafos, Paphos, Cyprus
- 12Laboratory of Psychology, Section of Experimental and Cognitive Psychology, School of Psychology, Aristotle University of Thessaloniki, Thessaloniki, Greece
- 13Laboratory of Neurodegenerative Diseases, Center for Interdisciplinary Research and Innovation (CIRI—AUTH) Balkan Center, Aristotle University of Thessaloniki, Thessaloniki, Greece
The Scales for Rating the Behavioral Characteristics of Superior Students (SRBCSS; Renzulli et al., 2010) are notable for incorporating teachers’ informed evaluations in identifying gifted students. Teachers’ close interactions with students enable them to make meaningful judgments, and the SRBCSS provides a structured method to guide and strengthen their nominations. The aim of the present study was to gain insight into the psychometric properties of the Greek version of the first four Scales for Rating the Behavioral Characteristics of Superior Students (SRBCSS), which assess various dimensions of giftedness. One hundred and forty-five (145) Greek primary and secondary education school (elementary and middle school) teachers completed the Learning, Creativity, Motivation, and Leadership scales of the SRBCSS to estimate the corresponding dimensions of giftedness in their students. Specifically, 145 students (83 girls and 62 boys) were evaluated by their teachers. The unidimensional structure of each of the aforementioned SRBCSS scales was tested using exploratory (EFA) and confirmatory (CFA) factor analyses, both of which demonstrated their one-factor structure. CFA analysis also confirmed their content validity, as all four scales were found to be positively correlated at statistically significant levels in the structural model. Furthermore, the number of underlying factors (latent variables) in their total organization was also examined using CFA at scale-level data. Both the one-factor and the correlated two-factor models’ solutions demonstrated statistically equivalent, excellent fit. Additionally, the internal consistency reliability of the four scales was evaluated with Hancock’s H coefficient and found to be good to excellent for all of them. Furthermore, moderate correlations were found between the first four scales of SRBCSS and the GRS-S scales, thus supporting their convergent validity. The research findings indicate that the specific SRBCSS scales can be used as reliable and valid tools for identifying gifted students (by their teachers) in the Greek educational context.
1 Introduction
1.1 Identification of giftedness
Over time, the concept of giftedness has been adopted not only to identify some exceptional performance or impressive achievements, but also to describe in detail certain behavioral characteristics that contribute to this kind of performance or achievements (Westberg, 2012). Early scholars conceptualized giftedness broadly, using terms like “gifted,” “genius,” and “talented” interchangeably. Galton (1869) viewed genius as innate and hereditary, laying a foundation for future inquiry (Kaufman and Sternberg, 2018). Spearman (1904) introduced general intelligence (g) as an inborn trait identified through factor analysis, while Binet and Simon (1916) developed assessments for identifying students needing support - later adapted by Terman (1916) into the Stanford-Binet scale. Although not explicitly focused on giftedness, hierarchical theories of intelligence advanced the understanding of giftedness by acknowledging the layered nature of intellectual abilities.
As the field progressed, dissatisfaction with equating giftedness solely with intelligence led to a more multidimensional approach (Smedsrud, 2020). The shift from genetic determinism toward more dynamic perspectives led to developmental theories which regard giftedness as evolving expertise shaped by both innate dispositions and environmental factors. Renzulli’s (1978, 2005) Three-Ring Conception emphasized above-average ability, creativity, and task commitment, advocating for the identification of gifted behaviors rather than individuals. He further differentiated between “schoolhouse” and “creative-productive” giftedness (Kaufman and Sternberg, 2018). Tannenbaum (1986) highlighted the interaction of abilities, psychosocial skills, external support, and chance, while Mönks (1992) expanded on this by incorporating family, school, and peer influences. Sternberg’s (2003, 2005) Wisdom, Intelligence and Creativity, Synthesized model (WICS) conceptualized giftedness as a balance of wisdom, intelligence, and creativity aimed at personal and societal goals. Similarly, Feldman (1992, 2000) and Feldhusen (1986, 1998) proposed multi-dimensional developmental frameworks, incorporating cognitive, emotional, social, and cultural factors. Gagné’s (2004) Differentiated Model of Giftedness and Talent (DMGT) distinguished innate gifts from developed talents, emphasizing the mediating role of personal and environmental factors, learning, and practice. In a like manner, Heller’s Munich Model of Giftedness (MMG) and the Munich Dynamic Ability-Achievement Model (MDAAM) (Heller et al., 2005) recognized the role of creativity and other traits. These models stress the interaction between talent, personality, and environment, influencing domain-specific performance. The Actiotope Model (Ziegler, 2005) extended this systemic approach, conceptualizing giftedness as adaptive behavior within dynamic interactions between individuals and their environments. More recent frameworks adopted a holistic approach. Kaufman’s (2013) theory of personal intelligence integrates motivational, emotional, and cognitive elements in the pursuit of personal growth, while Pfeiffer (2015) proposed a flexible, three-part model encompassing psychometric, developmental, and ecological perspectives. Subotnik et al.’s (2011, 2018) Megamodel synthesized this body of research, framing giftedness as early potential that, with sustained effort and support, can develop into expertise and, ultimately, eminence. Recently, Tordjman (2020) proposed a developmental framework emphasizing the influence of environmental factors on how a child’s high potential emerges and unfolds. This model examines developmental processes shaped by specific environmental elements - such as encouraging motivation, offering enrichment opportunities, recognizing effort, and providing support - across the child’s family, educational/professional, and broader societal contexts. These different environments interact dynamically, consistent with Bronfenbrenner’s ecological systems theory, which explains how a child’s development is influenced by multiple layers of environment and their interconnections (Bronfenbrenner, 1979; Bronfenbrenner and Evans, 2000; Crawford et al., 2019). By examining various developmental paths that can result in similar high-potential outcomes, the above-mentioned model presents diverse pathways for nurturing and expressing children’s high abilities (Tordjman et al., 2021).
In conclusion, giftedness - once viewed as an inherent and stable trait - is now increasingly understood as a dynamic construct shaped by environmental influences and developmental context (Wiley, 2020). Contemporary perspectives have moved beyond static, IQ-based definitions, favoring multidimensional models that conceptualize giftedness as a collection of distinct constructs. These include not only cognitive abilities but also motivation, task commitment, creativity, social competence, and sustained effort. Such characteristics are now recognized as equally essential in the development and expression of giftedness (Renzulli, 2016; Sternberg, 2015; Subotnik et al., 2011, 2018; Smedsrud, 2020).
Naturally, the evolving definition of giftedness has shaped the assessment criteria, enabling a more accurate and efficient identification of gifted students. Identification procedures have evolved from traditional approaches focused solely on IQ and achievement tests to contemporary approaches involving a wide variety of instruments and strategies such as creativity, motivation (Renzulli, 2011), teacher, parent self-ratings and nominations and portfolios used together or in combination (Acar et al., 2016; Dai, 2018; Smedsrud, 2020). They can be categorized into two main types: performance-based and non-performance-based methods. Performance-based methods often rely on intelligence testing and achievement scores (Cao et al., 2017; Renzulli et al., 2010). The non-performance methods represent all other gifted identification approaches, not in-volving any performance-based assessment. Examples of forms of assessment in this category are teacher and parent rating scales, self-ratings and peer-ratings (Hodges et al., 2018). With respect to teacher rating scales, these instruments can be used to gather structured information from teachers on all areas of giftedness. Moreover, they can be used to assess a wide range of specific characteristics, related to giftedness, that are difficult to assess with other methods and they are not captured by cognitive ability tests (Benson and Kranzler, 2017). Well-constructed rating scales help transform a teacher’s subjective impressions into more objective evaluations by linking them to specific behaviors. The objectivity of judgments on complex performances improves with the quality of the scoring or rating rubric used and the expertise of the rater, who has been thoroughly trained to identify key qualities (Renzulli et al., 2010). Therefore, using teacher rating scales is considered valuable, as these scales can offer diverse insights into students’ characteristics and behavioral patterns associated with giftedness (Makel et al., 2015). Indicative scales for teachers that have been used to assess giftedness in students include the Behavioral Characteristics of Superior Students (SRBCSS; Renzulli et al., 2010). According to Westberg (2012), this is the most commonly used scale by teachers in the U. S to identify gifted students. Other evaluation approaches for teachers that have been used to assess giftedness in students include the Gifted Rating Scales (GRS; Pfeiffer and Jarosewich, 2003), the Gifted and Talented Evaluation Scale (GATES; Gilliam et al., 1996), the Scales for Identifying Gifted Students (SIGS; Ryser and MacConnell, 2004) and the HOPE Teacher Rating Scale (the HOPE Scale; Gentry et al., 2015).
Parents’ nomination allows the evaluation of children’s characteristics, behaviors, interests, and attitudes in different circumstances including extra-scholastic situations (Milic and Simeunovic, 2022). The Gifted Rating Scales (GRS; Pfeiffer and Jarosewich, 2003) can be utilized for parent nominations, while the Gifted and Talented Evaluation Scale (GATES; Gilliam et al., 1996) may be completed by parents or other individuals familiar with the student. Similarly, the Scales for Identifying Gifted Students (SIGS; Ryser and McConnell, 2004) include two complementary rating forms - a Home Rating Scale and a School Rating Scale - which can be administered together or independently.
In the context of self-assessment, students evaluate their characteristics relative to specific domains such as intellectual and learning abilities, motivation, and creativity (Tirri and Nokelainen, 2007). Several validated instruments have been developed for self-nomination purposes. These include the Perceived Competence Scale for Children (Harter, 1982), the Chinese Student Multiple Intelligences Profile, a self-report measure that focuses on gifted students’ activities or preferences that reflect their self- perceived multiple abilities or intelligences (SMIP-24; Chan, 2001), the Revised Screening Scales for the Evaluation of Multiple Intelligences (Hernández-Torrano et al., 2014), the Children’s Perceived Competence Scale, designed to measure children’s self-perceived competence across three domains of Cognitive (C), Social (S), Physical (P) and the fourth domain of General self-worth (G) (CPCS; Nagai et al., 2014), and the Sumida Checklist on Giftedness in Science, used specifically with regard to science giftedness, validated in Japan (Sumida, 2010) and in the Philippines (Larroder and Ogawa, 2015). Finally, the Self Nomination Inventory for Gifted and Talented Adolescents in a Mexican adolescent sample has been validated by Zavala Berbena and de la Torre García (2021).
Peer evaluations can also serve as a valuable component in the assessment of gifted students, particularly when used alongside other methods. This is because (a) peer ratings may be less influenced by social desirability bias, (b) peers often have unique insights into their classmates’ intellectual strengths and behaviors due to daily interactions, and (c) collecting a large volume of peer ratings is often feasible (Kaya, 2013; Paunonen and O’Neill, 2010). However, there is a limited body of research focusing on peer ratings in this context (Marsili and Pellegrini, 2022). Concerns regarding peer nomination tools often center around their limited evidence for reliability and validity, with some critics pointing out the absence of even basic psychometric data (Gagné et al., 1993). One notable exception is a peer referral form developed by Udall (1987), aimed at identifying gifted minority students in Grades 4 to 6. Cunningham et al. (1998) assessed this tool’s reliability and construct validity and concluded that it is generally reliable for identifying gifted Hispanic students, though they also offered recommendations for its effective application. More recently, Kaya and Delen (2014) explored the usefulness of peer assessments in identifying giftedness by creating a computer-based, psychometrically sound peer rating tool known as the Guess Who: Peer Nomination Form (GWPNF). Designed specifically for younger elementary students, the GWPNF features a game-like format and uses simple, age-appropriate language.
Researchers in the field suggest assessing giftedness in stages that include an initial detection stage followed by a thorough assessment of students (Almeida et al., 2016). As such, teacher rating scales, which have been found to be the most commonly employed method for identifying gifted students (Marsili and Pellegrini, 2022), are often used as brief assessment tools, followed by individually administered standardized tests for a more accurate identification (Renzulli and Gaesser, 2015).
1.2 Scales for rating the behavioral characteristics of superior students (SRBCSS)
1.2.1 Initial development of SRBCSS
Renzulli and Hartman (1971) developed the first version of the Scales for Rating the Behavioral Characteristics of Superior Students (SRBCSS) to provide a more objective tool for identifying gifted students. The original scales assessed learning, creativity, motivation, and leadership using teacher ratings on a 4-point scale. The SRBCSS demonstrated high test–retest reliability, with coefficients ranging from 0.77 to 0.88 and interjudge (inter-rater) reliability from 0.67 to 0.89. It effectively distinguished gifted from average students through significant differences in one-way ANOVAs. Validity analyses showed weak to moderate correlations between the Learning and Motivation Scales and standardized intelligence tests (0.61 and 0.36, respectively). Learning and Motivation Scales also correlated with Language achievement tests (0.41 and 0.42), Mathematics (0.57 and 0.60), and Total Achievement (0.46 and 0.50). The Creativity Scale aligned well with verbal but not nonverbal subscores of the Torrance Tests of Creative Thinking (Torrance, 1966). Leadership was validated through teacher-peer comparisons, with correlations ranging from 0.75 to 0.84 in fourth and fifth graders. As views of giftedness broadened, new scales were added for art, music, drama, communication (precision/expressiveness), and planning (Renzulli and Hartman, 1971; Renzulli et al., 1976).
1.2.2 SRBCSS – Revised
Renzulli et al. (2002) revised the original SRBCSS scales – Learning, Creativity, Motivation, and Leadership – by implementing four key modifications. First, they eliminated compound items. Second, they reworded all items using gender-neutral pro-nouns. Third, new items were added to reflect traits of gifted students supported by other teacher judgment research. Fourth, original items were slightly reworded to align with the new uniform item stem: “The student demonstrates ….” These changes resulted in 56 potential items for the initial field test. Additionally, based on feedback from teachers and specialists dissatisfied with the original 4-point scale, a new 6-point response scale was adopted (1 = never, 2 = very rarely, 3 = rarely, 4 = occasionally, 5 = frequently, 6 = always). The revised instrument was field tested with 921 students from kindergarten through 12th grade, with most in grades 3–6 (n = 513), and focused on Learning, Creativity, Motivation, and Leadership. Teachers rated general academic achievement for 239 students as high, 262 as high average, 238 as average, 108 as low average, and 70 as low; four had missing data. A principal components analysis (PCA) of the ratings produced a four-factor solution accounting for 72% of the variance. However, since 46 items loaded above 0.40 on the first factor, the structure was considered unsatisfactory. Consequently, several items of the Learning scale were removed while items added in the Motivation scale, resulting in a final 43-item version: 13 Learning, 11 Creativity, 11 Motivation, and 8 Leadership items (as outlined in the SRBCSS Technical and Administration Manual; Renzulli et al., 2010).
In the second field test, 572 teachers (146 male, 426 female) rated above-average students in grades 3–12 using the revised SRBCSS-R and provided demographic data. A total of 572 students (268 boys, 303 girls) were evaluated. No significant gender differences in total SRBCSS-R scores were found (t = −0.177, df = 568, p > 0.05). An exploratory principal component analysis (PCA) was conducted to explore relationships between judgment-based categories and empirically derived constructs. Using Kaiser’s criterion (eigenvalues > 1.0), four factors were extracted. After reviewing factor loadings, five items were removed, resulting in a refined 38-item version. This four-factor solution explained 71% of the variance and included 11 Learning, 9 Creativity, 11 Motivation, and 7 Leader-ship items. Both varimax and oblique rotations yielded similar factor structures and loadings. The factors were conceptually clear and aligned with the intended domains: Learning, Creativity, Motivation, and Leadership. A Confirmatory Factor Analysis (CFA) was not performed. Internal consistency reliability was assessed using Cronbach’s alpha. The reliability coefficients were α = 0.91 for Learning scale, α = 0.84 for Creativity scale, α = 0.90 for Motivation scale, and α = 0.87 for Leadership scale. These values demonstrated strong internal consistency reliability, as stated in the SRBCSS-R technical and administration manual (Renzulli et al., 2010).
1.2.3 SRBCSS-III
In 2010, the SRBCSS-R was expanded to include four new scales – Reading, Mathematics, Science, and Technology scales – to help teachers assess students’ strengths in specific academic domains (Renzulli et al., 2010). The Reading scale includes items regarding advanced reading and language skills; Mathematics focuses on problem-solving and conceptual understanding; Science assesses interest and understanding scientific concepts; and Technology evaluates expertise, initiative, mentoring, and creativity. Confirmatory Factor Analyses (CFA) refined the scales to seven items each for Reading, Science, and Technology scales, and 11 for Mathematics scale. A combined CFA model – with one Reading and one Mathematics item removed – showed improved fit. Internal consistency reliability was excellent (lowest Cronbach’s alpha = 0.95; Renzulli et al., 2010).
In essence, the distinctive value of the SRBCSS lies in its incorporation of teachers’ informed evaluations as a crucial component of the gifted identification process. The importance of involving teachers in identifying gifted students stems from their close and multifaceted interactions with students in various contexts. These experiences uniquely position teachers to make well-informed and meaningful judgments about student giftedness (Bracken and Brown, 2006). To support and refine teacher nominations, Renzulli and Hartman (1971) and Renzulli et al. (1976, 2002, 2010) introduced the SRBCSS - a more structured and systematic approach - for identifying students’ strengths.
1.2.4 International research exploring the factor-structure of the first/initial four scales: Learning, Creativity, Motivation, and Leadership Scale
Since its initial development (1971, 1976), SRBCSS have been widely used in the United States (Renzulli et al., 2009) and have been translated, adapted, and/or validated in various countries around the world, such as China (Chan, 2000), Germany (Rogalla, 2003), France (Caroff et al., 2006), Korea (Jin and Choe, 2010), Romania (Labãr and Frumos, 2013), Saudi Arabia (Bakheit, 2013), Oman (Kazem et al., 2014), Brazil (Callegari, 2019), Hungary (Klein and Fodor, 2019), Jordan (Al-momani and Al-Oweidi, 2020; Srour, 1989), Qatar (Jaffal et al., 2021) and Italy (Sorrentino, 2019; Sorrentino and Pinnelli, 2022).
The validity and reliability of the first four scales of SRBCSS – Learning, Creativity, Motivation, and Leadership – were firstly assessed in Burke et al.’s (1982) study on a sample of 382 American fifth- and sixth-grade students. The PCA results indicated a five-factor solution instead of the four-factor structure originally proposed by Renzulli et al. (1976). The fifth factor/scale was called “Resistance,” reflecting a child’s ability to resist external influences and assert their own will. The Learning scale accounted for the largest percentage of variance (36%), suggesting that the SRBCSS, in fact, may be assessing primarily one behavioral dimension. Cronbach’s alpha reliability values of the five factors varied from 0.66 to 0.94 (Learning α = 0.93, Creativity α = 0.94, Motivation α = 0.89, Leadership α = 0.88, Resistance α = 0.66). The overall alpha reliability was calculated as α = 0.96.
Similarly, Srour (1989) assessed the validity and reliability of the Arabic-translated SRBCSS among 666 gifted, average and below average Jordanian students. The results of the factor analysis, oblique rotation, that was conducted at the first phase of the study for all 666 students (222 gifted, 222 average, and 222 below average) indicated that most items of SRBCSS (29 out of 37) loaded on one factor. The 29 items were a combination of items that came from all four major factors in the original scale. PCA with Oblique Rotation was also conducted for the gifted students only and indicated a five- factor solution. The fifth factor was called “Flexible thinking,” with alpha values ranging from 0.69 to 0.80 (Learning α = 0.70, Creativity α = 0.80, Motivation α = 0.69, Leadership α = 0.74, Flexible thinking α = 0.75).
Additionally, Chan (2000) examined the validity and reliability of the Taiwanese Chinese version of SRBCSS (Ku-Yu et al., 1994), which comprises of five scales. Apart from the original four scales of learning, motivation, creativity and leadership, a scale for assessing characteristics relating to mathematics and science was added. The items of scales comprised both new constructed items as well as original items translated from the English version. The varimax-rotated five-factor solution [χ2 (1030) = 1420.61, p < 0.001] accounting for 54.19% of the total variance, was regarded as an adequate representation of the data provided by the teachers. Cronbach’s alpha reliability values of the Chinese version varied from 0.88 to 0.93 (Learning α = 0.90, Creativity α = 0.88, Motivation α = 0.93, Leadership α = 0.90, Mathematics and Science α = 0.90).
Rogalla (2003) assessed the validity and reliability of the first four scales of the Ger-man–translated version of SRBCSS-R among 305 students in grades 1–6. The CFA results validated, at the 38 item-level, the four-factor solution from the American SRBCSS-R with a marginally accepted Comparative Fit Index (CFI) of 0.89 and a Standardized Root Mean Squared Residual (SRMR) of 0.07. Moreover, Cronbach’s alpha reliability coefficients ranged between α = 0.86 and α = 0.96 (Learning α = 0.96, Creativity α = 0.91, Motivation α = 0.96, Leadership α = 0.86).
In a like manner, Caroff et al. (2006) examined the factor structure of the French version of the SRBCSS-R. Results from a CFA (LISREL 8; Jöreskog and Sörbom, 1997) indicated that, for teachers’ evaluations, the fit indices deviated considerably from the generally accepted threshold values [χ2 (858) = 3684.37, p > 0.05; RMSEA = 0.15; NFI = 0.94; CFI = 0.96; GFI = 0.45; AGFI = 0.39]. These initial results were therefore supplemented by a series of EFA which indicated a two-factor solution, instead of the four-factor structure originally proposed by Renzulli et al. (2002). The first factor loaded onto all items from the first two scales, as well as some items measuring motivation or leadership. This common factor was called “Learning / Creativity.” Similarly, the second factor was named “Motivation / Leadership” because it was consistently associated with items from the relevant scales. Cronbach’s alpha reliability values of the two factors were 0.96 and 0.98, respectively.
Jin and Choe (2010) examined the validity and reliability of the Korean–translated SRBCSS in 126 gifted students and 126 average students on six scales of the SRBCSS: learning, creativity, motivation, leadership, mathematics and science. The Korean version of the SRBCSS (K-SRBCSS) was finalized with 58 items including 55 items from the original scales and three additional items that the researchers deemed necessary for the Korean context. To verify whether the rating scale was properly structured to measure the constructs it was intended to assess, EFA was conducted. PCA was used to extract the items into six fixed factors, and the varimax orthogonal rotation method was applied. EFA results showed that, as in the original SRBCSS, all items were categorized into six fac-tors/scales, with Mathematics scale having the highest explanatory power, with an eigenvalue of 33.88, accounting for 14.65% of the total variance. The six extracted factors together explained 72.91% of the total variance, confirming that the instrument has high validity. Cronbach’s alpha coefficient for the six factors ranged from 0.93 to 0.94 (Learning Behavior Characteristics α = 0.93, Creative Behavior Characteristics α = 0.94, Motivational Behavior Characteristics α = 0.93; Leadership Behavior Characteristics α = 0.94; Scientific Behavior Characteristics α = 0.93; Mathematical Behavior Characteristics α = 0.93).
In the same line, Kazem et al. (2014) examined the factor structure of all 14 scales (SRBCSS-III) on a sample of 672 students (grades five to ten) in Oman. Exploratory factor analyses yielded 13 factors – with Communication scale including both Precision and Expressiveness characteristics – supporting the factorial validity of SRBCSS as well as capturing the Learning Characteristics (11 items), Creativity Characteristics (9 items), Motivation Characteristics (11 items) and Leadership Characteristics (7 items) from the American SRBCSS. Cronbach’s alpha reliability coefficients of the first four scales varied from 0.90 to 0.93 in the Omani sample (Learning α = 0.93, Creativity α = 0.91, Motivation α = 0.91, Leadership α = 0.90).
Finally, Jaffal et al. (2021) examined the validity and reliability of an Arabic version of SRBCSS-III (Renzulli et al., 2010), consisting of 12 scales, without including Maths scale and Science scale. Initially, the 12 scales were subjected to exploratory factor analysis and 12 factors were extracted using the principal components method with oblique rotation. The items (108 in total) loaded on their respective factors except for 10 items, with 4 of them not loading on any factor. All other loadings were substantial and the 12 factors explained about 85% of the variance. A CFA was performed after dropping the items that did not load on their respective factors. The model fit the data with marginally acceptable fit indices [χ2 (714, N = 176) = 1287.84, CFI = 0.94, TLI = 0.94, SRMR = 0.04, RMSEA = 0.07]. Due to high correlations among the 12 first-order factors, a second-order CFA was per-formed by loading the 12 first-order factors onto 2 s-order factors, namely Learning/Personal Characteristics and Verbal/Artistic Characteristics. Each parcel showed strong loadings, with all values exceeding 0.90, providing empirical evidence to consider that superior students’ characteristics consist of two broad dimensions that are distinct but highly correlated. In addition, all 12 scales demonstrated good internal consistency re-liability, with Cronbach’s alpha coefficients ranging from 0.83 to 0.96 (Learning α = 0.89, Creativity α = 0.96, Motivation α = 0.95, Leadership α = 0.83).
1.3 Aims of the study
One of the major challenges in gifted education in Greece is the accurate identification of gifted and highly talented students through teachers’ and/or parents’ rating scales as part of a screening test. The National Educational Curriculum lacks any reference to giftedness, making it difficult to tailor learning experiences to students with gifted traits. Additionally, the Greek educational system does not have a formal process for identifying gifted children, as no guidelines exist within the curriculum or syllabus documents. Furthermore, the absence of official gifted identification programs and structured enrichment initiatives highlights the urgent need for effective evaluation of gifted learners. Given that SRBCSS scales were initially designed in a different educational and cultural context, it is unavoidable to question their relevance and suitability in the Greek context. Moreover, to our knowledge, no Greek published research has tested in Greek population some of the psychometric properties – factor structure, internal consistency reliability, convergent validity – of the SRBCSS. Since, according to Westberg (2012), the first four scales of the SRBCSS – Learning, Motivation, Creativity, and Leadership – have been among the most widely used teacher judgment rating scales for gifted programming in the U. S., and have also been translated and studied in several countries, and given that the authors of the scales did not conduct a confirmatory factor analysis to examine the relationships between the judgmentally developed categories and empirically derived constructs (as noted in the SRBCSS Technical and Administration Manual; Renzulli et al., 2010), the aims of this study were: (a1) the test/confirmation (at item-level data) of the unifactorial structure for each of the first four scales – Learning, Creativity, Motivation, and Leadership – of the Greek version of SRBCSS, as well as (a2) the test of their content validity, by examining the four scales’ inter-correlations. Considering the findings of Srour (1989) and Caroff et al. (2006), who identified one-factor and two-factor solutions, respectively, to account for most of the variance captured by the first four scales of the SRBCSS (as measured variables at scale-level), another aim of this study (a3) was to examine these two alternative possibilities in a Greek sample. Moreover, another aim of this study was (b) the evaluation of the internal consistency reliability of each of the four scales of the Greek version of the SRBCSS, as well as (c) the test of the convergent validity of the Greek version of the first four SRBCSS scales with the Greek version of the six Gifted Rating Scales – School form (GRS-S), which, according to Pfeiffer and Jarosewich (2003), have been found to have high correlations with ratings on Creativity, Motivation and Leadership SRBCSS scales in the GRS-S authors’ American sample.
2 Materials and methods
2.1 Participants
A total of 145 Greek primary and secondary education school teachers participated in the study. Specifically, 101 (69.7%) were women, and 42 (29%) were men, while 2 (1.3%) did not declare their gender. Regarding the length of time, they had known the student, whose behavioral and learning characteristics they were going to evaluate, 21 (14.5%) reported they knew the student from 1 to 3 months, 40 (27.6%) from 4 to 6 months, 7 (4.8%) from 7 to 12 months and 75 (51.7%) more than a year. Concerning how well they believed they knew the student, 81 (55.9%) teachers stated they feel they know the child fairly well, 46 teachers stated (31.7%) they feel they know the child very well, while only 16 teachers (11%) stated that they do not feel they know him/her very well. A total of 1.4% (N = 2) did not respond to the last two relevant questions. An equal number (N = 145) of students, randomly selected from the student population, were rated by their teachers. More precisely, 83 (57.2%) were girls and 62 (42.8%) were boys. The composition of the students’ sample in terms of grade level was as follows: 40 students were from the 5th grade of Greek primary education school (5th grade of American elementary school), 56 from the 6th grade of Greek primary education school (1st grade of American middle school), 24 were from the 1st grade of Greek secondary education school (2nd grade of American middle school), and 25 from the 2nd grade of Greek secondary education school (3rd grade of American middle school).
2.2 Measurements
2.2.1 The scales for rating the behavioral characteristics of superior students (SRBCSS)
The Scales for Rating the Behavioral Characteristics of Superior Students (now in its third edition) (Renzulli et al., 2010) are designed to obtain teacher estimates of a student’s characteristics within a wide range of ages (K-12), based on Renzulli’s Three-Ring Conception of Giftedness (Renzulli, 1978). It measures different aspects of giftedness in the 14 following areas: Learning Characteristics, Creativity Characteristics, Motivation Characteristics, Leadership Characteristics, Artistic Characteristics, Musical Characteristics, Dramatics Characteristics, Communication Characteristics (Precision), Communication Characteristics (Expressiveness), Planning Characteristics, Mathematics Characteristics, Reading Characteristics, Technology Characteristics, and Science Characteristics. Each scale consists of multiple items rated using a Likert-type scale. To respond to the items on the scale, teachers rate the frequency with which they observe each characteristic manifested in a student on a 6-point scale (1 = never, 2 = very rarely, 3 = rarely, 4 = occasionally, 5 = frequently, and 6 = always). In addition, the authors recommend against calculating a single total score by adding up the individual scale scores. Rather, they suggest assessing each scale separately and focusing only on those that provide valuable information when determining eligibility for specialized educational programs for gifted students (Renzulli et al., 2010).
The SRBCSS scales (3rd edition) were translated into Greek by Georgia Papantoniou, Magda Dinou, Aikaterini-Rafaella Geitona, Anastasia Tzalla, and Theodora Foti. The translation process adhered to the International Test Commission (ITC) guidelines.1 In brief, the process included forward translation, back-translation, and a debriefing to a pre-testing sample of teachers (International Test Commission, 2017). In the forward-translation procedure, two psychologists who were native speakers of the Greek language, and had an excellent knowledge of the English language, translated the SRBCSS scales into Greek versions independently. The two Greek versions were discussed by the psychologists, and one reconciled version was finally reviewed by a professor of English literature for grammatical and syntactical structure and for a more elegant translation of the original text. In the back-translation procedure, a native speaker of the English language, with excellent knowledge of the Greek language, back-translated the Greek version of the SRBCSS scales without having seen its original English version. Then, the back-translated version was compared with the original translation to test for any discrepancies, and we reached the final Greek version of the SRBCSS scales. The professional translator confirmed that the Greek version of the SRBCSS scales is an exceptionally accurate translation into Greek.
The final step included cognitive debriefing with a pre-testing sample of Greek teachers, through qualitative interviews conducted in small groups. This approach enabled us to assess the comprehensibility and cognitive equivalence of the Greek translation of the SRBCSS scales. We conducted cognitive debriefing with 20 Greek primary and secondary education school teachers, during which they were asked to share their thoughts on the purpose of the instrument (using the question, “What do you think the scale is supposed to assess?”). They were also invited to identify and discuss any difficulties they experienced in understanding particular items of the scales. The pre-testing phase of the Greek version of the SRBCSS indicated that teachers understood the content and the subscales of the instrument adequately. They reported that the items effectively assess characteristics related to learning ability, creativity, motivation, and leadership. Overall, teachers did not report significant difficulties in comprehending or interpreting the items.
Formal authorization to use the SRBCSS scales was secured from collaborators of Professor Joseph Renzulli at the National Research Center on the Gifted and Talented, State University of Connecticut.
2.2.2 The gifted rating scale – school form
The GRS- School Form is designed for ages 6.0–13.11 (Pfeiffer and Jarosewich, 2003) and consists of six scales: Intellectual, Academic, Creative, Artistic, Leadership and Motivation, each with 12 items (a total of 72 items). Each item of all scales is rated by the teacher on a 9-point scale divided into three ranges: 1–3 is regarded below average, 4–6, as average and 7–9, is considered as above average.
The Gifted Rating Scales – School Form (GRS-S) was translated into the Greek language by Georgia Papantoniou, Chrysoula Thomaidou, and Evangelia Foutsitzi. The International Test Commission (ITC) guidelines (see text footnote 1, respectively) were followed to translate the GRS-S into Greek. The translation procedure utilized for the SRCBSS scales was similarly employed in the adaptation of the GRS-S. The psychometric properties of the six scales of the Greek version of the GRS-S were examined in a Greek sample by Sofologi et al. (2023), with Cronbach’s alpha reliability coefficients indicating excellent internal consistency for all scales: Intellectual Ability (α = 0.97), Academic Ability (α = 0.97), Creativity (α = 0.96), Artistic Talent (α = 0.97), Leadership Ability (α = 0.96), and Motivation (α = 0.97).
2.3 Procedure
Each teacher evaluated one of his/her students by completing the translated Greek version of the first four SRBCSS and the GRS-S. The parents of the students were also provided with a Greek-translated version of the scales, along with a consent form, to ensure they were adequately informed about the measurements used in the study, without participating in the evaluation process.
In specific, each teacher and parent received the following from the researcher: (a) an information letter explaining the research objectives and a consent form, (b) a demographic data form, (c) the translated first four scales – Learning, Creativity, Motivation, and Leadership – of the Greek version of the SRBCSS, and (d) the translated six scales of the Greek version of the GRS-S. All participants completed the assessment individually. Teachers had the flexibility to choose both the location and timing for filling out the questionnaire. If the completion occurred in the presence of the researcher, assistance and clarifications were provided when necessary. Teachers were encouraged to respond truthfully to ensure the reliability of the results. The sample was convenient, and the participants were recruited from schools in various regions of Greece, with data collected randomly by students from the Department of Early Childhood Education at the University of Ioannina, as part of a voluntary task during an Introduction to Psychology course, under the supervision of one of the study’s authors. Since the data collected were considered personal, the European Union law on personal data protection, effective since May 28, 2018, was strictly followed. According to this regulation, the use of sensitive personal data is permitted exclusively for research purposes. The study protocol adhered to the ethical principles outlined in the Helsinki Declaration and received approval from the Scientific and Ethics Committee of the University of Ioannina (25,847/01/06/2021).
3 Results
3.1 Test of the factor structure of each of the first four scales – Learning, Creativity, Motivation and Leadership – of the SRBCSS via parallel and exploratory factor analyses
In line with Horn’s (1965) critique (as cited in Courtney, 2013) that the Kaiser criterion (K1 rule) is not appropriate for sample-based research due to sampling error in the computation of latent roots, a parallel analysis was carried out in SPSS 21.0 with R-menu installed (Basto and Pereira, 2012) to assess the unifactorial structure of each of the four scales of the SRBCSS.
3.1.1 Test of the factor structure of the Learning Scale of the SRBCSS
In parallel analysis, the first component had a substantially larger eigenvalue (7.602), accounting for 69.1% of the total variance, and exceeding the simulated eigenvalue threshold (1.542). Subsequent components had much smaller eigenvalues (e.g., 0.795, 0.516, 0.382) and did not surpass their respective simulated thresholds (1.382, 1.259, 1.159), suggesting limited explanatory value. All four retention criteria — optimal coordinates, acceleration factor, parallel analysis, and the Kaiser rule — converged on the retention of a single component. The acceleration factor peaked after the first component (AF = 6.528), further reinforcing the conclusion of a unidimensional structure of the Learning scale.
Additionally, the unifactorial structure of the scale was explored by conducting principal axis factoring with Direct Oblimin rotation. The Kaiser-Mayer-Olkin measure was applied to evaluate the total sample suitability, the value of which was Κ.Μ.Ο = 0.93. Barlett’s sphericity control was statistically significant χ2 = 1114.382, df = 55, and p < 0. 001. The analysis revealed one factor with eigenvalue > 1.0. The eigenvalue of the factor was 6.98 and the percentage of the explained variance was 63.47%.
3.1.2 Test of the factor structure of the Creativity Scale of the SRBCSS
In parallel analysis, the first component yielded a notably high observed eigenvalue of 5.656, explaining 62.8% of the total variance, which was well above the simulated threshold (1.435). Subsequent observed eigenvalues were much smaller (e.g., 0.975, 0.604, 0.523) and did not exceed their corresponding simulated thresholds (1.285, 1.168, 1.073), highlighting the minimal contribution of additional components. These results were validated by all four retention criteria — optimal coordinates, acceleration factor, parallel analysis, and the Kaiser rule — which each supported the retention of a single component. The acceleration factor also reached its maximum after the first component (AF = 4.311), providing further evidence that the Creativity scale demonstrates a unidimensional factor structure.
Additionally, the unifactorial structure of the scale was explored by conducting principal axis factoring with Direct Oblimin rotation. The Kaiser-Mayer-Olkin measure was used to evaluate the total sample suitability, which was K. M. O. = 0.90. For a further and more concise evaluation of the suitability of the data for factor analysis, Barlett Sphericity Test was applied and found to be statistically significant χ2 = 750.063, df = 36, and p < 0. 001. The analysis of the data showed one factor with eigenvalue > 1.0. The eigenvalue of the factor was 5.28 and the percentage of explained variance was 58.75%.
3.1.3 Test of the factor structure of the Motivation Scale of the SRBCSS
In parallel analysis, although the Kaiser criterion indicated a two-factor solution, the other three retention criteria- parallel analysis, optimal coordinates, and the acceleration factor — converged on one-factor solution. Specifically, subsequent observed eigenvalues were smaller (e.g., 1.219, 0.803, 0.604) and did not exceed their corresponding simulated thresholds (1.368, 1.253, 1.149), highlighting the minimal contribution of additional components. Importantly, only the first component yielded a notably high observed eigenvalue of 6.089, explaining 55.4% of the total variance, which was well above the simulated threshold from the parallel analysis (1.523). The acceleration factor peaked after the first component (AF = 4.455), providing further evidence that the Motivation scale demonstrates a unidimensional factor structure.
Additionally, the unifactorial structure of the scale was explored by conducting principal axis factoring with Direct Oblimin rotation. The Kaiser-Meyer-Olkin measure was used to evaluate the total sample suitability, which was K. M. O. = 0.90. Bartlett’s test of sphericity control was statistically significant, χ2 = 722.22, df = 55, p < 0.001. The analysis revealed two factors with eigenvalues greater than 1.0. The eigenvalue of the first factor was 5.45, explaining 49.62% of the variance, while the eigenvalue of the second factor was 1.23, explaining 11.26% of the variance. Taking into account the proposed unifactorial structure of the scale’s manufacturer, and the apparent difference between the first factor and the second factor in the scree plot, we decided to conduct an exploratory factor analysis with the criterion of extracting a single factor and setting a loading threshold of 0.40. All the items’ loadings exceeded the threshold of 0.40 supporting the one-factor solution.
3.1.4 Test of the factor structure of the Leadership Scale of the SRBCSS
In parallel analysis, the first component had a substantially larger eigenvalue (4.513), accounting for 64.5% of the total variance, and exceeding the simulated eigenvalue threshold (1.368). Subsequent components had much smaller eigenvalues (e.g., 0.753, 0.501, 0.403) and did not surpass their respective simulated thresholds (1.368, 1.216, 1.097), suggesting limited explanatory value. All four retention criteria — optimal coordinates, acceleration factor, parallel analysis, and the Kaiser rule — converged on the retention of a single component. The acceleration factor peaked after the first component (AF = 3.508), further reinforcing the conclusion of a unidimensional structure of the Leadership scale.
Additionally, the unifactorial structure of the scale was explored by conducting principal axis factoring with Direct Oblimin rotation. The Kaiser-Mayer-Olkin measure was used to check the overall sample suitability, which was K. M. O. = 0.89. For a further and more complete examination of the suitability of the data for factor analysis, Barlett Sphericity Test χ2 = 470.124, df = 21 and p < 0.001 were performed. Data analysis revealed one factor with eigenvalue >1.0. The eigenvalue of the factor was 4.16 and the percentage of explained variation was 59.53%.
3.2 Test of the factor structure of each of the first four scales – Learning, Creativity, Motivation and Leadership – of the SRBCSS via confirmatory factor analyses application
In order to verify the one-factor structure, identified through the EFA application, for each of the four SRBCSS scales, a set of four CFA was conducted. These analyses were applied to the data corresponding to each of the four SRBCSS scales – Learning (11 items), Creativity (9 items), Motivation (11 items), and Leadership (7 items) – using the Maximum Likelihood estimation method. Each CFA was carried out in EQS 6.1 (Bentler, 2005), based on the covariance matrix of items measured on a six-point scale. Model fit was primarily assessed using the chi-square (χ2) test, where a non-significant result indicates that the hypothesized model adequately reproduces the observed variance–covariance structure (Brown, 2015; Kline, 2003). The χ2/df ratio – which was introduced by Wheaton et al. (1977) in attempt to use χ2 in a manner that would foster more realistic model evaluation – was also calculated. Given the test’s sensitivity to sample size, additional fit indices were employed. The Root Mean Square Error of Approximation (RMSEA) – which, according to Fan and Sivo (2007), stood out as having ideal behavior patterns expected of good model fit index – was used to evaluate how well the model would fit the population covariance matrix. According to established guidelines, RMSEA values ≤ 0.05 indicate a close fit, values between 0.05 and 0.08 suggest a reasonable fit, and values ≥ 0.10 indicate poor fit (Brown and Cudeck, 1993; Kline, 2003). Furthermore, the Comparative Fit Index (CFI), a widely used incremental fit index, was utilized to assess the improvement in model fit compared to a baseline model. CFI values between 0.95 and 1.00 reflect a good fit, while values between 0.90 and 0.95 represent an acceptable fit (Bentler, 1990; Schweizer, 2010). Lastly, the Standardized Root Mean Square Residual (SRMR), which reflects the average discrepancy between observed and predicted correlations, was also examined. An SRMR value below 0.08 is considered indicative of a good model fit (Bentler, 2005; Brown, 2015; Hu and Bentler, 1999). However, it is worth noting at this point, that we should be cautious, as according to Fan and Sivo (2007), for most fit indices including CFI and SRMR, it would be difficult to establish cut-off criteria that would be generally useful in SEM applications. Additionally, although the χ2/df ratio has become very popular in applied research, according to Brown (2006) its use is strongly discouraged.
The fit indices of the initial CFA models’ set, that was conducted to test the one-factor structure of each of the four SRBCSS scales, ranged from not accepted to marginally accepted:
Learning Scale, χ2 (44, N = 144) = 118.06, p < 0.001, χ2/df = 2.683, CFI = 0.93, SRMR = 0.05, RMSEA = 0.11 (CI90% 0.08–0.13);
Creativity Scale, χ2 (27, N = 144) = 92.45, p < 0.001, χ2/df = 3.424, CFI = 0.91, SRMR = 0.06, RMSEA = 0.13 (CI90% 0.10–0.16);
Motivation Scale, χ2 (44, N = 143) = 101.19, p < 0.001, χ2/df = 2.999, CFI = 0.92, SRMR = 0.06, RMSEA = 0.10 (CI90% 0.07–0.12);
Leadership Scale, χ2 (14, N = 145) = 27.45, p = 0.017, χ2/df = 1.960, CFI = 0.97, SRMR = 0.04, RMSEA = 0.08 (CI90% 0.03–0.13).
All parameters of the aforementioned models were found to be statistically significant (p < 0.05). Standardized Root Mean Squared Residual (SRMR) values were below 0.08, also indicating a good fit for the models tested. Similarly, the χ2/df ratio of one model fell to the range of 0.00–2.00 and was indicative of a marginally good model fit, the χ2/df ratios of two models fell to the range of 2.00–3.00 and were indicative of a marginally accepted model fit, while the fourth model’s χ2/df ratio fell to the range of χ2/df > 3.00 indicating a poor model fit (Schermelleh-Engel et al., 2003). Furthermore, the chi square goodness-of-fit test was statistically significant for all the initial models resulting in a rejection of the null hypothesis of good fit. In addition, the Comparative Fit Index (CFI) values of the three models fell to the lowest boundary of the marginal range of 0.90–0.95 and were indicative of a marginally accepted model fit (Bentler, 2005; Brown, 2015; Hu and Bentler, 1999). Finally, the Root Mean Squared Error of Approximation (RMSEA) values were above 0.08, indicating a poor fit for the models tested (Brown, 2015; Brown and Cudeck, 1993).
For these reasons, we proceeded with the identification of the areas of the initial models that contributed the most to the misfit. To account for possible correlations between variables, we extend the baseline model by incorporating covariances. A residual analysis was conducted, and the Wald test was performed. Different models were tested and the modifications indicated by the aforementioned tests were included in the model being tested each time. The modifications were correlated errors of measured variables (items) that were manifested as large standardized residuals. The modifications are presented after the indices of each of the four final models, and were covariances (correlations) between errors of indicators (items), which were mainly similarly worded (Bandalos, 2021) or differentially prone to social desirability (Brown, 2006). The modifications improved the fit of the final models on all indices:
Learning Scale, χ2 (41, N = 144) = 82.73, p = 0.00012, χ2/df = 2.017, CFI = 0.96, SRMR = 0.04, RMSEA = 0.08 (CI90% 0.06–0.11); Covariances (correlations) among errors of measured variables (items) of the Greek version of Learning Scale (standardized solution): E5 – E4 = 0.406, Ε9 – Ε8 = 0.212, Ε11 – Ε10 = 0.245; All correlations presented indicate statistically significant associations (p < 0.05) among errors of measured variables and their z values were 4.026, 2.183, and 2.545, respectively.
Creativity Scale, χ2 (23, N = 144) = 43.79, p = 0.00558, χ2/df = 1.903, CFI = 0.97, SRMR = 0.04, RMSEA = 0.08 (CI90% 0.04–0.11); Covariances (correlations) among errors of measured variables (items) of the Greek version of Creativity Scale (standardized solution): Ε6 – Ε1 = −0.483, Ε8 – Ε1 = −0.312, Ε6 – Ε5 = −0.392, Ε9 – Ε8 = 0.192; All correlations presented indicate statistically significant associations (p < 0.05) among errors of measured variables and their z values were −4.706, −3.438, −3.696, and 2.102, respectively.
Motivation Scale, χ2 (42, N = 143) = 77.68, p = 0.00067, χ2/df = 1.849, CFI = 0.95, SRMR = 0.05, RMSEA = 0.08 (CI90% 0.05–0.10); Covariances (correlations) among errors of measured variables (items) of the Greek version of Motivation Scale (standardized solution): Ε3 – Ε2 = 0.259, Ε11 – Ε2 = 0.306; All correlations presented indicate statistically significant associations (p < 0.05) among errors of measured variables and their z values were 2.918, and 3.561, respectively.
Leadership Scale, χ2 (13, N = 145) = 22.65, p = 0.04608, χ2/df = 1.742, CFI = 0.98, SRMR = 0.04, RMSEA = 0.07 (CI90% 0.01–0.12); Covariance (correlation) between errors of measured variables (items) of the Greek version of Leadership Scale (standardized solution): Ε6 – Ε4 = −0.229; The correlation presented indicates statistically significant association (p < 0.05) between errors of measured variables and its z value was −2.259.
In the second set of the CFA, all parameters of the final models were also found to be statistically significant (p < 0.05). The Standardized Root Mean Squared Residual (SRMR) values were below 0.08, indicating a good fit for the models tested. Additionally, the Comparative Fit Index (CFI) values of the four models exceeded 0.95, indicating a reasonably strong fit across the models. Furthermore, the chi square goodness-of-fit test was not statistically significant for almost all of the final models resulting in the acceptance of the null hypothesis of good fit. Similarly, the χ2/df ratio of three of the final models fell to the range of 0.00–2.00 and was indicative of a good model fit, while the χ2/df ratio of the fourth model fell to the range of 2.00–3.00 and was indicative of a marginally accepted model fit (Schermelleh-Engel et al., 2003). The marginally accepted Root Mean Squared Error of Approximation (RMSEA) values (between the reasonable fit of 0.05 and 0.08), that were found in the four final models, could be interpreted in accordance with the acceptable model fit. Since N was somewhat small, they may be of less concern if all other indices were in a range suggesting a “good” model fit. It is important to mention that the RMSEA is known to produce artificially large values for models with few degrees of freedom and small sample sizes (Bentler, 2005; Brown, 2015; Hu and Bentler, 1999).
3.3 Test of the internal structure/organization of the total first four scales of SRBCSS via confirmatory factor analyses application
It should be noted that the aforementioned second set models of CFA at the item-level data –although they verified the proposed by Renzulli et al. (2010) unifactorial structure for each of the first four scales of the Greek version of the SRBCSS – were limited (a) as regards the approach to correlating residuals, that was used, as this approach tends to violate assumptions of regressions and inflate the models’ fit, and (b) as regards the verification (at item-level data) of the SRBCSS organization in four underlying factors/latent variables (scales) and the test of the four factors (scales) correlations, as these correlations depict in confirmatory factor analysis (CFA) (at item-level data) structural model. Therefore, we conducted a set of confirmatory factor analyses, using all items from each of the four 6-point SRBCSS scales (38 items, total), trying to verify (at item-level data) the SRBCSS organization in the proposed – by their authors and Rogalla (2003) as well – four-factor structure. One path from every one of the 4 pertinent factors (scales) to each of every item that constitute it, was freed for each confirmatory factor analysis (CFA) model. Cross-loadings were not permitted. CFA was performed twice: At the first performance, latent factors were defined without any covariances between them (Measurement model). At the second performance, all the latent factors were allowed to freely intercorrelate (Structural model). For both models, the metric was set by fixing factor variances to 1.0.
Although, all parameters of both the measurement and structural model – that were conducted to test (at the item-level data) the SRBCSS organization in four underlying factors/latent variables (scales), as well as the four factors’ correlations – were found to be statistically significant (p < 0.05), the indices of the measurement model – except for the χ2/df ratio, which was accepted – were not accepted: Measurement model, χ2 (665, N = 141) = 1700.41, p < 0.001, χ2/df = 2.557, CFI = 0.73, SRMR = 0.37, RMSEA = 0.10 (CI90% 0.10–0.11).
On the contrary, the structural model was found to fit the data better: Structural model, χ2 (659, N = 141) = 1296.35, p < 0.001, χ2/df = 1.967, CFI = 0.83, SRMR = 0.07, RMSEA = 0.08 (CI90% 0.08–0.09). All parameters of the structural model were found to be statistically significant (p < 0.05) and the standardized root-mean-square residual (SRMR) value was equal to 0.07 indicating a good fit for the model tested. Similarly, the χ2/df ratio of the model fell to the range of 0.00–2.00 and was indicative of a good fit (Schermelleh-Engel et al., 2003). In addition, the root mean squared error of approximation (RMSEA) value was equal to 0.08 indicating also a marginally reasonable fit for the structural model. However, the comparative fit index (CFI) value – although it was equal to 0.83 and close enough to Rogalla’s (2003) CFI = 0.89 – indicated a non-accepted model fit for the structural model (Bentler, 2005; Brown, 2015; Hu and Bentler, 1999; Kline, 2003), through which we attempted to verify the SRBCSS organization in the proposed by Renzulli et al. (2010) and Rogalla (2003) four-factor structure.
It should be highlighted that this third set of CFAs at the total 38 item-level data was also limited as regards the identification of a second-order underlying factors’ number in which the SRBCSS four first-order factors’ (scales’) could be organized. The aforementioned findings could be explained regarding the sample size, which was somewhat small to permit the confirmation of a CFA structural model, at item level, for the total 38 items of the four scales.
Therefore, given that the second set of CFAs, that were conducted at the item-level, fully confirmed the unifactorial structure proposed by Renzulli et al. (2002) separately for each of the first four scales of the Greek version of the SRBCSS, and considering (a) Srour’s (1989) findings, where most SRBCSS items (29 out of 38) loaded onto a single factor, and (b) Caroff et al.’s (2006) results, which suggested a two-factor structure, rather than the originally proposed four-factor structure, we applied confirmatory factor analyses (CFA), at the scale-level data, to all four scales in order for us to be able to determine the number of the general latent variables (factors) underlying the organization of the first four scales of the Greek version of the SRBCSS. Because these analyses were based on scale-level data, rather than on item-level data, the total scores for the Learning, Creativity, Motivation, and Leadership scales – each previously validated as unifactorial – were treated as observed variables in the CFAs conduction.
At first, a CFA was conducted in order to confirm the aforementioned model with a single general factor (Model A). Results revealed that the unifactorial model provided an excellent fit for the first four scales of the Greek version of SRBCSS data [χ2 (2, N = 141) = 2.79, p = 0.248, χ2/df = 1.396, CFI = 1.00, SRMR = 0.01, RMSEA = 0.05 (CI90% 0.00–0.18)]. R2 values for the single general factor ranged from 0.54 to 0.83. Standardized loadings and residual variances for observed variables are presented in Figure 1.
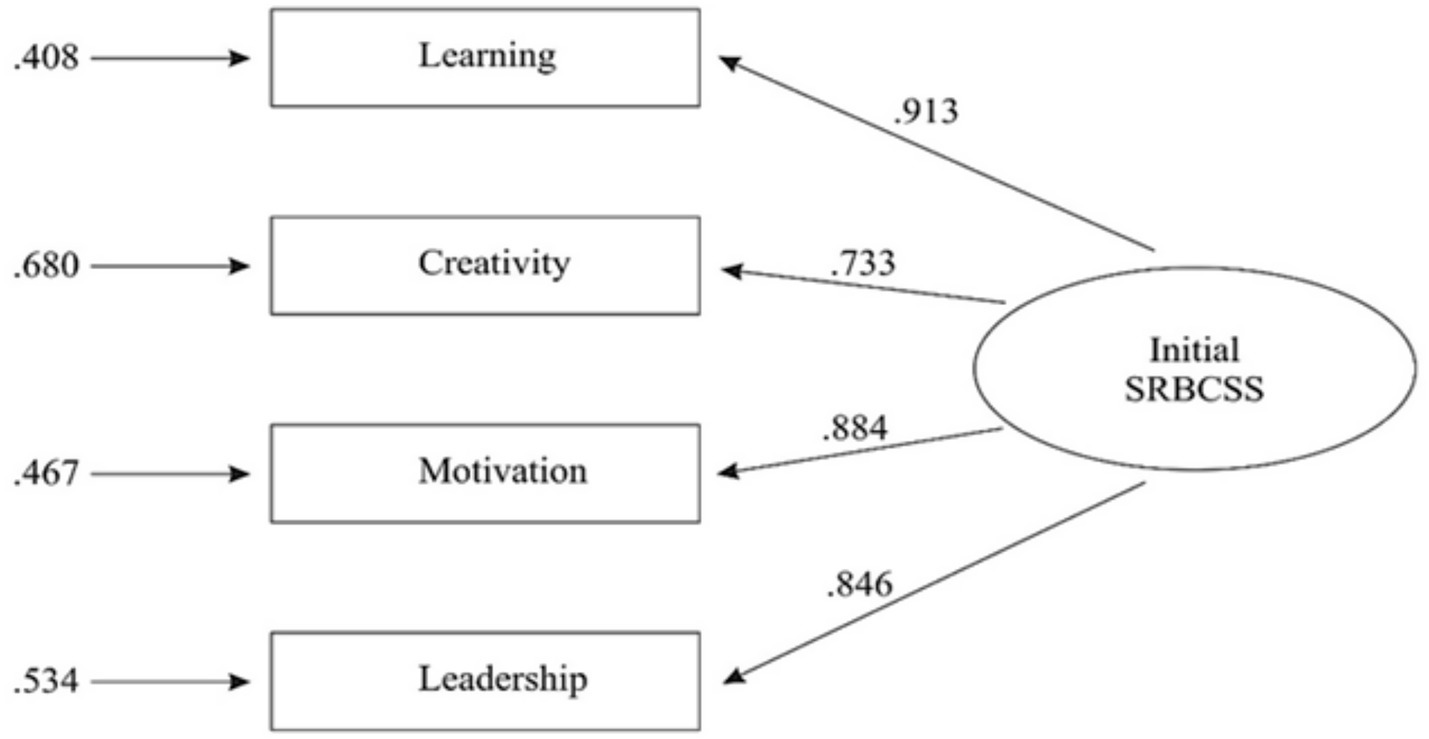
Figure 1. The one-factor CFA model (Model A) of the initial Scales for Rating the Behavioral Characteristics of Superior Students. Note: Initial SRBCSS: A general factor (latent variable) reflecting common variance in all ratings of the four initial SRBCSS.
In addition, we conducted a second CFA to test the alternative correlated two-factor model solution (Model B) proposed by Caroff et al. (2006), whose EFA results suggested that all items from the Learning and Creativity scales loaded onto one factor (F1), while a second factor (F2) was shared by items from the Motivation and Leadership scales. The indices of the correlated two-factor model were as follows: χ2 (1, N = 141) = 0.91, p = 0.340, χ2/df = 0.911, CFI = 1.00, SRMR = 0.01, RMSEA = 0.00 (CI90% 0.00–0.22), indicating also an excellent fit for the correlated two-factor model solution. Correlation between F1 and F2 was 0.96. R2 values for the correlated two-factor model ranged from 0.54 to 0.87. Standardized loadings and residual variances for the observed variables are presented in Figure 2.

Figure 2. The correlated two-factor CFA model (Model B) of the initial Scales for Rating the Behavioral Characteristics of Superior Students. Note: F1 SRBCSS: A general factor (latent variable) reflecting common variance in ratings of the two cognitive initial SRBCSS. F2 SRBCSS: A general factor (latent variable) reflecting common variance in ratings of the two non-cognitive initial SRBCSS.
As it was found that both A and B models presented satisfactory fit indices, we proceeded to compare the difference χ2(Δχ2) between the two models. The difference in χ2 between Model A and Model B Δχ2 (Δdf = 1) = 1.88 was not found to be statistically significant at the p < 0.05 level. Therefore, the two models seem to be considered as statistically equivalent.
3.4 Test of the internal consistency reliability of the four scales – Learning, Creativity, Motivation, Leadership – of the SRBCSS
At first, Cronbach’s alpha coefficients were used to assess the internal consistency reliability of the SRBCSS scales of Learning, Creativity, Motivation, and Leadership. The Cronbach’s α internal consistency coefficients of the four scales of the Greek version of the SRBCSS, for the corresponding sample of the present study, were good to excellent as they ranged between 0.883 and 0.942.
Except for (a) Cronbach’s alpha, we also took into account the following reliability coefficients that their calculation is available by EQS 6.1.: (b) Reliability Coefficient RHO; (c) Greatest Lower-Bound Reliability (GLB Reliability); (d) Bentler’s Dimension-Free Lower-Bound Reliability; (e) Shapiro’s Lower-Bound Reliability and (f) Hancock’s H coefficient. The specifics are as follows:
(1) for the “Learning” scale (number of items: 11):
(a) Cronbach’s α = 0.942,
(b) Reliability Coefficient RHO = 0.941,
(c) Greatest Lower-Bound Reliability (GLB Reliability) = 0.966,
(d) Bentler’s Dimension-Free Lower-Bound Reliability = 0.966,
(e) Shapiro’s Lower-Bound Reliability = 0.967,
(f) Hancock’s H coefficient = 0.93 (Hancock and Mueller, 2001; McNeish, 2018).
(2) for the “Creativity” scale (number of items: 9):
(a) Cronbach’s α = 0.908,
(b) Reliability Coefficient RHO = 0.916,
(c) Greatest Lower-Bound Reliability (GLB Reliability) = 0.946,
(d) Bentler’s Dimension-Free Lower-Bound Reliability = 0.946,
(e) Shapiro’s Lower-Bound Reliability = 0.953,
(f) Hancock’s H coefficient = 0.91 (Hancock and Mueller, 2001; McNeish, 2018).
(3) for the “Motivation” scale (number of items: 11):
(a) Cronbach’s α = 0.892,
(b) Reliability Coefficient RHO = 0.888,
(c) Greatest Lower-Bound Reliability (GLB Reliability) = 0.936,
(d) Bentler’s Dimension-Free Lower-Bound Reliability = 0.936,
(e) Shapiro’s Lower-Bound Reliability = 0.943,
(f) Hancock’s H coefficient = 0.89 (Hancock and Mueller, 2001; McNeish, 2018).
(4) for the “Leadership” scale (number of items: 7):
(a) Cronbach’s α = 0.883,
(b) Reliability Coefficient RHO = 0.889,
(c) Greatest Lower-Bound Reliability (GLB Reliability) = 0.917,
(d) Bentler’s Dimension-Free Lower-Bound Reliability = 0.917,
(e) Shapiro’s Lower-Bound Reliability = 0.919,
(f) Hancock’s H coefficient = 0.89 (Hancock and Mueller, 2001; McNeish, 2018).
3.5 Test of the inter-correlations of the four scales – Learning, Creativity, Motivation, Leadership – of the SRBCSS
In Table 1, the inter-correlations among the four scales of the SRBCSS are presented, as calculated at the aforementioned structural model that was conducted to test (at the item-level data) the SRBCSS organization in four underlying factors/latent variables (scales), as well as the four factors’ correlations. As presented in Table 1, all scale correlations were positive and statistically significant at the p = 0.05 level, indicating a strong interrelationship among the scales. The inter-correlations ranged from 0.70, observed between the Creativity and Leadership Scale, to 0.88 between the Learning and Motivation Scale (Table 1).
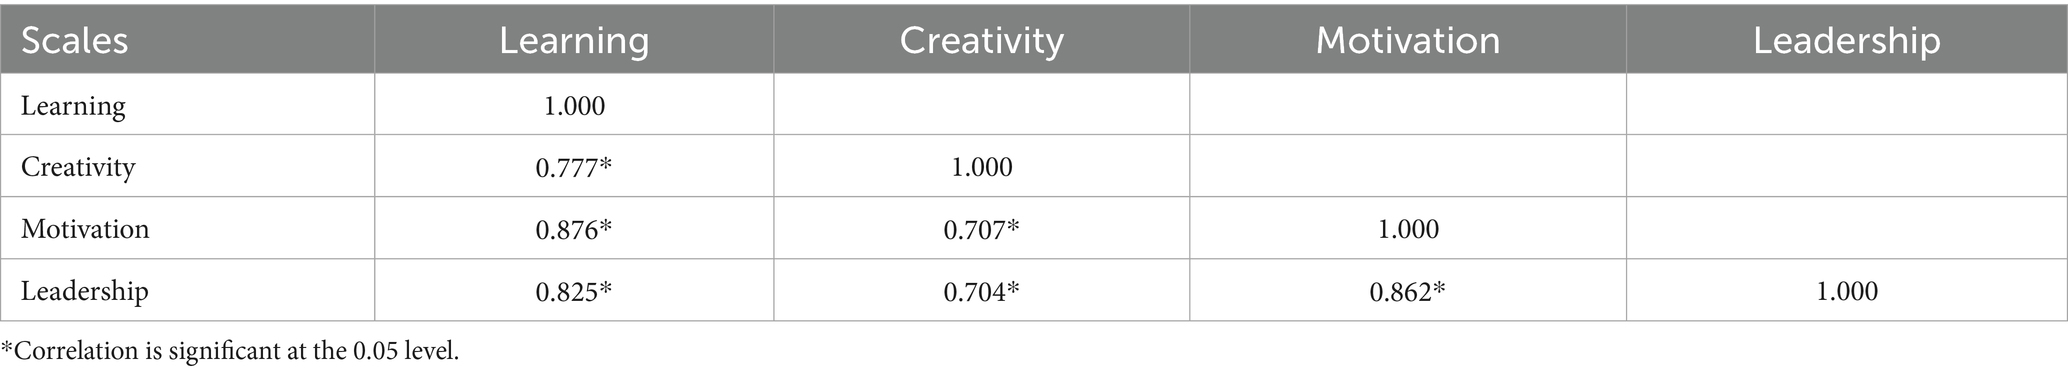
Table 1. Inter-correlations among the four scales of the SRBCSS as calculated in the structural model.
Additionally, the inter-correlations among the four scales of the SRBCSS were calculated using the Pearson correlation coefficient (r). As presented in Table 2, all scale correlations were positive and statistically significant at the p = 0.01 level, indicating a strong interrelationship among the scales. The inter-correlations ranged from 0.61, observed between the Creativity and Motivation Scale as well as the Creativity and Leadership Scale, to 0.80 between the Learning and Motivation Scale (Table 2).
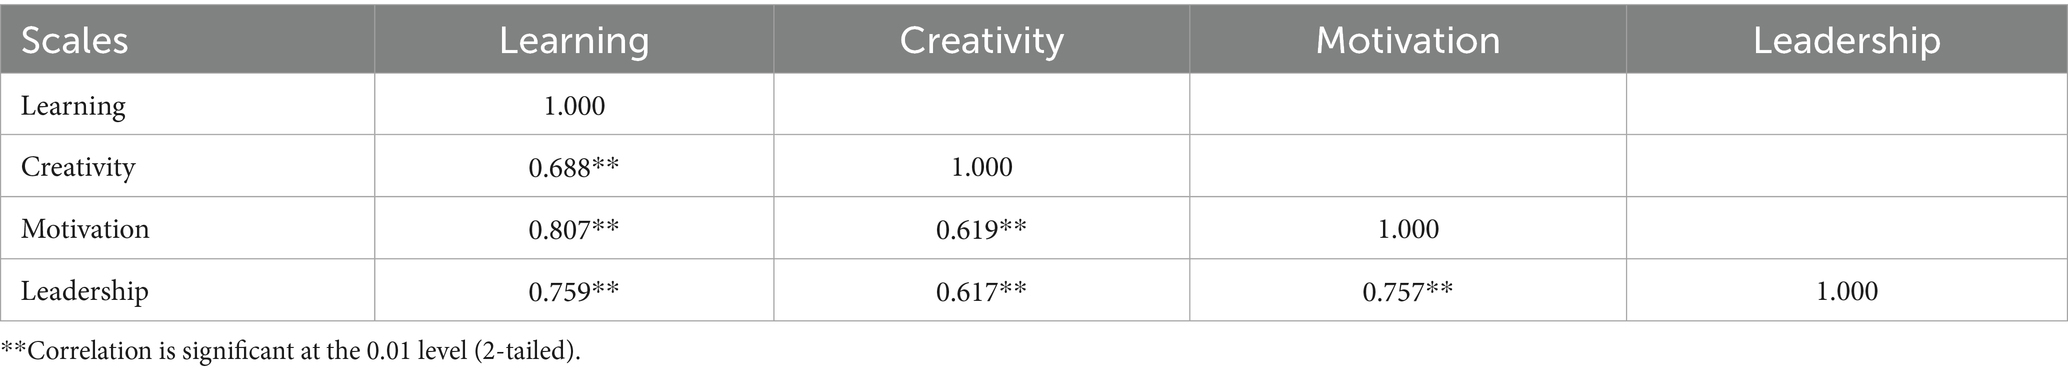
Table 2. Inter-correlations among the four scales of the SRBCSS as calculated using the Pearson correlation coefficient (r).
3.6 Test of the SRBCSS convergent validity
Finally, in order to test the convergent validity of the first four scales – Learning, Creativity, Motivation, and Leadership – of the Greek version of SRBCSS with the six scales of the Greek version of the GRS-School form (Pfeiffer and Jarosewich, 2003), the Pearson correlation coefficient (r) was conducted. The application of the Pearson correlation analysis revealed statistically significant mainly moderate correlations between the ratings on SRBCSS and GRS-S scales. Table 3 depicts the correlations between the four scales of the Greek version of the SRBCSS with the six GRS-S scales.
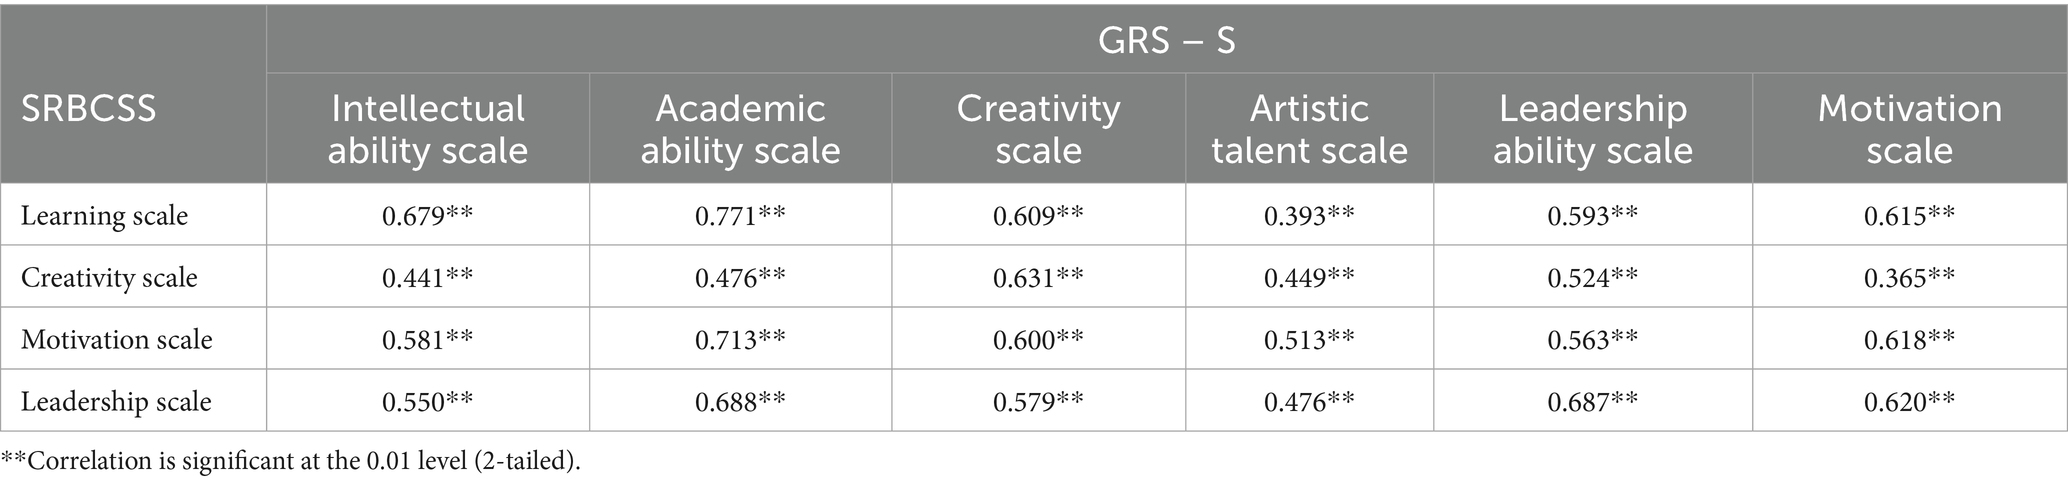
Table 3. Correlations among the first four scales – Learning, Creativity, Motivation, and Leadership – of SRBCSS and the six GRS-S scales.
4 Discussion
The aims of the study were the confirmation of the unifactorial structure for each of the first four scales – Learning, Creativity, Motivation, and Leadership – of the Greek version of the SRBCSS, as well as the test of their content validity, by examining the four scales correlations. Additionally, the number of underlying factors (latent variables) in their organization was examined at scale-level data. Finally, the internal consistency reliability of all four scales was evaluated, as well as their convergent validity with the GRS-S School Form.
Initially, the parallel analysis and the EFA abovementioned results revealed the unifactorial structure for each of the first four scales of the Greek version of the SRBCSS, proposed by Renzulli and his colleagues (2010). These findings are also comparable to those found by Rogalla (2003) for the German adaptation and by Kazem et al. (2014) for the Arabic adaptation. The conduction of separate CFAs further confirmed the unifactorial structure, revealed by the parallel analysis and the EFA, for each of the four SRBCSS scales – Learning, Motivation, Creativity and Leadership – in the sample of Greek primary and secondary education (elementary and middle school) school teachers, in line with the findings of Rogalla (2003) for the German adaptation. The results suggest that the four SRBCSS scales maintained the factorial structure originally proposed by their authors when applied to the current study’s sample. This finding offers promising support for the potential use of the first four scales of SRBCSS as a screening tool to identify distinct aspects of giftedness in primary and secondary education (elementary and middle school) students within the Greek population. Admittedly, Renzulli et al. (2010) conducted only an exploratory principal components analysis to explore the relationships between judgmentally developed categories and empirically derived constructs. The explanation provided by the authors suggests that derived constructs should be understood in the context of theoretical expectations informed by the literature review and the operational definitions developed during the content validity process (Gable and Wolf, 1993). As such, any factor analysis conducted to align with these theoretical categories serves a confirmatory function (as reported in the technical and administration manual of the SRBCSS; Renzulli et al., 2010).
In light of Srour’s (1989) single-factor solution and Caroff et al.’s (2006) two-factor solution – both derived via EFA to explain the majority of the variance in the first four SRBCSS scales – another aim of the present study was to determine whether similar general factor structures could be identified within the data of the present study. Because of the rather small sample size, we examined the number of underlying factors (latent variables) conducting factor analyses at scale-level data. A CFA model (Model A) fully confirmed the presence of one general factor, consistent with Srour’s (1989) findings. This general one-factor model may suggest that the first four scales of the SRBCSS primarily reflect a single multidimensional conceptualization of giftedness’s behavioral characteristics (both cognitive and motivational) in the Greek sample (Gresham et al., 2010). This stems from the fact that teachers assess a wide range of cognitive, academic, creative, and social abilities, along with personality traits, such as motivation and leadership, unavoidably creating a global perception of students’ abilities (Sofologi et al., 2023). We assume that when a teacher evaluates a student’s cognitive abilities or academic performance, their judgment is largely shaped by an overall impression of the student. This impression is primarily influenced by easily noticeable factors, such as how the student performs academically and behaves in the classroom. Other factors, such as the student’s overall intelligence – encompassing cognitive abilities and creativity – may also influence the teacher’s judgment (Golle et al., 2018). Besides, studies examining how teachers perceive and define giftedness, along with their practices for identifying gifted students, consistently emphasize the significant role of cognitive abilities, learning-related traits, and personality characteristics in shaping their judgments and choices (Baudson and Preckel, 2016; Golle et al., 2018; Matheis et al., 2017). At the same time, teacher judgments are subject to the influence of the “halo effect,” a cognitive bias whereby a teacher’s overall impression of a student systematically shapes the evaluation of specific attributes related to giftedness. Further investigation into employing objective behavioral assessments across the various domains of giftedness is required to adequately address this question (Benson and Kranzler, 2017; Rothenbusch et al., 2018).
Regarding the correlated two-factor model solution (Model B), the indices of the CFA model indicated also an excellent fit. Both Learning and Creativity scales’ total scores were organized under the same factor while a second factor was shared by the total scores of the Motivation and Leadership scales, in line with Caroff et al.’s (2006) findings. Focusing on the first factor, researchers widely agree that learning and creativity are closely related constructs (Guilford, 1950; McClelland, 1975; Ripple, 1977) and that they reinforce each other in a reciprocal manner (Beghetto, 2016b). Both can be conceptualized as processes and products (Beghetto, 2016a; Gajda et al., 2017; Sternberg, 1999). As Guilford (1950) noted, a creative act (product) reflects a learning process, as it involves a change in behavior. Similarly, learning (as a product) can be viewed as a creative process when it results in personally meaningful transformations of prior understanding (Beghetto, 2016a). Thus, there seems to be a significant conceptual overlap between creativity and learning (Beghetto, 2013), which explains their organization under the same factor. The second factor includes Motivation and Leadership. Research has shown that gifted students tend to exhibit higher levels of motivation than their typically developing peers (Bergold et al., 2020; Gottfried and Gottfried, 1996; Guez et al., 2018). Additionally, Leadership ability is commonly defined as a set of attributes that activate an individual’s predisposition to engage in effective leadership behaviors across various contexts. These attributes are typically grouped into three domains: cognitive (e.g., attention, problem-solving, metacognition), social (e.g., delegation, negotiation, feedback), and motivational (e.g., emotion regulation, resilience, self-efficacy; Zaccaro et al., 2013). Chan (1999) introduced the concept of Motivation to Lead (MTL), which refers to an individual’s willingness to assume leadership roles and the intensity and persistence of effort directed toward such responsibilities. MTL is conceptualized as an emotional state that influences an individual’s commitment to leadership -related tasks (Chan and Drasgow, 2001). The motivational component, in particular, enables leaders to sustain effectiveness under stress and manage the challenges inherent in leadership roles. Although Motivation is essential to Leadership, it has received less empirical attention compared to the cognitive and social domains (Santos and Porto, 2023). Hence, it can be assumed that Motivation and Leadership are related. Still, further research is needed to better understand the nature and scope of this relationship. The factor that accounted for the variance of the total scores of Learning and Creativity scales, can be interpreted as a cognitive ability factor, while the second factor includes Motivation and Leadership, and although is seemingly non-cognitive in nature (Benson and Kranzler, 2017), is absolutely correlated (almost identically: 0.96) with the cognitive ability factor.
Indeed, in both the abovementioned one-factor and correlated two-factor models (Models A & B), a mainly intellectual/cognitive, in nature, factor was identified, which, according to previous research (Baudson and Preckel, 2016; Golle et al., 2022; Matheis et al., 2017), is closely linked to teachers’ evaluations. In addition, both models demonstrated a comparably excellent fit for the data (at scale-level) from the first four scales of the Greek version of the SRBCSS. Nonetheless, it’s important to distinguish between dimensionality and interpretability, as the dimensions that constitute multidimensional scores need to exhibit sufficient unique and reliable variance in order to be meaningfully interpreted (Benson and Kranzler, 2017; Rodriguez et al., 2016). In the one-factor CFA model, the R2 values for the single general factor ranged from 0.54 to 0.83, indicating that the instrument primarily measures a broad, overarching factor. Furthermore, R2 values for the correlated two-factor CFA model also ranged from 0.54 to 0.87, and the strong correlation (0.96) between the two factors indicated that they may not represent sufficiently distinct latent constructs regarding the cognitive (Learning/Creativity) and non-cognitive (Motivation / Leadership) specific behavioral characteristics of superior students.
Although the two CFA models seem to be statistically equivalent, based on the marginal confirmation of the CFA structural model, that was run at item level, for the total 38 items of the four scales and on considerations outlined above, we would suggest the one-factor solution, as it appears to provide a stronger theoretical background and is consistent with prior research on teachers’ judgments in identifying gifted students (Baudson and Preckel, 2016; Golle et al., 2018; Matheis et al., 2017). As has already been mentioned, a considerable amount of research on the structural validity of the SRBCSS has been conducted in various countries, mainly through EFA. However, the fact that no results of factor analyses of the internal structure/organization of the SRBCSS, as a whole, in the United States have been published and – to our knowledge – only one study explored, via CFAs conduction, the internal structure/organization of the first four scales – Learning, Creativity, Motivation, and Leadership – of the SRBCSS (Rogalla, 2003), questions concerning the structure/organization as a whole of the first four scales of the SRBCSS still remain, whether they measure four distinct constructs or a general global dimension.
With respect to the internal consistency reliability for the four scales of the Greek version of the SRBCSS, all the indices were good and comparable to those found in the American SRBCSS (Renzulli et al., 2010), as well as by Rogalla (2003) for the German adaptation and by Kazem et al. (2014) and Jaffal et al. (2021) for the Arabic adaptation.
Additionally, the analysis of the correlations among the first four scales of the Greek version of the SRBCSS revealed that all four scales had a statistically significant moderate/high positive association with one another. The Learning scale exhibited the highest correlations with the other scales. The Motivation scale showed the strongest correlation with Learning scale. Admittedly, motivation has been found to have impact on successful learning (Hattie, 2009). These findings support the interconnected nature of cognitive, motivational, and leadership-related traits of one’s high-level potential (Sofologi et al., 2022). None of the correlations reached or exceeded 0.90, supporting their discriminant validity and indicating that each scale measures a sufficiently distinct construct (Kline, 2003). Our findings are fairly comparable to those found by Renzulli et al. (2010), who found a moderate correlation between Learning and Creativity scales and a weak correlation between Learning and Leadership scales.
Lastly, the test of the convergent validity of the first four scales – Learning, Creativity, Motivation, and Leadership – of the Greek version of SRBCSS with the six scales of the Greek version of the GRS-School form (Pfeiffer and Jarosewich, 2003), through Pearson correlation analysis, revealed statistically significant moderate correlations between the ratings on SRBCSS and GRS-S scales. Our findings are not quite consistent to those of Pfeiffer and Jarosewich (2003), who have found high correlations of the Creativity, Motivation, and Leadership scales of the American SRBCSS with the six GRS-S scales. However, to our view, the moderate correlations, that have been found in the Greek sample, support further the convergent validity and the necessity of the use, as screening tools, of both the SRSCSS and the GRS-S scales, in the Greek context.
In light of the previously discussed findings, Learning, Creativity, Motivation and Leadership scales of the Greek version of the SRBCSS were found to retain their separate one-factor structure proposed by Renzulli et al. (2010), when administered to the Greek sample of the present study. Furthermore, the outcomes derived from the scale-level one-factor and correlated two-factor models substantiate the proposition that each of the four SRBCSS scales predominantly measures a common set of global behavioral (both cognitive and non-cognitive) characteristic of giftedness (Margulies and Floyd, 2004). Besides, all four scales of SRBCSS demonstrated good internal consistency and satisfactory discriminant validity in the Greek sample. Thus, the first four scales of the Greek version of the SRBCSS may serve as an effective screening tool, utilized by teachers, for identifying gifted learners within the Greek educational context, in parallel with the evaluation of cognitive abilities. Well-constructed rating scales help transform a teacher’s subjective impressions into more objective evaluations by linking them to clearly defined behaviors. The objectivity of judgments about certain behavioral characteristics that demonstrate giftedness depends largely on the quality of the scoring scale used and the skill of the teacher. Research indicates that when teachers have a clear understanding of giftedness and its behavioral indicators, their assessments tend to be more inclusive and accurate (Lee et al., 2022). Therefore, educators working with gifted students require training in identifying the signs of giftedness, along with ongoing, research-informed professional development (Lee et al., 2022; Renzulli et al., 2010). This professional development should encompass inclusive, diversity-responsive practices; access to adequate resources; participation in professional learning communities; the application of research on psychosocial development; the creation of culturally responsive curricula; critical reflection on personal and historical biases; and adherence to ethical standards that promote equity and access (Johnsen et al., 2022). Through such preparation, teachers will be equipped to support students’ individual interests, strengths, and developmental differences by creating learning environments and instructional activities that allow students to demonstrate a wide range of gifts and talents. Additionally, by employing various formative and summative assessments aligned with students’ interests, educators can design learning experiences that foster social, emotional, and psychosocial skills essential to the talent development process (Ferguson, 2015). Furthermore, SRBCSS scales offer multiple sources of information regarding giftedness, recognizing the critical role of teacher ratings, since exceptional abilities are not always captured by conventional IQ assessments (Renzulli, 2011; Renzulli and Gaesser, 2015; Smedsrud, 2020). Ultimately, the combination of SRBCSS data with cognitive ability assessments and academic performance measures can enable teachers to design and implement effective educational strategies for gifted and talented students within the current curriculum framework. Given that access to psychometrically sound identification tools marks a step forward for gifted education in Greece, the practical implications of this study include the provision of a reliable and valid instrument for identifying potential giftedness.
Some limitations of the study presented in this paper include the small sample size of teachers who participated and the absence of measures assessing students’ cognitive and academic performance, creativity, motivation, and leadership, which could verify the convergent validity of Learning, Motivation, Creativity and Leadership of the Greek version of the SRBCSS with the Greek version of GRS-S. Given that this preliminary study is part of a broader experimental framework, further research with a larger sample is warranted to more reliably validate the diagnostic utility of the Learning, Creativity, Motivation, and Leadership scales of the Greek version of the SRBCSS within the Greek educational context. Moreover, incorporating objective external criteria will enhance the empirical support for the convergent validity between the Greek version of SRBCSS and the Greek version of the GRS-S. Another limitation is the potential cultural bias in the SRBCSS. Although our preliminary findings demonstrate the structural validity and internal consistency reliability of the Greek version of the SRBCSS as a diagnostic instrument for identifying gifted students within the Greek educational context, the limited cultural adaptation may affect its external validity. Teachers’ interpretations of giftedness can be influenced by their cultural values, beliefs, lived experiences, communication styles, and preferred teaching and learning approaches. Additionally, language plays a critical role in how SRBCSS items are understood, as cultural and social norms can shape how teachers interpret the wording of these items (Kim and Zabelina, 2015). As such, a key objective of our future research is to undertake a comprehensive cultural adaptation of the SRBCSS including modifications to specific items that might also reflect the unique characteristics of gifted students in the Greek educational context. Another key objective of our future research would be to parcel the SRBCSS items into manifest variables to address the cases-to-variables ratio in order to be able to apply further factor analyses.
Notwithstanding its limitations, the present study represents the first empirical effort to validate the initial scales of SRBCSS in the Greek population of teachers and students. The results provide support for the psychometric properties of the instrument and underscore its reliable and valid potential applicability in the identification and evaluation of gifted students, by their teachers, in Greek educational settings.
Data availability statement
The raw data supporting the conclusions of this article will be made available by the authors, without undue reservation.
Ethics statement
The studies involving humans were approved by Scientific and Ethics Committee of the University of Ioannina (25847/01/06/2021). The studies were conducted in accordance with the local legislation and institutional requirements. Written informed consent for participation in this study was provided by the participants’ legal guardians/next of kin.
Author contributions
ER: Conceptualization, Methodology, Validation, Writing – original draft, Writing – review & editing. TF: Data curation, Investigation, Writing – original draft. AG: Data curation, Investigation, Writing – original draft. AT: Data curation, Investigation, Writing – original draft. AD: Data curation, Writing – review & editing. OF: Data curation, Writing – review & editing. CB: Data curation, Writing – review & editing. MSt: Data curation, Writing – review & editing. AP: Data curation, Writing – review & editing. FV: Data curation, Writing – review & editing. ID: Data curation, Writing – review & editing. MT: Data curation, Writing – review & editing. KS: Data curation, Writing – review & editing. MD: Formal analysis, Project administration, Writing – review & editing. EK: Formal analysis, Project administration, Writing – review & editing. TM: Data curation, Writing – review & editing. HZ: Resources, Writing – review & editing. EE: Formal analysis, Writing – review & editing. DK: Formal analysis, Writing – review & editing. GK: Resources, Writing – review & editing. DM: Visualization, Writing – review & editing. MSo: Formal analysis, Writing – review & editing. GP: Conceptualization, Investigation, Methodology, Project administration, Supervision, Validation, Writing – review & editing, Writing – original draft.
Funding
The author(s) declare that no financial support was received for the research and/or publication of this article.
Conflict of interest
The authors declare that the research was conducted in the absence of any commercial or financial relationships that could be construed as a potential conflict of interest.
Generative AI statement
The authors declare that no Gen AI was used in the creation of this manuscript.
Any alternative text (alt text) provided alongside figures in this article has been generated by Frontiers with the support of artificial intelligence and reasonable efforts have been made to ensure accuracy, including review by the authors wherever possible. If you identify any issues, please contact us.
Publisher’s note
All claims expressed in this article are solely those of the authors and do not necessarily represent those of their affiliated organizations, or those of the publisher, the editors and the reviewers. Any product that may be evaluated in this article, or claim that may be made by its manufacturer, is not guaranteed or endorsed by the publisher.
Footnotes
References
Acar, S., Sen, S., and Cayirdag, N. (2016). Consistency of the performance and nonperformance methods in gifted identification: a multilevel meta-analytic review. Gift. Child Q. 60, 81–101. doi: 10.1177/0016986216634438
Almeida, L. S., Araújo, A. M., Sainz-Gómez, M., and Prieto, M. D. (2016). Challenges in the identification of giftedness: issues related to psychological assessment. Ann. Psychol. 32, 621–627. doi: 10.6018/analesps.32.3.259311
Al-Momani, H., and Al-Oweidi, A. (2020). The psychometric characteristics of the Renzulli scale of Behavioral characteristics (3rd edition) in the detection of gifted students in the age group (12-18) in Jordan. J. Educ. Gifted Young Sci 8, 105–132. doi: 10.17478/jegys.656673
Bakheit, S. E. F. A. (2013). Developing a Saudi version of the new four scales for rating the behavioral characteristics of superior students. Gift. Educ. Int. 31, 102–116. doi: 10.1177/0261429413491482
Bandalos, D. L. (2021). Item meaning and order as causes of correlated residuals in confirmatory factor analysis. Struct. Equ. Model. 28, 903–913. doi: 10.1080/10705511.2021.1916395
Basto, M., and Pereira, J. M. (2012). An SPSS R-menu for ordinal factor analysis. J. Stat. Softw. 46, 1–29. doi: 10.18637/jss.v046.i04
Baudson, T. G., and Preckel, F. (2016). Teachers’ conceptions of gifted and average-ability students on achievement-relevant dimensions. Gift. Child Q. 60, 212–225. doi: 10.1177/0016986216647115
Beghetto, R. A. (2013). Killing ideas softly? The promise and perils of creativity in the classroom. Charlotte, NC: Information Age Publishing.
Beghetto, R. A. (2016a). Creative learning: a fresh look. J. Cogn. Educ. Psychol. 15, 6–23. doi: 10.1891/1945-8959.15.1.6
Beghetto, R. A. (2016b). Big wins, small steps: How to Lead for and with creativity. Thousand Oaks, CA: Corwin Press.
Benson, N. E., and Kranzler, J. H. (2017). Another look at the construct validity of the gifted rating scales: preschool/kindergarten and school forms. J. Psychoeduc. Assess. 36, 782–797. doi: 10.1177/0734282917710377
Bentler, P. M. (1990). Comparative fit indexes in structural models. Psychol. Bull. 107, 238–246. doi: 10.1037/0033-2909.107.2.238
Bentler, P. M. (2005). EQS 6.1. Structural equations program manual. Encino: Multivariate software Inc.
Bergold, S., Wirthwein, L., and Steinmayr, R. (2020). Similarities and differences between intellectually gifted and average-ability students in school performance, motivation, and subjective well-being. Gift. Child Q. 64, 285–303. doi: 10.1177/0016986220932533
Binet, A., and Simon, T. (1916). ““The development of intelligence in the child” (L'Année psych., 1908, pp. 1-90)” in The development of intelligence in children (the Binet-Simon scale). eds. A. Binet, T. Simon, and E. S. Kite (Baltimore, MA: Williams & Wilkins Co), 182–273.
Bracken, B. A., and Brown, E. F. (2006). Behavioral identification and assessment of gifted and talented students. J. Psychoeduc. Assess. 24, 112–122. doi: 10.1177/0734282905285246
Bronfenbrenner, U. (1979). The ecology of human development: Experiments in nature and design. Cambridge, MA: Harvard University Press.
Bronfenbrenner, U., and Evans, G. W. (2000). Developmental science in the 21st century: emerging questions, theoretical models, research designs and empirical findings. Soc. Dev. 9, 115–125. doi: 10.1111/1467-9507.00114
Brown, T. A. (2015). Confirmatory factor analysis for applied research. New York: Guilford Publications.
Brown, M. W., and Cudeck, R. (1993). “Alternative ways of assessing model fit” in Testing structural equation models. eds. K. A. Bollen and J. S. Long (Newbury Park, CA: Sage), 136–162.
Burke, J. P., Haworth, C. E., and Ware, W. B. (1982). Scale for rating behavioral characteristics of superior students: an investigation of factor structure. J. Spec. Educ. 16, 477–485. doi: 10.1177/002246698201600411
Callegari, B. (2019). Adaptação e evidências de validade de conteúdo das escalas para avaliação das características comportamentais de estudantes com habilidades superiores [Adaptation and content validity evidence of scales for evaluating behavioral characteristics of students with superior abilities]. [Master’s thesis], Bauru (Brazil): Universidade Estadual Paulista. Available online at: https://repositorio.unesp.br/entities/publication/6d5d0765-8ad1-442e-b233-cf9cadf3f78a.
Cao, T. H., Jung, J. Y., and Lee, J. (2017). Assessment in gifted education: a review of the literature from 2005 to 2016. J. Adv. Acad. 28, 163–203. doi: 10.1177/1932202x17714572
Caroff, X., Jouffray, C., Jilinskaya, M., and Fernandez, G. (2006). Identification multidimensionnelle du haut potentiel: Mise au point d’une version française des échelles d’évaluation des caractéristiques de comportement des élèves surdoués [Multidimensional identification of high potential: Development of a French version of the rating scales for evaluating gifted students’ behavioral characteristics]. Bull. Psychol. 485, 469–480. doi: 10.3917/bupsy.485.0469
Chan, K. Y. (1999). Toward a theory of individual differences and leadership: Understanding the motivation to lead (doctoral dissertation). Champaign, IL: University of Illinois.
Chan, D. W. (2000). Exploring identification procedures of gifted students by teacher ratings: parent ratings and student self-reports in Hong Kong. High Abil. Stud. 11, 69–82. doi: 10.1080/713669176
Chan, D. W. (2001). Assessing giftedness of Chinese secondary students in Hong Kong: a multiple intelligences perspective. High Abil. Stud. 12, 215–234. doi: 10.1080/13598130120084348
Chan, K. Y., and Drasgow, F. (2001). Toward a theory of individual differences and leadership: understanding the motivation to lead. J. Appl. Psychol. 86, 481–498. doi: 10.1037/0021-9010.86.3.481
Courtney, M. G. R. (2013). Determining the number of factors to retain in EFA: using the SPSS R-menu v2.0 to make more judicious estimations. Pract. Assess. Res. Eval. 18:8. doi: 10.7275/9cf5-2m72
Crawford, B. F., Snyder, K. E., and Adelson, J. L. (2019). Exploring obstacles faced by gifted minority students through Bronfenbrenner’s bioecological systems theory. High Abil. Stud. 31, 43–74. doi: 10.1080/13598139.2019.1568231
Cunningham, C. M., Callahan, C. M., Plucker, J. A., Roberson, S. C., and Rapkin, A. (1998). Identifying Hispanic students of outstanding talent: psychometric integrity of a peer nomination form. Except. Child. 64, 197–209. doi: 10.1177/001440299806400204
Dai, D. Y. (2018). “A history of giftedness: paradigms and paradoxes” in Handbook of giftedness in children: Psychoeducational theory, research, and best practices. ed. S. I. Pfeiffer (Cham: Springer), 1–14.
Fan, X., and Sivo, S. A. (2007). Sensitivity of fit indices to model misspecification and model types. Multivar. Behav. Res. 42, 509–529. doi: 10.1080/00273170701382864
Feldhusen, J. F. (1986). “A conception of giftedness” in Conceptions of giftedness. eds. R. J. Sternberg and J. E. Davidson (Cambridge: Cambridge University Press), 112–127.
Feldhusen, J. F. (1998). “A conception of talent and talent development” in Talent in context: Historical and social perspectives on giftedness. eds. R. C. Friedman and K. B. Rogers (Washington, DC: American Psychological Association), 193–211.
Feldman, D. H. (1992). “Intelligences, symbol systems, skills, domains, and fields: a sketch of a developmental theory of intelligence” in Proceedings from the Edyth bush symposium on intelligence: Theory into practice, blue printing for the future. eds. H. C. Roselli and G. A. MacLauchlan (Tampa: University of South Florida), 37–43.
Feldman, D. H. (2000). “The development of creativity” in Handbook of creativity. ed. R. J. Sternberg (Cambridge, UK: Cambridge University Press), 169–189.
Ferguson, S. K. (2015). “Affective education: addressing the social and emotional needs of gifted students in the classroom” in Methods and materials for teaching the gifted. eds. F. Karnes and S. Bean (Waco, TX: Prufrock Press), 479–512.
Gable, R. K., and Wolf, M. B. (1993). Instrument development in the affective domain: Measuring attitudes and values in corporate and school settings. New York: Springer.
Gagné, F. (2004). Transforming gifts into talents: the DMGT as a developmental theory. High Abil. Stud. 15, 119–147. doi: 10.1080/1359813042000314682
Gagné, F., Bégin, J., and Talbot, L. (1993). How well do peers agree among themselves when nominating the gifted or talented? Gift. Child Q. 37, 39–45. doi: 10.1177/001698629303700106
Gajda, A., Beghetto, R. A., and Karwowski, M. (2017). Exploring creative learning in the classroom: a multi-method approach. Think. Ski. Creat. 24, 250–267. doi: 10.1016/j.tsc.2017.04.002
Gentry, M. L., Pereira, N., McIntosh, J. S., and Fugate, M. C. (2015). HOPE teacher rating scale: involving teachers in equitable identification of gifted and talented students in K-12. New York: Routledge.
Gilliam, J. E., Carpenter, B. O., and Christensen, J. R. (1996). Gifted and talented evaluation scales. Waco, TX: Prufrock Press.
Golle, J., Schils, T., Borghans, L., and Rose, N. (2022). Who is considered gifted from a teacher’s perspective? A representative large-scale study. Gifted Child Q. 67, 64–79. doi: 10.1177/00169862221104026
Golle, J., Zettler, I., Rose, N., Trautwein, U., Hasselhorn, M., and Nagengast, B. (2018). Effectiveness of a “grass roots” statewide enrichment program for gifted elementary school children. J. Res. Educ. Eff. 11, 375–408. doi: 10.1080/19345747.2017.1402396
Gottfried, A. E., and Gottfried, A. W. (1996). A longitudinal study of academic intrinsic motivation in intellectually gifted children: childhood through early adolescence. Gifted Child Q. 40, 179–183. doi: 10.1177/001698629604000402
Gresham, F. M., Elliott, S. N., Cook, C. R., Vance, M. J., and Kettler, R. (2010). Cross-informant agreement for ratings for social skill and problem behavior ratings: an investigation of the social skills improvement system–rating scales. Psychol. Assess. 22, 157–166. doi: 10.1037/a0018124
Guez, A., Peyre, H., Le Cam, M., Gauvrit, N., and Ramus, F. (2018). Are high-IQ students more at risk of school failure? Intell. 71, 32–40. doi: 10.1016/j.intell.2018.09.003
Hancock, G. R., and Mueller, R. O. (2001). “Rethinking construct reliability within latent variable systems” in Structural equation modeling: Present and future. eds. R. Cudeck, S. Du Toit, and D. Sörbom (Lincolnwood, IL: Scientific Software International), 195–216.
Harter, S. (1982). The perceived competence scale for children. Child Dev. 53, 87–97. doi: 10.2307/1129640
Hattie, J. (2009). Visible learning: A synthesis of over 800 meta-analyses relating to achievement. London: Routledge.
Heller, K. A., Perleth, C., and Lim, T. K. (2005). “The Munich model of giftedness designed to identify and promote gifted students” in Conceptions of giftedness. eds. R. J. Sternberg and J. E. Davidson. 2nd ed (New York, NY: Cambridge University Press), 172–197.
Hernández-Torrano, D., Ferrándiz, C., Ferrando, M., Prieto, L., and del Carmen Fernández, M. (2014). The theory of multiple intelligences in the identification of high-ability students. An. Psicol. 30, 192–200. doi: 10.6018/analesps.30.1.148271
Hodges, J., Tay, J., Maeda, Y., and Gentry, M. (2018). A meta-analysis of gifted and talented identification practices. Gift. Child Q. 62, 147–174. doi: 10.1177/0016986217752107
Horn, J. L. (1965). A rationale and test for the number of factors in factor analysis. Psychometrika 30, 179–185. doi: 10.1007/BF02289447
Hu, L., and Bentler, P. M. (1999). Cutoff criteria for fit indexes in covariance structure analysis: conventional criteria versus new alternatives. Struct. Equ. Model. 6, 1–55. doi: 10.1080/10705519909540118
International Test Commission (2017). The ITC guidelines for translating and adapting tests. 2nd Edn. England: International Test Commission.
Jaffal, A. F., Abu-Hilal, M., and Al-Naimi, M. N. (2021). Construct validity and reliability of the scales for rating the behavioral characteristics of superior students among a sample of elementary students in Qatar. Gift. Educ. Int. 37, 290–304. doi: 10.1177/02614294211013441
Jin, H. J., and Choe, H. S. (2010). Development and validation of the Korean version of scales for rating the Behavioral characteristics of superior students (K-SRBCSS). J. Gifted Educ. 20, 621–647.
Johnsen, S. K., Dailey, D., and Cotabish, A. (2022). NAGC pre-K–grade 12 gifted education programming standards. New York: Routledge.
Jöreskog, K. G., and Sörbom, D. (1997). LISREL 8: User’s reference guide. Lincolnwood, IL: Scientific Software International.
Kaufman, S. B. (2013). Opening up openness to experience: a four-factor model and relations to creative achievement in the arts and sciences. J. Creat. Behav. 47, 233–255. doi: 10.1002/jocb.33
Kaufman, S. B., and Sternberg, R. J. (2018). “Theories and conceptions of giftedness” in Handbook of giftedness in children: Psychoeducational theory, research, and best practices. ed. S. I. Pfeiffer (Cham: Springer), 1–14.
Kaya, F. (2013). The role of peer nomination forms in the identification of lower elementary gifted and talented students. Educ. Res. Rev. 8, 2260–2269. Available at: https://academicjournals.org/journal/ERR/article-authors/7283ADF42505
Kaya, F., and Delen, E. (2014). A computer-based peer nomination form to identify gifted and talented students. Australas. J. Gift. Educ. 23, 29–36. https://search.informit.org/doi/abs/10.3316/ielapa.122851309921044
Kazem, A. M., Alzubaidi, A. S., Hemdan, A. H., and Renzulli, J. (2014). The factor structure of the scales for rating the behavioural characteristics of superior students (SRBCSS): results on an Omani sample. Int. J. Talent Dev. Creat. 2, 127–136. Available at: http://www.ijtdc.net/index.php/e-copies/ijtdc-2-1-2014
Kim, K. H., and Zabelina, D. (2015). Cultural bias in assessment: can creativity assessment help? Int. J. Crit. Pedagog. 6, 129–148. Available at: https://janeway.uncpress.org/ijcp/article/id/724/
Klein, B., and Fodor, S. (2019). Talent tiles: a new descriptive talent identification instrument based on teachers’ ratings. New Dir. Child Adolesc. Dev. 168, 11–25. doi: 10.1002/cad.20317
Kline, R. B. (2003). Principles and practice of structural equation Modeling. New York: Guilford Publications.
Ku‐Yu, H. S. Y., Shek, D. T. L., and Yung, K. K. (1994). The Hong Kong Chinese Behavioral Checklist for Parents (HKBC‐P). Hong Kong: Hong Kong Government.
Labãr, A. V., and Frumos, F. V. (2013). Adaptation and validation of the scales for rating the Behavioral characteristics of superior students (SRBCSS) for self - assessment on a Romanian sample. Analele Stiintifice Universitatea Alexandru Ioan Cuza- Secţ. Ştiinţele Educaţiei, No. 17, pp. 103–116.
Larroder, A., and Ogawa, M. (2015). The development of a self-evaluation checklist for measuring Filipino students’ science giftedness. Asia Pac. Sci. Educ. 1:5. doi: 10.1186/s41029-015-0002-0
Lee, H., Seward, K., and Gentry, M. (2022). Equitable identification of underrepresented gifted students: the relationship between students’ academic achievement and a teacher-rating scale. J. Adv. Acad. 33, 400–432. doi: 10.1177/1932202X221088816
Makel, M. C., Snyder, K. E., Thomas, C., Malone, P. S., and Putallaz, M. (2015). Gifted students’ implicit beliefs about intelligence and giftedness. Gift. Child Q. 59, 203–212. doi: 10.1177/0016986215599057
Margulies, A. S., and Floyd, R. G. (2004). Test review: the gifted rating scales. J. Psychoeduc. Assess. 22, 275–282. doi: 10.1177/073428290402200306
Marsili, F., and Pellegrini, M. (2022). The relation between nominations and traditional measures in the gifted identification process: a meta-analysis. Sch. Psychol. Int. 43, 321–338. doi: 10.1177/01430343221105398
Matheis, S., Kronborg, L., Schmitt, M., and Preckel, F. (2017). Threat or challenge? Teacher beliefs about gifted students and their relationship to teacher motivation. Gift. Talented Int. 32, 134–160. doi: 10.1080/15332276.2018.1537685
McNeish, D. (2018). Thanks coefficient alpha, we’ll take it from here. Psychol. Methods 23, 412–433. doi: 10.1037/met0000144
Milic, S., and Simeunovic, V. (2022). Concordance between giftedness assessments by teachers, parents, peers and the self-assessment using multiple intelligences. High Abil. Stud. 33, 1–19. doi: 10.1080/13598139.2020.1832445
Mönks, F. J. (1992). “Development of gifted children: the issue of identification and programming” in Proceedings of the ninth world conference on gifted and talented children talent for the future. eds. F. J. Mönks and W. A. M. Peters (Assen, The Netherlands: Van Gorcum), 191–202.
Nagai, Y., Nomura, K., Nagata, M., Ohgi, S., and Iwasa, M. (2014). Children’s perceived competence scale reference values in Japan. J. Child Health Care 19, 532–541. doi: 10.1177/1367493513519295
Paunonen, S. V., and O’Neill, T. A. (2010). Self-reports, peer ratings and construct validity. Eur. J. Personal. 24, 189–206. doi: 10.1002/per.751
Pfeiffer, S. I. (2015). Tripartite model of giftedness and best practices in gifted assessment. Rev. Educ. 368, 61–87. doi: 10.4438/1988-592X-RE-2015-368-293
Pfeiffer, S. I., and Jarosewich, T. (2003). Gifted rating scales. San Antonio, TX: The Psychological Association.
Renzulli, J. S. (1978). What makes giftedness? Reexamining a definition. Phi Delta Kappan 60:261. doi: 10.1177/003172171109200821
Renzulli, J. S. (2005). “The three-ring definition of giftedness: a developmental model for promoting creative productivity” in Conceptions of giftedness. eds. R. J. Sternberg and J. E. Davidson. 2nd ed (New York: Cambridge University Press), 246–280.
Renzulli, J. S. (2011). What makes giftedness? Reexamining a definition: giftedness needs to be redefined to include three elements: above-average intelligence, high levels of task commitment, and high levels of creativity. Phi Delta Kappan. 92, 81–88.
Renzulli, J. S. (2016). “The three-ring conception of giftedness: a developmental model for promoting creative productivity” in Reflections on gifted education: Critical works by Joseph S. Renzulli and colleagues. ed. S. M. Reis (Waco, TX: Prufrock Press), 55–90.
Renzulli, J., and Gaesser, A. (2015). Un sistema multicriterial Para la identificación del alumnado de alto rendimiento y de Alta capacidad creativo-productiva [a multi-criteria system for the identification of high-achieving and creative/productive giftedness]. Rev. Educ. 368, 96–131. doi: 10.4438/1988-592X-RE-2015-368-290
Renzulli, J. S., and Hartman, R. K. (1971). Scale for rating behavioral characteristics of superior students. Except. Child. 38, 243–248. doi: 10.1177/001440297103800309
Renzulli, J. S., Siegle, D., Reis, S. M., Gavin, M. K., and Reed, R. E. S. (2009). An investigation of the reliability and factor structure of four new scales for rating the behavioral characteristics of superior students. J. Adv. Acad. 21, 84–108. doi: 10.1177/1932202X0902100105
Renzulli, J. S., Smith, L. H., White, A. J., Callahan, C. M., and Hartman, R. K. (1976). Scales for rating the Behavioral characteristics of superior students. Mansfield Center, CT: Creative Learning Press.
Renzulli, J. S., Smith, L. H., White, A. J., Callahan, C. M., Hartman, R. K., and Westberg, K. L. (2002). Scales for rating the Behavioral characteristics of superior students: Revised edition. Mansfield Center, CT: Creative Learning Press.
Renzulli, J. S., Smith, L. H., White, A. J., Callahan, C. M., Hartman, R. K., Westberg, K. L., et al. (2010). Scales for rating the Behavioral characteristics of superior students: Technical and administration manual. 3rd Edn. Mansfield Center, CT: Creative Learning Press.
Ripple, R. E. (1977). Communication, education, and creativity. Contemp. Educ. Psychol. 2, 219–231. doi: 10.1016/0361-476X(77)90024-8
Rodriguez, A., Reise, S. P., and Haviland, M. G. (2016). Evaluating bifactor models: calculating and interpreting statistical indices. Psychol. Methods 21, 137–150. doi: 10.1037/met0000045
Rogalla, M. (2003). Teacher nomination: German version of the scales for rating the Behavioral characteristics of superior students. Gift. Educ. Int. 18, 67–76. doi: 10.1177/026142940301800107
Rothenbusch, S., Voss, T., Golle, J., and Zettler, I. (2018). Linking teacher and parent ratings of teacher-nominated gifted elementary school students to each other and to school grades. Gift. Child Q. 62, 230–250. doi: 10.1177/0016986217752100
Ryser, G. R., and MacConnell, K. (2004). SIGS, scales for identifying gifted students: Ages 5 through 18. Waco, TX: Prufrock Press.
Santos, M. M., and Porto, J. B. (2023). Motivation to Lead: a novel theorical approach. Trends Psychol 1, 1–19. doi: 10.1007/s43076-023-00323-6
Schermelleh-Engel, K., Moosbrugger, H., and Müller, H. (2003). Evaluating the fit of structural equation models: tests of significance and descriptive goodness-of-fit measures. Methods Psychol. Res 8, 23–74. doi: 10.23668/psycharchives.12784
Schweizer, K. (2010). Some guidelines concerning the modeling of traits and abilities in test construction. Eur. J. Psychol. Assess. 26, 1–2. doi: 10.1027/1015-5759/a000001
Smedsrud, J. (2020). Explaining the variations of definitions in gifted education. Nord. Stud. Educ. 40, 79–97. doi: 10.23865/nse.v40.2129
Sofologi, M., Papantoniou, G., Avgita, T., Dougali, A., Foti, T., Geitona, A. R., et al. (2023). The gifted rating scales-school form in Greek elementary and middle school learners: a closer insight into their psychometric characteristics. Front. Psychol. 14:1198119. doi: 10.3389/fpsyg.2023.1198119
Sofologi, M., Papantoniou, G., Avgita, T., Lyraki, A., Thomaidou, C., Zaragas, H., et al. (2022). The gifted rating scales-preschool/kindergarten form (GRS-P): a preliminary examination of their psychometric properties in two Greek samples. Diagnostics 12:2809. doi: 10.3390/diagnostics12112809
Sorrentino, C. (2019). “The use of the Renzulli-Hartmann rating scales (2010) with Italian teachers' preliminary data from a correlation analysis” in Education and New Developments, Volume I, papers and posters presented at the International Conference on Education and New Developments (END 2019). ed. M. Carmo (Lisboa, Portugal: InScience Press), 183–186.
Sorrentino, C., and Pinnelli, S. (2022). “Gifted identification at school. A simulation of a training path for Italian teachers” in Proceedings of ATEE/IDD/GCTE conference Teaching and Learning for an Inclusive, Interconnected World. eds. D. Parmigiani and M. K. Murray (Belgium: Association for Teacher Education in Europe), 95–103.
Spearman, C. (1904). “General intelligence,” objectively determined and measured. Am. J. Psychol. 15, 201–293. doi: 10.2307/1412107
Srour, N. H. (1989). An analysis of teacher judgment in the identification of gifted Jordanian students [unpublished doctoral dissertation]. Storrs, CT: University of Connecticut.
Sternberg, R. J. (1999). A propulsion model of types of creative contributions. Rev. Gen. Psychol. 3, 83–100. doi: 10.1037/1089-2680.3.2.83
Sternberg, R. J. (2003). Wisdom, intelligence, and creativity, synthesized. Cambridge: Cambridge University Press.
Sternberg, R. J. (2005). “The WICS model of giftedness” in Conceptions of giftedness. eds. R. J. Sternberg and J. E. Davidson. 2nd ed (New York: Cambridge University Press), 327–243.
Sternberg, R. J. (2015). Successful intelligence: a model for testing intelligence beyond IQ tests. Eur. J. Educ. Psychol. 8, 76–84. doi: 10.1016/j.ejeps.2015.09.004
Subotnik, R. F., Olszewski-Kubilius, P., and Worrell, F. C. (2011). Rethinking giftedness and gifted education: a proposed direction forward based on psychological science. Psychol. Sci. 12, 3–54. doi: 10.1177/1529100611418056
Subotnik, R. F., Olszewski-Kubilius, P., and Worrell, F. C. (2018). “Talent development as a most promising focus of giftedness and gifted education” in APA handbook of giftedness and talent. eds. S. I. Pfeiffer, E. Shaunessy-Dedrick, and M. Foley-Nicpon (Washington, DC: American Psychological Association), 231–246.
Sumida, M. (2010). Identifying twice-exceptional children and three gifted styles in the Japanese primary science classroom. Int. J. Sci. Educ. 32, 2097–2111. doi: 10.1080/09500690903402018
Tannenbaum, A. J. (1986). “Giftedness: a psychosocial approach” in Conceptions of giftedness. eds. R. J. Sternberg and J. E. Davidson (New York: Cambridge University Press), 21–252.
Tirri, K., and Nokelainen, P. (2007). Comparison of academically average and gifted students’ self-rated ethical sensitivity. Educ. Res. Eval. 13, 587–601. doi: 10.1080/13803610701786053
Tordjman, S. (2020). Les enfants à haut potentiel en difficulté: Réflexion à partir d’un modèle développemental [High potential children with difficulties: Perspectives from a developmental model]. Rev. Prat. 34, 54–59.
Tordjman, S., Besançon, M., Pennycook, C., and Lubart, T. (2021). “Children with high intellectual and creative potential: perspectives from a developmental psycho-environmental approach” in Conceptions of giftedness and talent. eds. R. J. Sternberg and D. Ambrose (London, UK: Palgrave-Macmillan), 251–279.
Torrance, E. P. (1966). The Torrance tests of creative thinking: Norms–technical manual, research edition, verbal tests, forms a and B, figural tests, forms a and B. Princeton, NJ: Personnel Press.
Udall, A. (1987). Peer referral as a process for locating Hispanic students who may be gifted [Doctoral dissertation]. Tucson, AZ: University of Arizona.
Westberg, K. L. (2012). “Using teacher rating scales in the identification of students for gifted services” in Identification: The theory and practice of identifying students for gifted and talented education services. ed. S. L. Hunsaker (Mansfield Center, CT: Creative Learning Press), 363–379.
Wheaton, B., Muthen, B., Alwin, D. F., and Summers, G. F. (1977). Assessing reliability and stability in panel models. Sociol. Methodol. 8, 84–136. doi: 10.2307/270754
Wiley, K. R. (2020). The social and emotional world of gifted students: moving beyond the label. Psychol. Sch. 57, 1528–1541. doi: 10.1002/pits.22340
Zaccaro, S. J., LaPort, K., and José, I. (2013). “The attributes of successful leaders: a performance requirements approach” in The Oxford handbook of leadership. ed. M. G. Rumsey (New York: Oxford University Press), 11–36.
Zavala Berbena, M. A., and De la Torre García, G. (2021). “Self-nomination in the identification process of gifted and talented students in Mexico” in Handbook of giftedness and talent development in the Asia-Pacific. ed. S. R. Smith (Singapore: Springer International Handbooks of Education), 509–533.
Keywords: scales for rating the behavioral characteristics of superior students, psychometric properties, primary and secondary education students, teachers, evaluation, giftedness
Citation: Rachanioti E, Foti T, Geitona AR, Tzalla A, Dougali A, Fragkomichelaki O, Bourmpou C, Staikopoulou M, Papantoniou A, Varlami F, Dinaki I, Tsiountala M, Staikopoulos K, Dinou M, Katsadima E, Mavropalias T, Zaragas H, Efthymiou E, Katsarou D, Kougioumtzis G, Moraitou D, Sofologi M and Papantoniou G (2025) Scales for rating the behavioral characteristics of superior students: a preliminary examination of the psychometric properties of the Greek version of the first four scales: learning, creativity, motivation, and leadership scale. Front. Educ. 10:1639296. doi: 10.3389/feduc.2025.1639296
Edited by:
Gavin T. L. Brown, The University of Auckland, New ZealandReviewed by:
Eddy Noviana, Universitas Riau, IndonesiaFrancesca Baccassino, University of Salento, Italy
Copyright © 2025 Rachanioti, Foti, Geitona, Tzalla, Dougali, Fragkomichelaki, Bourmpou, Staikopoulou, Papantoniou, Varlami, Dinaki, Tsiountala, Staikopoulos, Dinou, Katsadima, Mavropalias, Zaragas, Efthymiou, Katsarou, Kougioumtzis, Moraitou, Sofologi and Papantoniou. This is an open-access article distributed under the terms of the Creative Commons Attribution License (CC BY). The use, distribution or reproduction in other forums is permitted, provided the original author(s) and the copyright owner(s) are credited and that the original publication in this journal is cited, in accordance with accepted academic practice. No use, distribution or reproduction is permitted which does not comply with these terms.
*Correspondence: Eleni Rachanioti, ZS5yYWNoYW5pb3RpQHVvaS5ncg==; Georgia Papantoniou, Z3BhcGFudG9AdW9pLmdy