 Carlos Mallén-Lacambra
 Christoforos Mamas
- 1National Institute of Physical Education of Catalonia, University of Lleida, Lleida, Spain
- 2Department of Education Studies, University of California, San Diego, La Jolla, CA, United States
Introduction: Inclusion is a universal right and a fundamental pillar of education. However, current educational models often overlook the relational nature of students, failing to address this social challenge effectively. Relational inclusivity emphasizes the importance of interpersonal relationships in fostering equitable and inclusive learning environments. The SNA Toolkit is a practical and versatile software that enables educators to assess student relationships through Social Network Analysis (SNA), promoting relational inclusivity. While widely recognized for its accessibility and versatility, its data quality has not been systematically compared with advanced statistical techniques, such as Exponential Random Graph Models (ERGMs). This study aimed to evaluate the consistency of the SNA Toolkit by comparing its findings with ERGMs, assessing its accuracy in providing high-quality actionable insights for educators.
Methods: Using a cross-sectional observational design, the study analyzed 32 7th-grade students from a socio-demographically diverse classroom in California. A peer-nomination survey mapped the four key networks of relational inclusivity: friendship, recess, academic support, and emotional wellbeing. Data were analyzed using both the SNA Toolkit and ERGMs to examine network structures, homophily, and relational dynamics.
Results: Results revealed that the SNA Toolkit closely aligned with ERGM outputs, confirming its consistency. Across the four networks, both analyses indicated low density (<0.22; β <1.82) and high reciprocity (>0.52; β > 1.82). Homophily effects for gender, SEND and ethno-racial group were also consistent, with E–I Index ranging from −0.05 to −0.39 below expected, and β = 0.311–1.327. By contrast, no evidence of socioeconomic status homophily was found.
Discussion: While ERGMs provided inferential insights, the SNA Toolkit effectively captured the same patterns through descriptive and visual analyses, making it more accessible for educators. These findings position the SNA Toolkit as a practical, evidence-based tool for fostering relational inclusivity, allowing educators and researchers to identify isolated students, assess group cohesion, and implement targeted interventions to create more inclusive learning environments.
1 Introduction
Inclusion represents a universal right, grounded in the principles of equity and justice (UNESCO, 2022). As an essential pillar of education, inclusion must go beyond merely providing and ensuring access; it must guarantee environments where every individual student can learn, grow, and contribute to the collective wellbeing (Shaeffer, 2019). Truly inclusive education fosters communities where learning is not merely an individual act but a collective, relational, and collaborative endeavor.
However, current models of inclusive education present significant limitations. By focusing on individualistic approaches, they tend to overlook the relational nature of human beings and how relationships influence the educational experience, either fostering or inhibiting growth and flourishing, or even causing harm (Rabjerg, 2017). This omission deprives students of relationally positive environments and perpetuates dynamics that can hinder both personal and collective development (Allen et al., 2021). Recognizing individuals as relational entities and educating accordingly is imperative to advance toward an inclusive education that is not only accessible but also transformative, fostering both personal and communal development (Allen et al., 2021).
In this context, the ethics of care emerges as a fundamental perspective to redefine inclusion from a relational approach and overcome the limitations of current individualistic models (Mamas and Mallén-Lacambra, 2025). This perspective emphasizes human interdependence: all human beings live in a social context, meaning we are constantly involved in social relationships and communities that shape our lives. Our relationships with other living beings, along with structural and material conditions, are part of our identity and shape who we are, what and how we think, and how we act (Camps, 2021; Gilligan, 1982). This network of relationships constitutes a social fabric, essential for the wellbeing, learning, and personal development of students, particularly those in vulnerable situations (Shaeffer, 2019).
Recent studies highlight the importance of positive relationships in the classroom, as they promote socio-emotional wellbeing, reinforce a sense of belonging, and improve academic performance. (Fuller et al. 2010) evidenced that these relationships reduce social barriers, promoting a greater sense of belonging. (Florian and Black-Hawkins 2011) emphasized that inclusive pedagogy fosters environments where all students can participate meaningfully, strengthening social bonds and school engagement. (Koster et al. 2009) and (Kasari et al. 2011) demonstrated that inclusion enhances reciprocal friendships, enriching social interactions, and emotional support, all of which are essential for holistic development. Additionally, (Black et al. 2025) reviewed relevant literature on the impact of social networks and academic achievement in schools and found that peer social network selection and influence effects impact individual and group academic functioning and achievement outcomes across age groups in adolescence.
In contrast, the absence of positive relationships leads to social exclusion, isolation, and negative effects on learning (Mamas and Mallén-Lacambra, 2025). (Humphrey and Symes 2011) noted that low peer acceptance can exacerbate social and emotional difficulties, therefore creating a less inclusive environment. Moreover, vulnerable students face higher risks of isolation, lack of friendships, and low acceptance, which limits their participation and increases their sense of exclusion (Mamas et al., 2021; Estell et al., 2009). Additionally, dynamics such as bullying and alienation intensify these challenges, deeply affecting students' wellbeing and educational experiences (Qi and Ha, 2012).
This body of evidence necessitates a redefinition of the concept of inclusive education, shifting from individualistic approaches to a relational paradigm: the theory of relational inclusivity.
Despite the growing recognition of the importance of peer relationships in inclusive education, there remains a notable methodological gap in the literature. While advanced statistical models such as Exponential Random Graph Models (ERGMs) have been employed to examine social network structures and dynamics, these approaches often require high levels of technical expertise and are not easily accessible to practitioners or researchers without advanced training (Lusher et al., 2013; Mamas et al., 2020). The Social Network Analysis (SNA) Toolkit was developed to bridge this gap by providing a user-friendly, visual, and practical platform for mapping and interpreting relational data in educational settings (Mamas et al., 2019). However, to date, there has been little to no direct comparative evaluation of the SNA Toolkit and ERGMs in terms of their capacity to identify relational inequities, inform interventions, and support inclusive practices. Addressing this gap is critical for both advancing methodological knowledge and empowering educators and researchers to make evidence-informed decisions that foster relational inclusivity (Mamas et al., 2024).
2 Conceptual framework
2.1 Relational inclusivity: a new paradigm
Relational inclusivity emerges as an alternative to overcome the limitations of current educational models, redefining inclusion by placing relationships at the core of education (Mamas and Trautman, 2023; Mamas et al., 2024). This approach recognizes human interdependence and proposes educational communities that prioritize meaningful connections among students, teachers, and stakeholders. The core aim of relational inclusivity is to promote caring relational networks that generate responsive and inclusive environments that meet the needs of everybody, so every student can live optimally with the varying degrees of dependence they experience throughout their lives (Mamas and Mallén-Lacambra, 2025). By fostering positive peer relationships, relational inclusivity creates responsive and inclusive environments where everyone feels acknowledged, supported, and understood, enhancing their wellbeing, development, and learning. This approach goes beyond the mere acknowledgment of diversity and superficial inclusivity efforts, actively recognizing, valuing, and nurturing the diverse backgrounds, experiences, and perspectives of students, educators, and stakeholders (Waldrip et al., 2008).
The practical application of relational inclusivity is critical. Recent studies highlighted that students report having fewer close friendships than in the past, talking to their friends less often, and relying less on their friends for personal support (Cox, 2021). Feelings of loneliness among children and adolescents have also increased significantly (Pedrero-Pérez et al., 2023). The lack of relational inclusivity leads to social isolation, diminishes students' sense of belonging, and negatively affects their wellbeing and academic performance (Black et al., 2025; Mamas and Mallén-Lacambra, 2025). In such non-caring environments, marginalized students are particularly at risk of exclusion and disengagement, with the lack of support exacerbating existing inequalities and further hindering their education (Kasari et al., 2011; Shaeffer, 2019). Moreover, when relational dynamics are overlooked, educators may miss opportunities to address interpersonal conflicts, bullying, or other relational issues. These unaddressed challenges can disrupt the educational environment and even harm students (Mamas and Trautman, 2023).
Relationships become the cornerstone of this paradigm shift, as students are understood as relational entities whose education is shaped by their connections (Mamas and Mallén-Lacambra, 2025). A relationship is a bond between at least two people, and individuals often maintain multiple types of relationships with the same person. For instance, someone might simultaneously have familial, friendly, trusting, and professional relationships with another person (Rabjerg, 2017). This multiplicity of interpersonal ties highlights the need for relational inclusivity to account for the diverse types of relationships within a student group to foster effective educational practices and create an inclusive and responsive environment (Allen et al., 2021).
Therefore, one of the key objectives of relational inclusivity is to improve and evaluate interpersonal relationships, particularly among students. Although some relationships remain invisible due to societal oversight or their intangible nature (Carmona-Gallego, 2023; Molinier, 2018), teachers should strive to understand relational dynamics by assessing the connections they consider relevant (Mamas et al., 2019). Additionally, relational evaluations can be complemented with other qualitative or quantitative methods, such as interviews or questionnaires, to capture a fuller picture of each social network (Borgatti et al., 2022).
Relational inclusivity also champions teacher empowerment by advocating for their autonomy in addressing context-specific relational questions. At the same time, it recommends the exploration of four key networks that shape most of the experiences of the students (Mamas and Trautman, 2023):
1. Friendship Networks: Analyzing friendship networks reveals the social dynamics within the classroom, highlighting connections, instances of isolation, and the quality of peer interactions. Mapping these networks allows educators to identify students who need additional support in forming positive relationships and friendships and to design interventions that foster inclusivity.
2. Recess Networks: Recess, a critical moment for social interaction and physical activity, offers insights into students' social skills and peer relationships beyond the classroom. Monitoring these networks can uncover patterns of exclusion or bullying, guiding strategies to ensure inclusive and engaging free play.
3. Academic Support Networks: Examining academic support networks sheds light on how students seek and provide help, revealing gaps in support systems. This understanding helps educators design effective mentoring programs to ensure equitable access to academic assistance.
4. Emotional Wellbeing Networks: Mapping emotional support networks shows how students manage stress, seek help, and ask for or receive emotional support. Understanding these dynamics informs programs that enhance mental health, resilience, and a supportive school culture.
Traditional methods of measuring peer relationships often focus on individual students, emphasizing deficits or “what's wrong with them,” rather than examining the systemic and structural factors that shape peer interactions (Mamas et al., 2024). These methods can overlook the complex patterns of interaction that influence social dynamics in classrooms. However, Social Network Analysis (SNA) provides a powerful, data-driven approach to examining these interactions, allowing for a nuanced and visual understanding of how relationships form and are maintained among students (Borgatti et al., 2024; Lusher et al., 2013). In recent years, several innovative SNA techniques have been developed to evaluate relationships and promote relational inclusivity in a practical way.
To better illustrate the theoretical connections described above, Figure 1 provides a conceptual model of relational inclusivity. The figure visually maps how the four key networks, friendship, recess, academic support, and emotional wellbeing, are situated within the broader framework of relational inclusivity and how they link to critical educational outcomes such as belonging, equitable learning opportunities, participation, mental health, and resilience. This visual representation serves as a guide for understanding how relational dynamics operate in classrooms and offers a foundation for the methodological comparisons presented in the subsequent sections.
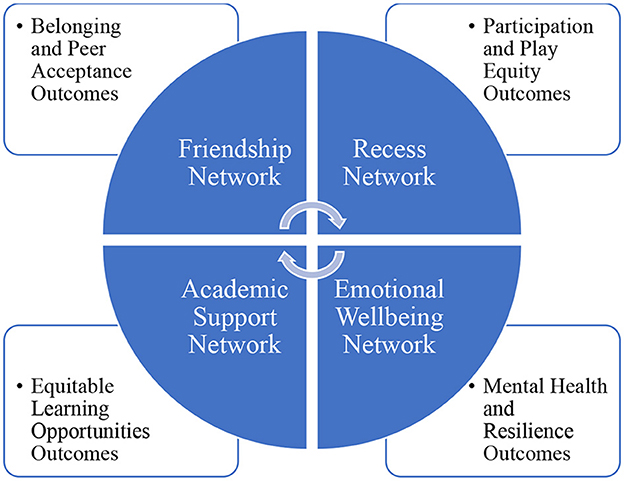
Figure 1. Conceptual model of relational inclusivity and its connection to networks and educational outcomes.
2.2 The SNA Toolkit
The Social Network Analysis (SNA) Toolkit is a free web-based software (SNA Toolkit©, 2025) that enables educators and researchers to analyze and understand complex social relationships within educational environments. It is easily accessible through a simple registration process that requires a registration key, eliminating the need for any software installation. The toolkit provides a systematic way to collect data on interactions among students, allowing users to visualize and quantify social connections in schools. By mapping these relationships, the SNA Toolkit highlights patterns of communication, collaboration, and influence that might otherwise remain hidden. This visual representation of a network, where nodes represent individuals and lines indicate relationships, helps educators see who is central or isolated in a network, revealing valuable insights about classroom dynamics and relational inclusivity.
For educators, the SNA Toolkit is particularly valuable because it offers a practical and accessible way to assess and address relational dynamics that impact student outcomes. Its web-based format allows for easy access to the platform, where users can identify key influencers and outliers, detect social clusters, and analyze the overall structure of the classroom's social network. This insight is particularly useful for fostering a more inclusive and equitable educational environment. For instance, the Toolkit can help pinpoint marginalized students who may be at risk of social isolation, enabling targeted interventions that boost their sense of belonging.
The accessibility of the SNA Toolkit as a free, web-based resource makes it a powerful asset for evidence-based decision-making and targeted interventions. By observing and measuring changes in social networks over time, educators can evaluate the impact of different instructional strategies, peer mentoring, or social-emotional learning programs on student integration and connectedness. This evidence-based approach makes the SNA Toolkit an essential tool for Research-Practice Partnerships (RPPs), as it allows researchers and practitioners to engage in a collaborative process of continuous improvement, grounded in concrete data about student relationships and relational inclusivity. In other publications we describe in detail the Toolkit's main functions (e.g., Mamas et al., 2019; Mamas and Huang, 2022; Mamas et al., 2024). It should be noted that the authors were and still are involved in the design and development of the SNA Toolkit as part of their academic research agenda. The authors do not receive any commercial or financial benefit from its use or dissemination. As noted earlier, the Toolkit is made freely available to educators and researchers through an open-access platform with the aim of promoting equity and inclusion in schools. This study evaluates the Toolkit's functionality and accuracy in comparison with advanced statistical modeling techniques, but no proprietary interests are involved.
While the SNA Toolkit provides educators with practical and accessible methods to assess classroom relationships, advanced statistical models like ERGMs enable researchers to delve deeper into the nuanced social processes underlying these networks. This contrast highlights the complementary strengths of these approaches in studying relational inclusivity.
2.3 Exponential random graph models (ERGMs)
Exponential Random Graph Models (ERGMs) are advanced statistical techniques designed to analyze and model the complexities of social networks (Lusher et al., 2013). Similar to linear regression, ERGMs estimate the effects of various predictors on an outcome; in this case, the presence or absence of ties between actors, becoming a tie-centered model. Unlike traditional regression models, ERGMs do not assume the independence of measures. Instead, they explicitly account for the interdependence of ties, recognizing that the formation of one relationship in a network often influences others.
This interdependence is central to the unique power of ERGMs. For example, the likelihood of two individuals forming a tie may depend not only on shared attributes like gender or socioeconomic status but also on existing relationships, such as mutual connections through a third party (transitivity) or reciprocal interactions (Borgatti et al., 2022). By modeling these dependencies, ERGMs provide insights into both individual behaviors and the broader social processes that shape network structure.
ERGMs conceptualize the observed network as one possible configuration within a set of networks with similar structural and attribute-based characteristics (Borgatti et al., 2024). By comparing the observed network against this distribution, ERGMs estimate the conditional log-odds (predicted likelihood) of tie formation for network structural effects (e.g., reciprocity, clustering, and centrality) and attribute-based effects (e.g., homophily). This approach makes ERGMs particularly suited for studying relational inclusivity in classrooms, where social dynamics are inherently interconnected and shaped by complex interdependencies (Mamas et al., 2023).
ERGMs offer a robust framework for uncovering hidden patterns of relational inclusivity and exclusion, providing high-quality insights by rigorously capturing the nuanced social processes within networks. However, ERGMs implementation requires significant technical expertise, high technical demands, familiarity with advanced statistical software and significant time and computational power, making them ideal for researchers but less accessible to educators.
2.4 Objective of the study
Social Network Analysis (SNA) allows for a rigorous evaluation of interpersonal relationships, enhancing relational inclusivity. The SNA Toolkit provides accessible, fast, and practical data, while ERGMs are less-user friendly but offer higher-quality data analysis insights. However, no study has compared the quality of the results produced by the SNA Toolkit with more advanced models such as ERGMs. By comparing the data generated by the practical and accessible SNA Toolkit with the rigorous analytical capabilities of ERGMs, this study aims to bridge the gap between research-oriented methodologies and practical applications in educational contexts. Specifically, this paper evaluates the precision and reliability of the SNA Toolkit, a practical tool that teachers could easily implement in their practice.
The main objectives of this study are as follows:
Objective 1: To compare the friendship, recess, academic support, and emotional wellbeing network results obtained through advanced SNA statistical models, such as ERGMs, with the practical insights provided by the SNA Toolkit.
Objective 2: To provide guidance on interpreting the key network and attribute measures of the SNA Toolkit and ERGMs to effectively analyze intersectional peer relationships and promote relational inclusivity.
By integrating research-oriented tools with practical applications, this study demonstrates the quality of the evaluations provided by the SNA Toolkit, empowering educators, even those without specialized training, by delivering reliable and actionable data on relational inclusivity, fostering equity, inclusion, and care in the classroom.
3 Research methods
3.1 Participants and procedure
This observational cross-sectional study involved 32 students from a 7th grade middle school classroom in California, USA. The classroom was selected for its demographic diversity, including variations in gender, Special Educational Needs and Disabilities (SEND) status, socioeconomic levels (evaluated based on eligibility for reduced-price or free meals), and ethno-racial backgrounds, reflecting key societal inequalities and oppressions (Mamas et al., 2023; Table 1). The study received approval from the Institutional Review Board (IRB) of the university, ensuring ethical compliance. Parental consent and student assent were obtained prior to data collection, and all data were anonymized. Strict confidentiality protocols were implemented to safeguard participant privacy throughout the study.
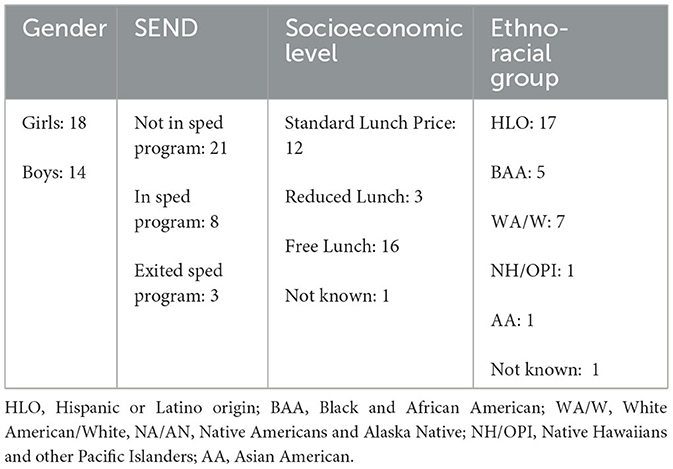
Table 1. Participants' demographics.
3.2 Data collection
Data were collected to map the distribution of social relationships within the classroom. Students completed a quantitative social network survey administered by their teachers while ensuring that participants were physically separated to prevent influence. The survey utilized a peer nomination technique with a classroom roster provided at the end of each question, allowing students to make unlimited, directed, and unweighted nominations. This approach aligns with best practices recommended in the systematic review by Avramidis and colleagues (2017).
To assess Relational Inclusivity, the survey included four tailored questions corresponding to the four primary networks: Friendship Network: “Who are your friends in this classroom?”; Recess Network: “Who do you spend time with during recess?”; Help Network: “Who do you ask for help with schoolwork?”; Emotional Wellbeing Network: “Who do you talk to when having a bad day?”
It is worth noting that while peer nomination techniques provide rich insights into students' relational dynamics, they are not without limitations and potential biases. For instance, students' responses may be influenced by factors such as social desirability, fear of peer retaliation, or lack of confidence in accurately identifying relationships, which can result in underreporting or overreporting of ties (Avramidis et al., 2017). Additionally, younger students or those with language barriers or special educational needs may experience difficulties understanding survey questions, introducing further variability into the data. To mitigate these risks, we implemented strategies including the use of developmentally appropriate and clearly worded survey items, the administration of surveys under conditions that ensured privacy and confidentiality, and clear verbal explanations from teachers to ensure comprehension. Future work could strengthen these safeguards by incorporating multi-informant data sources, such as teacher or caregiver reports, longitudinal observations, and triangulation with qualitative interviews, to validate and enrich the interpretation of network structures. These approaches would help address potential biases and further enhance the reliability of social network data for fostering relational inclusivity.
3.3 Data analysis
3.3.1 ERGMs
The data were analyzed using Exponential Random Graph Models (ERGMs) implemented through the statnet package in R (Borgatti et al., 2022; Krivitsky et al., 2003–2025). ERGMs conceptualize the observed network as one possible configuration within a set of potential networks with similar structural and attribute-based characteristics. By modeling the network, ERGMs account for the interdependencies between ties, acknowledging that relationships do not form in isolation but are influenced by the broader social structure. This approach enables the estimation of the conditional log-odds of tie formation while incorporating key network dependencies such as reciprocity, transitivity, and multiple connectivity. In doing so, ERGMs provide a nuanced understanding of how individual attributes and structural patterns interact to shape social interactions.
3.3.1.1 Network structural effects
To capture the structural characteristics of the networks, the following effects were modeled (Lusher et al., 2013): Arcs: The baseline effect, analogous to the intercept in regression models, estimating the overall likelihood of a tie being present in the network. Reciprocal Ties: Measures the tendency for ties to be mutual, indicating a higher likelihood of a tie being reciprocated if one actor nominates another. Transitivity/Closed Triad (DGWESP): Reflects the propensity for triadic closure, where actors connected through a common third party are more likely to form direct ties, leading to clustering. Multiple Connectivity/Open Triad (DGWDSP): Assesses the presence of open triads, where two actors share a connection through a mutual third party but do not form direct ties themselves, leading to brokerage. Popularity (GWID): Models the indegree distribution to evaluate whether certain actors receive more nominations than others. Activity Spread (GWOD): Examines the outdegree distribution to assess whether certain actors nominate more peers than others.
3.3.1.2 Homophily effects
In addition to structural effects, homophily was modeled to examine whether students were more likely to form ties with peers who shared similar attributes. The analysis focused on four key dimensions: gender, SEND status, socioeconomic level and ethno-racial group. These attributes reflect common axes of social stratification and potential inequality. By identifying patterns of inclusivity or segregation across these dimensions, homophily provides insights into how shared characteristics or attributes might shape classroom relationships (Block and Grund, 2014).
3.3.1.3 Model fitting and validation
Extensive model fitting was performed to achieve the best Akaike Information Criterion (AIC), Bayesian Information Criterion (BIC), and Markov Chain Monte Carlo (MCMC) diagnostics (Borgatti et al., 2022). These measures assess model parsimony and fit, ensuring an optimal balance between complexity and explanatory power. Goodness-of-Fit (GoF) tests were conducted to verify that the models accurately replicated critical network features, such as degree distribution and clustering coefficients. Achieving robust AIC, BIC, and GoF values is essential for ensuring that the ERGMs effectively capture the underlying social processes without overfitting or misrepresenting the data.
3.3.1.4 Independent network models
Each network (Friendship, Recess, Help, and Talk) was modeled independently to identify unique relational patterns and attribute effects within each context. This approach allowed for a granular analysis of how structural dynamics and homophily influenced tie formation across different relational dimensions, providing deeper insights into the dynamics of classroom social interactions (Lusher et al., 2013).
3.3.2 The SNA Toolkit
3.3.2.1 Descriptive network measures
The SNA Toolkit (2025) was used to calculate key descriptive network measures, providing a detailed view of the relational dynamics within the classroom (Mamas et al., 2024). These metrics, combined with sociograms (Songolo et al., 2025), offered critical insights into the network's structure and each student's positional role. The measures evaluated included: Density: The proportion of observed ties relative to all possible ties in the network, ranging from 0 (no ties) to 1 (a fully connected network). Reciprocity: The proportion of mutual ties, reflecting strong bidirectional relationships between students. Betweenness Centrality: The extent to which a student acts as a bridge connecting otherwise isolated peers, facilitating interaction across subgroups. Page Rank: The importance of a student in the network, determined by the number and quality of their incoming ties, reflecting influence or prominence.
3.3.2.2 Homophily effects
The E-I Index was used to evaluate homophily across key attributes: gender, SEND, socioeconomic level, and ethno-racial group (Borgatti et al., 2022). This index measures the balance between homophilic ties (connections with peers sharing similar characteristics or attributes) and heterophilic ties (connections with peers of different characteristics or attributes). It ranges from −1 (all ties are within the same characteristic, e.g., same gender) to +1 (all ties are between different characteristics, e.g., different gender).
Observed E-I Index values were compared against the expected E-I Index, which adjusts for group composition and the number of possible ties. For instance, if 80% of the network belongs to one group and 20% to another, a balanced distribution of ties would naturally favor within-group connections for the majority group due to their larger representation. In such cases, a balanced E-I Index would not be 0 but would instead reflect the expected distribution based on the group sizes. Using the expected E-I Index as a reference ensures that the balance between homophilic and heterophilic ties is assessed in context, as it provides the benchmark for a balanced distribution based on group composition. This prevents misinterpretation caused by demographic imbalances, ensuring that observed patterns are evaluated relative to their expected values (Borgatti et al., 2022).
These metrics, along with color-coded sociograms that visualized how attributes influenced ties, provided actionable insights into the structural and intersectional dynamics of classroom relationships, both at the group and individual levels (Mamas et al., 2019).
4 Results
Table 2 underscores the network structural effects observed using ERGMs, showing data from the main four networks proposed by Relational Inclusivity: Friendship, Recess, Help, and Talk. Complementing this, Table 3 presents the descriptive network statistics of the four main networks, calculated using the SNA Toolkit. Figures 2–5 provide the SNA Toolkit sociograms visualizing the structural configurations of these networks. In these sociograms node colors and shapes indicate key attributes: Gender (Figure 3), SEND status (Figure 4), Socioeconomic Level (Figure 5), and Ethno-Racial Group (Figure 6).
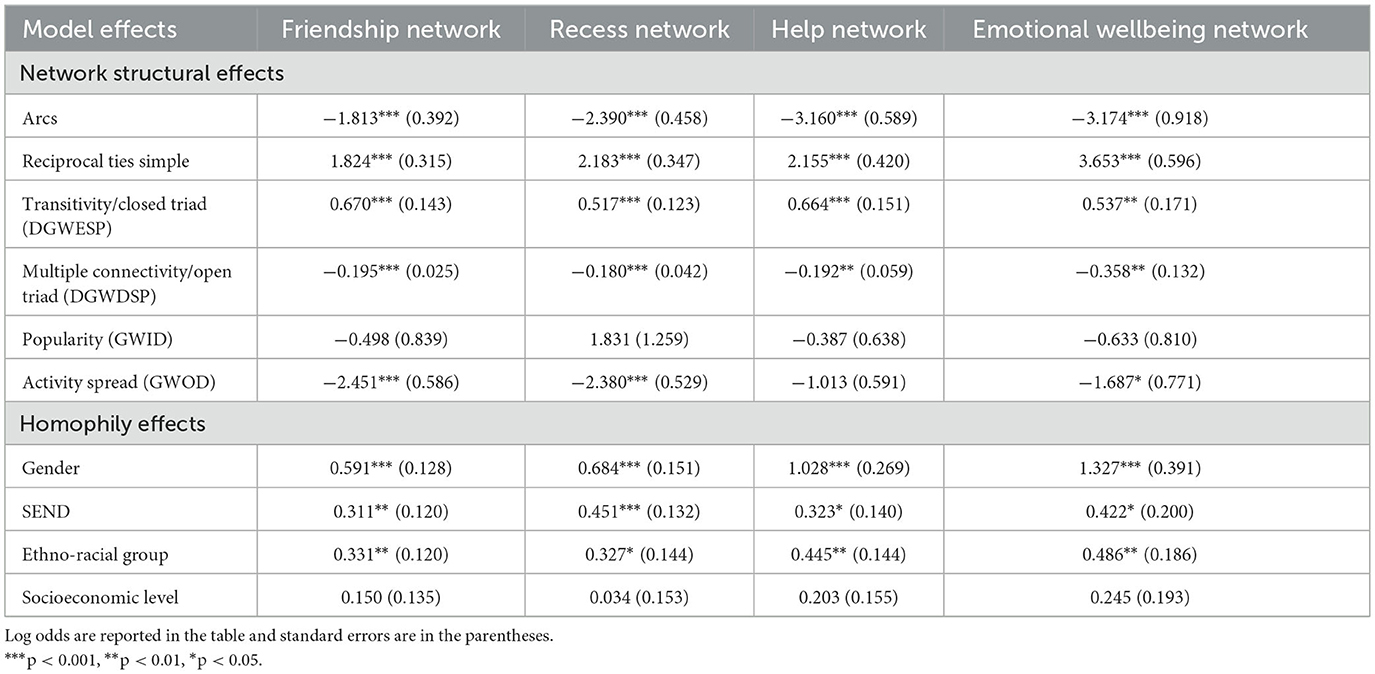
Table 2. ERGM results for relational inclusivity.
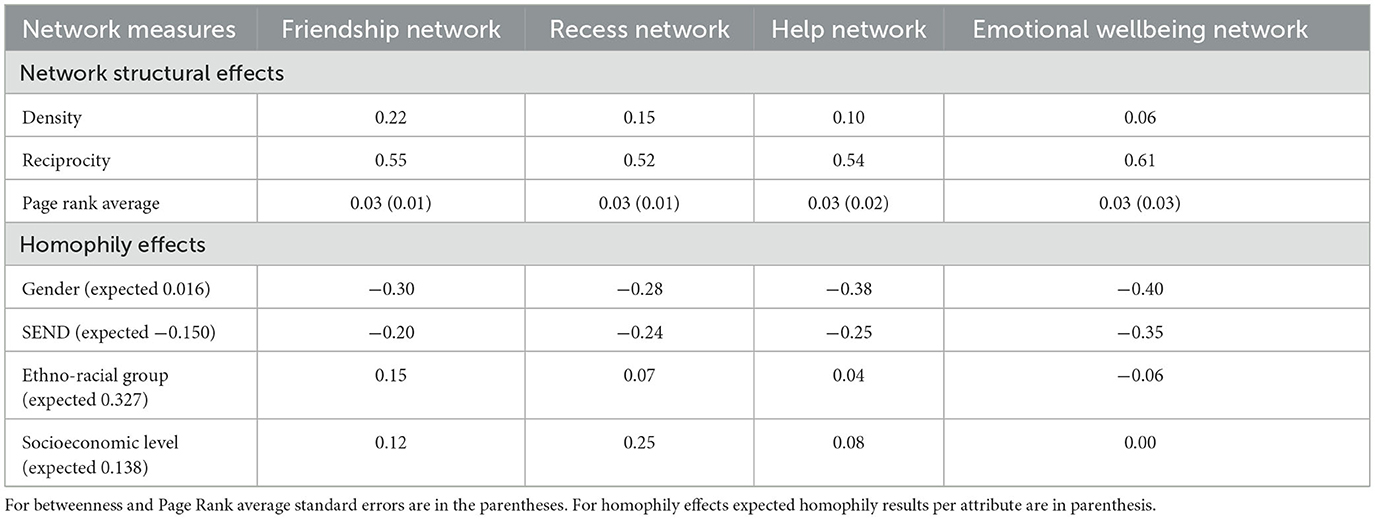
Table 3. SNA results for relational inclusivity.
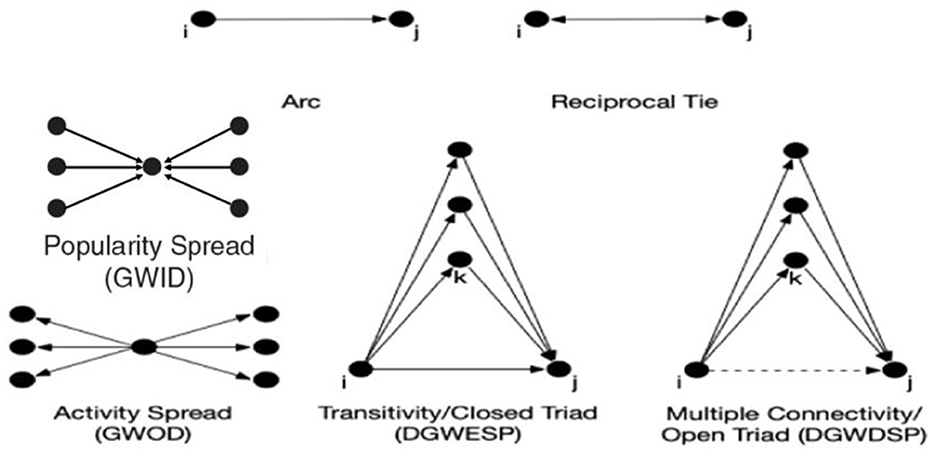
Figure 2. Network structures included in ERGMs models.
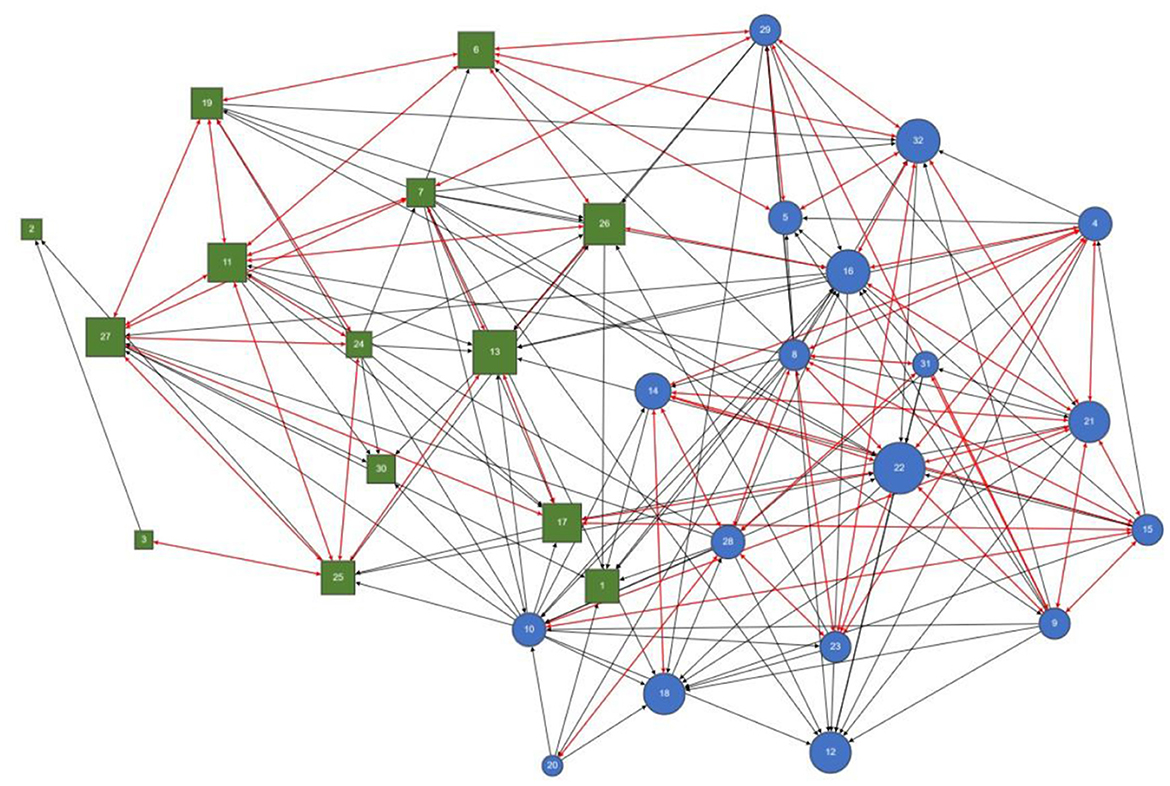
Figure 3. Friendship network by gender. Green squares, boys; blue circles, girls; black arrowed line, unidirectional relationships; red arrowed lines, reciprocated relationships.
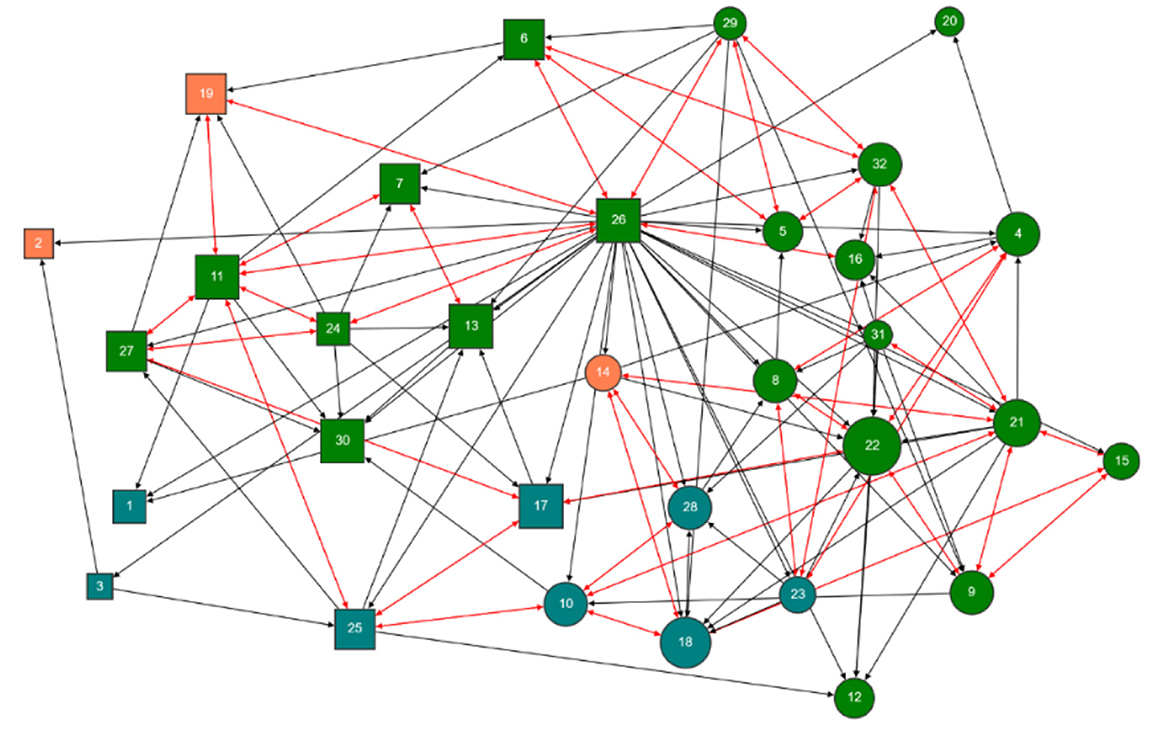
Figure 4. Recess network by gender and SEND. Squares, boys; circles, girls; green, not in sped program; blue, in sped program; orange, existed sped program; black arrowed line, unidirectional relationships; red arrowed lines, reciprocated relationships.
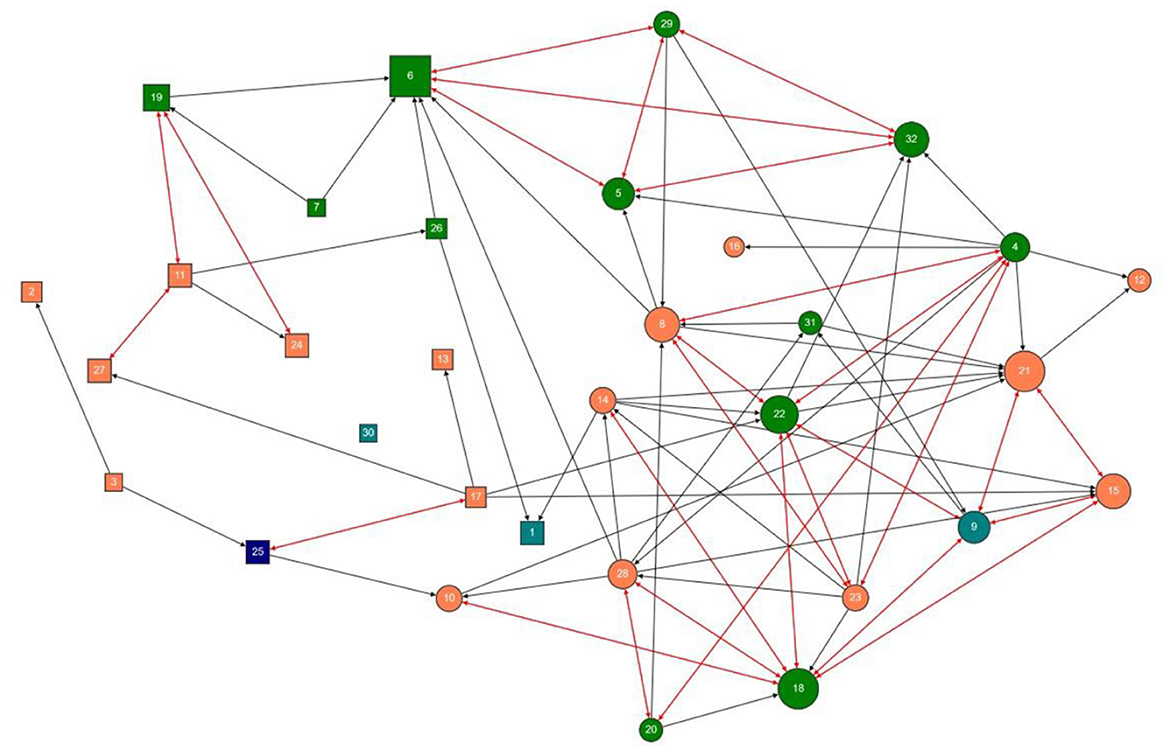
Figure 5. Academic support network by gender and socioeconomic level. Squares, boys; circles, girls; green, standard lunch price; light blue, reduced lunch price; orange, free lunch; dark blue, price information unavailable; black arrowed line, unidirectional relationships; red arrowed lines, reciprocated relationships.
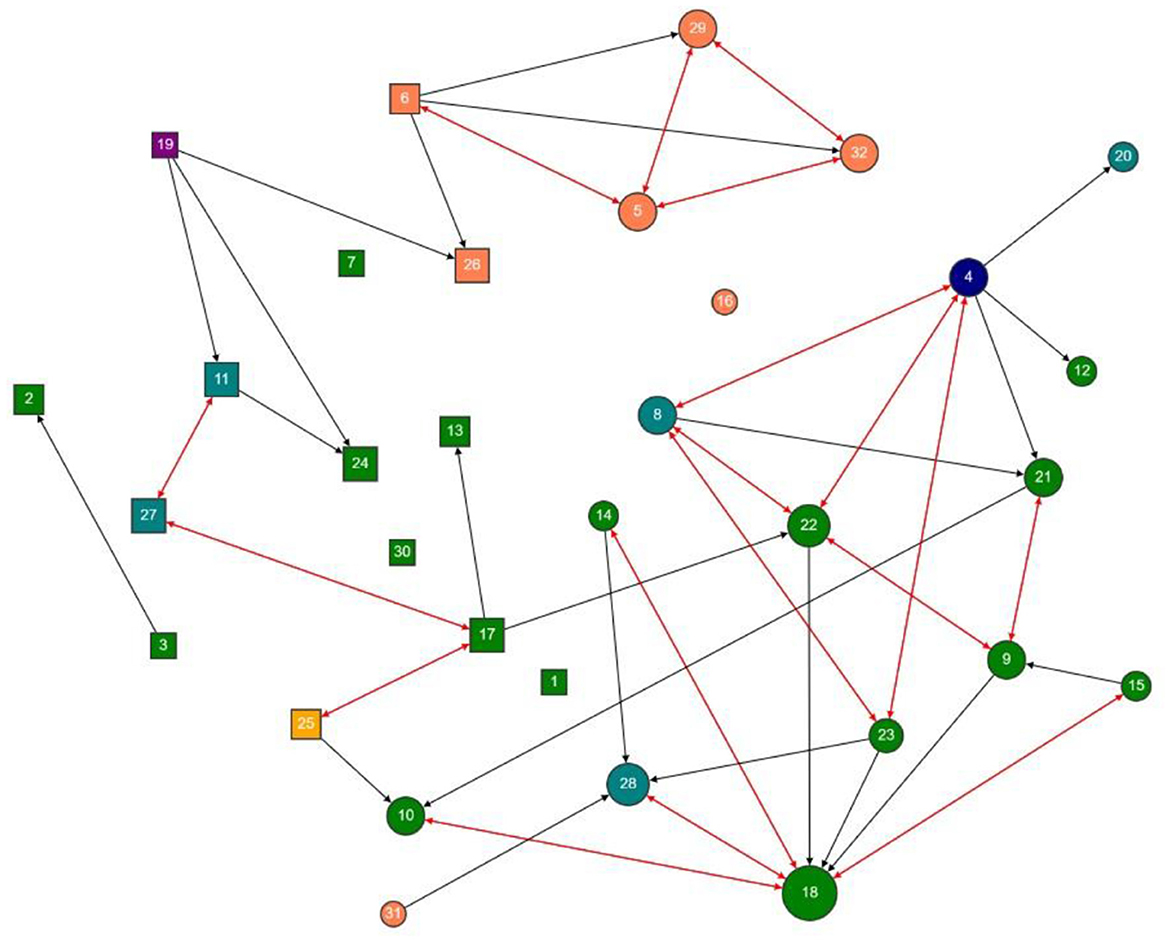
Figure 6. Emotional wellbeing network by gender and ethno-racial group. Squares, boys; circles, girls; green, Hispanic or Latino Origin; light blue, Black and African American; orange, White American/White; dark blue, Native Hawaiians and other Pacific Islanders; purple, Asian American; yellow, not known/disclosed; black arrowed line, unidirectional relationships; red arrowed lines, reciprocated relationships.
4.1 Network characteristics and structural effects
Arcs, representing the baseline tendency for tie formation, were consistently negative across all networks, indicating that ties were less likely to form than expected by chance (Table 2). As shown in Table 3 and Figures 2–5, this is reflected in density levels below 0.22, indicating that the absence of ties was more frequent than their presence. The results demonstrate that the densest networks were Friendship, Recess, Help, and Talk, in that order, though all networks exhibited low density, particularly the emotional wellbeing network.
Reciprocity emerged as a consistently strong positive predictor across all networks, reflecting a significant tendency for ties to be mutual (Table 2). As shown in Table 3 and Figures 2–5, reciprocity levels exceeded 0.52 in each network, indicating that the majority of relationships were reciprocal, reinforcing the stability and mutual nature of connections within these networks.
Transitivity was significantly positive across all networks, indicating a consistent tendency toward forming closed triads/groups of three individuals where each is directly connected to the others. Conversely, multiple connectivity was significantly negative, highlighting a stronger preference for closure over brokerage. This suggests that indirect connections through mutual neighbors (e.g., a friend of a friend) were less likely to form. Both findings align with the high average betweenness values and their large standard deviations (Table 3), reflecting the presence of brokers, students who act as connectors between otherwise separate subgroups. As shown in Figures 2–5, the networks demonstrate a structure characterized by tightly knit clusters linked by a few individuals, reinforcing the observed patterns.
4.2 Homophily effects
Table 2 indicates that Gender, SEND, and Ethno-Racial homophily were consistently significant and positive across all networks, suggesting a tendency for students to form ties with peers who share these characteristics. In contrast, Socioeconomic Level showed no significant relationship with tie formation in any network, indicating that this attribute did not influence students' relational choices.
Table 3 supports these findings, demonstrating that observed homophily values for Gender, SEND, and Ethno-Racial groups highly differ from their expected values based on the group composition and distribution of individuals across these attributes. Figures 2–5 visually depict these trends, though sociograms should be interpreted cautiously. Node positions in the graphs may lead to misleading conclusions and must be corroborated with statistical data, as noted in the discussion section.
5 Discussion
This study confirmed the effectiveness of both the SNA Toolkit and ERGMs in evaluating relational networks in educational contexts, including friendship, recreation, academic support, and emotional wellbeing, which are the four networks that relational inclusivity recommends analyzing. Our findings demonstrated that although the SNA Toolkit is designed to be practical and accessible for educators without statistical expertise (Mamas et al., 2024), its results closely align with those obtained through advanced statistical analyses, such as ERGMs, which require greater statistical knowledge, computational resources, and time (Borgatti et al., 2022).
The comparison between ERGM and SNA Toolkit results highlighted the complementary strengths of both approaches in relational network analysis (Mamas et al., 2023), confirming the validity of the data provided by the SNA Toolkit. While ERGMs offered inferential statistical insights (Lusher et al., 2013), the SNA Toolkit captured these same patterns descriptively and visually, providing educators with clear, practical, and automatically generated data to evaluate and foster responsive environments (Allen et al., 2021; Waldrip et al., 2008).
For example, regarding density, ERGMs identified this parameter as statistically significant and negative, reflecting a low probability of tie formation within the networks. This finding was mirrored in the descriptive values provided by the SNA Toolkit, which reported densities of 0.22 or lower, confirming low levels of connection among students. Sociograms supported this conclusion by revealing sparse networks with few links between nodes (Figures 3–6). Regarding reciprocity, ERGMs indicated a significant and positive mutual parameter, highlighting a strong tendency toward reciprocal relationships. The SNA Toolkit corroborated this result with reciprocity values above 0.52, demonstrating that more than half of the connections were mutual, a pattern clearly reflected through sociograms (Kasari et al., 2011; Koster et al., 2009).
These results align with previous studies using ERGM techniques. The significance of arc values confirms that human relationships tend to distribute intentionally rather than randomly (Borgatti et al., 2024). Similarly, reciprocity parameters reinforce the human tendency to establish relationships with those who seek relationships with us (Peperkoorn et al., 2020). The SNA Toolkit's ability to capture these patterns descriptively and visually further strengthens its utility as a practical tool for educators.
Regarding subgroup formation and overall network structure, the ERGM GWESP parameter was significant and positive, indicating that the group was divided into subgroups (Lusher et al., 2013). However, the GWDSP parameter yielded significant but negative values, suggesting that participants distributed their nominations evenly rather than concentrating them on specific individuals (Borgatti et al., 2024). These results revealed a decentralized structure divided into subgroups, with no student emerging as a dominant node in any of the four measured networks. The SNA Toolkit reflected this decentralization through similar PageRank scores for each student, while the presence of subgroups was visually evident in the sociograms (Mamas et al., 2019).
Concerning homophily, the tendency of individuals to connect with similar others, ERGMs identified significant tendencies based on gender, SEND, and race/ethnicity, indicating that students tended to associate with peers sharing these characteristics (Block and Grund, 2014). The SNA Toolkit corroborated these patterns using the E-I Index, whose values confirmed homogeneous groupings in these attributes (Mamas et al., 2024). Sociograms reinforced this conclusion by revealing well-defined subgroups by gender and race, although homophily in SEND was less visually apparent. This limitation underscores the importance of complementing sociograms with numerical data to prevent misinterpretations arising from node distribution (Borgatti et al., 2022).
Conversely, the results indicated no evidence of homophily based on socioeconomic status, a finding captured by both ERGMs and the SNA Toolkit. The E-I Index values for this attribute remained within the expected range, and the sociograms did not reveal clear connection patterns based on socioeconomic status, highlighting the SNA Toolkit's ability to detect such trends (Stehle et al., 2013). This interesting finding suggest that in school settings, students do not appear to consider social class when forming relationships, challenging the concept of homophily based on socioeconomic status (Lozares and Verd, 2011).
The comparison between both methods confirms that while ERGMs provide advanced inferential analyses, the SNA Toolkit effectively captures the same patterns descriptively and visually (Mamas and Huang, 2022). This makes it a highly valuable tool for educators, allowing them to analyze relational networks efficiently without requiring advanced statistical knowledge while obtaining data of comparable quality to ERGM-generated outputs (Mamas et al., 2019).
Although this study focused on applying the SNA Toolkit in educational settings, its potential for research is also noteworthy. Combining it with advanced statistical methods such as ERGMs enables more comprehensive and rigorous analyses of social dynamics to enhance inclusion (Florian and Black-Hawkins, 2011), offering deeper insights into relational interactions from multiple perspectives. Moreover, the SNA Toolkit allows for the inclusion of various question formats in the sociometric questionnaire, such as scales, short responses, or open-ended answers. This flexibility expands and simplifies data collection and analysis within a single platform, adapting to diverse research needs (Mamas and Huang, 2022).
Regarding study limitations, while the SNA Toolkit is designed to be practical and accessible, it omits certain advanced descriptive parameters available in platforms such as UCINET or R, which could provide deeper analytical insights at the cost of increasing tool complexity (Borgatti et al., 2022). Additionally, although this study compared the SNA Toolkit with ERGMs, future research should explore its performance against other advanced statistical models, such as STERGMs, which evaluate the temporal evolution of networks, or Actor-Oriented Models, which treat relationships as dynamic processes influenced by node decisions (Block et al., 2019). These comparisons would enable broader validation of the quality of information provided by the SNA Toolkit, reinforcing its effectiveness in both educational and research contexts. In addition to these considerations, there are important limitations associated with the use of the SNA Toolkit itself. While the toolkit is highly accessible and provides user-friendly visualizations, over-reliance on its descriptive outputs without complementary interpretation can lead to misinterpretations, particularly in highly heterogeneous or dynamic classrooms where relational patterns may shift rapidly. For example, a snapshot of peer networks may fail to capture evolving social dynamics over time, and visual sociograms alone cannot account for deeper structural or contextual factors influencing relationships. Moreover, without triangulation, educators may unintentionally overemphasize certain visible patterns, risking interventions that inadvertently reinforce existing inequities. To address these concerns, future work should integrate longitudinal data collection as well as teacher and caregiver perspectives. This multi-method approach would ensure that the SNA Toolkit serves as a starting point for dialogue and action, rather than the sole basis for decision-making, thereby enhancing both the validity and ethical use of relational data in diverse educational settings.
Despite these limitations, the combined interpretation of relational parameters analyzed in this study demonstrates that each indicator provides a unique perspective on group dynamics. However, it is the integration of these indicators that enables a comprehensive understanding of the group's relational reality (Mallén-Lacambra et al., 2024). This article serves as a guide for both educators and researchers, illustrating how to holistically interpret relational dynamics using social network analysis data. Specifically, the findings revealed weakly cohesive networks with a tendency toward reciprocity, divided into subgroups by gender, race, and SEND, yet lacking student hierarchies or any influence of socioeconomic status on relationships.
To support responsible use of the SNA Toolkit, especially in complex and heterogeneous school environments, we propose an iterative, multi-step implementation framework for educators. First, educators should approach the Toolkit's visualizations as a diagnostic starting point, using them to surface patterns of isolation, clustering, or inequity rather than treating them as definitive conclusions. These visual and descriptive outputs provide a snapshot of the relational dynamics at a given moment, but they must be triangulated with additional sources such as teacher observations, student voice through focus groups, and caregiver perspectives. This multi-source approach contextualizes the data, reduces the risk of misinterpretation, and ensures that interventions are grounded in the lived experiences of students. By adopting this reflective stance, educators take on the role of relational architects, intentionally designing routines, groupings, and structures that foster connection, belonging, and equitable participation.
Second, educators should implement small-scale, targeted interventions, for instance, reshaping group activities, restructuring recess practices, or providing peer mentorship opportunities, and then reassess the network after a designated period to evaluate how relational patterns shift over time. This cyclical process of mapping, acting, and reflecting enables schools to dynamically respond to changing relational landscapes, which is especially critical in classrooms with high mobility, diversity, or social complexity. Finally, embedding this work within collaborative professional development ensures that teachers, counselors, and administrators collectively build the skills needed to interpret network data, share responsibility for fostering inclusivity, and prevent over-reliance on any single tool or individual. When used in this way, the SNA Toolkit becomes more than a descriptive mapping tool. It serves as a relational compass that guides educators in designing inclusive, caring learning environments where every student can thrive.
The SNA Toolkit emerges as a key tool for educators' daily work (Mamas et al., 2024), allowing them to swiftly and accurately assess students' relational dynamics. Its intuitive design, along with relational reports and visual sociograms, provides clear insights into essential aspects such as group cohesion, relationship reciprocity, subgroup formation, and individual social positioning. This facilitates informed pedagogical decision-making aimed at fostering relational inclusivity and optimizing learning. For instance, educators can quickly identify students who act as bridges between subgroups or those who are socially isolated, implementing targeted interventions to strengthen their sense of belonging and improve the group's social connections. This, in turn, promotes socio-emotional wellbeing and enhances learning outcomes (Mamas and Mallén-Lacambra, 2025).
6 Conclusions
The findings of this study underscore the SNA Toolkit's ability to address twenty-first-century educational challenges, aligning with the Sustainable Development Goals (SDGs), particularly SDG 3 (Good Health and Wellbeing), SDG 4 (Quality Education), and SDG 16 (Peace, Justice, and Strong Institutions; UNESCO, 2022). Furthermore, the SNA Toolkit's versatility allows it to be adapted to a wide range of educational contexts, both formal and non-formal, and with diverse student profiles, solidifying its role as an essential tool for promoting inclusive and equitable education at all levels. When compared to ERGMs, the SNA Toolkit proves to be a valuable resource by providing clear data on relational dynamics, educators can design pedagogical strategies that foster relational inclusivity, promoting positive relationships and inclusive educational environments that enhance both student wellbeing and academic performance.
Data availability statement
The raw data supporting the conclusions of this article will be made available by the authors, without undue reservation.
Ethics statement
The studies involving humans were approved by University of California San Diego IRB Committee. The studies were conducted in accordance with the local legislation and institutional requirements. Written informed consent for participation in this study was provided by the participants' legal guardians/next of kin. Written informed consent was obtained from the minor(s)' legal guardian/next of kin for the publication of any potentially identifiable images or data included in this article.
Author contributions
CM-L: Conceptualization, Data curation, Formal analysis, Funding acquisition, Investigation, Methodology, Project administration, Resources, Software, Supervision, Validation, Visualization, Writing – original draft, Writing – review & editing. CM: Conceptualization, Data curation, Formal analysis, Funding acquisition, Investigation, Methodology, Project administration, Resources, Software, Supervision, Validation, Visualization, Writing – original draft, Writing – review & editing.
Funding
The author(s) declare that financial support was received for the research and/or publication of this article. This study was supported by the National Institute of Physical Education of Catalonia (INEFC) of the Generalitat de Catalunya and the University of Lleida (UdL), under Resolution 21/03/2022 and Order PRE/178/2021. The research was conducted as part of the project “Opportunity: Fostering Social Inclusion and Gender Equality in Formal and Non-Formal Educational Contexts through Traditional Sports and Games,” co-funded by the Erasmus+ Programme of the European Union (Project Code: 622100-EPP-1-2020-1-ES-SPO-SCP).
Conflict of interest
The authors declare that the research was conducted in the absence of any commercial or financial relationships that could be construed as a potential conflict of interest.
Generative AI statement
The author(s) declare that no Gen AI was used in the creation of this manuscript.
Any alternative text (alt text) provided alongside figures in this article has been generated by Frontiers with the support of artificial intelligence and reasonable efforts have been made to ensure accuracy, including review by the authors wherever possible. If you identify any issues, please contact us.
Publisher's note
All claims expressed in this article are solely those of the authors and do not necessarily represent those of their affiliated organizations, or those of the publisher, the editors and the reviewers. Any product that may be evaluated in this article, or claim that may be made by its manufacturer, is not guaranteed or endorsed by the publisher.
References
Allen, J. P., Narr, R. K., Nagel, A. G., Costello, M. A., and Guskin, K. (2021). The connection project: changing the peer environment to improve outcomes for marginalized adolescents. Dev. Psychopathol. 33, 647–657. doi: 10.1017/S0954579419001731
Avramidis, E., Strogilos, V., Aroni, K., and Kantaraki, C. T. (2017). Using sociometric techniques to assess the social impacts of inclusion: some methodological considerations. Educ. Res. Rev. 20, 68–80. doi: 10.1016/j.edurev.2016.11.004
Black, D. A., Warstadt, M., and Mamas, C. (2025). It's who you know: a review of peer networks and academic achievement in schools. Front. Psychol. 15:1444570. doi: 10.3389/fpsyg.2024.1444570
Block, P., and Grund, T. (2014). Multidimensional homophily in friendship networks. Netw. Sci. 2, 189–212. doi: 10.1017/nws.2014.17
Block, P., Stadtfeld, C., and Snijders, T. A. B. (2019). Forms of dependence: comparing SAOMs and ERGMs from basic principles. Sociol. Methods Res. 48, 202–239. doi: 10.1177/0049124116672680
Borgatti, S. P., Agneessens, F., Johnson, J. C., and Everett, M. G. (2024). Analyzing Social Networks. Thousand Oaks, CA: SAGE Publications.
Borgatti, S. P., Everett, M. G., Johnson, J. C., and Agneessens, F. (2022). Analyzing Social Networks Using R. Thousand Oaks, CA: SAGE Publications.
Carmona-Gallego, D. (2023). Percepciones y prácticas de cuidado desde una dimensión ética. Rev. Austral Ciencias Sociales 45, 241–261. doi: 10.4206/rev.austral.cienc.soc.2023.n45-13
Cox, D. A. (2021). The State of American Friendship: Change, Challenges, and Loss. Washington, DC: Survey Center on American Life.
Estell, D. B., Jones, M. H., Pearl, R., and Van Acker, R. (2009). Best friendships of students with and without learning disabilities across late elementary school. Except. Child. 76, 110–124. doi: 10.1177/00144029090760010
Florian, L., and Black-Hawkins, K. (2011). Exploring inclusive pedagogy. Cambr. J. Educ. 41, 811–826. doi: 10.1080/01411926.2010.501096
Fuller, M., Bradley, A., and Healey, M. (2010). Incorporating disabled students within an inclusive higher education environment. Disabil. Soc. 19, 455–468. doi: 10.1080/0968759042000235307
Gilligan, C. (1982). In a Different Voice: Psychological Theory and Women's Development. Harvard University Press.
Humphrey, N., and Symes, W. (2011). Peer interaction patterns among adolescents with ADHD and their classmates. J. Child Psychol. Psychiatry 52, 482–489. doi: 10.1177/1362361310387804
Kasari, C., Locke, J., Gulsrud, A., and Rotheram-Fuller, E. (2011). Social networks and friendships at school: comparing children with and without ASD. J. Autism Dev. Disord. 41, 533–544. doi: 10.1007/s10803-010-1076-x
Koster, M., Pijl, S. J., Nakken, H., and van Houten, E. (2009). Being part of the peer group: a literature study focusing on the social dimension of inclusion in education. Int. J. Inclusive Educ. 13, 117–140. doi: 10.1080/13603110701284680
Krivitsky, P. N., Handcock, M. S., Hunter, D. R., Butts, C. T., Bojanowski, M., Klumb, C., Goodreau, S. M., and Morris, M. (2003–2025). statnet: Software Tools for the Statistical Modeling of Network Data. Available online at: http://statnet.org (Accessed May 14, 2025).
Lozares, C., and Verd, J. M. (2011). De la Homofilia a la Cohesión social y viceversa. Redes. Revista hispana para análisis redes sociales 20:29. doi: 10.5565/rev/redes.408
Lusher, D., Koskinen, J., and Robins, G. (2013). Exponential Random Graph Models for Social Network Analysis: Theory, Methods, and Applications. Cambridge: Cambridge University Press. doi: 10.1017/CBO9780511894701
Mallén-Lacambra, C., Pic, M., Lavega Burgués, P., and Ben-Chaabâne, Z. (2024). Educating gender equity through non-competitive cooperative motor games: transforming stereotypes and socio-affective dynamics. Retos 60, 498–508. doi: 10.47197/retos.v60.107364
Mamas, C., Bjorklund Jr, P., Daly, A. J., and Moukarzel, S. (2020). Friendship and support networks among students with disabilities in middle school. Int. J. Educ. Res. 103:101608. doi: 10.1016/j.ijer.2020.101608
Mamas, C., Bjorklund, Jr. P, Cohen, S. R., and Holtzman, C. (2023). New friends and cohesive classrooms: a research practice partnership to promote inclusion. Int. J. Educ. Res. Open 4:100256. doi: 10.1016/j.ijedro.2023.100256
Mamas, C., Cohen, S. R., and Holtzman, C. (2024). Relational Inclusivity in the Elementary Classroom: A Teacher's Guide to Supporting Student Friendships and Building Nurturing Communities. New York, NY: Routledge. doi: 10.4324/9781003398738
Mamas, C., Daly, A. J., Cohen, S. R., and Jones, G. (2021). Social participation of students with autism spectrum disorder in general education settings. Learn. Cult. Soc. Interact. 28:100467. doi: 10.1016/j.lcsi.2020.100467
Mamas, C., Daly, A. J., Struyve, C., Kaimi, I., and Michail, G. (2019). Learning, friendship and social contexts: introducing a social network analysis toolkit for socially responsive classrooms. Int. J. Educ. Manage. 33, 1255–1270. doi: 10.1108/IJEM-03-2018-0103
Mamas, C., and Huang, D. (2022). “Social network analysis software packages,” in The SAGE Encyclopedia of Research Design 2nd Edn., Vol. 4, ed. B. Frey (Thousand Oaks, CA: SAGE Publications), 1554–1555. doi: 10.4135/9781071812082.n577
Mamas, C., and Mallén-Lacambra, C. (2025). Ethics of care: a theoretical underpinning for relational inclusivity. Teoría Educ. Rev. Interuniv. 37, 99–124. doi: 10.14201/teri.32183
Mamas, C., and Trautman, D. (2023). Leading toward relational inclusivity for students identified as having special educational needs and disabilities. Relat. Leader 34, 34–50. doi: 10.5040/9781350336452.ch-3
Molinier, P. (2018). “El cuidado puesto a prueba por el trabajo. Vulnerabilidades cruzadas y saber-hacer discretos,” in El trabajo de cuidado, ed. D. Gutiérrez (Buenos Aires: Fundación Mediafé), 191–214.
Pedrero-Pérez, E., Haro-León, A., Sevilla-Martínez, J., and Díaz-Zubiaur, E. (2023). La soledad: Asociación con la salud mental en un estudio poblacional. Behav. Psychol. Psicología Coonductual 30, 463–478. doi: 10.51668/bp.8323302s
Peperkoorn, L. S., Becker, D. V., Balliet, D., Columbus, S., Molho, C., and Van Lange, P. A. M. (2020). The prevalence of dyads in social life. PLoS ONE 15:e0244188. doi: 10.1371/journal.pone.0244188
Qi, J., and Ha, A. S. (2012). Inclusion in Physical Education: A review of literature. Intl. J. Disabil. Dev. Educ. 59, 257–281. doi: 10.1080/1034912X.2012.697737
Rabjerg, B. (2017). An analysis of human interdependent existence. Res Cogitans 12, 93–110. doi: 10.7146/rc.1296646
Shaeffer, S. (2019). Inclusive education: a prerequisite for equity and social justice. Asia Pacific Educ. Rev. 20, 181–192. doi: 10.1007/s12564-019-09598-w
SNA Toolkit© (2025). Socionomy.net. Available online at: https://socionomy.net/ (Accessed June 11, 2025).
Songolo, R., Mamas, C., Tripathi, T., and Michail, G. (2025). “Learn to create sociograms with a social network analysis toolkit using data on students' social networks,” in Sage Research Methods: Data Visualization (SAGE Publications Ltd). doi: 10.4135/9781036211813
Stehle, J., Charbonnier, F., Picard, T., Cattuto, C., and Barrat, A. (2013). Gender homophily from spatial behavior in a primary school: a sociometric study. Soc. Netw. 35, 604–613. doi: 10.1016/j.socnet.2013.08.003
Keywords: relational inclusivity, social network analysis, SNA Toolkit, exponential random graph models, educational equity, student relationships
Citation: Mallén-Lacambra C and Mamas C (2025) Relational inclusivity in education: comparing SNA Toolkit findings with ERGM models to advance a relational approach to inclusion. Front. Educ. 10:1665004. doi: 10.3389/feduc.2025.1665004
Received: 13 July 2025; Accepted: 24 September 2025;
Published: 14 October 2025.
Edited by:
Shashank Sheshar Singh, South Asian University, IndiaReviewed by:
Annika Fjelkner Pihl, Kristianstad University, SwedenSamya Muhuri, Thapar Institute of Engineering and Technology (Deemed to be University), India
Copyright © 2025 Mallén-Lacambra and Mamas. This is an open-access article distributed under the terms of the Creative Commons Attribution License (CC BY). The use, distribution or reproduction in other forums is permitted, provided the original author(s) and the copyright owner(s) are credited and that the original publication in this journal is cited, in accordance with accepted academic practice. No use, distribution or reproduction is permitted which does not comply with these terms.
*Correspondence: Christoforos Mamas, Y21hbWFzQHVjc2QuZWR1