 Carlos Valdivia-Salazar1*
 Oscar Serquén1*
 Laurita Guevara2*
 Jessie Bravo-Jaico1
 Roger Alarcón1
 Nilton Germán1
 Janet Aquino1
 Gisella Luisa Elena Maquen-Niño1
 Armando Moreno Heredia2
- 1Digital Transformation Research Group, Pedro Ruiz Gallo National University, Lambayeque, Peru
- 2Computer and Information Engineer, Pedro Ruiz Gallo National University, Lambayeque, Peru
The research defined the objective of building and validating instruments to assess the level of maturity of digital transformation in higher education institutions (HEIs). It was based on a theoretical-methodological model that specified eight dimensions of analysis. The methodology included 7 phases: contextualization of the instruments, initial proposal, iterative review and improvement, content validation, pilot test, reliability analysis and exploratory factor analysis (EFA). The results of the pilot test, conducted with more than 100 participants, showed adequate levels of reliability and validity. The EFA found an adjusted factorial structure of the instruments, with approximate factors of 59.7% for students, 64.8% for teachers, 72.79% for administrators and 81.9% for managers, being considered acceptable and suggesting that they effectively capture the dimensions of analysis. In addition, it was observed that some items originally assigned to specific dimensions were regrouped into conceptually related factors, suggesting the need for adjustments in the initial proposals. Based on the results obtained, these instruments have the potential to be effective tools for identifying digital maturity in HEIs, providing a comprehensive diagnosis to guide strategic decisions and technology investment planning for HEIs. Future studies could be complemented with the perception of graduates and the increase of the sample.
1 Introduction
Digital Transformation (DT) has emerged as a phenomenon that accelerates change, altering organizations in their cultural, social and technical aspects (Garcez et al., 2022). In the field of education and its evolution in the digital era, the integration of technology in teaching and learning has become fundamental (Tangkish et al., 2024), and specifically higher education institutions (HEIs), face various challenges in this current digital era with approaches such as globalization and internationalization, where DT emerges as one of the major changes, as it involves the use of Information and Communication Technologies (ICT) for the transformation of their business processes (Mijač et al., 2024).
The digitalization process in HEIs is moving towards what is currently called “University 4.0,” a concept that represents the evolution of traditional universities towards institutions focused on technology and digital innovation. This change not only affects teaching and learning methods, but also requires a profound change in the digital infrastructure, including modernization of platforms, implementation of digital classrooms, and the adoption of advanced technological tools (Avrami et al., 2024), which generate significant changes in teaching - learning and especially in institutional management with lasting effects that allow them to remain competitive nationally and internationally (Rismansyah et al., 2024).
Likewise, the implementation of DT not only drives an intelligent educational system, changing the traditional teaching method towards an active teaching method, but also builds conditions that favor the transmission of knowledge and promotes the development of capabilities in students (Husseiny, 2023), it should also be considered that this implementation of DT and artificial intelligence (AI) in HEI requires understanding the attitudes and behaviors of students with respect to current and future digital and AI applications (Abou Hashish and Alnajjar, 2024), in addition, digital divides should be considered as a component of information inequality among all university constituents, so it is necessary to consider improving their opportunities for access, use and production of information and knowledge, as well as the use of effective new technologies in their daily practice (Sydorenko et al., 2024).
The application of AI is beneficial for HEIs because they improve their educational outcomes, help in decision making and an advance in institutional systems (Fadlelmula and Qadhi, 2024), predictive models based on machine learning in university education are a way to improve the experience and satisfaction of students (Gallastegui and Forradellas, 2024). Likewise, trends in e-learning with AI, mobile learning, gamification and microlearning will have a positive impact on the educational system (Maqbool et al., 2024). Similarly, the integration of AI into curricula represents the need for continuous innovation in higher education (Stampfl et al., 2024).
On the other hand, DT promotes data-driven decision making; where Big Data technologies allow academics to focus on the educational profiles of university students (Song et al., 2024), generate intelligent learning environments adaptable to the needs of each student (Yu et al., 2024) and provide smarter and more effective services, which impacts the image of the institution (Campos Fialho et al., 2024).
Technological innovation and digitization, as integrative components of DT, are transforming organizations, and through digital maturity models, benchmarks and monitoring of digitization progression through stages are identified (Ladu et al., 2024). For public administration, there are holistic models integrating technology, processes, structure, people and organizational culture, enriched by dimensions of digital principles, digital governance and external environmental factors (Aristovnik et al., 2024).
Companies today are focused on measuring their level of digital maturity in DT to enable them to adapt and thrive in changing and competitive environments. It is not only important for them to know their current state of digitalization, but to determine at what level it is, allowing managers to identify key areas to improve or upgrade with technology (Kowal et al., 2024), being necessary for every organization to develop its own digital model that allows them to systematically evaluate the integration of digital technologies and their areas, as well as their processes, aligning them with long-term business objectives (Ladu et al., 2024). This strategic alignment will allow improving internal processes and making proposals for business models and digital services, resulting in sustainable competitive advantages, maximizing the application and benefits of DT (Restrepo-Espinel et al., 2024).
The other hand, DT is not only about integrating new technologies, it is also about reorganizing the company’s resources to maintain an advantage in the market. Measuring digital maturity helps to evaluate innovation strategies and adjust resources and capabilities in an agile way to meet market demands. It also allows to identify innovative approaches in the continuous improvement of processes and products, performing internal and comparative analysis with other companies (Romano et al., 2024).
In the field of HEIs, measuring the level of DT maturity represents an opportunity to improve the digital capabilities of the academic environment, thus Tsimpanis et al. (2023) considers that a data-based framework to assess how digitally prepared HEIs are, will allow to know the willingness to adopt digital technologies and optimize educational policies based on the results obtained, with which the quality of education focuses on progressive and permanent improvements, as well as supporting the needs of students, teachers and administrative staff, providing a clear focus on the digital development of the institution. On the other hand, Zulunova and Mudrak (2023) emphasizes the relevance of a comprehensive assessment of digital maturity that allows directing a development path where HEIs not only achieve the implementation of digital technologies, but also align them with their strategic objectives and their environment.
Likewise, the evaluation of digital maturity in HEIs allows the identification of specific areas where teaching and administrative staff need to improve their digital skills and be constantly updated, in order to foster a digital culture that supports innovation and continuous improvement in these institutions (Stare et al., 2023). Similarly, HEIs should focus on improving the digital competencies of all members of the university community to enable them to adapt to the challenges of digitization (Fernández et al., 2023).
The identification of maturity levels in HEIs provides the opportunity to design specific training programs for the professional development of all their members, thus Langseth et al. (2023) argues that assessing their digital maturity brings with it the development of more effective strategies for the integration of new technologies, improving institutional competitiveness in the global educational market. By understanding the current digital position and the ways forward, Tsimpanis et al. (2023) states that HEIs could adopt proactive approaches to digitization, ensuring policies and practices aligned to international best practices and the emerging needs of digital education.
For the development this instrument to measure the level of DT maturity in HEIs, a theoretical construction of an evaluation model with the same scope was used, where eight key dimensions of analysis were identified: socio-cultural, teaching-learning, academic management, administrative management, research and innovation, digital governance, institutional image and digital marketing, and university extension. These dimensions made it possible to comprehensively evaluate the key areas where DT impacts HEIs. In addition, the model identifies four key stakeholders in the digitization process: students, faculty, administrators and managers. These actors are essential to understand how DT affects all levels of the university community and how each group contributes to a more cohesive and effective digital environment.
Likewise, the model describes cross-cutting components of DT: digital technology, data governance, person and digital culture, and digital processes, which provide a good conceptual framework for the creation of the instrument, ensuring that the development of the instrument is applicable and relevant in the current context of HEIs. The approach of this model allows the generated instrument to be positioned as a comprehensive tool to support these institutions, accurately and effectively capturing the current state of digital maturity in the areas of the institution and among the various stakeholders, allowing a clear diagnosis and a guide for continuous improvement, aligning with their digital strategies and institutional objectives, improving the relevance and credibility of HEIs.
The need for a specific instrument for the evaluation of DT in higher educational institutions is justified for reasons analyzed in the described background on the maturity levels of digital transformation in different business sectors.
Comprehensive maturity models are important for organizations, when they consider multiple dimensions of DT, such as organizational culture, process management and innovation (Haryanti et al., 2023), however, HEIs present unique characteristics, such as the nature of teaching-learning processes, research and the dynamics of interaction between its various strata. Therefore, a digital maturity model needs an instrument specifically designed to capture these particularities.
As for maturity models applied in other areas, such as SMEs, they require the intervention of experts for correct application, which could be an obstacle to their autonomous use in entities with limited resources (Viloria-Nunez et al., 2022). Therefore, a specific tool for HEIs should be accessible and easy to use for the institution’s staff, allowing them to self-assess their level of digital maturity and plan improvements without necessarily depending on external consultants.
On the other hand, when developing a DT maturity model, it must be ensured that it meets the criteria of suitability and clarity (Gokalp and Martinez, 2021). This determines that an effective instrument in the educational field must be developed considering the needs and challenges of this sector, such as the integration of emerging technologies in the curricula, continuous training of teachers and administrative staff in digital competencies and the management of flexible and accessible learning environments.
Finally, the findings of Han et al. (2022) and Bulina and Solopova (2023) in their respective studies on specific sectors (cost consulting and construction industry) reinforce the idea that each industry has particularities that should be reflected in its digital maturity model. Given that HEIs have a distinct mission and unique set of challenges, a DT assessment tool that is not specific could miss critical aspects such as digital governance, equity in access to technology, and quality of learning in digital environments.
Therefore, the design of a specific instrument that allows the evaluation of DT in HEIs based on the inherent characteristics of this sector is justified, which will ensure its accessibility and applicability, in addition to providing a clear and effective guide to improve their digital maturity.
The objective of this study is to develop and validate an instrument to assess the level of maturity of digital transformation in higher education institutions.
The relevance of this research lies in providing HEIs with precise and adaptive tools that allow, according to the perception of its main actors, to diagnose the current level of digital maturity, and offer a clear path towards continuous improvement. These instruments, based on a conceptual model of digital maturity, will allow HEIs to obtain valuable information to align their digital strategies with their institutional objectives. In addition, it will allow tracing improvement routes in the formation of digital competencies and the optimization of technological resources, improving the digital skills of the members of the university community, focusing on a real digital culture that promotes innovation and adaptation to change.
2 Literature review
2.1 Digital maturity models and the development of tools
In the work of Haryanti et al. (2023) an extended digital maturity model (DX-SAMM) is developed which assesses the ability of organizations to adapt to digital transformation and provides recommendations for improvement in each dimension assessed. It was evidenced that the model is effective in identifying the level of digital maturity and also provides a practical framework for evaluation and continuous improvement in organizations. It concludes that the implementation of the model can contribute significantly to organizational sustainability by proposing DT strategies based on existing capabilities within organizations.
Meanwhile, Gokalp and Martinez (2021) proposed a maturity model in the DT domain, with the purpose of providing organizations with a clear guide to improve their digital maturity. They identified that existing maturity models do not fully meet the criteria of adequacy and clarity. The proposed model, called DX-CMM, was designed to help organizations determine their current capability and to provide a roadmap for improvement. They concluded that the model is an important tool to guide organizations in their goal towards digital transformation.
On the other hand, Siedler et al. (2021) designed a maturity model to assess the level of digitization in the different phases of the product life cycle in manufacturing companies. The objective was to provide a framework for companies to assess their level of digitization and to make this the starting point for future improvements. The InAsPro model provided a detailed assessment of the level of digital maturity in different areas of the company, facilitating objective comparison and strategic planning, concluding that the model is useful for identifying opportunities for improvement in the digitization of production processes.
The work of Viloria-Nunez et al. (2022) conducted a comprehensive review of digital transformation maturity models applied to small and medium enterprises, seeking to identify the key factors for assessing digital maturity in this type of companies. Their work showed that most of the existing models require the participation of experts during the diagnostic process, limiting their applicability in this type of companies, therefore, they concluded that there is an opportunity to develop a self-assessment model that allows SMEs to evaluate their digital maturity autonomously.
In Soroka et al. (2023), addressed the assessment of digital maturity in companies that provide software solutions, proposing an innovative method to determine their level of digital maturity. The objective was to identify key criteria for digital maturity assessment, in order to apply this novel approach using radar charts. The results showed that this proposal is effective in identifying the areas of improvement necessary for the successful digital transformation of a company in that area, concluding that their methodology provides a very accurate assessment for digital readiness.
Also, Gollhardt et al. (2020) developed a digital transformation maturity model specifically for information technology companies. They provided a framework to assess their current state of digital transformation and identify which areas require improvement. It was concluded that the proposed model fits well with the needs of companies in the technology sector and can be used as a template for other similar organizations.
Along the same lines, Han et al. (2022) conducted research on the digital transformation capability of cost consulting firms, developing a digital maturity model specific to this sector. They identified the key dimensions for assessing digital maturity, in addition they made the proposal of a model that allows companies to improve their digital capability effectively. The results showed that digital maturity in this sector is at a pioneering level, but with key areas that require improvement, especially in professional management and digital integration. They concluded that their model is a valuable tool to guide digital transformation in the cost consulting industry.
On the other hand, Bulina and Solopova (2023) proposed a maturity model to assess digitalization in the construction industry, with a specific focus on BIM (Building Information Modeling) integration. They developed a framework for measuring digital maturity in companies in this industry in addition to setting precise targets for digital transformation. The results showed that the model is effective in assessing and planning the digitization of this industry and highlighted the importance of BIM integration in the digital transformation process. They concluded that the model can be used for both current evaluation and future planning of digitalization in this industry.
The Gokalp and Martinez (2021) focused on the development and validation of a capability maturity model for digital transformation called DX-CMM, providing a framework that allows organizations to assess the current state of digital maturity and thus establish an improvement plan. The validation included a review of existing literature as well as an exploratory case study in order to verify the applicability of the model. They highlight the importance of a comprehensive approach in the construction of the instrument and the need to validate it in a real environment. This can be transferred to the higher education environment in order to ensure that the instrument has a practical and effective approach.
On the other hand, Haryanti et al. (2023) elaborated a proposal and performed a validation of an extended digital maturity model (DX-SAMM) through the comparison of different existing models and through qualitative information reviewed by experts. The model was validated through a case study, demonstrating that the instrument has the ability to identify digital maturity levels as well as provide recommendations for improvement in the dimensions assessed. This approach is important in the field of higher education institutions, as it ensures that the instrument not only measures the level of maturity, but also guides continuous improvement.
Meanwhile, Viloria-Nunez et al. (2022) focused on a review of digital transformation maturity models specific to small and medium-sized enterprises, with the aim of identifying key factors and improving assessment instruments. This study is significant for the construction of an instrument in the education sector because it highlights the need for models that are accessible and allow self-assessment without the need for external intervention. This is very important in higher educational institutions, which often have limited resources, especially in public universities that need instruments that can be used autonomously.
The work of Siedler et al. (2021) consisted of developing a maturity model to assess the level of digitalization in the different phases of the life cycle of products manufactured in companies of this type. This model considers four key dimensions: technology, organization, social issues and also corporate strategy. The validation included the application of the model in a company, evaluating each phase of the product manufacturing life cycle. This approach is extremely important as it can be used as the basis for a model to evaluate different dimensions of the educational process such as management, teaching, and research.
While Soroka et al. (2023) dedicated their study to the assessment of digital maturity in companies, proposing a novel validation method using radar graphs as well as structured surveys. This method was validated by applying it to real companies, demonstrating its efficiency in identifying areas in need of improvement. This type of validation is a relevant aspect for the application in the development of an instrument for the education sector, as it ensures that the results will be representative and useful to guide the digital transformation in these institutions.
The work done by Gollhardt et al. (2020) proposes the development of a very specific digital maturity model for information technology (IT) companies, validated through expert interviews and pilot testing in an IT company in the energy sector. The methodology used for validation ensured that the model is well adapted to the needs of the sector, which can be taken into account in the educational field to develop a model that fits the specific needs of HEIs.
Based on the reviewed models, it has been identified that many of them, both in the academic and professional spheres, coincide in including dimensions related to organizational strategy, technology, processes, culture, and digital leadership (Gokalp and Martinez, 2021; Haryanti et al., 2023; Soroka et al., 2023). However, they differ in their degree of specialization and validation: academic models tend to be more methodologically rigorous, focusing on specific sectors such as manufacturing, construction, or IT (Siedler et al., 2021; Bulina and Solopova, 2023), while models from industry or consulting are characterized by their broad applicability, but with less empirical support and poor adaptation to educational contexts (Viloria-Nunez et al., 2022).
Instrument validation is an essential stage in educational and behavioral research, especially in contexts where the validity of construct, content, and internal reliability must be ensured. According to authors such as DeVellis (2016) and Boateng et al. (2018), questionnaire development should follow systematic stages that include exploratory analysis, expert validation, pilot testing, and progressive refinement. On the other hand, as Carpenter (2018) states, he proposes clear steps for the development of scales, including factorial review and regrouping of low-performing items, and van der Eijk and Rose (2015) also identify that factorial analysis in survey data could allow for the tendency to extract more factors than necessary, therefore this type of analysis becomes an important methodological strategy.
Likewise, when adapting instruments to specific contexts, such as Latin American universities, it is important to consider cultural, organizational, and linguistic factors, following guidelines such as those proposed by Hambleton et al. (2004) and Ramada-Rodilla et al. (2013) in relation to intercultural adaptation.
A clear gap in the literature is the lack of tools adapted to the specific characteristics of HEIs, especially in Latin American countries, where sociocultural and organizational factors significantly influence DT processes (Han et al., 2022; Gollhardt et al., 2020). Furthermore, it has been pointed out that many models require expert support for their implementation, which limits their autonomy and scalability (Viloria-Nunez et al., 2022).
2.2 International context of DT and regulations in Peru
Internationally, HEIs face growing pressure to adapt to digital transformation (DT), driven by the globalization of knowledge, technological advances, and new social and labor demands (Paucar, 2023; OECD, 2021). This adaptation requires strategies that encompass not only teaching, but also institutional management, research, and social engagement (Rosario et al., 2021). In Latin America and the Caribbean, UNESCO (2024) highlights advances in digital adoption, although structural and skills gaps persist. It therefore promotes a rights-centered vision of DT aimed at comprehensively transforming higher education.
The existing regulations on DT in HEIs in Peru promote policies and strategies that promote the use of information technologies in the education sector. In recent years, Peru has made progress in the formulation of public policies that allow digitization and the use of technologies at all levels of the education system.
There is Law No. 31224, Law of Institutes and Schools of Higher Education and the Public Career of their Teachers (El Peruano, 2021), in charge of regulating the operation of higher education institutions in Peru, which establishes that institutions must promote the use of information and communication technologies (ICT) in the teaching-learning process and recognizes the need to modernize the infrastructure with respect to technology and educational methodology to respond to current and future challenges. In this sense, the law encourages the adoption of digital technologies to improve educational quality and efficiency in organizational management.
Likewise, the National Digital Transformation Plan approved by Supreme Decree N° 029-2021-PCM (PCM, 2021), constitutes an important legal framework that drives the digitalization of the country’s productive and educational sectors. This plan establishes specific actions to foster digital transformation in the education sector, promoting the adoption of digital technologies in classrooms as well as in the administrative management of universities and institutes. The plan aims to improve connectivity, guarantee the digital literacy of students and teachers, and ensure the inclusion of all sectors of the population in the benefits of technology.
At the university level, there is Law No. 30220 (MINEDU, 2014), called University Law, which is responsible for regulating the operation of universities in Peru and requires these institutions to include in their development plans the use and exploitation of ICTs to strengthen both the teaching-learning processes and research and linkage with the environment. This regulation is aligned with the objective of improving competitiveness and educational quality through the incorporation of technological tools in the educational process.
In addition, the Presidency of the Council of Ministers prepared the National Digital Transformation Plan that complements regulations such as Law No. 31224 and University Law No. 30220, and highlights the need to modernize and digitize the education sector. However, for these policies to be effective, it is essential to have instruments to measure progress in digital transformation and guide institutions in continuous improvement.
In conclusion, it is considered important to implement a specific instrument to evaluate the digital transformation in higher education institutions in Peru, as it is a key factor to be aligned with current regulations and laws. This instrument will make it easier for universities to evaluate the level of digital maturity and will allow the formulation of strategies in accordance with the National Digital Transformation Plan and the demands of the University Law, favoring the creation of a more inclusive, accessible and competitive education in the global scenario.
3 Materials and methods
The development of the instruments to measure the level of DT maturity in HEIs followed a methodological process composed of seven phases (Figure 1).
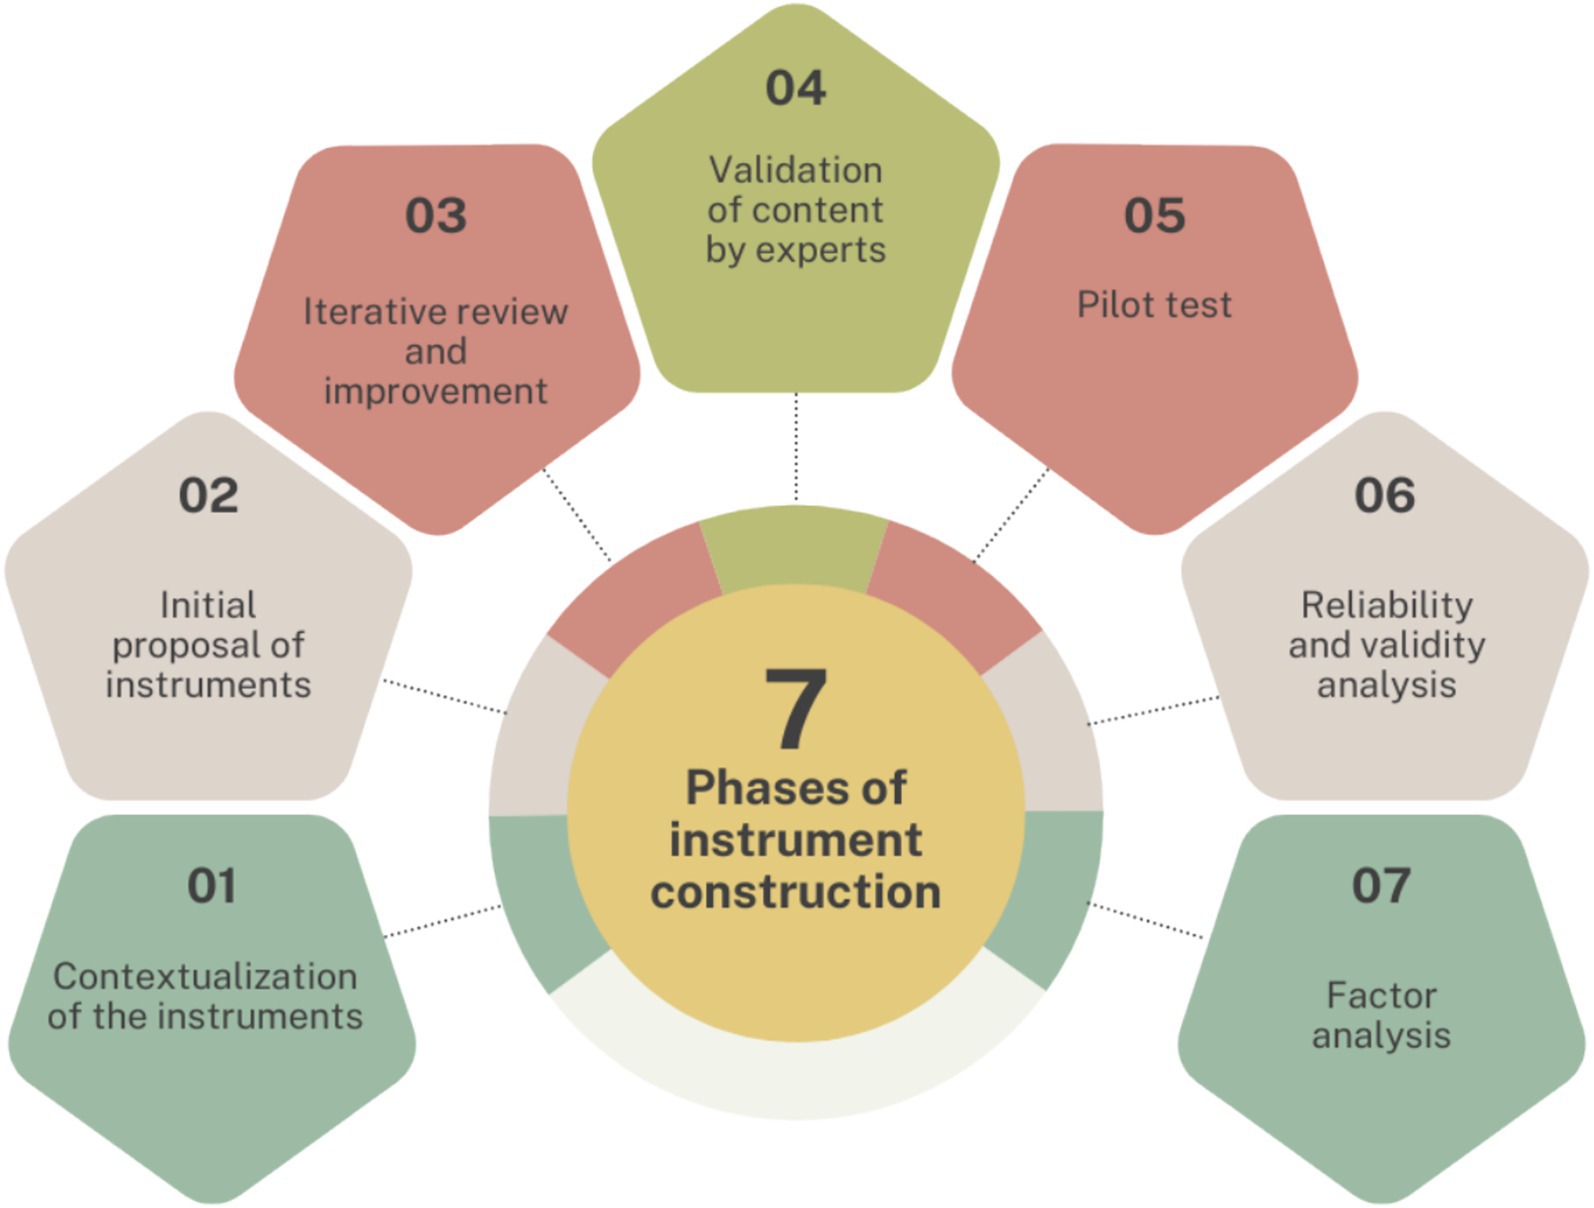
Figure 1. Phases for the development of the instruments that will measure the level of DT maturity in HEIs.
3.1 Phase 01: contextualization of the instruments
The instrument was based on a methodological theoretical model (MTM) (Bravo-Jaico et al., 2025) that identifies components to determine the levels of DT maturity in HEIs, considering eight dimensions:
The socio-cultural dimension is based on the level of digitalization of the integral sustainable plan of the university, the adequate use of technologies by all members of the university community, as well as rules and regulations; as well as the commitment and participation of the university internally and towards the community.
The teaching-learning dimension contemplates the evaluation of teaching methods, course design, learning strategies and materials, counseling and tutoring, as well as the evaluation of the entire teaching-learning process, considering digital educational innovation and teaching resources trained in digital tools.
The academic management dimension describes the development and improvement of academic processes, from planning and curricular programming, execution and evaluation, considering under DT the achievement of strategic achievements to improve digital learning and the broad use of technologies.
The administrative management dimension contemplates the DT perspective applied to administrative services and their processes, to achieve planning, organization, direction and control in the fulfillment of institutional objectives, aligned with policies, strategic plan and vision.
The research and innovation dimension identifies the positioning that the university should have in the field of scientific production and the generation of entrepreneurship and innovation projects, for which it considers training courses, multidisciplinary participation in research projects, scientific and academic publications, the use of indexed databases, innovation projects, generation of companies and generation of patents.
The digital government dimension emphasizes the added value generated by the digitization of processes and services, digital leadership, and information systems, in the efficient operation of the university’s administrative and academic areas.
The institutional image and digital marketing dimension is responsible for basing the processes of attracting students, seeking their loyalty and achieving their satisfaction as a member of the university community, as well as the use of digital marketing as a disruptive change in the way to reach end users, developing strategies with digital media to promote the academic offer and the analysis of the competition.
The university outreach dimension details how the process of efficient communication with society is developed, improving the relationship with key factors: government, education and business, as well as developing activities for cultural dissemination and outreach, continuing education programs, access and digital inclusion, among others (Bravo-Jaico et al., 2025).
As for the cross-cutting components of DT, the model integrates data governance that allows improving the quality of data of an organization turning them into assets, and applied in higher education, it supports the digitization of data generated by teachers and students, scientific research, management and service processes, ensuring its operational efficiency in the institution. Another component is digital technologies, as part of the technological revolution of companies and industries, considering that DT led by disruptive technologies help educational institutions to improve their areas and processes, offering better value to the user through technologies such as artificial intelligence, cloud computing, internet of things, Blockchain, virtual reality and augmented reality.
The person and digital culture component identifies that people committed to the sustainable development of society must have access to technology, improving their social, economic and cultural rights, obtaining the necessary competencies to execute processes and use modern technologies. The digital culture represents the basis of the corporate culture of organizations. The component of digital processes identifies how institutions should consider the need to digitize their documents that represent the data that drive the DT, allowing the automation of processes to perform their treatment with minimal user intervention, likewise, they will allow changing the mechanisms of knowledge acquisition, improving student-teacher interaction and teaching-learning (Bravo-Jaico et al., 2025).
The actors considered in the model as the managers and members of the university processes are: students, teachers, administrators and managers.
The maturity levels evaluated in the instruments are specified in Table 1.
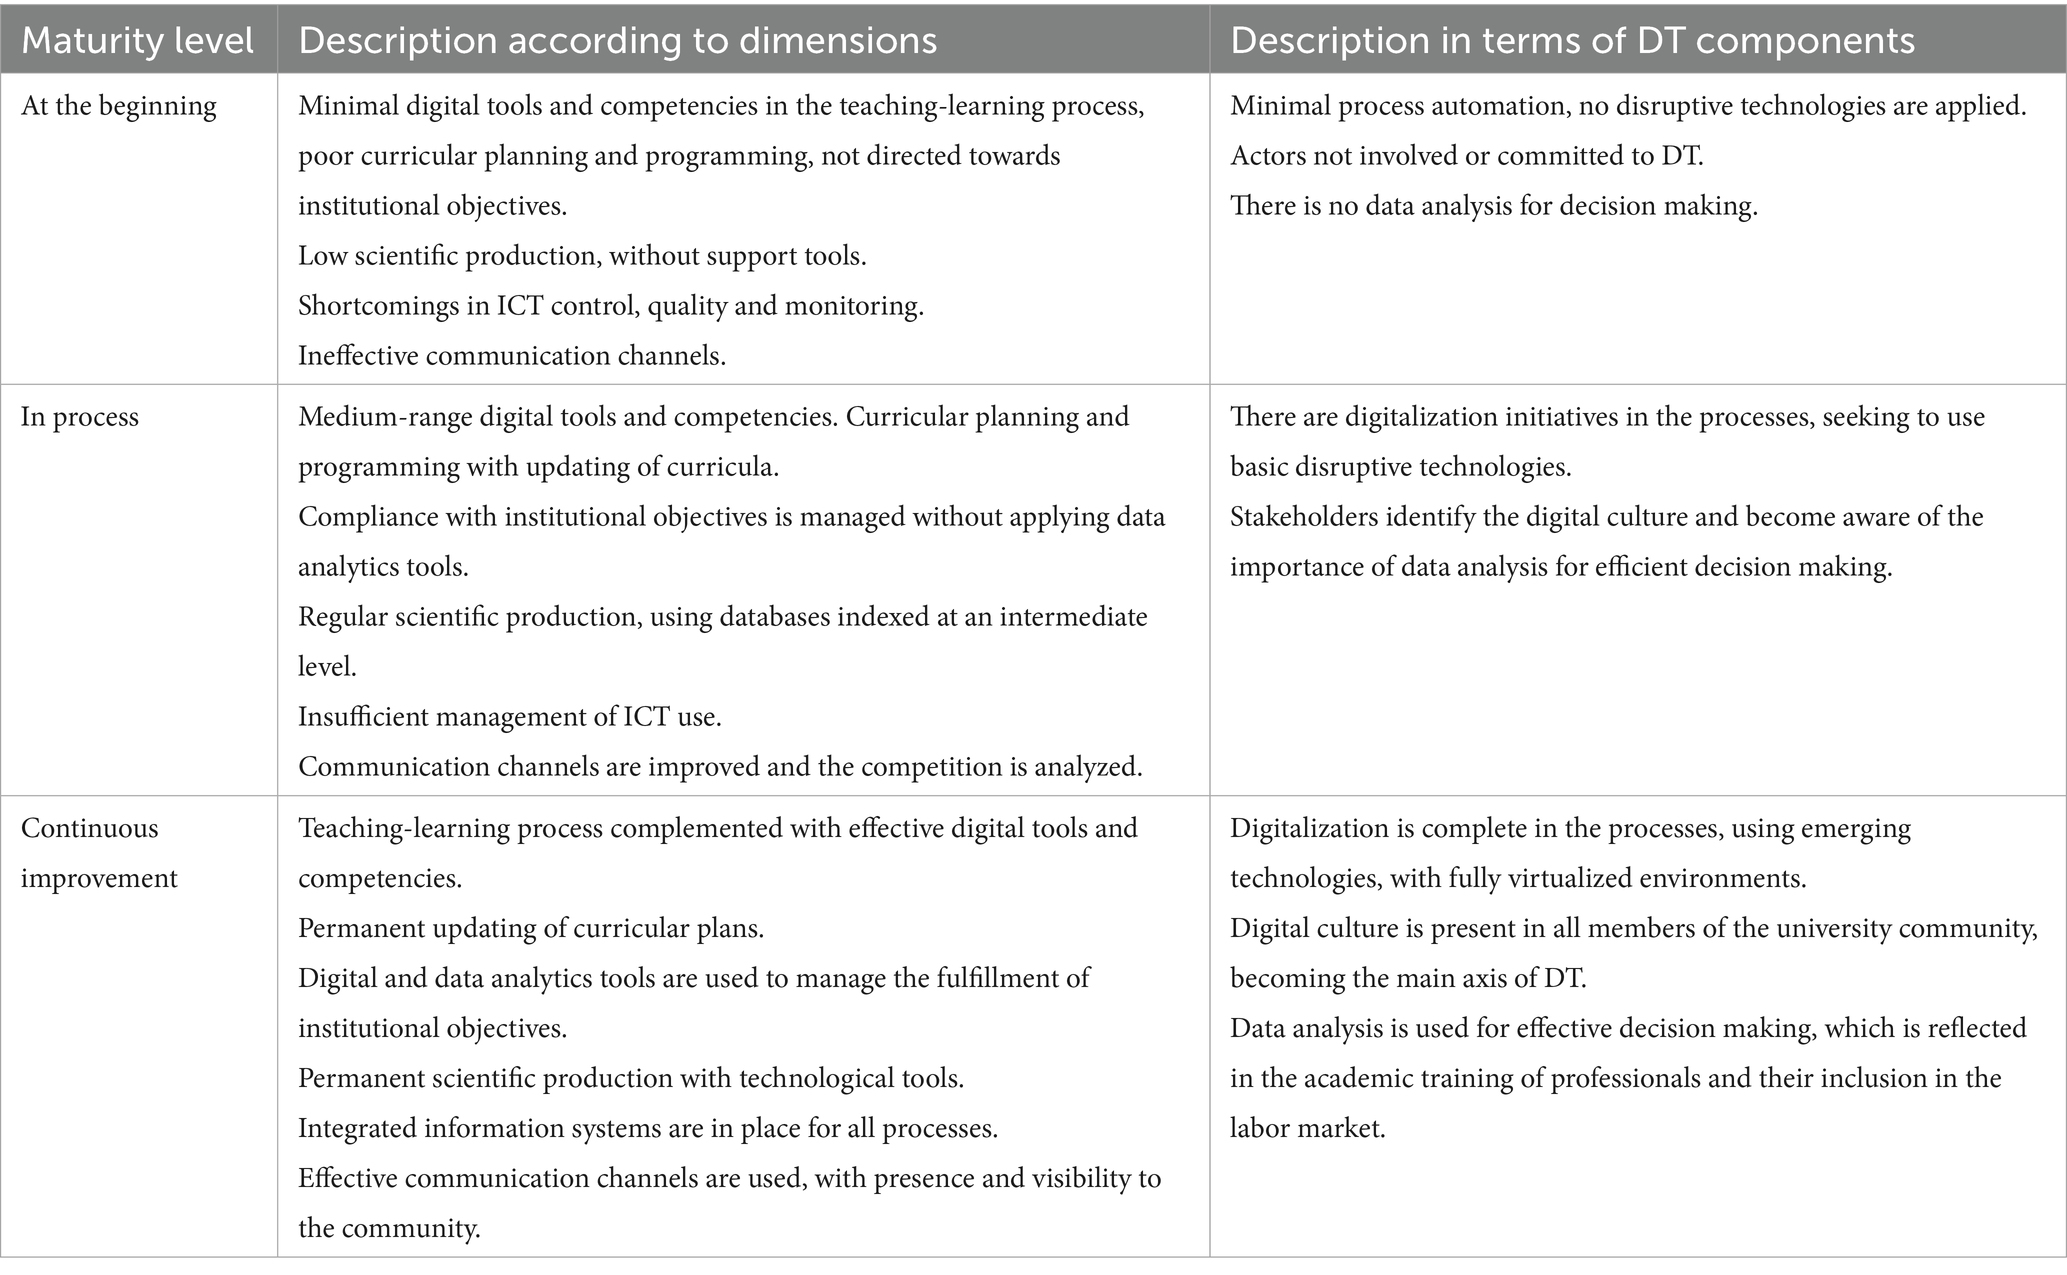
Table 1. Maturity levels assessed in the instruments.
The MTM of digital maturity adopted for the construction of the instruments for measuring the level of DT in HEIs is the most appropriate because of its comprehensive and multidimensional approach. Each of its dimensions allows the identification of key aspects to be evaluated in HEIs and how they are adopting DT in their areas and processes, both academic and administrative. In addition, it allows the construction of customized instruments for each actor according to their role, ensuring an accurate assessment of their perception and how they perform their activities in the field of the use and application of disruptive technologies. Likewise, the model, by including DT components, allows the instruments to comprehensively assess the resources and capabilities that HEIs must consider in their progress towards reaching maturity levels. Finally, this model allows, through the instruments built, to obtain a detailed diagnosis, as well as the identification of key areas for improvement, which ensures that HEIs can align their digital projects and strategies with their institutional objectives (Bravo-Jaico et al., 2025).
3.2 Phase 02: initial proposal of instruments
The instruments constructed and their items were adjusted to the dimensions and cross-cutting components of the MTM to reflect the particularities of each actor that make up the HEIs, covering both academic and administrative functions, seeking the precise measurement of the levels of DT.
By building specific instruments per stakeholder, overall measurement of the level of digital maturity of the institution was ensured, as well as the identification of challenges and opportunities for each group of stakeholders in their interaction with digital technologies. Therefore, the instruments are aligned with the theoretical and methodological model and with the practical realities of HEIs, which reinforces their validity and applicability.
Table 2 show the number of questions per dimension for each actor as well as the scope of each instrument.
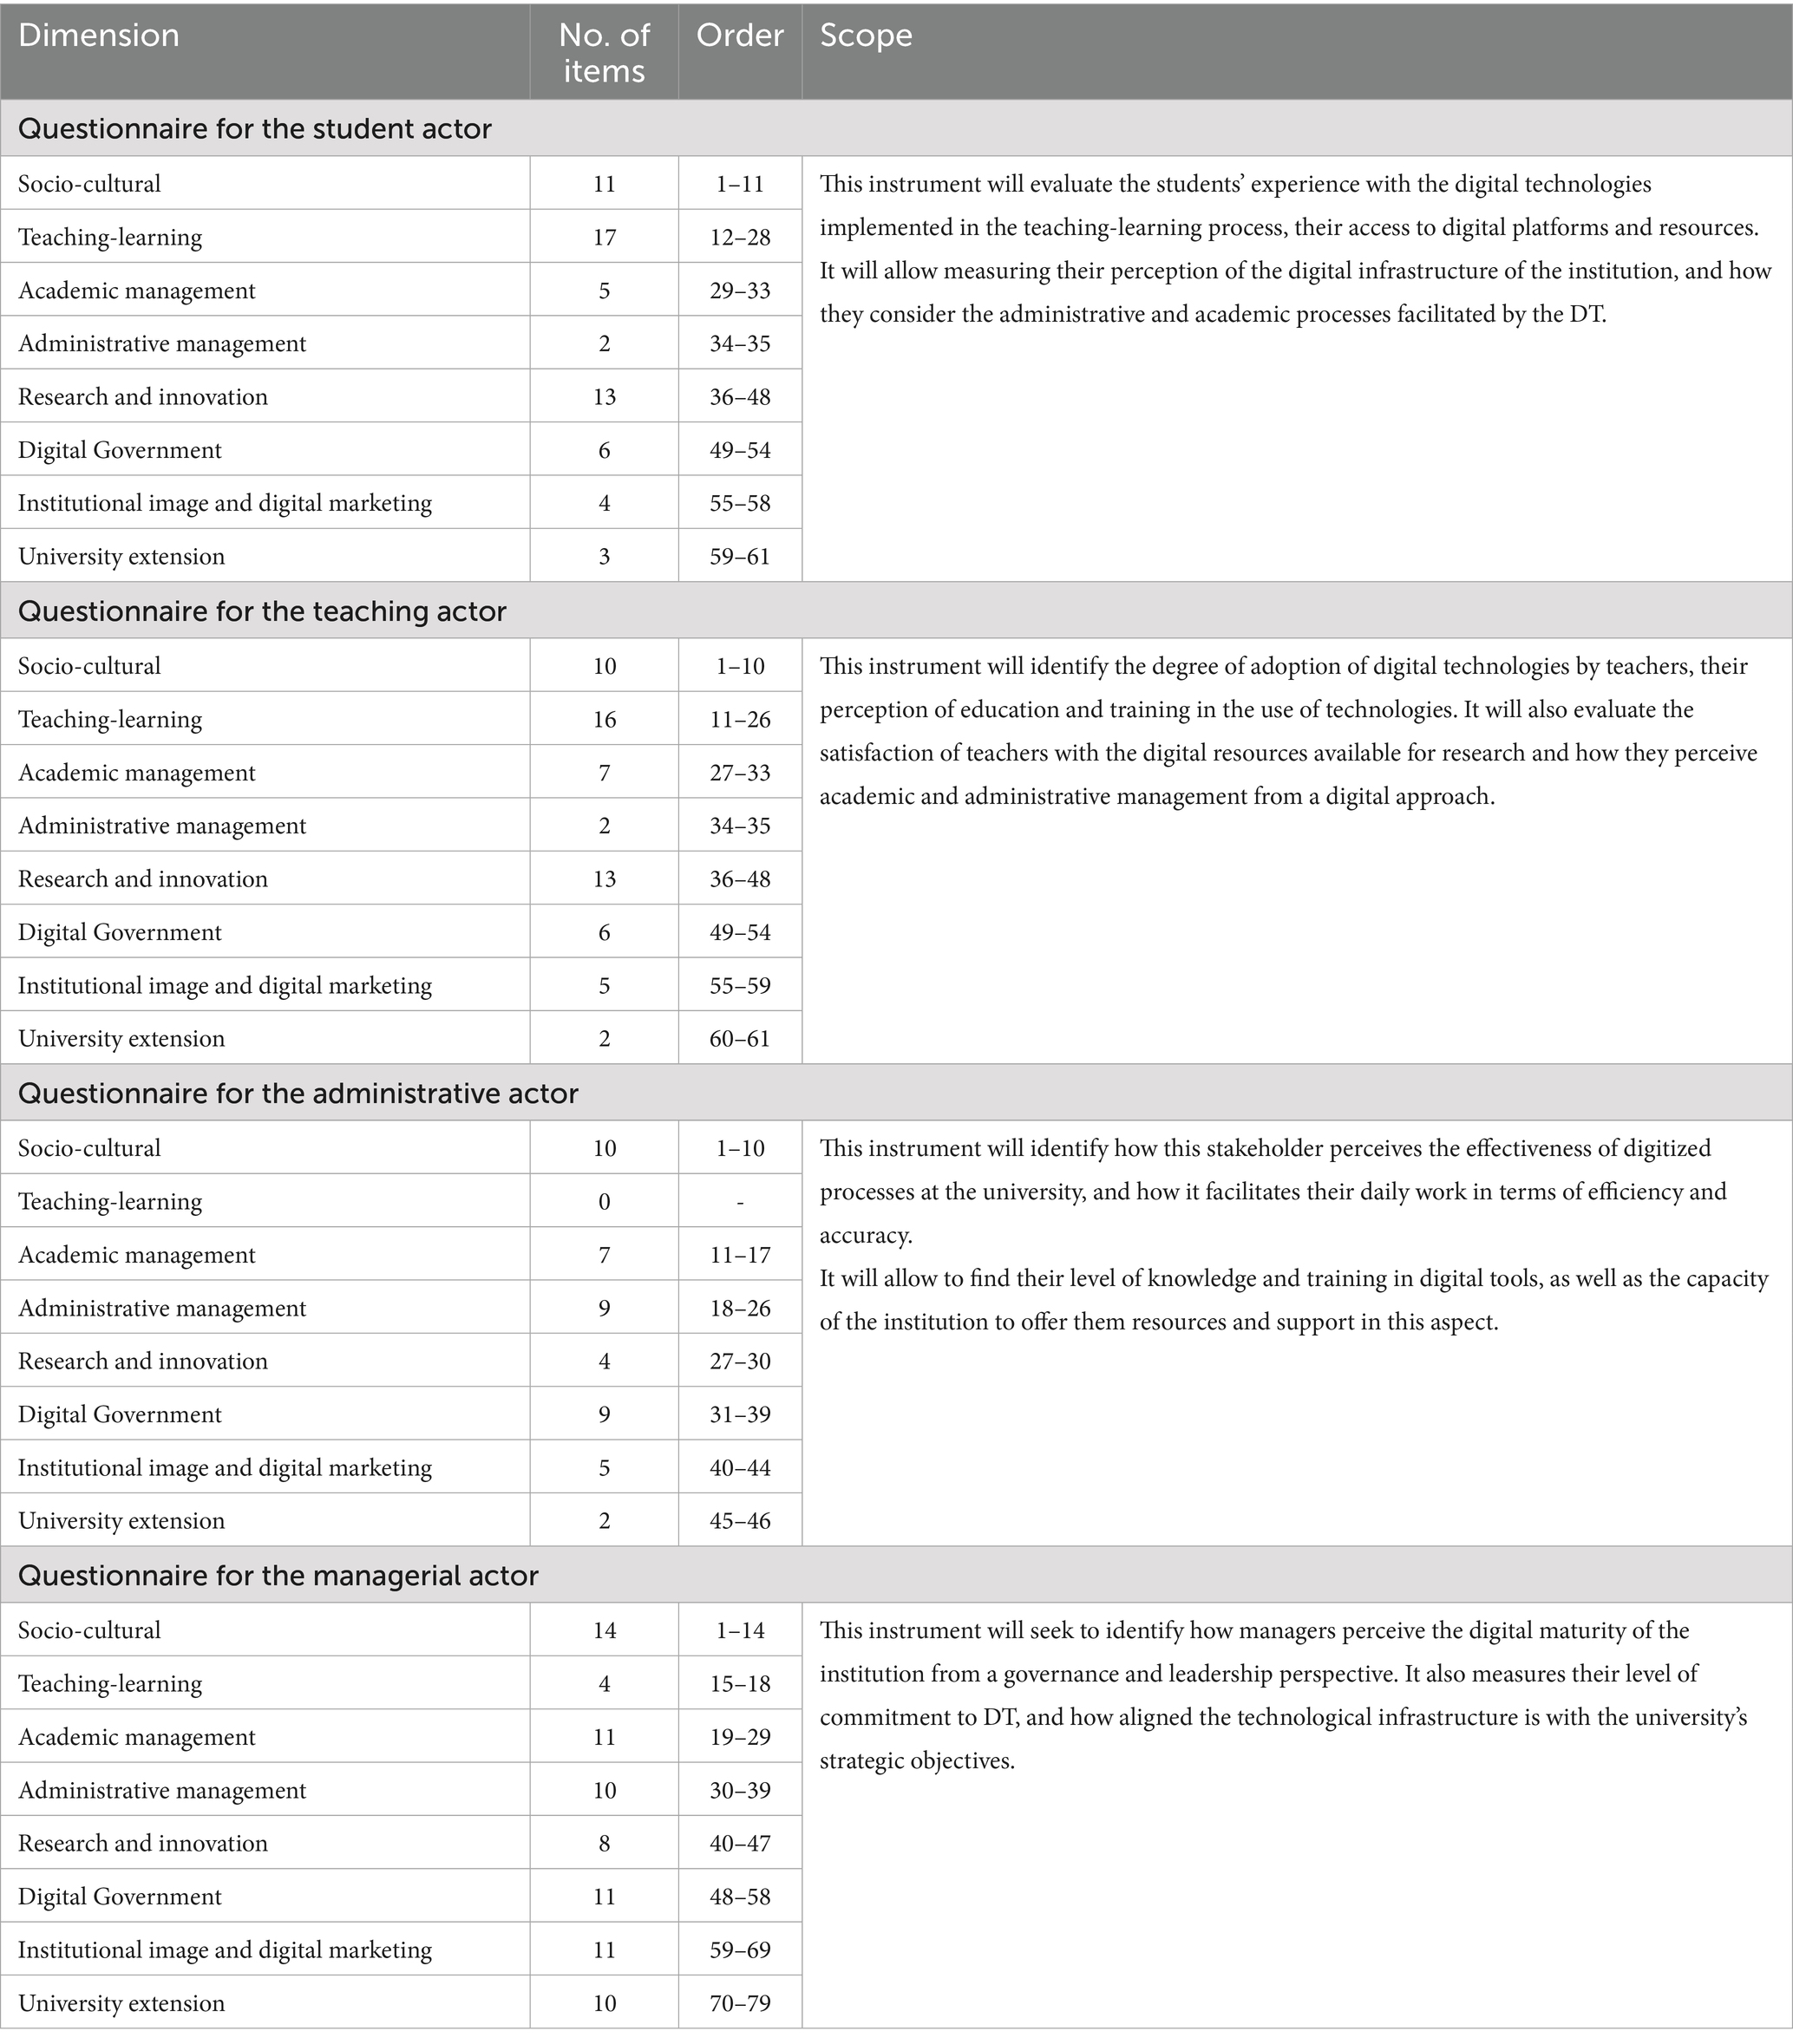
Table 2. Structure of the questionnaire for each actor.
In a consolidated manner, according to Table 2, for the student and teacher actors, their instruments consist of 61 items. In the case of the administrative actor the instrument will have 46 items and for the managerial actor there will be 79 items. All the instruments are designed under the Likert scale with 5 response points that will allow to accurately evaluate the degree of maturity for each actor and dimension.
3.3 Phase 03: iterative review and improvement
During this phase, the proposed instruments were reviewed and refined to improve their clarity, relevance and applicability for the stakeholders involved.
Given that the instruments were initially designed to capture stakeholder perceptions in relation to the digital maturity dimensions and cross-cutting DT components, the iterative approach allowed the questions to be optimized, ensuring that they adequately reflect the characteristics and context of each stakeholder.
The iterative review process included the participation of the research team, using literature and their experience in the field of ICTs. The formulation of each item in the instruments was analyzed, seeking its comprehension and adjustment to the level of knowledge and activities of each actor. Likewise, we sought to ensure that the questions were correctly integrated in each dimension with the cross-cutting components of DT.
An analysis of the applicability and relevance of the dimensions in the stakeholders was considered in this review, finding that the administrative stakeholder has no direct participation in the activities related to the teaching-learning dimension, so the instrument does not include questions for this dimension.
As a result of this review, the wording of 21 items was modified to improve clarity, reading time, or alignment with the corresponding dimensions. No items were deleted at this stage, but the location of 13 items was adjusted and they were relocated to other dimensions with better conceptual relevance.
This phase made it possible to ensure that the instruments are flexible and adjustable, and to capture the precise perceptions of the various stakeholder groups on the level of digital maturity in HEIs, before moving on to the validation and pilot testing stages.
3.4 Phase 04: validation of content by experts
The objective of this phase was to ensure that the instruments constructed have a solid content validity, which guaranteed that the items proposed in the questionnaires are the most appropriate for the dimensions and their integration with the cross-cutting components of DT, considering their relevance for each stakeholder.
A panel of four experts in the areas of DT, higher education and evaluation of measurement instruments was convened to analyze each of the items for clarity, relevance and alignment with the dimensions of digital maturity. Likewise, the experts evaluated the coherence of the items in their relationship with the cross-cutting components of DT.
The selection of experts was made using a competency matrix based on their specialization, experience and knowledge, assigning each expert a score based on their academic background, professional experience and participation in relevant research or projects, obtaining the necessary competencies for each of them.
The selected experts received a version of each instrument and an evaluation guide for each item, as well as the conceptual basis for each instrument. The experts had the opportunity to provide suggestions for modification or elimination of items.
Aiken’s V coefficient was used as the statistical measure to evaluate the degree of agreement among the experts in the analysis of the instruments in relation to the construct to be evaluated: level of DT maturity in HEIs.
3.4.1 Evaluation criteria
The matrix or table of competencies included the following criteria: Digital Transformation, Higher Education, measurement instruments and participation in relevant research and projects. Each criterion and its scores considered the experience and competencies of each expert (Table 3).
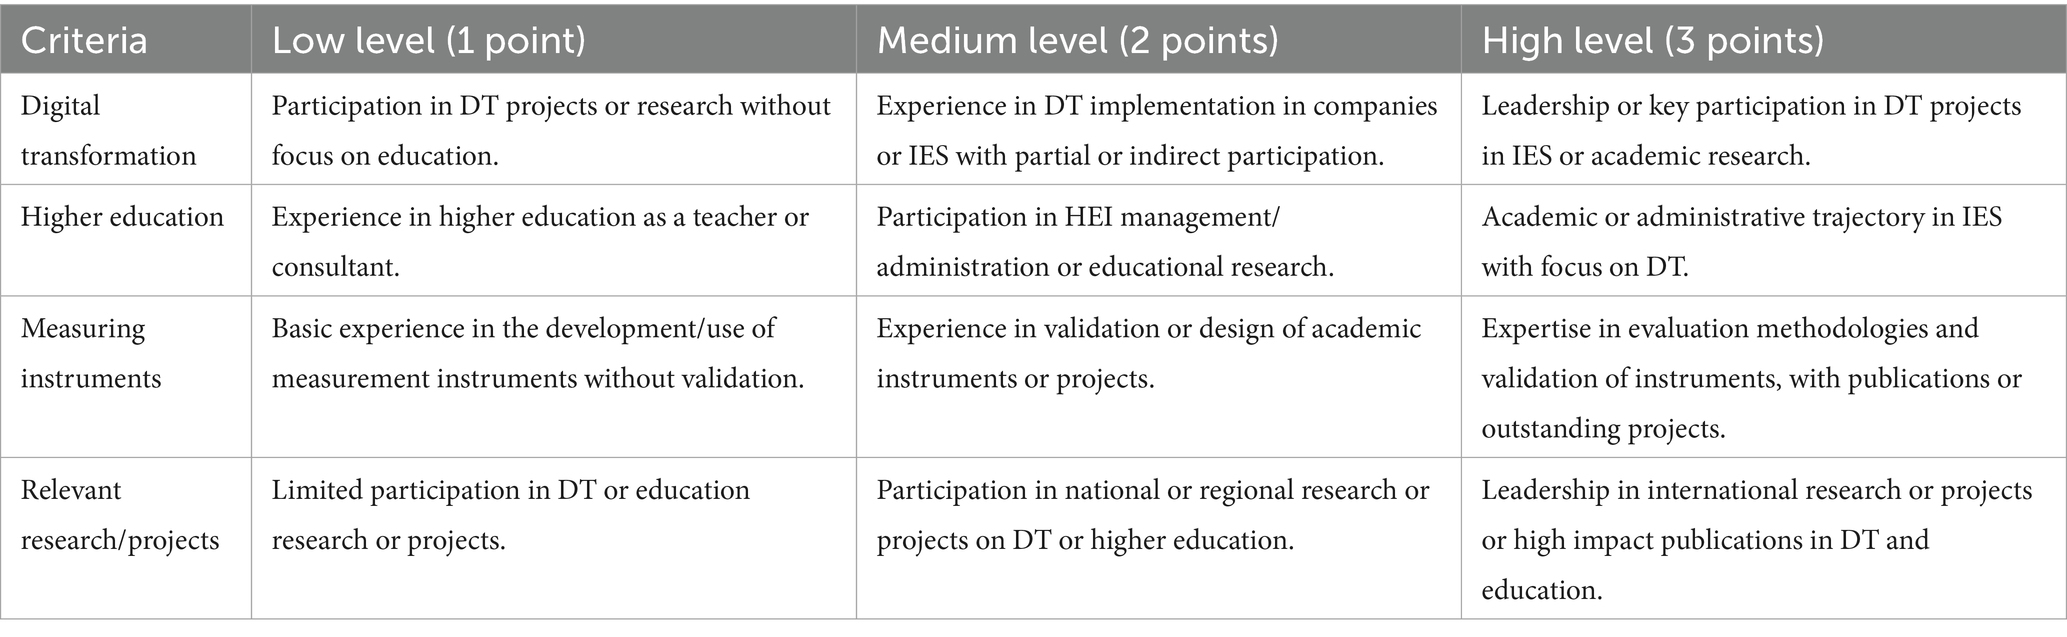
Table 3. Evaluation criteria for experts.
3.4.2 Structure of the competency matrix
The competency matrix structure includes criteria for assessing the level of experience in digital transformation, higher education, evaluation of measurement instruments, and participation in research or projects. Each criterion was measured on a scale of 1 to 3 points.
3.4.3 Assignment of points
The evaluation was organized and ranked according to the total points obtained in the table. The range of scores (1–12 points) allowed the selection of a panel of experts with an appropriate balance of experience and competencies in the critical areas.
3.4.4 Panel selection
Experts with scores in the range of 9 to 12 will be those with a high level of expertise in all key areas.
Experts with scores between 8 and 11 will have intermediate experience, but will be very useful if you want to balance the panel.
Experts with less than 8 points could be considered if they have an outstanding specialization in a key area (e.g., Digital Transformation in Higher Education), although it is recommended that the panel have a balanced mix of all areas.
3.4.5 Evaluation of instruments
Numerical values were assigned to the categories as follows: essential = 3, important = 2, useful = 1, not essential = 0 and not relevant = −1.
3.4.6 Aiken V coefficient
This coefficient ranges from 0 to 1. The closer the value is to 1, the greater the agreement among the judges and, therefore, the greater the evidence of content validity of the item.
Aiken’s V coefficient formula:
Where:
V: Aiken’s V coefficient (value to be calculated).
M: Average of the scores assigned to the item by the judges.
Lp: Minimum possible value of the scale (in this case, −1, since the “Not relevant” category has a value of −1).
L: Maximum possible value of the scale (in this case, 3, since the “Essential” category has a value of 3).
3.5 Phase 05: pilot test
It was carried out in a faculty representative of the university in terms of academic diversity, organizational structure, and participation in DT initiatives. Although the sample size was limited, it included the four key stakeholder groups: 63 students, 18 teachers, 13 administrators, and 13 managers. This intentional sampling allowed for the selection of stakeholders who actively participate in DT processes. The main objective of this pilot test was to verify the psychometric validity and internal consistency of the proposed instruments. While this approach limits statistical generalization, it is methodologically appropriate for the instrument development stage, as noted in Bujang et al. (2024). In future studies, the application will be extended to other faculties and institutions to reinforce the external validity of the results.
Once the pilot test was completed, SPSS software was used to perform an analysis of the means and standard deviations for each item in their respective dimensions, seeking which of them have consistency or variability in the responses. The variability made it possible to identify difficulties in the interpretation of the item or, in any case, that it does not contribute to the desired measurement for that dimension.
3.6 Phase 06: reliability and validity analysis
This phase made it possible to analyze the instruments to determine that they effectively measure the level of DT maturity in HEIs, guaranteeing consistency in their measurements, and that they are appropriate to the theoretical and methodological model and its components.
Reliability was calculated using Cronbach’s alpha for each instrument. This coefficient made it possible to measure the internal consistency of the items, identifying how they correlate with each other within the same dimension. Coefficient values greater than 0.90 are considered as an indicator of good internal reliability, which ensures that the items coherently measure the level of maturity for each dimension.
3.7 Phase 07: factor analysis
An exploratory factor analysis (EFA) was performed to explore the theoretical structure of the instruments, seeking to identify natural groupings of items and verify whether they correspond to the defined theoretical dimensions and their integration with the cross-cutting components of DT. The EFA made it possible to detect patterns found in the development of the pilot test, identifying items by dimensions that are grouped in a consistent manner.
SPSS software was used, identifying factors that explain most of the variability in the item responses. The selection criterion for these factors was an eigenvalue, considering an approach to the number of dimensions of the instruments, and the method considered was unweighted least squares. This method is appropriate when working with ordinal data, as is the case with Likert-type instruments (Ferrando and Seva, 2000; Lloret-Segura et al., 2014). Likewise, a factorial loading criterion < 0.5 was used to define the factors.
This analysis also made it possible to identify items that are not well aligned with the dimensions of the questionnaires, i.e., those items that do not load significantly on the expected factors. These items were revised, reformulated or eliminated as appropriate, to ensure that the instruments are consistent with the theoretical model of digital maturity.
4 Results
4.1 Contextualization and initial proposal for the instruments
An exploratory factor analysis (EFA) the contextualization of the instruments based on a theoretical and methodological model to measure the level of DT maturity in HEIs, building an instrument for each of the actors.
The first version of the instruments was developed considering the eight proposed dimensions, ensuring that each item is integrated with the cross-cutting DT components, allowing a comprehensive view of digital maturity in each of the stakeholders. The initial number of questions for each dimension was determined (detailed in the methodology), adjusted to the particularities of each stakeholder, with the objective of generating a holistic and balanced assessment of their level of DT maturity. These instruments were designed to assess both the perception and the effective implementation of DT in the various areas of the HEI. The Likert scale used was: always, almost always, sometimes, almost never and never.
The iterative review and improvement by the research team allowed for an exhaustive refinement of the proposed instruments, improving their clarity, relevance and coherence with cross-cutting dimensions and components of DT.
At the end of this phase, the final versions of the instruments were obtained, ready to be applied in the pilot test and to undergo subsequent validations. Table 4 shows the final number of items for each instrument according to its dimensions.
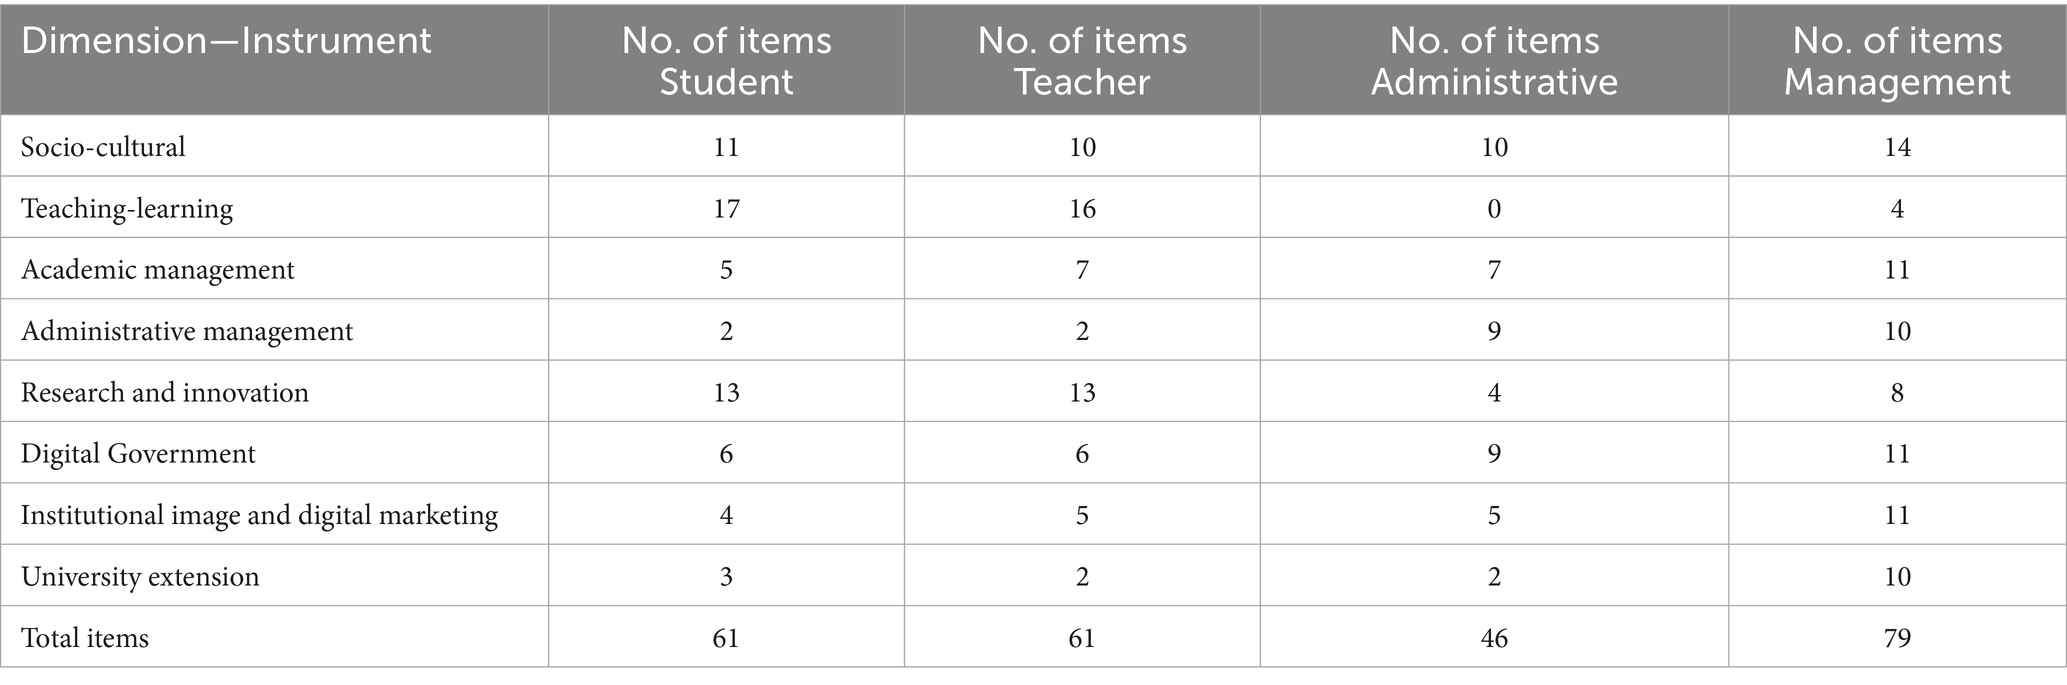
Table 4. Structure of the instruments.
In addition, for each instrument, items were determined for sociodemographic information, as follows for students: age range, gender, faculty, professional career, current cycle and area of origin. For teachers we considered: age range, gender, faculty, time working in years and area of origin. Likewise, for the administrative actor, the following was considered: age range, gender, faculty, area in which he/she works, position held, time working in years and area of origin. In the case of the managerial actor, the following were considered: age range, gender, faculty, area in which he/she works, position held and time working in years.
This review process ensured that each instrument was aligned with the objective of the study, ensuring that the items were representative of the key dimensions of DT and adjusted to the particular characteristics of each stakeholder group.
4.2 Content validation by experts
Using the competency matrix and following the evaluation criteria identified, scores were obtained for each expert, achieving results as described in Table 5.
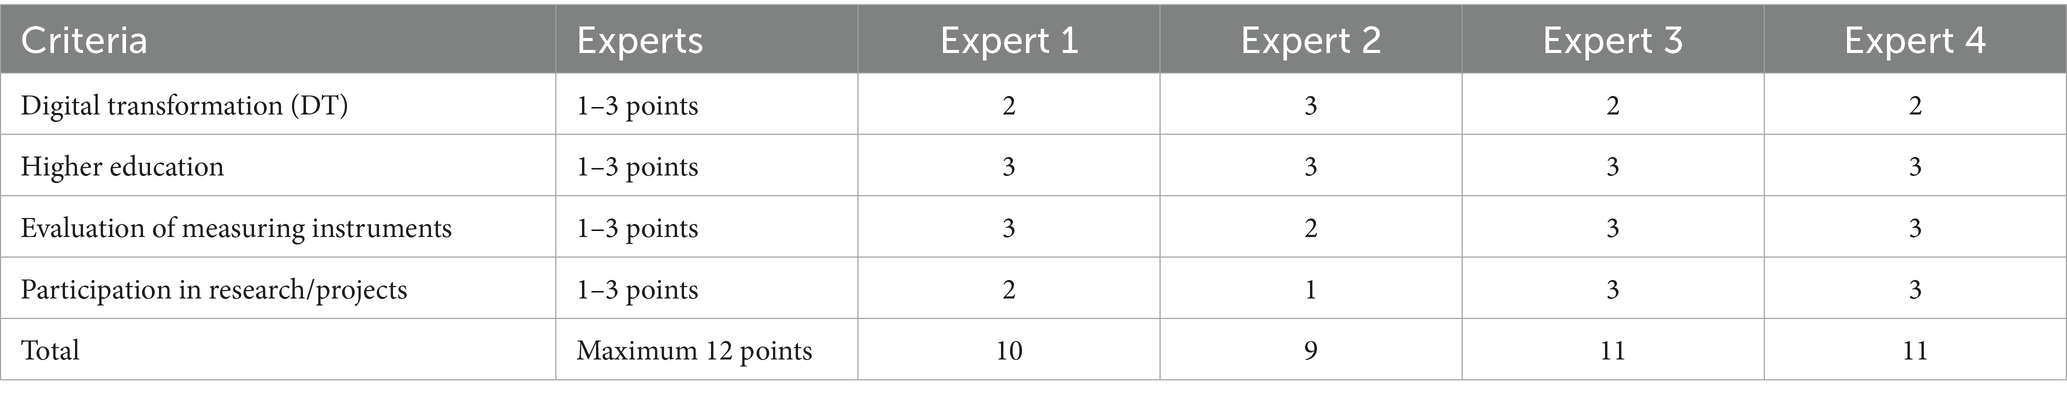
Table 5. Experts’ evaluation.
According to the results, the experts have total scores in the range of 9 to 12, which represent a high level of expertise in all key areas, being considered highly qualified personnel for the evaluation of the instruments.
In general terms, the values obtained from Aiken’s V for the items evaluated in the four instruments were found to be within acceptable ranges. For the student instrument, the values ranged from 0.375 to 1.00, with a majority of items above the threshold of 0.70, which are considered relevant. In the case of the teacher instrument, the values ranged from 0.25 to 1.00, with some items identified as not very relevant, which were adjusted in their wording. For the management instrument, the values also fluctuated between 0.375 and 1.00, while for the administrative instrument, the values ranged from 0.625 to 1.00, the latter being the instrument with the highest proportion of highly relevant items. In all cases, no items were eliminated, but their wording, sequence, or terminological accuracy was improved.
Each expert evaluated the instruments for each stakeholder and dimension, after calculating the V- Aiken for each question and considering that values higher than 0.7 will have the classification of Relevant. This information is available as Supplementary Tables 1–4.
4.3 Results of the pilot test
The pilot test was applied according to the samples for each stakeholder, which allowed a balanced representation of the stakeholders within the HEIs and the involvement with the transversal components of DT. The analysis per stakeholder was carried out according to their main socio-cultural data and in the case of the dimensions they were evaluated by the largest number of questions, seeking alignment with the most relevant areas and that provide better information for each specific group, thus developing a better analysis in terms of variability or discrimination of the questions and their answers.
4.3.1 Analysis of the instrument for the student actor
According to Table 6, the sample of students included 63 participants, with a greater range of ages between 21 and 25 years, which represented 65.1% of the total sample, this being the predominant group.
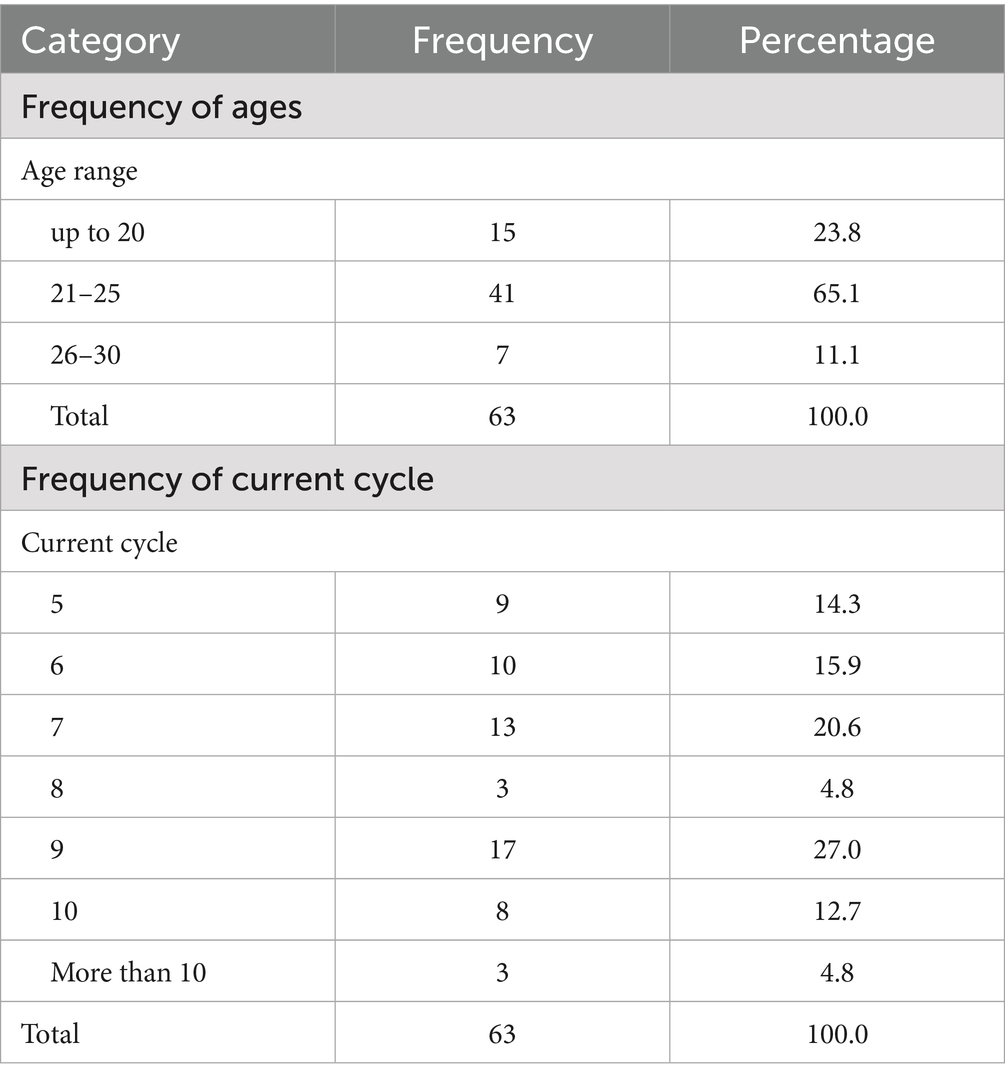
Table 6. Frequency of ages and current cycle for the student actor.
Regarding the current cycle of studies, the highest percentage of students is in the ninth cycle, with 27.0% of the participants. This is followed by the seventh cycle with 20.6% and the sixth cycle with 15.9%.
These results suggest that the student population that participated in the study is mostly composed of young people between 21 and 25 years of age and are in intermediate or advanced cycles of their academic programs.
The dimensions of analysis for the student actor were: socio-cultural (11 items), teaching-learning (17 items), research and innovation (13 items).
For the socio-cultural dimension, the statistical means oscillate between 4.10 and 4.54, where, questions P1 to P6 have means between 4.24 and 4.54, P8 oscillates at 4.10, indicating that students perceive very positively the socio-cultural aspects for DT in the institution. However, questions P7 to P11 show lower means, especially question P7 with a mean of 3.25, indicating a more neutral or variable perception regarding certain socio-cultural aspects.
As for the standard deviations, there is also variability in the answers, from question P1 to P6 there are low standard deviations (between 0.759 and 0.888), P8 has a value of 0.893, which suggests that the answers were quite consistent among the students. Questions P7 to P11 have higher standard deviations, especially P7 (1.150) and P9 (1.175), indicating more dispersion in the responses. That is, opinions are more divided on these items, which gives an indicator to revise them.
For the teaching-learning dimension questions P17, P22, and P26, show the highest means (around 4.2 to 4.37), followed by P18, P19, P21, P23 to P25, P28, and P29, P32 and P33, with means ranging from 4.16 to 4.03, indicating a very positive perception of the contexts of this dimension. Questions P20, P27, P30 and P31 show lower means (3.79 to 3.95), reflecting that some aspects are perceived more neutrally by students.
With respect to the standard deviations, in general, the variability of the responses is low or moderate for most items, ranging between 0.747 and 0.897, indicating good consistency among the responses. The highest variability is observed in questions Q27 and Q31 with standard deviations of 0.941 and 1.019, indicating that opinions are more divided on these items.
In the analysis of the research and innovation dimension, the means considered range from 3.73 to 4.03, with items P44 to P46, followed by P48, P41, and P38 have the highest values, indicating that students perceive moderately positively the aspects related to research and innovation. Questions P36 and P37 present the lowest means (3.43 and 3.40), considering more neutrality on these items.
The standard deviations range from 0.740 to 1.073, in general, there is greater variability in almost all responses for this dimension (from 0.740 to 0.882), indicating that students have more diverse opinions on these questions.
4.3.2 Analysis of the instrument for the teaching actor
Considering Table 7, the analysis shows that the majority of teachers surveyed are over 50 years of age, which suggests that the teaching staff has considerable experience and trajectory. Only a small percentage is between 41 and 45 years of age, reflecting an older teaching profile.
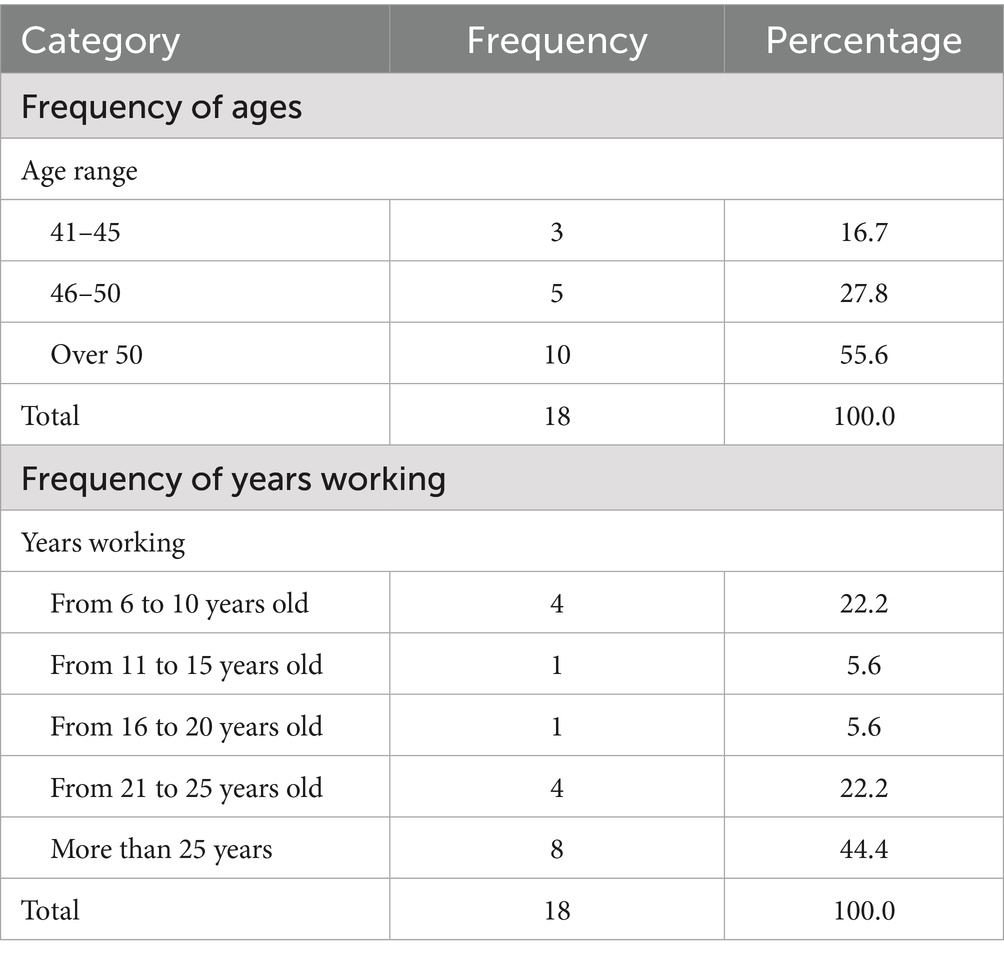
Table 7. Frequency of ages and years working for the teaching actor.
According to Table 7, a significant majority of teachers have more than 25 years working in the institution, which suggests a high level of permanence and experience. However, it is also observed that there are few teachers in the intermediate stages of their careers, which could reflect a lack of renewal of the teaching staff every certain period of time.
The experience and background of teachers are important factors to consider when assessing digital maturity, as they may have different perceptions and capabilities regarding digital transformation.
The dimensions of analysis for the teaching actor were: socio-cultural (11 items), teaching-learning (17 items), research and innovation (13 items).
For the socio-cultural dimension, questions P1 to P6 have high means, between 4.28 and 4.78, indicating that teachers perceive positively the socio-cultural aspects related to DT in the institution. The standard deviations in these items range from 0.548 to 0.958, indicating that, although the responses are mostly consistent, there is slight variability in some items, such as in P1 and P3.
However, from P7 to P9, lower means are observed (between 2.83 and 3.89), with higher standard deviations, indicating that they have more varied opinions on these aspects, which could require revision or adjustment.
For the teaching-learning dimension, most items, such as Q18 to Q26, have high means, close to or above 4.0 (where Q18 has the highest mean of 4.67), indicating a very positive perception in these aspects related to DT. Likewise, their standard deviations are low or moderate (between 0.485 and 1.162), indicating consistency in the responses, although P20 and P27 show variability, likewise, questions P31 to P33 have slightly lower means (close 3.67–3.94) indicating a somewhat more neutral perception, suggesting that some teachers do not fully agree with some aspects of digital learning or do not apply uniformly for all teachers. For the research and innovation dimension, P36, P37, and P44 show moderate means (between 4.44 and 4.06) and also moderate standard deviations (between 0.705 and 0.832), indicating favorable perception and consistency in responses.
Items P38 to P41 have lower means (between 3.28 and 3.83), indicating more neutral perceptions, and some low standard deviations, suggesting consistency in responses, but a tendency towards negative perception. P43 and P45 have the lowest means, with 2.89 and 2.50 respectively, and high variability in P45 (standard deviation of 1.200), indicating that teachers do not perceive these aspects positively and have varied opinions.
4.3.3 Analysis of the instrument for the administrative actor
According to Table 8, most of the administrative staff surveyed are in the 50 + age group, representing 38.5% of the sample. The age groups 41–45 years and 46–50 years are also well represented in the sample (3.8 and 23.1%). Therefore, the majority of the administrative staff is older (41 years or more), which reveals that there are people with experience and years in the institution.
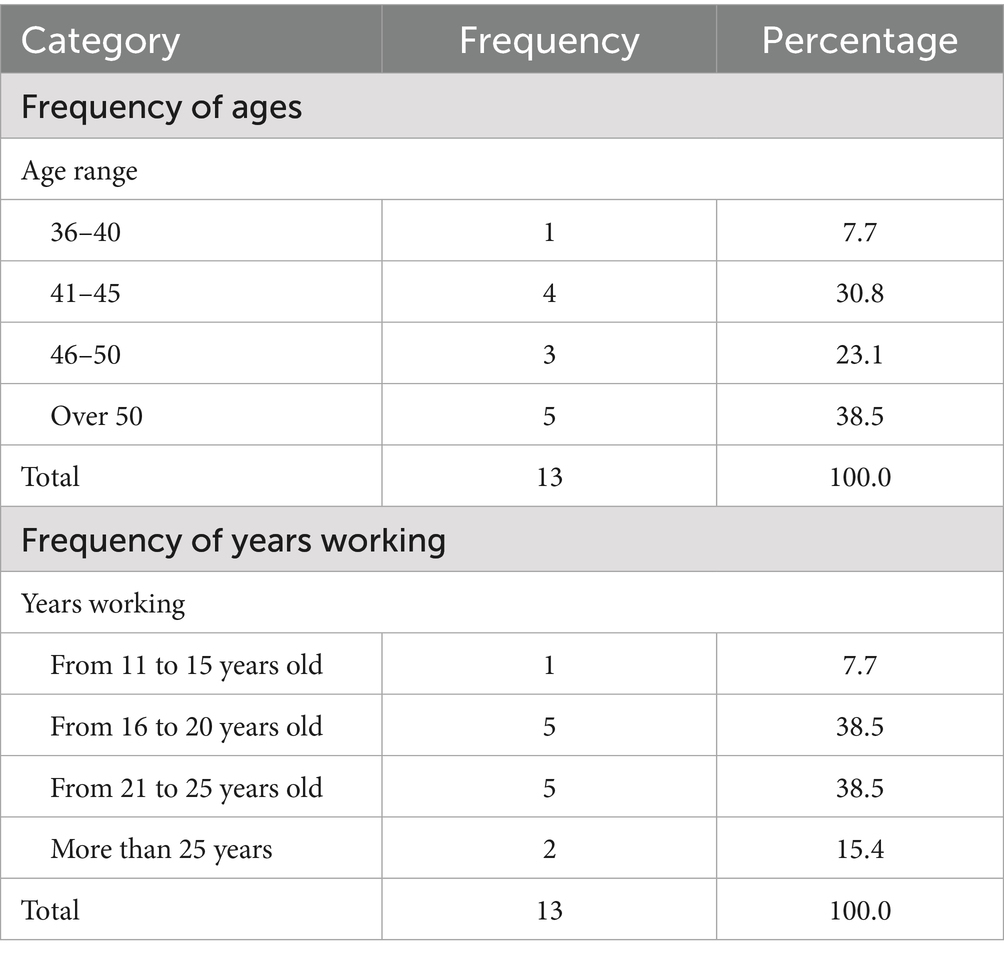
Table 8. Frequency of ages and years working for the administrative actor.
Analyzing the number of years working in the institution, the majority have worked in the institution between 16 and 25 years, representing 77% of the sample (10 people), two people have more than 25 years of service and only one has worked between 11 and 15 years. Therefore, there is a significant proportion of employees in the institution, with more than half working between 16 and 25 years. The dimensions of analysis for the administrative actor were: socio-cultural (10 items), administrative management (9 items) and digital governance (9 items).
In the socio-cultural dimension, items P1 to P6 have high means (between 4.23 and 4.54), indicating that managers positively perceive socio-cultural aspects in the DT context. Their standard deviations ranged from low to moderate (between 0.660 and 0.870), reflecting a good consistency in the responses.
However, items P7 to P10 had lower means (between 3.08 and 3.62) and based on their higher standard deviations, it reveals variability in the responses and possible differences in the perception of these aspects among the administrative group.
In the administrative management dimension, items P18 to P21 present means between 3.38 and 3.77, indicating a moderate perception of the aspects of administrative management as they relate to DT. Their standard deviations are also moderate (between 0.855 and 1.266), suggesting that there is a slight variability.
Items P22 to P26 obtained lower means (between 2.46 and 3.31), suggesting that administrators perceive these aspects less positively, and that their standard deviations are high in some of these items, showing considerable variability in the responses, which indicates that there are aspects that are not being well received or applied consistently.
In the digital government dimension, items P31 to P33 have means between 3.08 and 3.77, reflecting a moderate to positive perception of aspects of digital government. Their standard deviations are moderate (between 0.832 and 1.127), indicating that, although there is consistency in the responses, in some aspects there is a lot of variability.
Items such as Q35 to Q36 have lower means (between 2.77 and 2.92) and high standard deviations, indicating a less favorable perception of some aspects and high variability in the perception of aspects of digital governance.
4.3.4 Analysis of the management stakeholder instrument
The distribution of the managers surveyed, according to Table 9, is in the 50 + age bracket, representing 76.9% of the sample, which may suggest a team with extensive experience and trajectory in the management field.
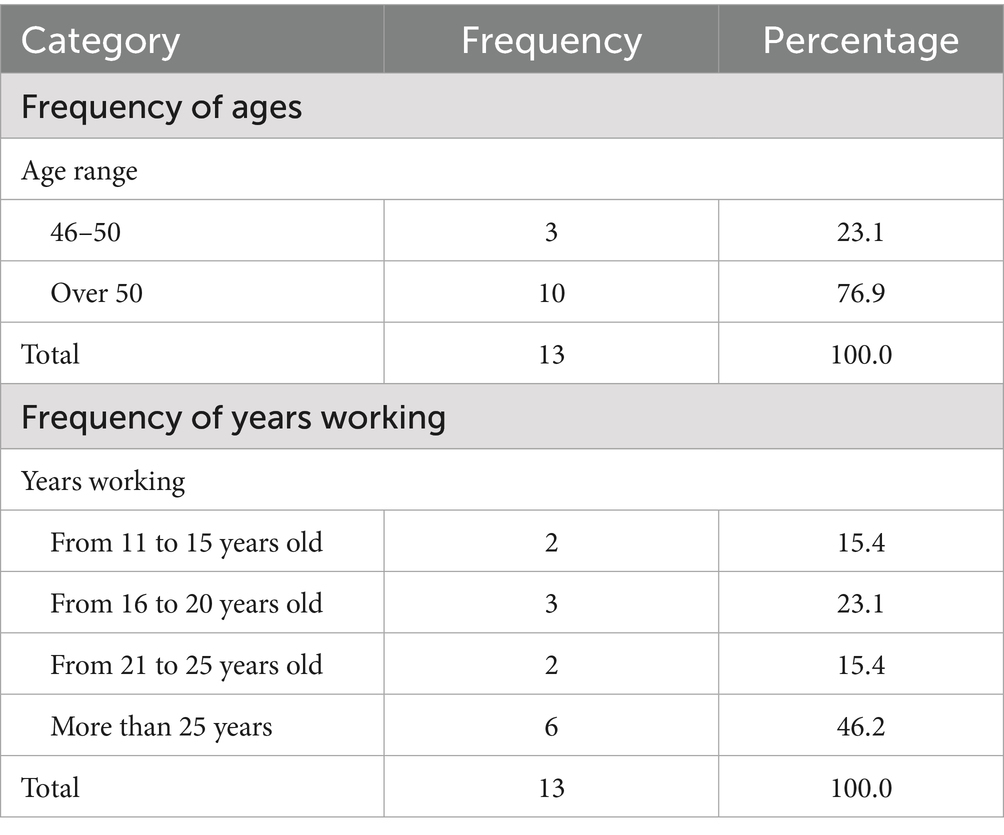
Table 9. Frequency of ages and years working for the managerial actor.
Likewise, a large proportion of the managers have worked in the institution for more than 25 years (46.2%), 23.1% have worked between 16 and 20 years and another group reaches 15.4% (between 11 and 15 years and 21 to 25 years). These results reinforce the idea that the management team is composed of people with a great deal of experience, however, there are also managers with average experience.
The dimensions of analysis for the managerial actor were: socio-cultural (14 items), academic management (11 items) and institutional image and digital marketing (9 items).
In the socio-cultural dimension, items P3, P4, P5 and P6, show means ranging from 4.54 to 4.62, with standard deviations ranging from 1.121 to 1.127, therefore, although respondents consider these aspects very important, there is variability in the responses.
Similarly, items P7, P8, and P11 to P14, show lower means (between 2.46 and 3.92) with standard deviations greater than 1, therefore, this indicates greater variability in perceptions or divergent interpretations among managers regarding the integration of cultural and social aspects in DT.
For the academic management dimension, items P19 and P25 have high means (3.92 and 4.31 respectively) and low standard deviations (0.641 and 0.480), therefore, they have consensus on the importance of academic management in DT. On the other hand, items P26 and P29 have low means (3.08 and 3.15), and present higher standard deviations (0.760 and 1.068), existing greater variability in these items, being necessary to review or modify them for a better understanding.
In the institutional image and digital marketing dimension, the highest means are found in items P59 (3.38) and P66 (3.62), which represent a moderate perception and their standard deviations, 1.044 and 1.261 respectively, indicate divided opinions and therefore variability in the responses. Items P67 and P69 have means of 2.38, indicating that respondents do not value these aspects highly, although their standard deviations of 0.961 indicate that there is consensus among managers. In the other items, the standard deviations exceed 1.0, so there are mixed perceptions and variability in the responses.
4.4 Reliability and validity analysis
Table 10 shows a summary of the Cronbach’s alpha results for all the instruments.
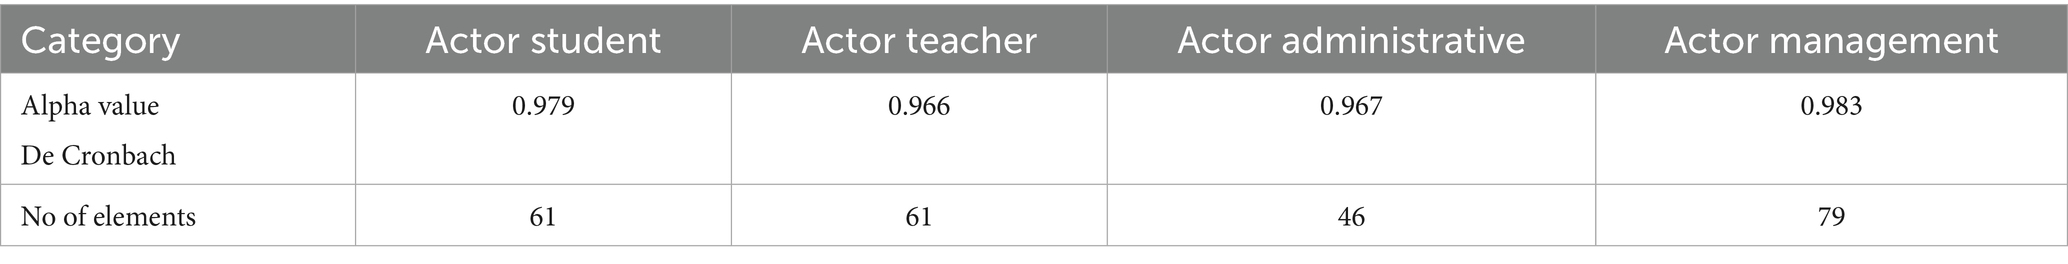
Table 10. Cronbach’s alpha for each actor and their instrument.
For the instrument aimed at the student actor, a reliability of 0.979 was found, indicating an excellent internal consistency of the instrument. This result reflects that the 61 items are highly correlated and manage to consistently measure key aspects of digital maturity in students.
As for the teacher’s instrument, a very good reliability was obtained with a value of 0.966, so that the items are related and have consistency in the measurements of the proposed constructs.
For the administrative actor instrument, a value of 0.967 was found, indicating excellent internal reliability, with its 46 items very well related and uniformly measuring the constructs defined for digital maturity.
In the instrument for the managerial actor, a value of 0.983 was obtained, demonstrating excellent internal consistency among its 79 items, which ensures that the instrument measures what was founded on digital maturity in HEIs.
However, it should be noted that despite the high and very good Cronbach’s Alpha values for all the instruments, representing an excellent internal consistency of the instruments, values close to or above 0.95 could indicate some redundancy between items, especially if there are very similar formulations. Therefore, a detailed review of the items would be important to identify possible semantic overlaps and, if necessary, to optimize the extension of the instruments for future applications.
4.5 Exploratory factor analysis (EFA)
For this analysis, the KMO (Kaiser-Meyer-Olkin) and Bartlett’s test was applied to evaluate the relevance of the EFA, finding an index of 0.955 for the student instrument, which indicates a high appropriateness for the EFA. Also, Barlett’s test of sphericity was significant (Χ^2 = 13398.041; p < 0.001), which confirmed the sufficient correlation between the items.
Table 11 shows the EFA for the instrument by actor, considering the factor loadings (FF) found that determined the grouping of the items into factors.
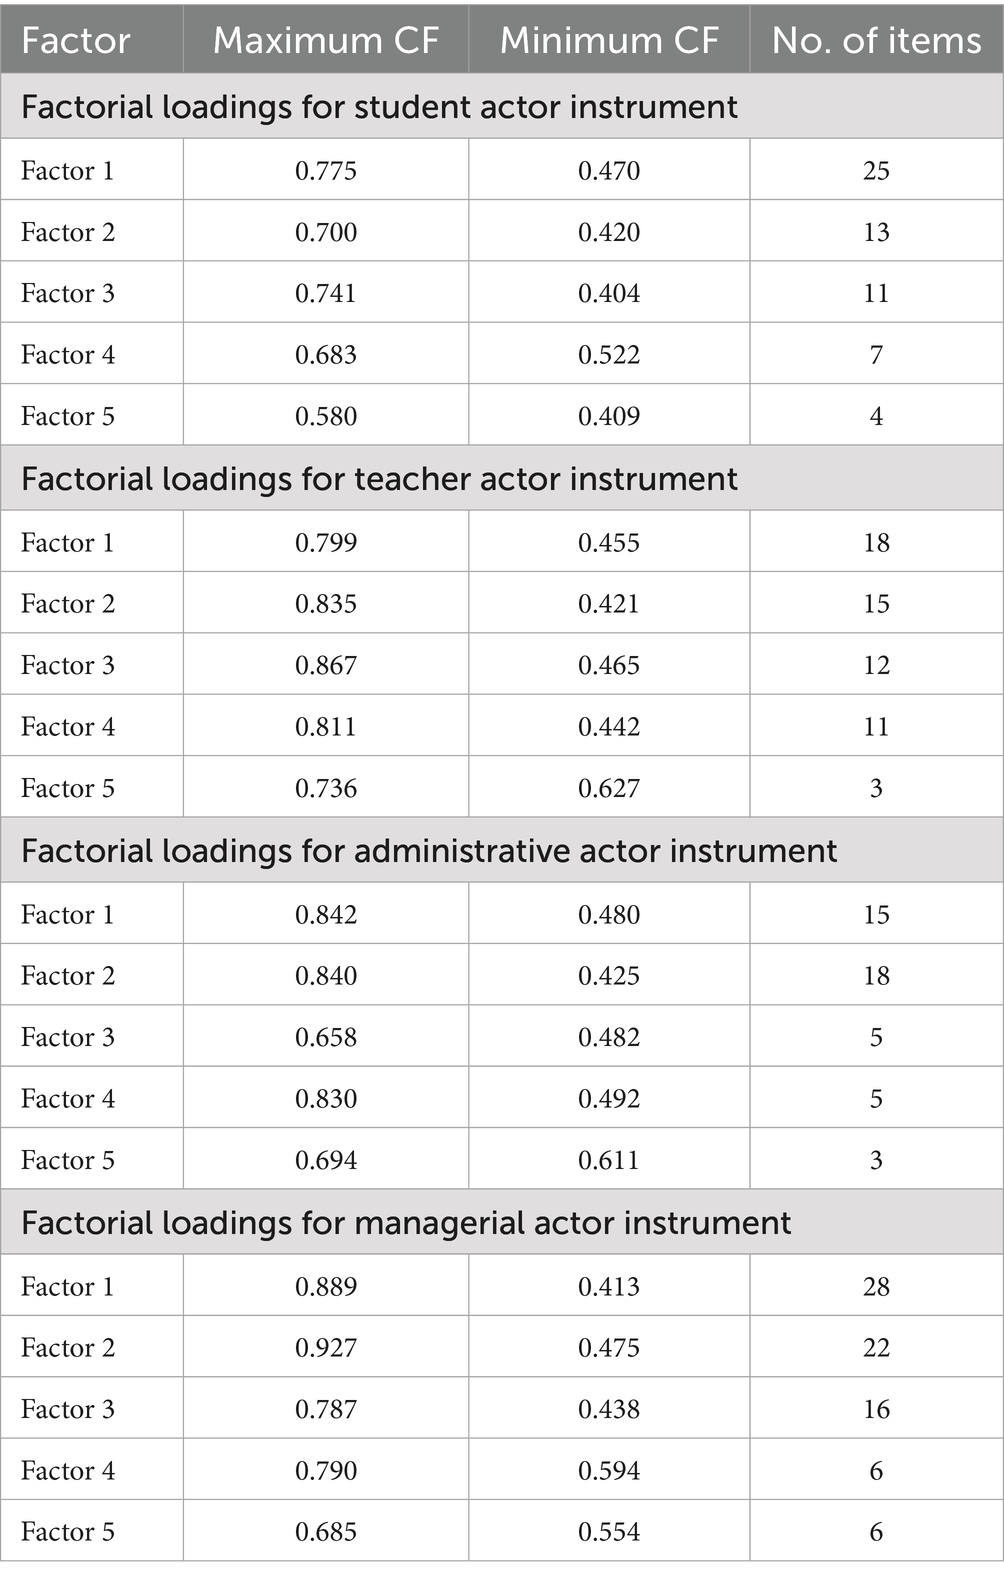
Table 11. Factorial loadings for instruments by actor.
For the student actor, the EFA grouped items into 5 factors, which did not coincide with the 8 dimensions originally designed; likewise, one item was discarded due to a very low factor load. The total percentage of variance explained for the 5 factors is approximately 58.8%, making the analysis of the instrument acceptable.
For the teacher instrument, the EFA did not display the KMO and Bartlett’s test due to the low number of responses.
Items were grouped into 5 factors and 2 items were discarded due to low factor loadings. The total percentage of variance explained for the 5 factors is approximately 58.609%, so the analysis of the instrument is considered acceptable.
For the administrative instrument, the KMO and Bartlett’s test was also not shown because of the small number of responses.
The EFA grouped items into 5 factors and there were no discarded items. The total percentage of variance explained for the 5 factors is approximately 71.262%, so the analysis of the instrument is considered acceptable.
For the managers’ instrument, the EFA also did not show the KMO and Bartlett’s test.
The EFA grouped items into 5 factors and one item was discarded. The total percentage of variance explained for the 5 factors is approximately 74.456%, so the analysis of the instrument is considered acceptable.
Exploratory factor analysis (EFA) revealed an empirical structure different from the initial theoretical proposal by Bravo-Jaico et al. (2025), highlighting new associations between items and dimensions. This regrouping reflects different perceptions among actors and is considered an opportunity to refine the instrument, not a weakness of the model. The consolidation of factors and the refinement of items strengthen its internal validity and pave the way for future confirmatory factor analysis (CFA) with larger samples.
A more in-depth analysis of the EFA reveals that, in the student instrument, the first factor groups together items related to “research and innovation,” “institutional image,” and “digital governance,” suggesting that students perceive these aspects as part of the same institutional experience linked to digital positioning. The second factor combines items related to “teaching-learning” and “academic management,” indicating that students tend to view the educational experience and administrative processes as an integrated educational continuum.
As an illustrative example of the process of regrouping and interpreting factors, Table 12 presents the analysis carried out for the student actor instrument, indicating the predominant theoretical dimensions in each emerging factor and its corresponding conceptual label. The complete tables corresponding to the instruments applied to teachers, administrators, and managers, as well as details of the grouping of items and factors, are available in the referenced data repository.
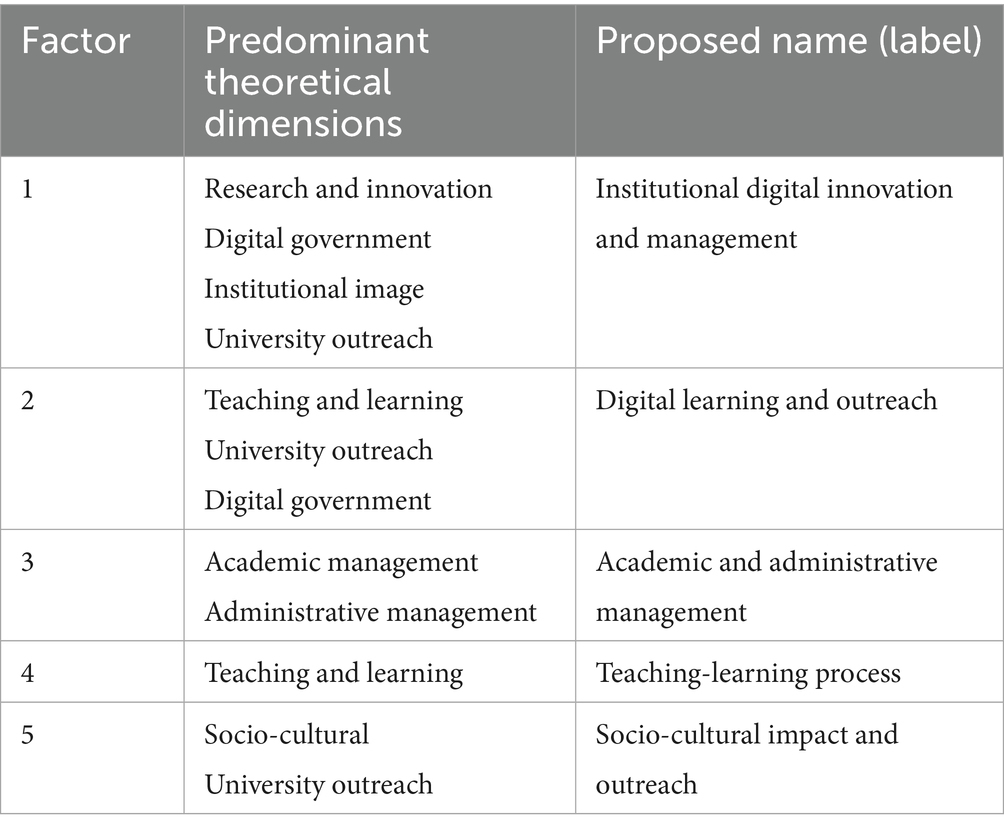
Table 12. Structure of the student instrument with EFA analysis.
4.6 Construction of final instruments
The validation of the instruments was carried out through three methodological approaches: expert analysis, statistical analysis of means and standard deviations, and exploratory factor analysis (EFA). Each method provided important information for the optimization of the final instruments.
First, the expert analysis allowed us to evaluate the content validity of each item, which resulted in the elimination of questions that were not considered pertinent within each dimension. Subsequently, the analysis of means and standard deviations allowed us to identify those items with greater stability and consistency in the responses, ensuring that they reflect well the perceptions of the respondents without generating ambiguities.
Finally, the EFA revealed a dimensional structure different from the initial proposal: while the preliminary version of the instruments was composed of eight dimensions, the EFA identified between four and five main factors for each actor, suggesting a reorganization of the items into new dimensions in coherence with the data obtained. This led to a redefinition of the original dimensions, merging those that were highly correlated and eliminating those that did not have sufficient statistical support.
Based on these analyses, the final instruments were constructed, ensuring that each dimension has an adequate number of items, maintaining conceptual validity and statistical reliability.
The strategy adopted allowed optimizing the instruments for each actor, ensuring that they are valid and reliable tools for measuring digital maturity in the HEIs. The consolidated items by final instruments obtained are shown in Table 13.
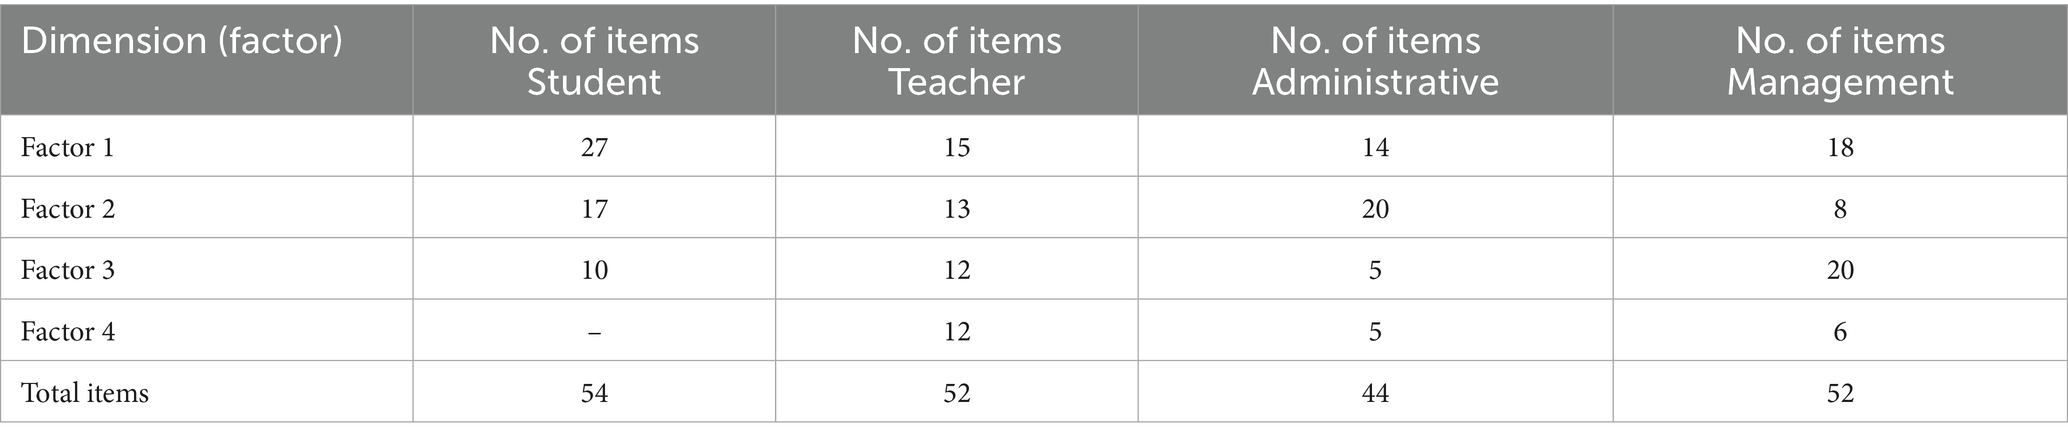
Table 13. Final structure of the instruments.
The details of all the analyses performed, as well as the specification of the instruments, with factor names and the distribution of the items, are available in the repository https://zenodo.org/records/14977641.
5 Discussion
This work focused on the development of instruments to assess the maturity of Digital Transformation in Higher Education Institutions, based on a theoretical and methodological model that incorporates eight dimensions and four main actors: students, teachers, administrators and managers. A similar study is the work done by Haryanti et al. (2023), which recognizes the importance of using comprehensive maturity models that include multiple dimensions of digital transformation, including organizational culture, process management and innovation.
The work of Gokalp and Martinez (2021) and Haryanti et al. (2023), performed the prioritization of instrument validation through expert review of DT, higher education and instrument evaluation. In this study, it was also validated using Aiken’s V coefficient to determine the level of agreement among experts.
Exploratory Factor Analysis (EFA) was used to validate the structure of the instruments and their grouping into factors, as performed by Soroka et al. (2023), a common practice in research on digital maturity.
This research is relevant because of the stakeholder approach, coinciding with Haryanti et al. (2023), where the importance of considering the perspectives of the different stakeholders involved in DT is recognized, designing specific instruments for each one.
Regarding the differentiation of the present study, the specific focus on HEIs is enhanced, this research distinguishes itself and covers this aspect, which is not addressed in previous studies and considers the particularities of this sector. A methodological theoretical model was used that integrates eight dimensions and four cross-cutting components of DT, unlike other studies that use pre-existing models.
Although the sample size was limited in some groups of actors, this study was developed as an initial validation of instruments, based on a pilot test, to measure digital maturity in HEIs. A faculty representative of the university’s organizational structure was chosen, and theoretical and empirical criteria appropriate for this type of study were applied. Future research with larger samples will reinforce the validity and reliability of the proposed instruments.
The factors obtained through the FEA show a more integrated view of digital transformation in HEIs. Thus, the convergence between autonomy, collaboration, and critical thinking indicates that digital competencies are developed in participatory contexts mediated by technology. These findings validate the proposed theoretical model (Bravo-Jaico et al., 2025) and guide practical actions such as the design of training programs, the monitoring of digital maturity, and the identification of gaps according to the institutional actor.
As shown in Table 12, these empirical groupings of factors obtained with the EFA suggest that, in practice, the original dimensions may be perceived in a more integrated way by the actors. This does not invalidate the original conceptual model, but it does invite consideration of adjustments or simplifications aimed at facilitating its operational application and future validation in other contexts. Therefore, the model could benefit from iterative revision, incorporating both theoretical soundness and empirical evidence.
The empirical grouping of items into five factors, distinct from the initial eight theoretical dimensions, is consistent with previous studies on consolidation and simplification of dimensions in validation processes (Boateng et al., 2018; van der Eijk and Rose, 2015). This supports the possible contextual adaptation of the digital maturity model, as suggested by Hambleton et al. (2004), allowing for practical adjustments without compromising conceptual validity.
The finding of greater variability in the perceptions of administrative staff and managers could be due to the diversity of functions, levels of responsibility, and levels of exposure to DT processes in their respective roles. This result implies that DT strategies should not be uniform, but rather tailored to the characteristics of each actor, thus reinforcing a differentiated approach to the implementation of the digital maturity model in HEIs.
Improvements are presented with respect to previous works, the inclusion of transversal components of DT in the digital maturity model, which provides a more complete vision of the digital transformation process. Another aspect of improvement is the design of customized instruments for each actor (student, faculty, administrative and management), which allows a more accurate assessment of how each group perceives and implements DT in their daily activities.
Finally, the in-depth analysis of dimensions, analyzing in detail the responses by dimension for each stakeholder, identifying patterns of perception and areas for improvement in the implementation of DT, as shown in the results section.
6 Conclusion
The construction of the measurement instruments was methodologically guided by seven phases: contextualization, initial proposal, iterative improvement, validation by experts, pilot test, reliability analysis and factor analysis. Measurement instruments were developed based on a previous methodological theoretical model, which through its 8 dimensions of analysis and its 4 DT components, allowed obtaining a comprehensive view of digital maturity in HEIs.
Four instruments were designed, differentiated by actor, in order to capture their differentiated perspectives and knowledge about DT in HEIs. This differentiation allowed a more accurate assessment of how each group perceives the integration of DT in their daily actions and work. These instruments were validated in terms of content by a group of experts, who ensured that the items of each instrument were pertinent, clear and relevant to the measurement of the components of digital maturity in HEIs. The experts’ validations were analyzed with the Aiken V coefficient, finding that most items were well rated and others required adjustments.
The instruments were applied by means of a pilot test, with significant samples of the stakeholders involved, and the results, analyzed descriptively with SPSS software, made it possible to identify possible problems in the formulation of the items and to reformulate or eliminate them from the final version of the instruments. The results of the analysis by dimensions indicated that the perception of digital maturity varied significantly among the stakeholders. Thus, in the case of the student actor, the dimensions analyzed: socio-cultural (11 items), teaching-learning (17 items), research and innovation (13 items), determined that there is moderate variability in the responses, so items were improved and some were considered for elimination.
For teachers, similar patterns were identified in the socio-cultural (11 items), teaching-learning (17 items), research and innovation (13 items) dimensions, but with little variability in the answers, giving consistency and consensus in this group, which represents that teachers show a more consolidated perception of the impact of DT in their daily work.
For the administrative stakeholder, the respondents indicated that they have years of experience in the institution and show a higher degree of variability in their answers, which indicates that they are not understanding some aspects of DT or have different approaches to the use of digital technology.
However, in the analysis of the socio-cultural dimensions (14 items), academic management (11 items) and institutional image and digital marketing (9 items), moderate variability was found in their responses, suggesting that they have different approaches or perhaps other priorities regarding the implementation of DT in their institution. Likewise, the pilot test responses were analyzed with the calculation of Cronbach’s Alpha, where a good level of reliability (> 0.90) was identified in most of the dimensions of the different instruments, which supports their internal structure.
The exploratory factor analysis identified a differentiated factor structure in relation to the original instruments. For all EFAs in the four instruments, the total percentage of variance explained exceeded the required 50%, being considered adequate, and suggests that they effectively capture the main dimensions of digital transformation in the dimensions of an HEI, although some items originally assigned to specific dimensions were grouped into different factors, evidencing the need to adjust the initial instruments.
Three methodological approaches were used to validate the instruments: expert analysis, which provided content validity; statistical analysis of means and standard deviations, which identified the items with the greatest stability and consistency in the responses; and finally, exploratory factor analysis (EFA), which grouped items and restructured them dimensionally, joining dimensions with highly correlated items and eliminating those that did not have good statistical support.
Given that the EFA was applied to small samples of teachers, administrators, and managers, the findings should be considered preliminary. Although there is evidence in the literature supporting the use of small samples, we recognize the need to confirm this factor structure through subsequent studies with larger, more representative samples in future research in order to reinforce the structural validity of the instruments.
This study contributes to theoretical development and institutional management. Empirical validation of the instruments allows for a more accurate understanding of the levels of digital maturity of university stakeholders, guiding decisions on digital training, technological improvement, and resource allocation. In addition, emerging factors open up new lines of research on the interaction of the dimensions of digital change in the university environment.
From the results obtained, it is clear that the instruments developed have the potential to be effective tools for diagnosing digital maturity in higher education institutions, allowing universities to identify their strengths and areas for improvement in their digital transformation implementation process. Likewise, the perception considered for the various stakeholders provides a comprehensive diagnosis that will allow guiding strategic decisions and planning the necessary investment in technology and digitization within HEIs.
6.1 Limitations
Although the methods used to validate the instruments are appropriate, it should be recognized that the small size of some subsamples (particularly administrative and managerial staff) could affect the statistical stability of the results. This limitation is typical of pilot and exploratory studies, in which resources, access to participants, and available time may restrict the size of the sample. Nevertheless, the selection of a representative faculty and its organizational structure ensure adequate identification of different actors for the study.
A possible methodological limitation of the study relates to the existence of uncontrolled external variables that could have influenced participants’ responses, generating a confounding bias.
Although the EFA allowed us to identify a clear structure of factors in the instruments, no additional convergent or discriminant validity checks were performed. This limitation is due to the fact that the present study focused on developing an initial validation method for the instruments through a pilot context.
Although the EFA provides useful information about the structure of the instruments, the limited size of some samples may affect the stability of the results. This work should be understood as a pilot phase in a single faculty, so its findings are exploratory and may be strengthened in future applications with larger samples and additional structural validity analyses.
This research applied EFA as an initial phase of structural validation. It is recognized that future research should consider a more equitable collection of data among the different actors involved. A more balanced proportion will allow confirmatory factor analysis (CFA) to be performed for each group, thus strengthening the cross-validity of the instruments.
Although the instruments show evidence of internal consistency and adequate factor structure, they were validated at a Peruvian public university with specific sociocultural and organizational characteristics. Therefore, their application in other HEIs should be approached with caution. It is suggested that they be validated in diverse contexts to strengthen their external validity.
6.2 Future work
For future related studies, the graduate stakeholder should be considered, in order to understand how this group perceives the impact of digital maturity throughout their education and preparation for the labor market and their professional development.
Likewise, it is recommended that future research, once the instruments have been validated on a larger scale, incorporate confirmatory factor analysis (CFA) or complement it with structural equation models or multivariate analysis, where some external variables are considered, for example: digital experience, access to technologies, motivation towards digital change processes, in order to evaluate and control possible confounding effects.
On the other hand, it is suggested that future research consider optimizing the number of items per dimension, based on the results of factor analysis and reliability analysis, in order to reduce possible redundancies and generate more efficient versions of the instrument without compromising its validity.
Data availability statement
The datasets presented in this study can be found in online repositories. The names of the repository/repositories and accession number(s) can be found below: https://zenodo.org/records/14977641.
Ethics statement
The studies involving humans were approved by Ethics Committee of the Pedro Ruiz Gallo National University. The studies were conducted in accordance with the local legislation and institutional requirements. The participants provided their written informed consent to participate in this study.
Author contributions
CV-S: Methodology, Writing – review & editing, Conceptualization, Investigation, Writing – original draft, Formal analysis, Data curation. OS: Investigation, Conceptualization, Formal analysis, Writing – review & editing, Methodology, Writing – original draft, Data curation. LG: Writing – review & editing, Conceptualization, Investigation, Methodology, Formal analysis, Writing – original draft, Data curation. JB-J: Investigation, Conceptualization, Writing – review & editing, Data curation, Methodology. RA: Methodology, Writing – review & editing, Investigation, Data curation, Conceptualization. NG: Methodology, Data curation, Investigation, Conceptualization, Writing – review & editing. JA: Investigation, Data curation, Writing – review & editing, Conceptualization, Methodology. GM-N: Conceptualization, Writing – review & editing, Supervision, Methodology. AM: Writing – review & editing, Supervision, Methodology, Conceptualization.
Funding
The author(s) declare that no financial support was received for the research and/or publication of this article.
Conflict of interest
The authors declare that the research was conducted in the absence of any commercial or financial relationships that could be construed as a potential conflict of interest.
Generative AI statement
The authors declare that no Gen AI was used in the creation of this manuscript.
Any alternative text (alt text) provided alongside figures in this article has been generated by Frontiers with the support of artificial intelligence and reasonable efforts have been made to ensure accuracy, including review by the authors wherever possible. If you identify any issues, please contact us.
Publisher’s note
All claims expressed in this article are solely those of the authors and do not necessarily represent those of their affiliated organizations, or those of the publisher, the editors and the reviewers. Any product that may be evaluated in this article, or claim that may be made by its manufacturer, is not guaranteed or endorsed by the publisher.
Supplementary material
The Supplementary material for this article can be found online at:
https://www.frontiersin.org/articles/10.3389/feduc.2025.1691178/full#supplementary-material
References
Abou Hashish, E. A., and Alnajjar, H. (2024). Digital proficiency: assessing knowledge, attitudes, and skills in digital transformation, health literacy, and artificial intelligence among university nursing students. BMC Med. Educ. 24:482. doi: 10.1186/s12909-024-05482-3
Aristovnik, A., Ravšelj, D., and Murko, E. (2024). Decoding the digital landscape: an empirically validated model for assessing digitalisation across public administration levels. Adm. Sci. 14:41. doi: 10.3390/admsci14030041
Avrami, A., Brahja, A., and Enesi, M. (2024). Tendencies and elements of digitalization in Albanian universities. J. Educ. Soc. Res. 14, 363–371. doi: 10.36941/jesr-2024-0079
Boateng, G. O., Neilands, T. B., Frongillo, E. A., Melgar-Quiñonez, H. R., and Young, S. L. (2018). Best practices for developing and validating scales for health, social, and behavioral research: a primer. Front. Public Health 6:149. doi: 10.3389/fpubh.2018.00149
Bravo-Jaico, J., Alarcón, R., Valdivia, C., Germán, N., Aquino, J., Serquén, O., et al. (2025). Model for assessing the maturity level of digital transformation in higher education institutions: a theoretical-methodological approach. Front. Educ. 10:1581648. doi: 10.3389/feduc.2025.1581648
Bujang, M. A., Omar, E. D., Foo, D. H. P., and Hon, Y. K. (2024). Sample size determination for conducting a pilot study to assess reliability of a questionnaire. Restorat. Dentist. Endodont. 49:49. doi: 10.5395/rde.2024.49.e3
Bulina, A., and Solopova, N. (2023). Maturity model for assessing digitalization process of construction industry companies. E Manag. 6, 4–13. doi: 10.26425/2658-3445-2023-6-2-4-13
Campos Fialho, B., Codinhoto, R., and Minto Fabricio, M. (2024). Statistical critical reactive maintenance characterisation for digital twin implementation in universities. Facilities 42, 245–273. doi: 10.1108/F-03-2023-0029
Carpenter, S. (2018). Ten steps in scale development and reporting: a guide for researchers. Commun. Methods Meas. 12, 25–44. doi: 10.1080/19312458.2017.1396583
DeVellis, R. F. (2016). Scale development: Theory and applications. Los Angeles, California: SAGE Publications.
El Peruano (2021) Ley de Institutos y Escuelas de Educación Superior y de la Carrera Pública de sus Docentes N° 31224 Available online at: https://busquedas.elperuano.pe/dispositivo/NL/1964885-1 (Accessed August 20, 2025).
Fadlelmula, F. K., and Qadhi, S. M. (2024). A systematic review of research on artificial intelligence in higher education: practice, gaps, and future directions in the GCC. J. Univ. Teach. Learn. Pract. 21:82. doi: 10.53761/pswgbw82
Fernández, A., Gómez, B., Binjaku, K., and Meçe, E. K. (2023). Digital transformation initiatives in higher education institutions: a multivocal literature review. Educ. Inf. Technol. 28, 12351–12382. doi: 10.1007/s10639-022-11544-0
Ferrando, P. J., and Seva, U. L. (2000). Unrestricted versus restricted factor analysis of multidimensional test items: some aspects of the problem and some suggestions. Psicology 21, 301–323.
Gallastegui, L. M. G., and Forradellas, R. R. (2024). Optimization of the educational experience in higher education using predictive artificial intelligence models. Rev. Gestão Soc. Ambient. 18:e07111. doi: 10.24857/rgsa.v18n5-104
Garcez, A., Silva, R., and Franco, M. (2022). Digital transformation shaping structural pillars for academic entrepreneurship: a framework proposal and research agenda. Educ. Inf. Technol. 27, 1159–1182. doi: 10.1007/s10639-021-10638-5
Gokalp, E., and Martinez, V. (2021). Digital transformation maturity assessment: development of the digital transformation capability maturity model. Int. J. Prod. Res. 60, 6282–6302. doi: 10.1080/00207543.2021.1991020
Gollhardt, T., Halsbenning, S., Hermann, A., Karsakova, A., and Becker, J. (2020). Development of a digital transformation maturity model for IT companies. 2020 IEEE 22nd conference on business informatics (CBI).
Hambleton, R. K., Merenda, P. F., and Spielberger, C. D. (2004). Adapting educational and psychological tests for cross-cultural assessment. New York: Psychology Press.
Han, X., Zhang, M., Hu, Y., and Huang, Y.-F. (2022). Study on the digital transformation capability of cost consultation enterprises based on maturity model. Sustainability 14:10038. doi: 10.3390/su141610038
Haryanti, T., Rakhmawati, N. A., and Subriadi, A. (2023). The extended digital maturity model. Big Data Cogn. Comput. 7:17. doi: 10.3390/bdcc7010017
Husseiny, F. A. (2023). “Online learning in the age of digital transformation” in Handbook of research on establishing digital competencies in the pursuit of online learning. IGI Global Scientific Publishing. (Hershey, PA: Scopus), 35–49.
Kowal, D., Radzik, M., and Domaracká, L. (2024). Assessment of the level of digitalization of polish enterprises in the context of the fourth industrial revolution. Sustainability 16:718. doi: 10.3390/su16135718
Ladu, L., Koch, C., Asna Ashari, P., Blind, K., and Castka, P. (2024). Technology adoption and digital maturity in the conformity assessment industry: empirical evidence from an international study. Technol. Soc. 77:102564. doi: 10.1016/j.techsoc.2024.102564
Langseth, I., Jacobsen, D. Y., and Haugsbakken, H. (2023). The role of support units in digital transformation: how institutional entrepreneurs build capacity for online learning in higher education. Technol. Knowl. Learn. 28, 1745–1782. doi: 10.1007/s10758-022-09620-y
Lloret-Segura, S., Ferreres-Traver, A., Hernández-Baeza, A., and Tomás-Marco, I. (2014). El análisis factorial exploratorio de los ítems: Una guía práctica, revisada y actualizada. Ann. Psychol. 30, 1151–1169. doi: 10.6018/analesps.30.3.199361
Maqbool, M. A., Asif, M., Imran, M., Bibi, S., and Almusharraf, N. (2024). Emerging e-learning trends: a study of faculty perceptions and impact of collaborative techniques using fuzzy interface system. Soc. Sci. Humanit. Open 10:101035. doi: 10.1016/j.ssaho.2024.101035
Mijač, T., Jadrić, M., and Ćukušić, M. (2024). Measuring the success of information systems in higher education – a systematic review. Educ. Inf. Technol. 29, 18323–18360. doi: 10.1007/s10639-024-12564-8
MINEDU (2014). Ley Universitaria N° 30220 Available online at: https://www.minedu.gob.pe/reforma-universitaria/pdf/ley_universitaria_04_02_2022.pdf (Accessed September 12, 2025).
OECD. (2021). OECD Digital Education Outlook 2021. Available online at: https://www.oecd.org/en/publications/oecd-digital-education-outlook-2021_589b283f-en.html (Accessed October 8, 2025).
Paucar, P. Á. B. (2023). La transformación digital en la educación superior, desafíos, oportunidades y tendencias en un contexto post-pandemia. Innov. Int. J. 1, 1–12.
PCM (2021) Plan Nacional de Transformación Digital Available online at: https://www.gob.pe/es/institucion/pcm/normas-legales/1705101-029-2021-pcm (Accessed September 12, 2025).
Ramada-Rodilla, J. M., Serra-Pujadas, C., and Delclós-Clanchet, G. L. (2013). Adaptación cultural y validación de cuestionarios de salud: Revisión y recomendaciones metodológicas. Salud Publica Mex. 55, 57–66. doi: 10.1590/S0036-36342013000100009
Restrepo-Espinel, G., Torres-Moreno, M., and Aponte-Melo, J. (2024). Business-IT alignment maturity diagnosis of a health organization using Luftman’s SAM model. Ing. e Investig. 44:231. doi: 10.15446/ing.investig.101231
Rismansyah, A. M., Badia, P., and Yuliani, Y. (2024). Role of self-efficacy, knowledge sharing, mediated adaptability and external environment change as moderators of readiness for change. Humanit. Soc. Sci. Lett. 12, 189–203. doi: 10.18488/73.v12i2.3662
Romano, S. P., Sperlì, G., and Vignali, A. (2024). An NLP-based approach to assessing a company’s maturity level in the digital era. Expert Syst. Appl. 252:124292. doi: 10.1016/j.eswa.2024.124292
Rosario, A. C. L., Yaacov, B. B., Segura, C. F., Ortiz, E. A., Heredero, E., Botero, J., et al. (2021). Transformación digital en la educación superior América Latina y el Caribe. Washington, DC: IDB Publications.
Siedler, C., Dupont, S., Zavareh, M. T., Zeihsel, F., Ehemann, T., Sinnwell, C., et al. (2021). Maturity model for determining digitalization levels within different product lifecycle phases. Prod. Eng. 15, 431–450. doi: 10.1007/s11740-021-01044-4
Song, R., Pang, F., Jiang, H., and Zhu, H. (2024). A machine learning based method for constructing group profiles of university students. Heliyon 10:e29181. doi: 10.1016/j.heliyon.2024.e29181
Soroka, D., Gorkal’cev, V., and Karlova, T. (2023). Assessing the digital maturity of an enterprise as an important factor in the digital transformation. Automat. Model. Design Manag. doi: 10.30987/2658-6436-2023-3-80-88
Stampfl, R., Geyer, B., Deissl-O‘meara, M., and Ivkic, I. (2024). Revolutionising role-playing games with ChatGPT. Adv. Artif. Intellig. Machine Learn. 4, 2244–2257. doi: 10.54364/aaiml.2024.42129
Stare, J., Klun, M., and Dečman, M. (2023). A case study on the development of digital competences of teachers at the university of Ljubljana. NISPAcee J. Public Adm. Policy 16, 138–166. doi: 10.2478/nispa-2023-0006
Sydorenko, V. V., Akhnovska, I. O., Smirnov, S. V., Verbovskyi, I. A., and Melnychuk, O. V. (2024). Improvement of higher education: how to bridge the digital divide during the transformation? J. Educ. Learn. 18, 1001–1014. doi: 10.11591/edulearn.v18i3.21078
Tangkish, N., Tumashbay, T., Shaldarbekova, A., Rakhimshikova, M., Aripzhan, G., and Yerbota, A. (2024). Digital mind and human consciousness: integration of digital technology in shaping learning experiences. Perspekt. Nauki Obraz. 69, 58–75. doi: 10.32744/pse.2024.3.4
Tsimpanis, K., Avouris, N., Chounta, I. A., Daskalaki, S., Dimitriadis, Y., Gari, C. M., et al. (2023). Implementing a data-driven framework for measuring digital readiness across European universities. Proceedings of European University Information Systems Congress 2023, 95, 129–139. Scopus.
UNESCO (2024) Transforming the digital landscape of higher education in Latin America and the Caribbean—UNESCO Digital Library Available online at: https://unesdoc.unesco.org/ark:/48223/pf0000388361 (Accessed October 8, 2025).
van der Eijk, C., and Rose, J. (2015). Risky business: factor analysis of survey data – assessing the probability of incorrect dimensionalisation. PLoS One 10:e0118900. doi: 10.1371/journal.pone.0118900
Viloria-Nunez, C., Vazquez, F. J., and Fernandez-Marquez, C. M. (2022). A review of the digital transformation maturity models for SMEs in search of a self-assessment. 2022 IEEE ANDESCON, 1–6.
Yu, R., Yao, T., and Bai, F. (2024). Educational big data analytics for futuristic smart learning using deep learning techniques. Scalable Comput. 25, 2728–2735. doi: 10.12694/scpe.v25i4.2988
Keywords: construct and validate instrument, maturity level, digital transformation, exploratory factor analysis, higher education institutions
Citation: Valdivia-Salazar C, Serquén O, Guevara L, Bravo-Jaico J, Alarcón R, Germán N, Aquino J, Maquen-Niño GLE and Moreno Heredia A (2025) Development and validation of an instrument to assess the maturity of digital transformation in higher education institutions. Front. Educ. 10:1691178. doi: 10.3389/feduc.2025.1691178
Edited by:
Timothy Adeliyi, University of Pretoria, South AfricaReviewed by:
Amando Jr. Singun, University of Technology and Applied Sciences, OmanImam Safi'I, Universitas Kadiri, Indonesia
Tendani Mawela, University of Pretoria, South Africa
Copyright © 2025 Valdivia-Salazar, Serquén, Guevara, Bravo-Jaico, Alarcón, Germán, Aquino, Maquen-Niño and Moreno Heredia. This is an open-access article distributed under the terms of the Creative Commons Attribution License (CC BY). The use, distribution or reproduction in other forums is permitted, provided the original author(s) and the copyright owner(s) are credited and that the original publication in this journal is cited, in accordance with accepted academic practice. No use, distribution or reproduction is permitted which does not comply with these terms.
*Correspondence: Carlos Valdivia-Salazar, Y3ZhbGRpdmlhc0B1bnByZy5lZHUucGU=; Oscar Serquén, YXNlcnF1ZW5AdW5wcmcuZWR1LnBl; Laurita Guevara, bGJndWV2YXJhQHVucHJnLmVkdS5wZQ==