 Chengwei Xu1,2
 Bing Shi3*
- 1College of Teacher Development, Shaanxi Normal University, Xi'an, Shaanxi, China
- 2College of Physical Education, Xi’an Fanyi University, Xi'an, Shaanxi, China
- 3College of Physical Education, Shaanxi Normal University, Xi'an, Shaanxi, China
Introduction: Equitable access to school physical education (PE) resources is central to education goals, yet sub-provincial spatial patterns in China remain underexamined.
Methods: Using 2024 data for 107 districts/counties in Shaanxi, we built a human–material–financial index with entropy weights, mapped distributions (GIS, standard deviational ellipse), tested clustering (Global/Local Moran’s I, LISA), decomposed inequality (Dagum’s Gini), and identified determinants and interactions (GeoDetector).
Results: Resources follow a core–periphery gradient centered on central Shaanxi. Global Moran’s I = 0.105 (p = 0.037) indicates weak but significant clustering; LISA shows extensive Low–Low clusters. Overall inequality is modest (Gini = 0.176) but driven mainly by inter-city gaps (~48%) and cross-city overlap (~43%). Human resources dominate composite scores; key drivers are urbanization, PE funding share, student density, and teacher supply, with strong synergistic interactions.
Discussion: Findings call for teacher-workforce strengthening, rebalancing investment toward facilities and professional development, and spatially targeted multi-lever policies—especially for persistent Low–Low clusters and urban–rural margins.
1 Introduction
Educational equity has become a core goal of education policy worldwide, and China is no exception. International organizations such as UNESCO and the OECD have emphasized that equitable access to educational resources is crucial for social fairness and human capital development (UNESCO, 2015; OECD, 2012). In China, the pursuit of educational equity is enshrined in national strategy. For example, a 2023 central policy document calls for building a high-quality, balanced basic public education service system to gradually narrow regional gaps and promote fairness (General Office of the CPC Central Committee and General Office of the State Council, 2023). The notion of balanced development in basic education underscores the importance of distributing resources rationally to achieve equity — this is both a sensible policy aim and a key guiding principle (Zhai, 2006; Chen, 2007).
Among educational resources, those dedicated to school physical education (PE) are particularly important. School PE resources — encompassing teachers, facilities, funding, and equipment for school sports — provide fundamental support for PE classes and student physical activities, and are vital for promoting students’ health and development (Bailey, 2006; Eime et al., 2013). Allocating school PE resources in a rational manner is therefore critical for improving educational quality and achieving equity in education. In recent years, studies have reported disparities in educational resources in China amid uneven regional development and a decentralized education system (Zhao et al., 2018; Wang et al., 2021). However, relatively few studies have specifically focused on the spatial distribution of school PE resources within a province (Zhang and Meng, 2011; Cheng et al., 2019). School PE resources may be influenced by geographic and policy factors in unique ways, and spatial analysis can reveal inequality patterns that non-spatial assessments might overlook (Fotheringham and Wong, 1991; Xiang et al., 2020).
To address this gap, this study uses Shaanxi Province as a case to assess the current status of school PE resource allocation and to explore ways to improve its balance. Shaanxi is characterized by distinct internal disparities: the central plain is more developed, whereas the northern and southern regions are relatively less developed. These contrasts provide a revealing context for examining spatial inequality in educational resources (Zhao et al., 2018; Wang et al., 2021). Drawing on concepts from sports geography and educational equity research (Zhai, 2006; Shi, 2007), we constructed a multidimensional index system for evaluating school PE resources and employed various quantitative spatial analysis methods. Specifically, we used entropy weighting and GIS techniques to calculate a composite resource index for each district and county, and applied spatial statistical tools to examine distribution patterns. We further assessed inequality in resource allocation using Dagum’s Gini coefficient decomposition, and identified key influencing factors through a Geographical Detector model. The aim is to provide evidence-based insights to inform provincial and municipal decision-makers, thereby improving the targeting and effectiveness of policies to optimize school PE resource allocation and promote balanced development. Notably, unlike prior studies, our approach integrates all of these spatial analytical techniques within a single framework, offering a more comprehensive perspective on sub-provincial resource disparities.
1.1 Research hypotheses
i. H1 (Spatial gradient): We anticipate that school PE resource allocation follows a core–periphery pattern centered on central Shaanxi, with resource levels dropping off toward the southern and northern ends of the province. If this hypothesis holds, it would mirror broader regional development contrasts.
ii. H2 (Local clustering): We expect to find significant local clusters even if overall spatial autocorrelation (Global Moran’s I) is modest. In particular, well-resourced districts (High–High clusters) should cluster around urban core areas, and under-resourced districts (Low–Low clusters) should cluster in peripheral rural or mountainous areas, consistent with local spatial autocorrelation (LISA) theory.
iii. H3 (Dominant inequality sources): We hypothesize that disparities between cities and across regions (including overlapping differences between them) will account for a larger share of overall inequality (based on Dagum’s Gini decomposition) than disparities within individual cities or within regions.
iv. (Determinants and interactions): We expect that factors such as urbanization, teacher supply (e.g., the number of PE teachers per student, percentage of full-time PE teachers), and resource demand (student population density) will be the primary determinants of resource distribution (i.e., these will have the highest q-values in the Geographical Detector analysis). Furthermore, we anticipate that interactions between two factors will exhibit nonlinear enhancement effects — meaning two factors combined will have a greater influence than the sum of their individual influences (formally, q(A ⊗ B) > q(A) + q(B)).
2 Literature review
2.1 Education resource inequality
Uneven allocation of educational resources has long been a concern in China and internationally. In China, researchers have created multidimensional indices to measure regional education inequality. For example, Xiang et al. (2020) developed an “Index of Regional Education Advantage” and found that educational outcomes do not strictly follow the traditional east–central–west divide — notably, the Northeast outperforms some southwestern regions, contrary to expectations (Xiang et al., 2020). At the national level, there is evidence that disparities in basic education resources have begun to narrow due to targeted policies. Liu and Chen (2020) report that differences in school resources between regions are decreasing as a result of recent government initiatives (Liu and Chen, 2020). Nevertheless, significant gaps persist within provinces and between urban and rural areas. A county-level analysis in Liaoning Province found persistent differences in compulsory education resources among counties despite overall improvements (Wang et al., 2021). These findings highlight the complexity of spatial inequality, indicating that broad classifications (such as region or urban vs. rural) alone cannot fully explain patterns of resource distribution (Guo and Li, 2024; Hannum and Park, 2007).
Across the world, similar patterns of within-country inequality are observed (Bertoni et al., 2020). In Latin America, despite equity-focused school funding reforms like Chile’s Preferential School Subsidy and Brazil’s FUNDEB that have partially reduced gaps, major disparities remain (Bos and Vegas, 2017). A comparison of five Latin American countries found that Brazil still has one of the widest spending divides between high- and low-income regions, whereas Chile and Ecuador have more progressive funding distributions (favoring poorer areas), each achieved through different mechanisms (Bertoni et al., 2020). Likewise, in Africa, audits and case studies (for example, in South Africa) reveal severe shortfalls in school PE provision in many rural and under-resourced communities: schools often lack qualified PE teachers, adequate facilities, or sufficient equipment to implement the curriculum (Roux, 2020). Similarly, European evidence shows that community deprivation and a lack of local sports facilities are linked to lower youth physical activity and participation in school sports (European Commission EACEA Eurydice, 2013). These global patterns confirm that where a student lives significantly shapes their educational opportunities (Hardman and Marshall, 2009). Such findings motivate our use of a sub-provincial analytical lens and spatial analytical tools to move beyond coarse regional typologies when diagnosing resource inequalities. This cross-context evidence bolsters our approach and hypotheses regarding spatial clustering, inequality decomposition, and interacting determinants.
2.2 Concept of school physical education (PE) resources
Scholars define school physical education resources in various ways (Zhang and Meng, 2011; Hardman and Marshall, 2009). Generally, the term refers to the collection of human, material, and financial inputs that support school sports and students’ physical development. For instance, Zhang and Meng (2011) describe school sports resources as the sum of all resources required to carry out school sports activities and improve students’ physical health — mainly including human resources (teachers and staff), material resources (facilities and equipment), and financial resources (Zhang and Meng, 2011). This tripartite classification is widely used in China. Human resources refer to qualified PE teachers and instructors — the key personnel delivering the curriculum and programs. Material resources include gymnasiums, sports fields, equipment, and other facilities that enable PE classes and extracurricular activities. Financial resources refer to funding from government budgets, private sources, and communities/families, which determine the adequacy and sustainability of PE provision (Bailey, 2006; Sallis, 2012).
These three dimensions serve as a framework for evaluating school PE resource allocation. Researchers have proposed evaluation index systems reflecting these categories. For example, Zhang and Meng (2011) devised an index system to compare urban and rural school sports resources in China, underscoring the need for sufficient teacher supply, facilities, and funding to ensure equal opportunities in physical education (Zhang and Meng, 2011). In addition, Ni (2019) conducted a bibliometric review of sports resource allocation research in China, which showed a growing academic focus on resource equity in school sports (Ni, 2019). International perspectives align with a similar three-pillar structure. For instance, UNESCO’s Quality Physical Education guidelines and the WHO’s Global Action Plan on Physical Activity both emphasize specialist PE teachers, adequate facilities/equipment, and protected curriculum time (and related investment) as prerequisites for equitable PE (UNESCO, 2015; WHO, 2018). Furthermore, global surveys report wide cross-national differences in these inputs. A recent UNESCO global report covering 117 countries shows that while PE is compulsory in most systems, implementation gaps persist—particularly around insufficient funding, too few trained/specialist teachers, and inadequate facilities—with many countries failing to meet minimum time allocations for PE (UNESCO, 2024). These global observations reinforce the validity of our human–material–financial index framework and allow us to position our findings against international norms.
2.3 Existing spatial and resource allocation methods
Several empirical studies have examined school sports resource allocation in China from different angles using a variety of approaches. For example, Zhu (2025) employed a qualitative grounded theory approach and observed persistent regional imbalances in school sports resources, calling for systematic interventions to remedy inequities (Zhu, 2025). Meanwhile, Wang et al. (2021) performed a spatio-temporal analysis of compulsory education resources in Liaoning and identified economic development and demographic factors as significant influences on allocation patterns (Wang et al., 2021). These studies imply that resource disparities stem from a mix of socio-economic and policy factors, and that targeted actions are required to foster fairness.
Research on school PE resources is limited, especially at the county level. Most existing studies rely on broad national statistics or single case studies and often lack spatial analysis, meaning localized hotspots of inequality might be overlooked. International evidence underscores this point. For instance, Bevans et al. (2010) found that schools with more PE teachers and better facilities had students who were more physically active (Bevans et al., 2010), illustrating that equitable PE resource distribution is not only a matter of fairness but also has tangible effects on student outcomes.
Scholars have employed spatial analysis tools (GIS mapping, spatial autocorrelation) and inequality metrics (e.g., Gini coefficients) to examine resource distributions. Still, few studies integrate these techniques or concentrate on school PE resources, and the interactive effects among determinants have yet to be explored. In summary, despite policy efforts in China to equalize educational resources, school PE allocation still varies widely across regions and school categories. This signals the need for a comprehensive spatial analysis using multiple methods to better understand and address these inequities (Han and Xu, 2023; Yang and Wu, 2022).
2.4 Research gaps and study contributions
Several gaps persist in the literature. First, analyses are typically conducted at broad administrative scales (province or region), overlooking finer-grained county-level patterns in school PE resources. Second, many studies consider only single indicators (e.g., student–teacher ratios or per-student funding) instead of integrating multiple resource dimensions. Third, factors influencing resource allocation are often examined individually, without testing for interactions. In sum, prior research lacks a framework that simultaneously addresses where, why, and how resource inequalities occur.
Our study tackles these gaps through a multi-method approach. We construct a composite index of school PE resources integrating human, material, and financial dimensions. We then employ GIS mapping and spatial autocorrelation techniques and use Dagum’s Gini decomposition to quantify inequality between and within regions. Additionally, we apply GeoDetector to evaluate various socio-economic and demographic variables, revealing each factor’s influence and any interaction effects. This integrated approach fills the identified gaps, providing deeper insights and evidence to inform policy. The novelty of our study lies in its county-level focus and the breadth of methods employed, thereby advancing research on equity in educational resources.
3 Methods
3.1 Data and study area
3.1.1 Study area
Shaanxi Province, in northwestern China, comprises 10 prefecture-level cities overseeing 107 districts and counties. These jurisdictions cover the full range of basic education institutions: primary schools, junior high schools, academic senior high schools, integrated 9-year and 12-year schools, complete secondary schools, and secondary vocational schools. Geographically, Shaanxi is commonly divided into three sub-regions—central Shaanxi, southern Shaanxi, and northern Shaanxi—which have markedly different levels of economic development and population distribution. Our study includes all 107 districts/counties, ensuring comprehensive coverage of the province’s basic education sector. These districts and counties serve as the spatial units of analysis, and all data used are from the year 2024.
3.1.2 Data sources
Our primary data on school PE resources were obtained from official statistics and reports. Key sources include the National Bureau of Statistics of China (2024), the Shaanxi Provincial Bureau of Statistics (2024), and the latest statistical yearbooks (2024) of each prefecture-level city in Shaanxi. These publications provided data on school enrollments, numbers of PE teachers, school funding, facilities, and other education indicators. Additional specialized data on school sports (physical education) were gathered from the Ministry of Education’s annual reports on school PE and related government documents. All data were cross-checked for consistency and completeness. By using multiple authoritative sources, we ensured that the dataset comprehensively reflects the allocation of human, material, and financial resources for school PE across Shaanxi’s districts and counties.
3.2 Methodology
To examine the spatial allocation of school PE resources and identify its determinants, we employed several quantitative spatial analysis techniques (Figure 1 illustrates the overall analytical framework). The main methods are:
i. Entropy weighting and composite index: We developed a multi-indicator evaluation system for school PE resources. Using the entropy weighting method (Zhu et al., 2020; Mukhametzyanov, 2021), we assigned an objective weight to each indicator based on its information entropy (variability). We then aggregated the weighted indicators to compute a single composite PE resource index for each district/county, facilitating straightforward comparisons across all units.
ii. Natural breaks classification (Jenks): For visualization, we categorized each district’s composite index into five levels (High, Upper-Middle, Middle, Lower-Middle, Low) using the Jenks natural breaks method (Jenks, 1967). This classification maximizes differences between classes while minimizing within-class variance (Slocum et al., 2009). We chose five classes following standard cartographic practice for skewed data distributions (Brewer and Pickle, 2002) (Note: this classification was used only for mapping and descriptive purposes; all statistical analyses used the continuous index values.)
iii. Standard deviation ellipse: We applied the standard deviational ellipse technique to summarize the geographic central tendency and spread of the resource index (Lefever, 1926). This method computes the mean center of all units and then defines an ellipse representing the distribution of values. The ellipse’s center represents the “center of gravity” of PE resources, its orientation shows the primary direction of resource spread, and its major and minor axis lengths indicate how far resources extend along those axes. This provides a concise description of how spatially concentrated or dispersed the resources are (Yuill, 1971; Wong and Lee, 2005).
iv. Spatial autocorrelation analysis: We measured spatial clustering in resource allocation using Moran’s I statistics. First, we calculated the Global Moran’s I to test for overall spatial autocorrelation — whether districts with similar resource levels cluster more than would be expected by chance (Moran, 1950). A significantly positive Global Moran’s I indicates clustering of similar values (high–high or low–low clusters), while a negative value indicates a dispersed pattern. We then calculated the Local Moran’s I (LISA) for each district (Cliff and Ord, 1981; Anselin, 1995), which identified significant local clusters or outliers by classifying each district as High–High, Low–Low, Low–High, or High–Low relative to its neighbors (Getis and Ord, 1992). This pinpointed “hot spots” (clusters of high values), “cold spots” (clusters of low values), and spatial outliers (e.g., a high-value district surrounded by low-value neighbors).
v. Dagum’s Gini coefficient decomposition: To quantify disparities in resource levels, we applied Dagum’s decomposition of the Gini coefficient (Dagum, 1997). We conducted this analysis at two levels: (a) among Shaanxi’s three macro-regions (central/Guanzhong, southern, northern) and (b) among the ten prefecture-level cities. For each grouping, we calculated the overall Gini index of the composite resource distribution and then decomposed it into within-group inequality, between-group inequality, and transvariation (overlap) components (Yao and Zhang, 2001; Wan, 2004). This shows whether disparities across different regions/cities or disparities within them contribute more to the total inequality (Zhang et al., 2022; Cheong and Wu, 2014).
vi. Geographical detector analysis: Finally, we employed the Geographical Detector to identify key factors influencing the spatial distribution of PE resources (Wang et al., 2010; Wang et al., 2016). This technique evaluates how much of the spatial variance each factor explains (producing a q-statistic) and also tests whether combining two factors enhances their explanatory power beyond the sum of their individual effects (Wang and Xu, 2017; Liu et al., 2021; Hu and Liu, 2020). Guided by previous research and data availability, we considered factors such as economic development (GDP per capita), urbanization rate, demographic characteristics (student population density and population mobility), school provisioning (number of schools), educational investment (per-student education expenditure), and teacher supply. We computed the q-value for each factor and for selected pairwise combinations to determine the most influential determinants of resource allocation and any notable interaction effects (Wang and Xu, 2017; Wang et al., 2016).
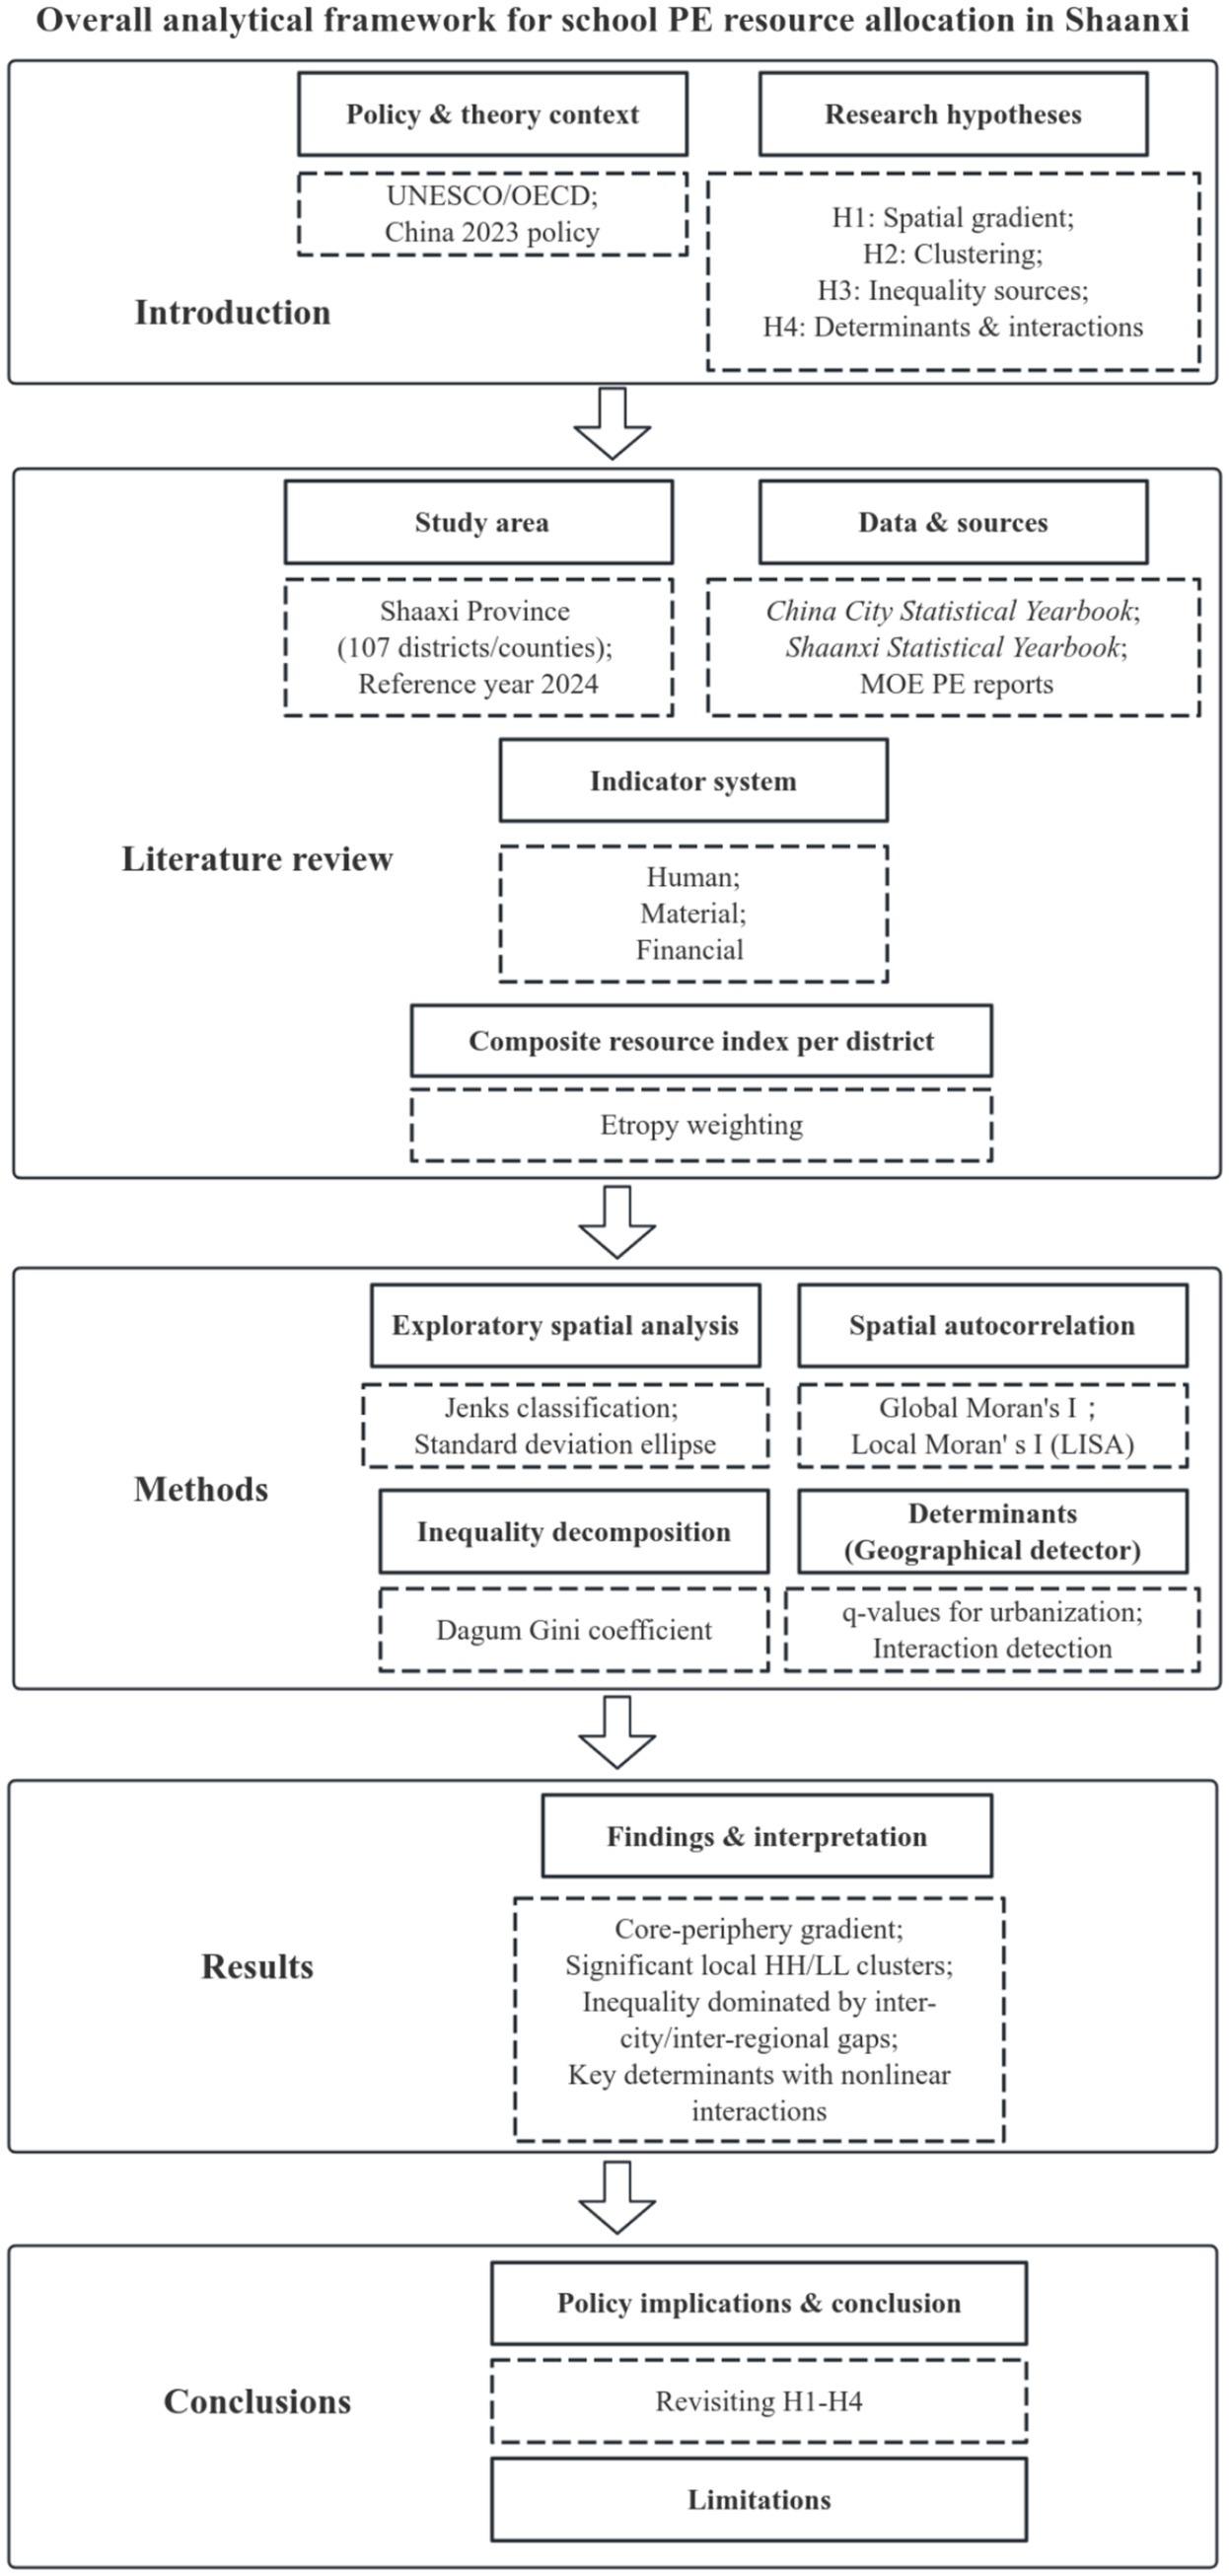
Figure 1. Overall analytical framework for school PE resource allocation in Shaanxi Province.
3.3 Evaluation index system
The evaluation index system for school PE resources was designed with reference to national education policy standards and regulations. Because our study focuses on public basic education schools, we placed emphasis on government-funded inputs within the financial indicators. The index system is organized into three pillars—Human Resources, Material Resources, and Financial Resources—encompassing a total of 11 specific indicators (see Appendix Table 1 for the detailed index structure and weights).
i. Human resources (44.87% of total weight): This pillar includes five indicators related to the PE teaching staff, such as the student–teacher ratio (Lou et al., 2024; Hanushek, 1997), the proportion of full-time PE teachers (Zhang et al., 2016; Huang, 2014), the teacher training participation rate (Wang et al., 2021; Zhao et al., 2024), the new PE teacher hiring rate (Li, 2022; Sun et al., 2023), and the PE teacher vacancy rate (Yao and Feng, 2023; Harrison et al., 2016). Together, these reflect the quantity, quality, and stability of the PE teacher workforce in each region.
ii. Material resources (16.91% of total weight): This pillar covers two indicators assessing physical infrastructure: the sports field area per student and the equipment compliance rate (the percentage of schools meeting standard sports equipment requirements) (Li and Zhou, 2018; General Administration of Sport of China, 2020; Ministry of Education of the People’s Republic of China, 2021; Ministry of Education of the People’s Republic of China, 2017). These measure the adequacy of space and equipment available for PE in each district.
iii. Financial resources (38.22% of total weight): This pillar consists of four funding-related indicators, including the total PE expenditure per student and its sub-components (per-student spending on sports facilities, sports equipment, and sports programs/activities) (Wang et al., 2021; Shaanxi Provincial Department of Education, 2023; Ni, 2019; Zhang and Meng, 2011). These reflect the level of financial investment in school PE for each district.
Using the entropy weighting method, we calculated a composite PE resource index for every district/county. The entropy results show that human resources contributed the largest share of the composite index (approximately 44.87%), underscoring the critical role of PE personnel in resource allocation. Financial resources accounted for about 38.22%, while material resources contributed around 16.91%. Among the individual indicators, the full-time PE teacher ratio had the highest weight (21.03%), highlighting the importance of a stable, professional teaching workforce in elevating a region’s PE resource level. Other highly weighted indicators were the per-student sports equipment expenditure (15.86%) and the per-student sports field area (14.41%), indicating that having sufficient equipment and adequate space per student are also key components of resource allocation (See Appendix Table 1 for the complete list of indicators and their weights.)
3.4 Analysis of the highest-weight indicators
i. Full-time PE teacher ratio (21.03% weight; Human Resources): A higher proportion of full-time PE teachers indicates a more professional and stable PE faculty, strengthening curricular continuity, safety management, and quality assurance. Systems that emphasize hiring specialist PE staff tend to have more coherent instruction and less out-of-field teaching, improving inclusion and learning outcomes (Hardman and Marshall, 2009; UNESCO, 2015). Increasing the full-time teacher ratio also enhances the returns on facilities and equipment by ensuring these resources are used effectively.
ii. Per-student sports equipment expenditure (15.86% weight; Financial Resources): This indicator reflects the adequacy and timeliness of providing equipment. Higher spending per student typically ensures there is sufficient, safe, age-appropriate sports equipment, improving lesson quality, minimizing downtime due to shortages or equipment breakage, and supporting a wider range of programs aligned with standards (Bevans et al., 2010). However, such spending must be balanced across resource categories to avoid a “hardware-heavy but capacity-light” scenario (i.e., ample equipment but insufficient qualified staff or program capacity to use it effectively).
iii. Per-student sports field area (14.41% weight; Material Resources): The available activity space per student is a critical constraint in PE. More space per student improves safety margins, enables concurrent stations and skill-differentiated practice, and increases active time-on-task—especially in large classes. International school health guidelines link adequate physical space to higher participation and lower injury risk (Harrison et al., 2016; WHO, 2018). The next highest indicator was the new PE teacher hiring ratio (13.76%; under Human Resources). Sustained recruitment of PE teachers is vital for program renewal and growth, and its effects are strongest when new hires receive proper mentoring and induction support (Darling-Hammond, 2000).
iv. Other indicators (each of the remaining indicators contributed less than 11% individually, but they are still noteworthy):
Student–teacher ratio (6.47%): A fundamental metric of access and quality. Smaller class sizes allow more personalized feedback, better inclusion of all students, and safer supervision; overly large classes restrict differentiated instruction and reduce each student’s active time (Finn and Achilles, 1999; Xu and Shi, 2025).
Per-student sports program funding (10.71%): This represents resources for extracurricular sports events, clubs, and competitions. Higher funding levels broaden participation (e.g., by supporting girls’ sports and adaptive PE programs), deepen experiential learning, and strengthen school–community engagement (Bailey, 2006; Green, 2008).
Per-student total PE expenditure (6.10%): Reflects overall fiscal capacity for PE. Its impact depends on how funds are allocated and used — linking expenditures to specific school needs can improve cost-effectiveness (Wang and Liu, 2019; Hanushek, 1997).
Per-student facility expenditure (5.55%): Represents investment in building and maintaining safe sports fields and courts. Steady spending in this area reduces hazards and expands the range of activities a school can offer (for example, adding tracks, fields, or courts for different sports) (Earthman, 2002; Xia et al., 2022).
Teacher training participation rate (2.57%): A proxy for ongoing professional development. Regular in-service training enhances teachers’ subject-specific pedagogy and assessment skills; many education systems mandate periodic continuing education for PE teachers (Armour and Makopoulou, 2012; Guskey, 2002).
Equipment compliance rate (2.50%): Indicates whether schools meet basic equipment standards. It ensures minimum adequacy and equity of resources, but by itself it cannot guarantee quality without sufficient staff capacity and space (Zhang and Meng, 2011).
Teacher vacancy rate (1.04%): Teacher vacancy rate (1.04%): A sign of staffing shortages. Persistent PE teacher vacancies lead to larger class sizes and more out-of-field teaching coverage; best practice is to fill vacancies quickly with targeted incentives to attract teachers to hard-to-staff areas (Fisher, 2001; Ingersoll, 2001; Dai and Xu, 2008).
3.5 Software and implementation
We used ArcGIS Pro 2024 for geospatial preprocessing and mapping. Choropleth maps of the composite PE resource index were produced with Jenks natural breaks, and the standard deviational ellipse was generated to summarize the distribution’s center, spread, and orientation.
Spatial autocorrelation analysis was conducted in GeoDa. We constructed a first-order queen-contiguity spatial weights matrix (binary, row-standardized) where districts sharing an edge or a vertex were considered neighbors. Using this weights matrix, we computed Global Moran’s I and created LISA cluster maps to identify High–High, Low–Low, and outlier patterns.
Geographical Detector analyses were implemented in R using the GeoDetector package. Continuous predictors (e.g., urbanization rate, GDP per capita, student density, teacher supply, number of schools, PE funding share) were discretized using Jenks natural breaks into five classes before calculating the q-statistics. This ensured consistency with our GIS classification and yielded stable strata for factor and interaction detection. All steps (data preprocessing, map production, spatial weights construction, and model runs) followed this pipeline to maintain reproducibility across analyses.
4 Results
4.1 Spatial distribution of resource allocation
We calculated a composite school PE resource index for each district/county in Shaanxi and mapped the results. Figure 2 shows that higher resource levels are largely concentrated in central Shaanxi, forming a clear core–periphery pattern. Using the Jenks natural breaks method, the 107 districts/counties were grouped into five tiers based on their composite scores: Low, Lower-Middle, Middle, Upper-Middle, and High (with composite score ranges approximately 0.114 to 0.599; see Figures 3–7 for the spatial distribution of each tier). The distribution of districts across these levels is as follows (with the percentage of all units in parentheses):
i. High level (score ~0.317–0.599; Figure 3): 6 districts (~5.6%). This group includes Yintai and Wangyi (Tongchuan City), Yanta and Weiyang (Xi’an City), Taibai (Baoji City), and Jia County (Yulin City). Yintai District has the highest composite score (0.599). Apart from Jia County in the north, all High-level units are located in central Shaanxi. The strong economy, talent pool, and educational resources in the central region give it a clear edge in school PE provision.
ii. Upper-Middle level (score ~0.222–0.317; Figure 4): 9 districts (~8.4%). The majority of these (7) are in central Shaanxi, with a couple in northern Shaanxi (both in Yulin). Central Shaanxi’s robust educational infrastructure contributes to many districts achieving this tier, though internal imbalances remain (for example, within Xi’an and Xianyang, some districts are well-resourced while others lag behind).
iii. Middle level (score ~0.171–0.222; Figure 5): 36 districts (~33.6%), the largest group, essentially representing the provincial average. About half of these (18) are in central Shaanxi, indicating that despite generally better conditions in the core, many central districts only reach a middle level and disparities persist even within the core region.
iv. Lower-Middle level (score ~0.138–0.171; Figure 6): 35 districts (~32.7%), spread mainly across central and southern Shaanxi. A substantial portion of the province falls into this moderately low resource tier, highlighting the need to lift these areas toward the provincial average.
v. Low level (score ~0.114–0.138; Figure 7): 21 districts (~19.6%), concentrated in southern Shaanxi and parts of the north. These areas suffer severe shortages of PE resources (funding, facilities, and qualified teachers). Without intervention, such deficits may further exacerbate regional imbalances.
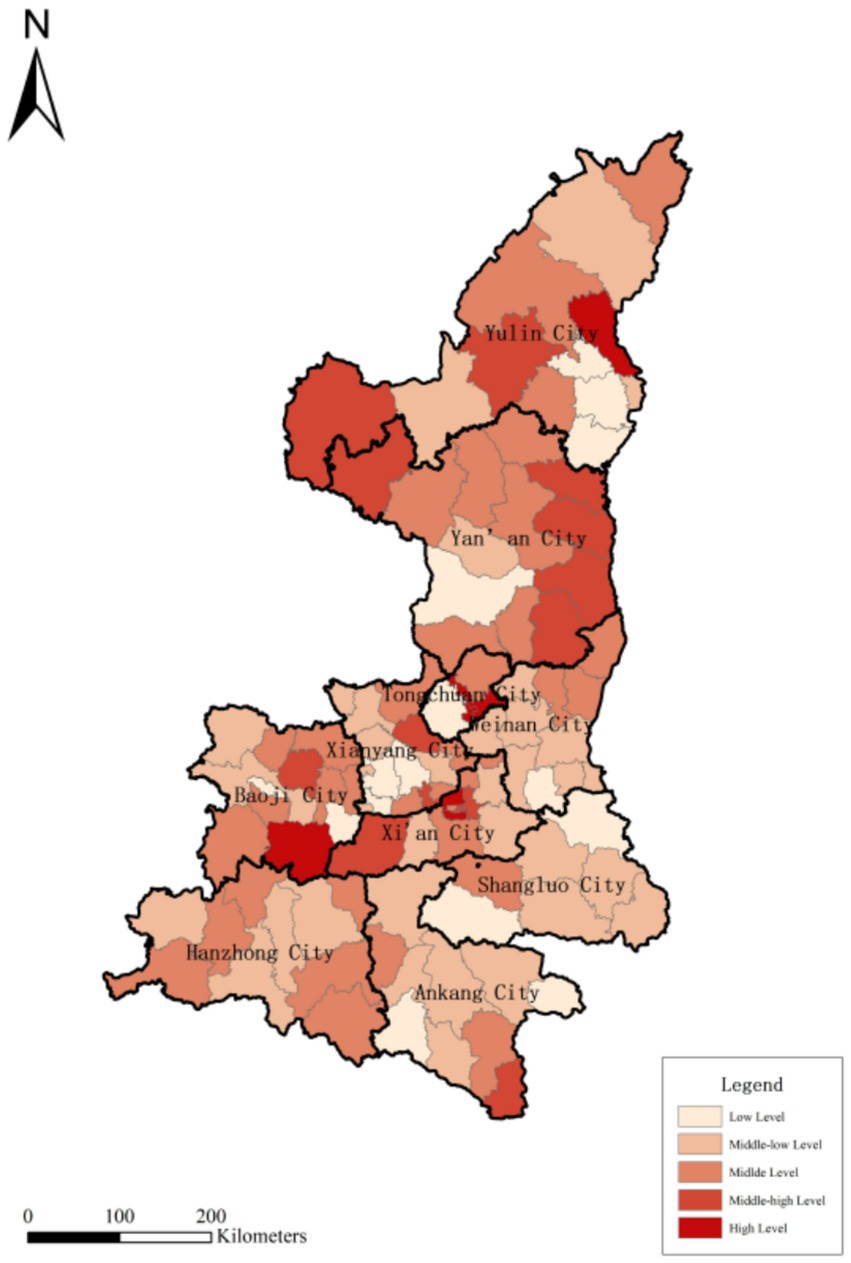
Figure 2. Spatial distribution of school PE resource allocation in Shaanxi Province. The map is based on the standard map with review number GS (2024) 0650 from the Ministry of Natural Resources (applies to Figures 8, 9 as well).
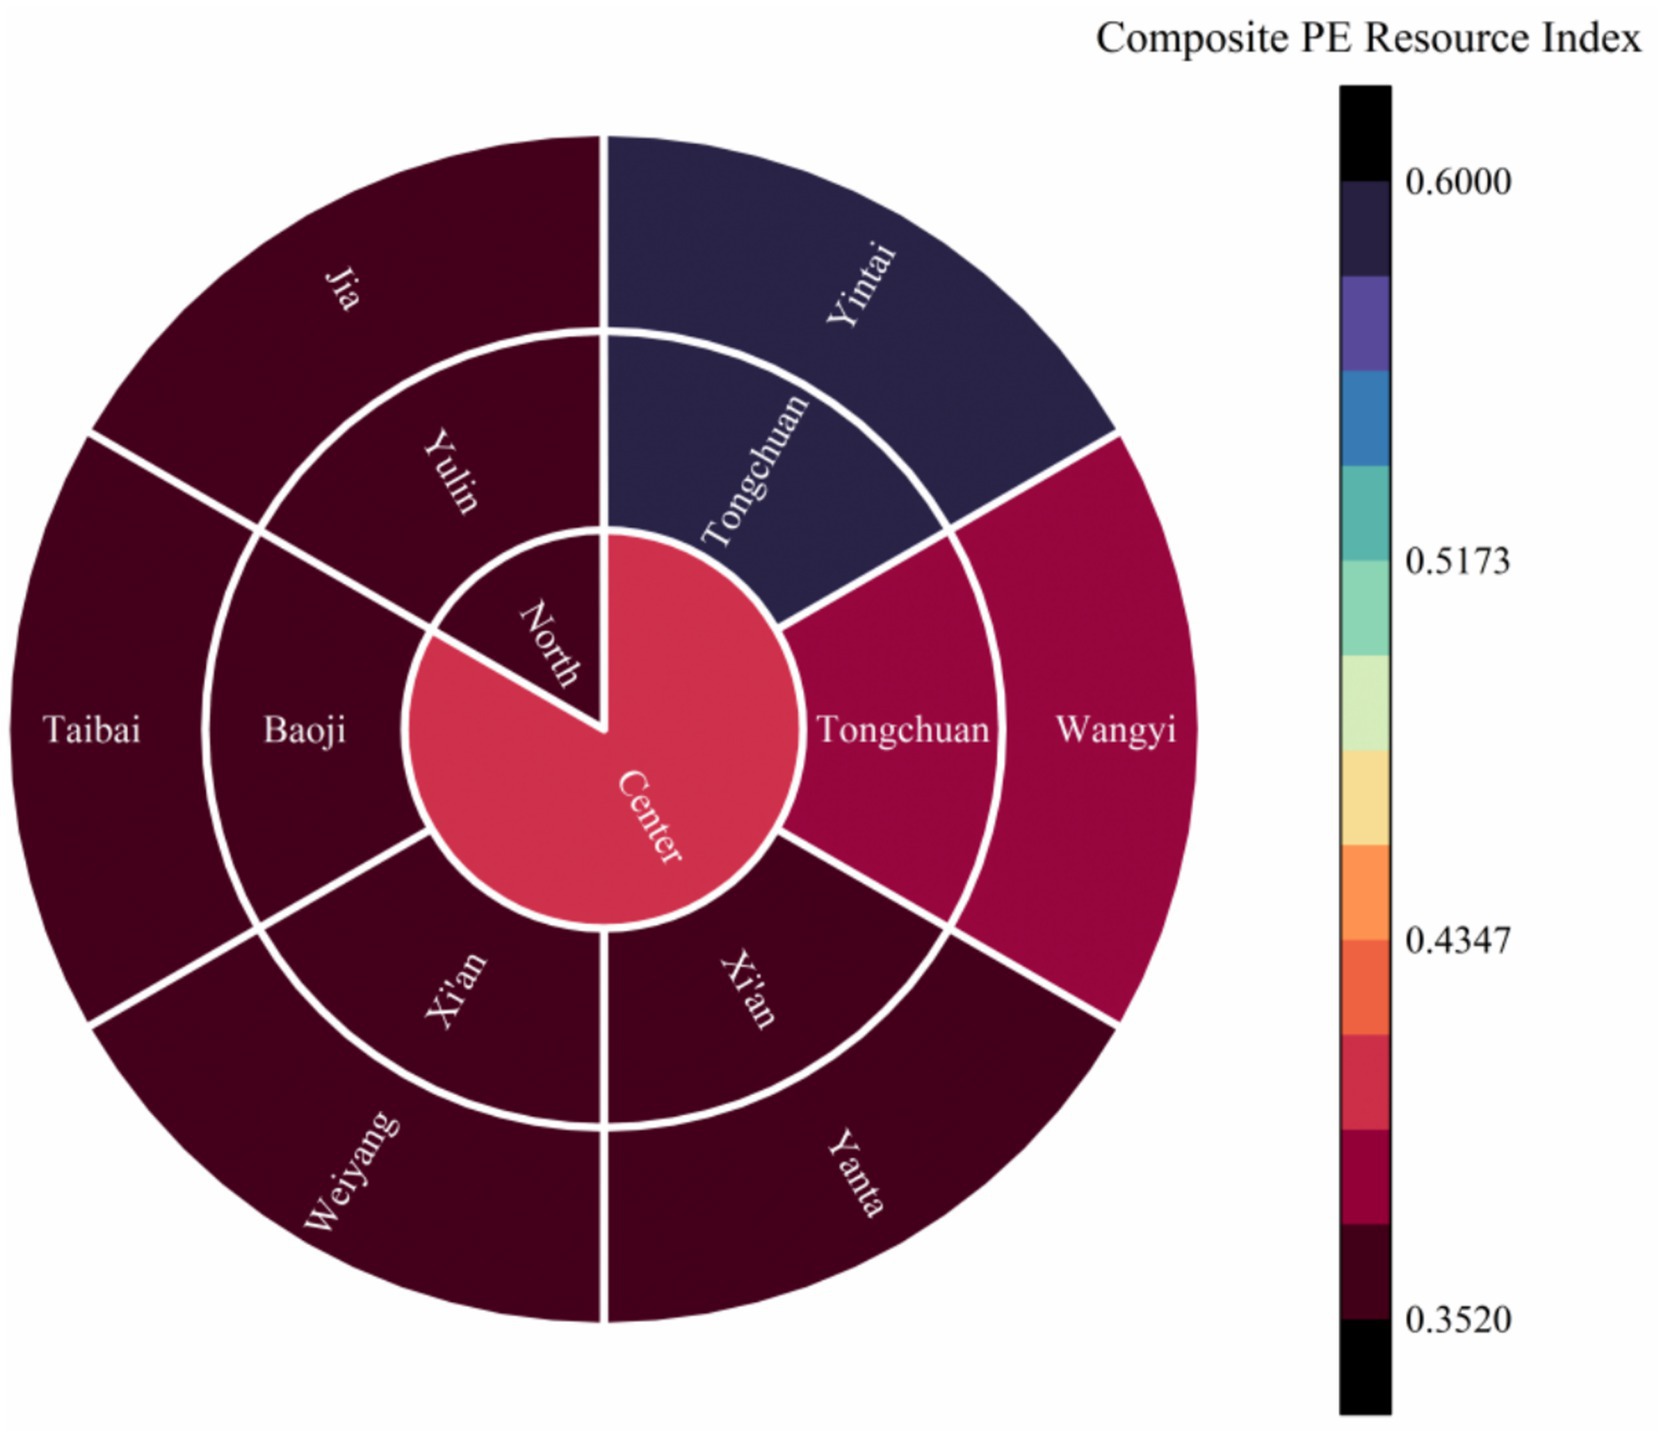
Figure 3. Distribution of high-level districts/counties in Shaanxi (2024). The color scale shows the entropy-weighted composite index (higher = better). Inner ring: macro-regions (Central/Northern/Southern Shaanxi); middle ring: prefecture-level cities; outer ring: districts/counties; classification: Jenks.
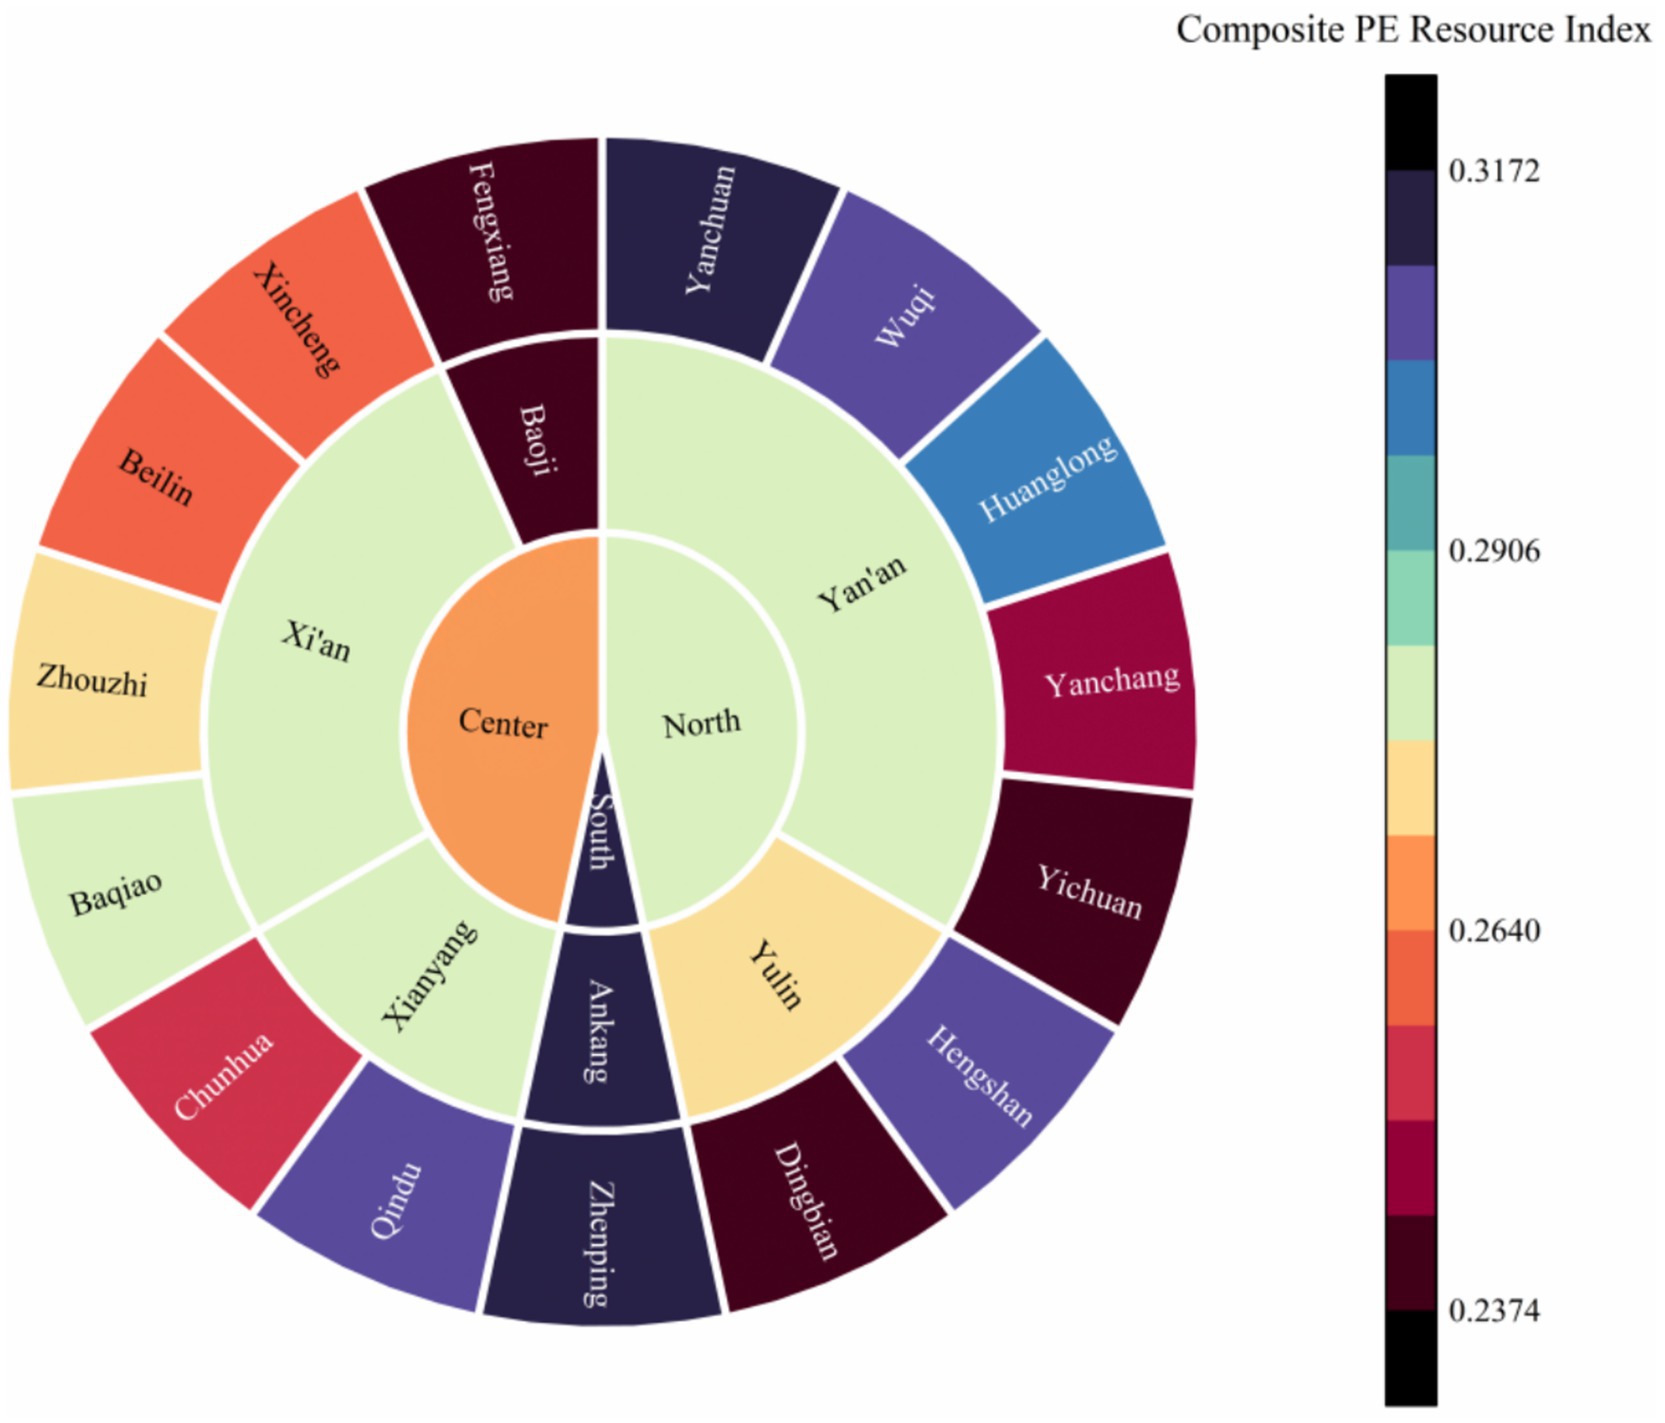
Figure 4. Distribution of upper-middle–level districts/counties in Shaanxi (2024). Class range and methodological details as in Figure 3.
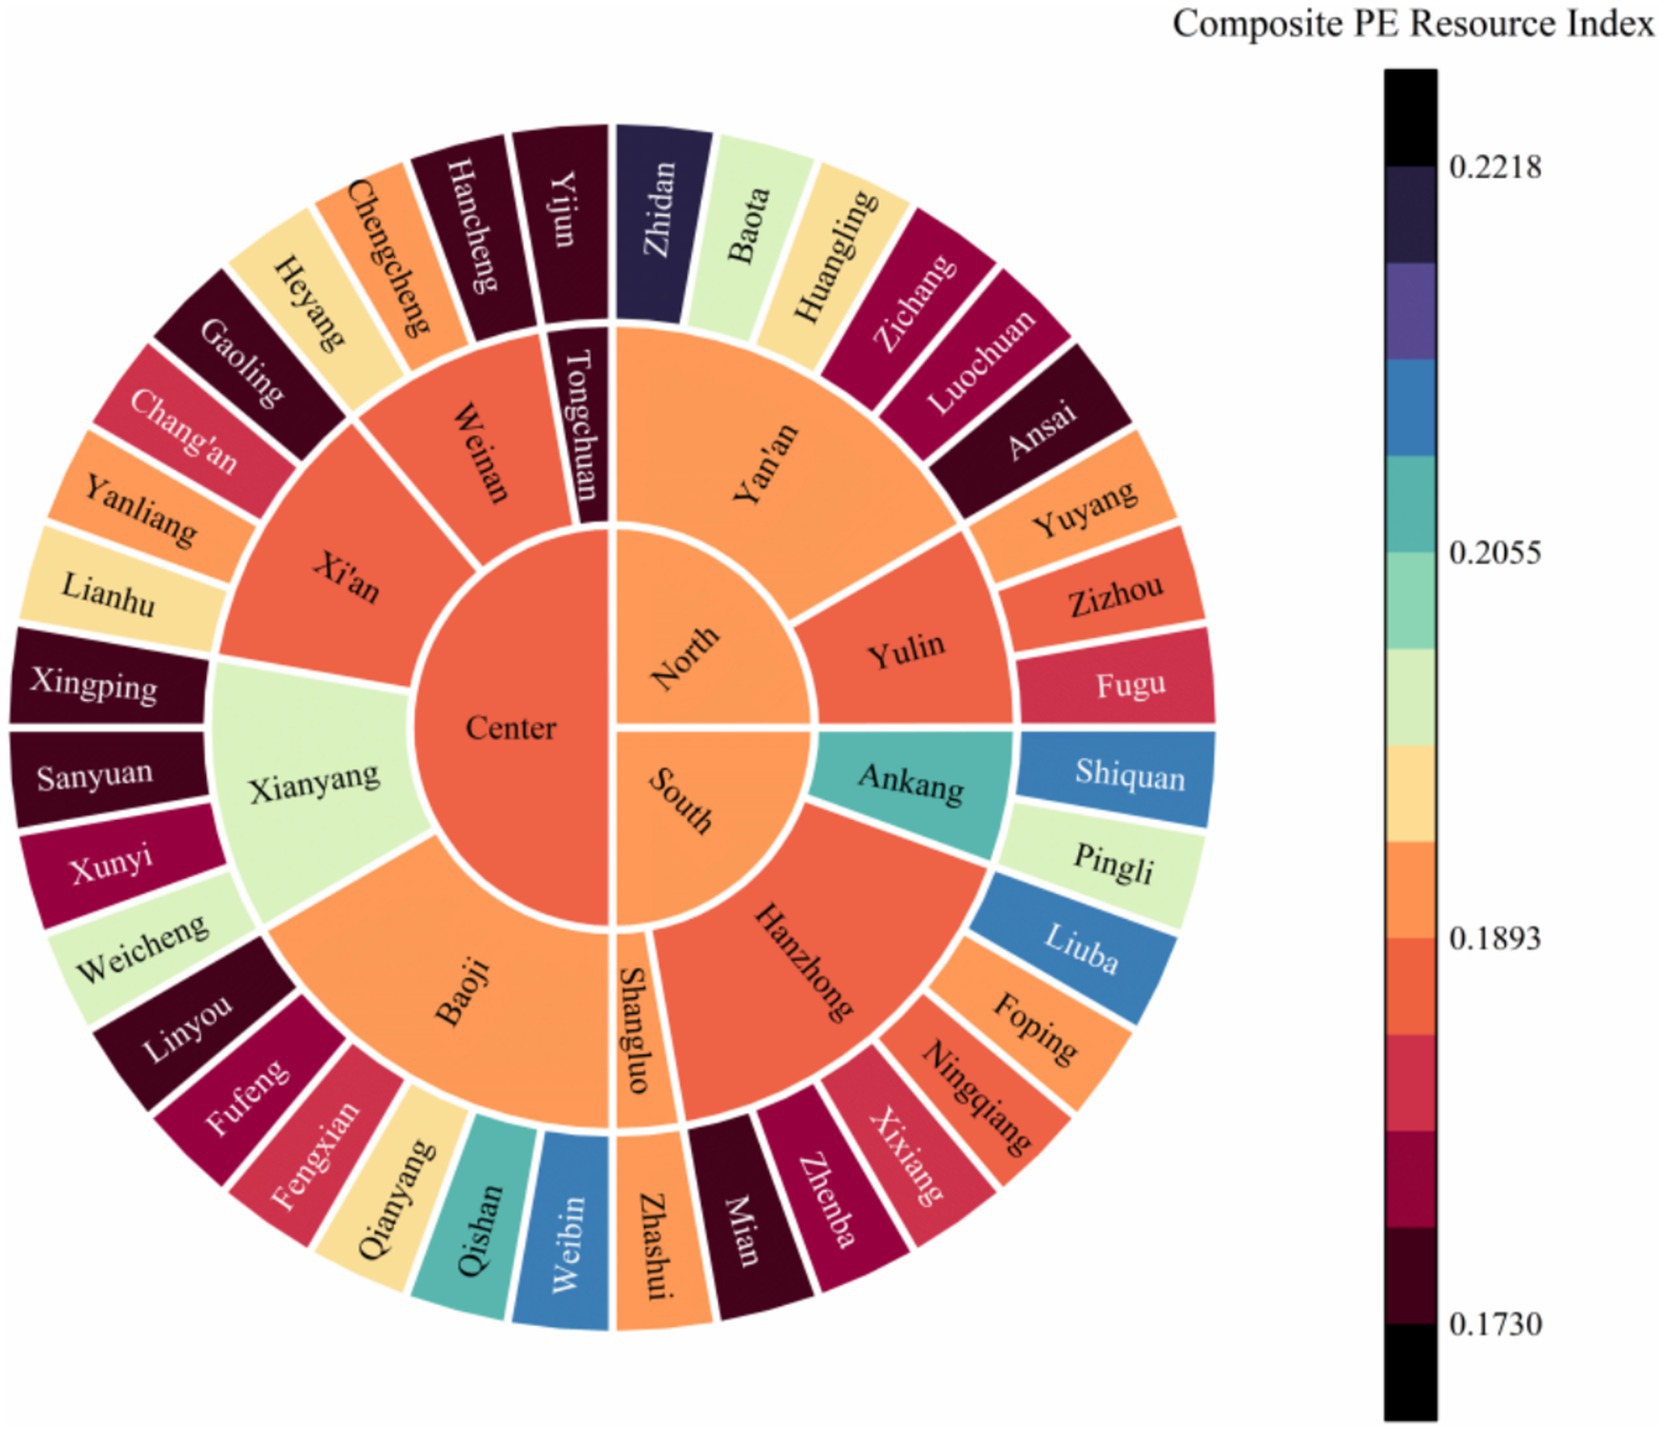
Figure 5. Distribution of middle–level districts/counties in Shaanxi (2024). Class range and methodological details as in Figure 3.
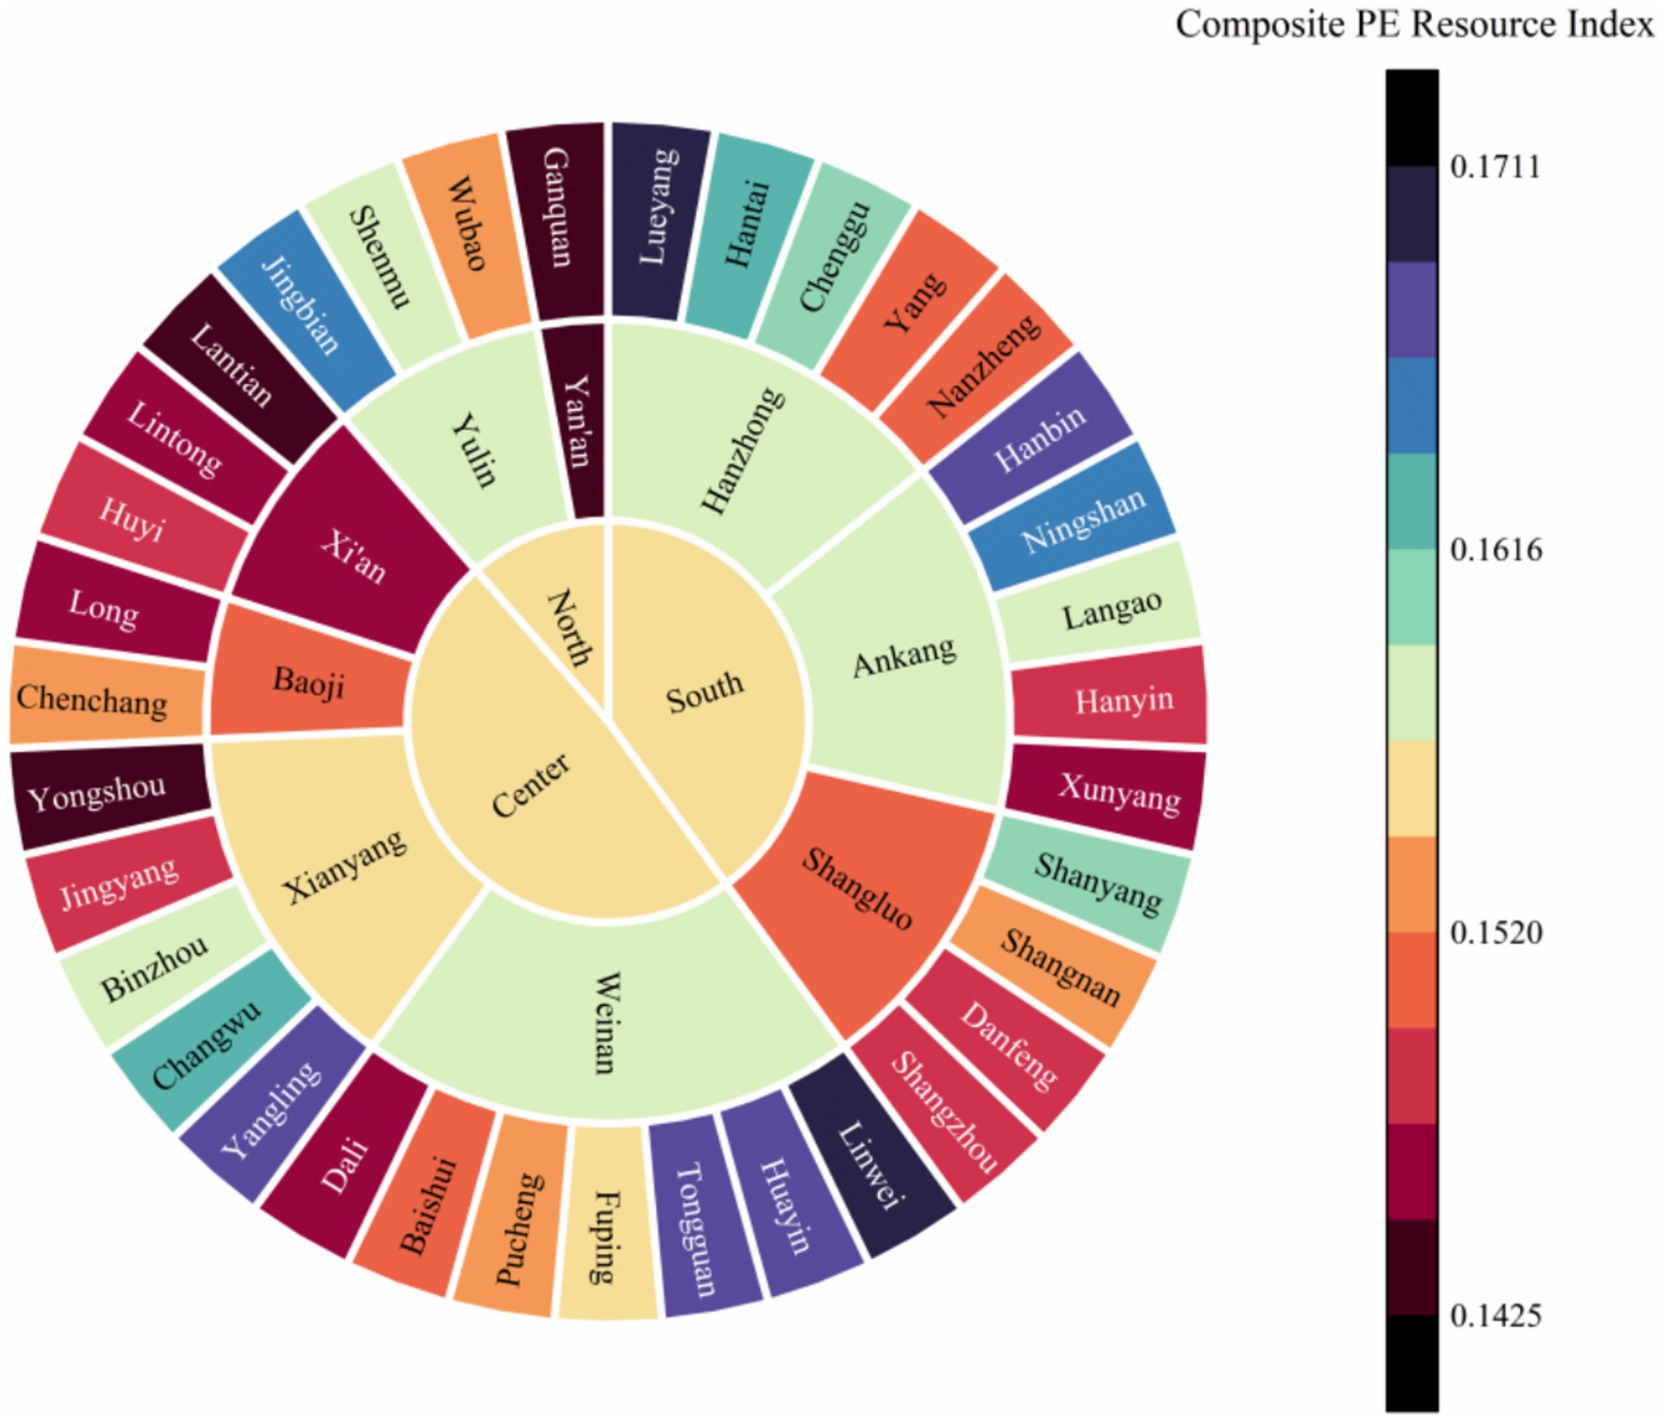
Figure 6. Distribution of lower-middle–level districts/counties in Shaanxi (2024). Class range and methodological details as in Figure 3.
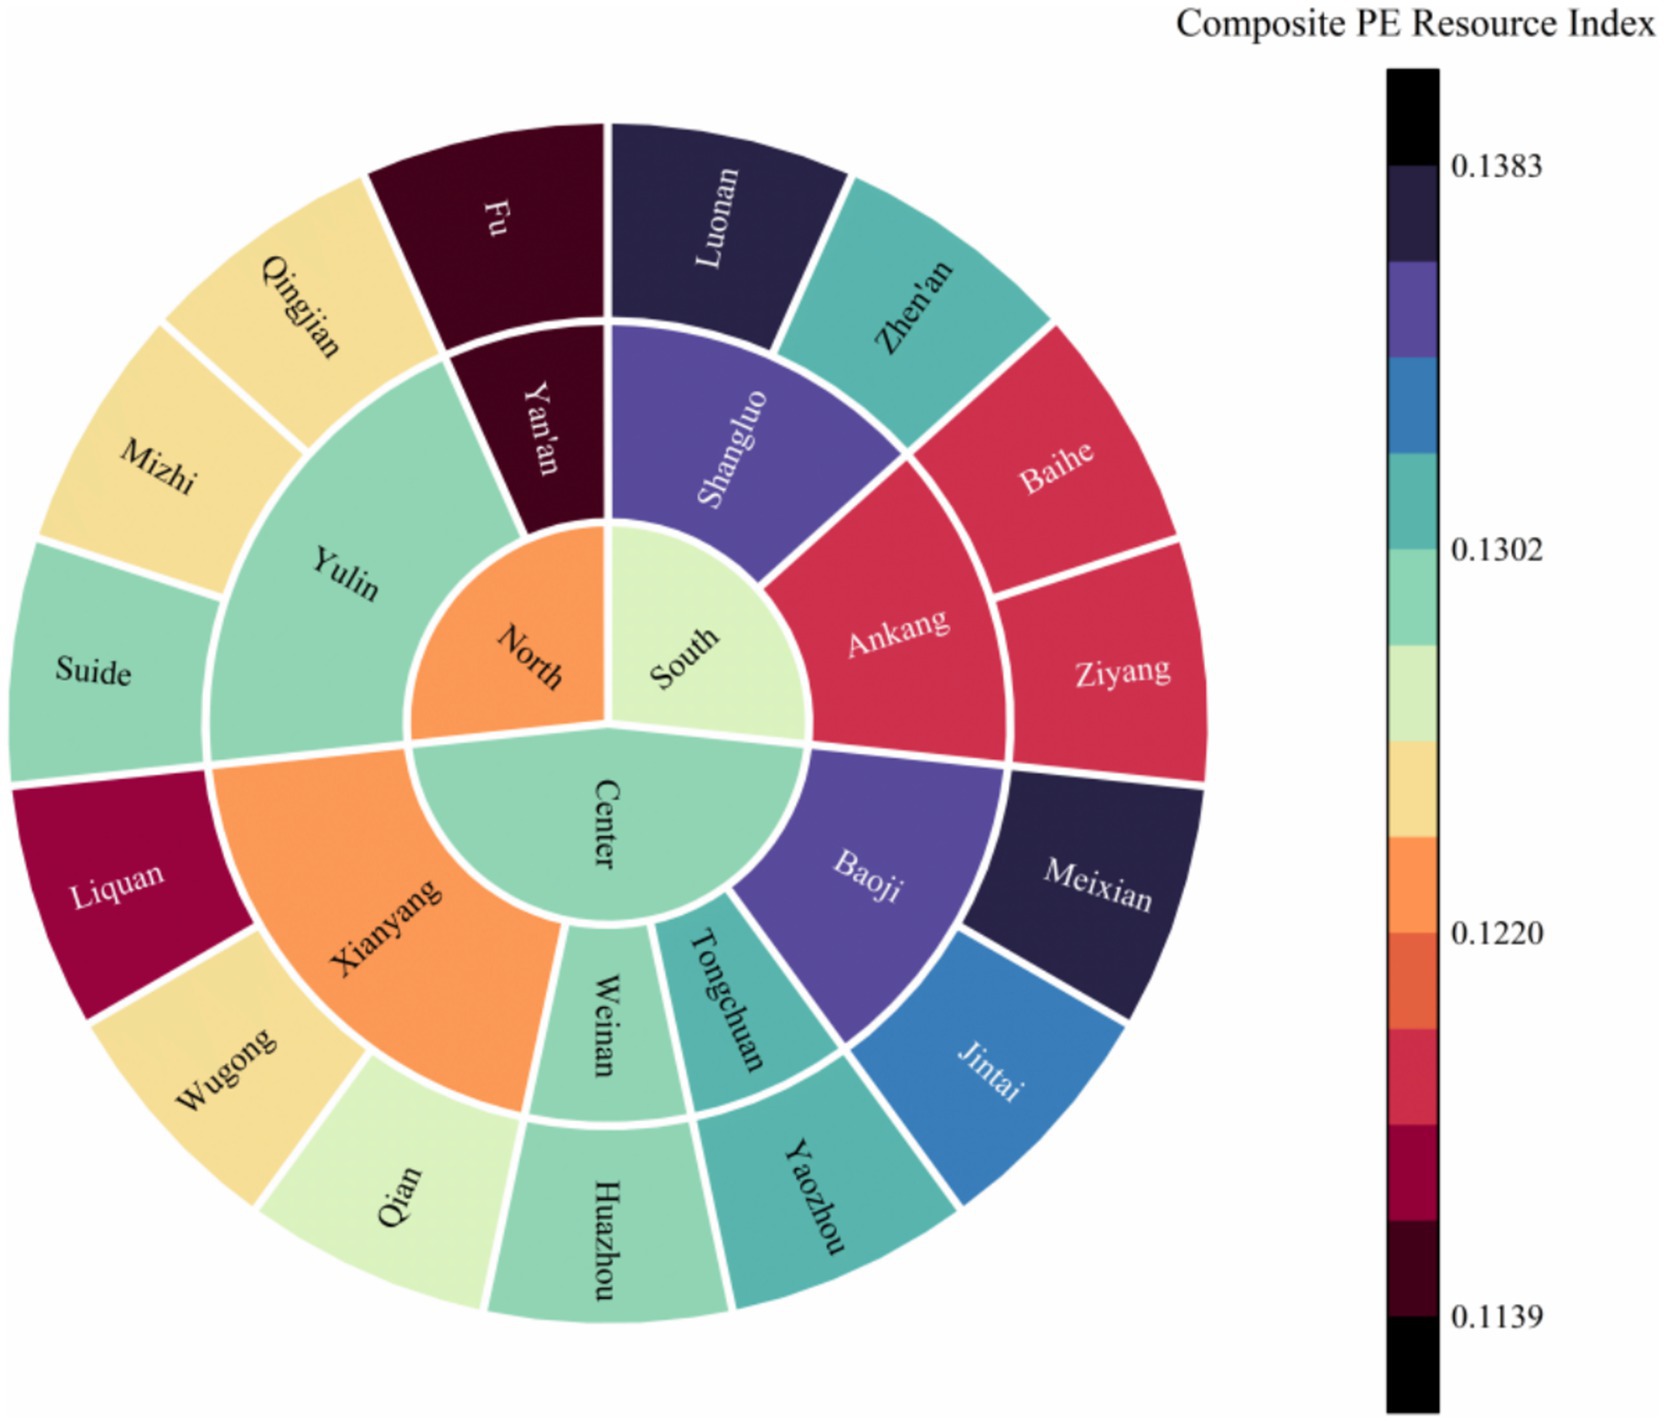
Figure 7. Distribution of low–level districts/counties in Shaanxi (2024). Class range and methodological details as in Figure 3.
In addition to the tiered map, a standard deviational ellipse analysis summarizes the overall spatial concentration of resources (see Table 1 and Figure 8). The calculated center of gravity of resource allocation is around 108°29′E, 34°31′N, near the Xi’an–Xianyang border in central Shaanxi. The ellipse is oriented northeast–southwest with a long axis of about 252 km and a short axis of ~119 km (orientation ~19.5°). Its area (~94,200 km2) covers most of the province’s central belt but has limited east–west spread, reflecting the uneven diffusion of resources. The elongation (eccentricity ≈ 0.47) indicates that resources are much more dispersed along the NE–SW direction than across the short axis, confirming a strong clustering of resources in central Shaanxi.

Table 1. Standard deviation ellipse parameters for the distribution of school PE resources in Shaanxi Province.
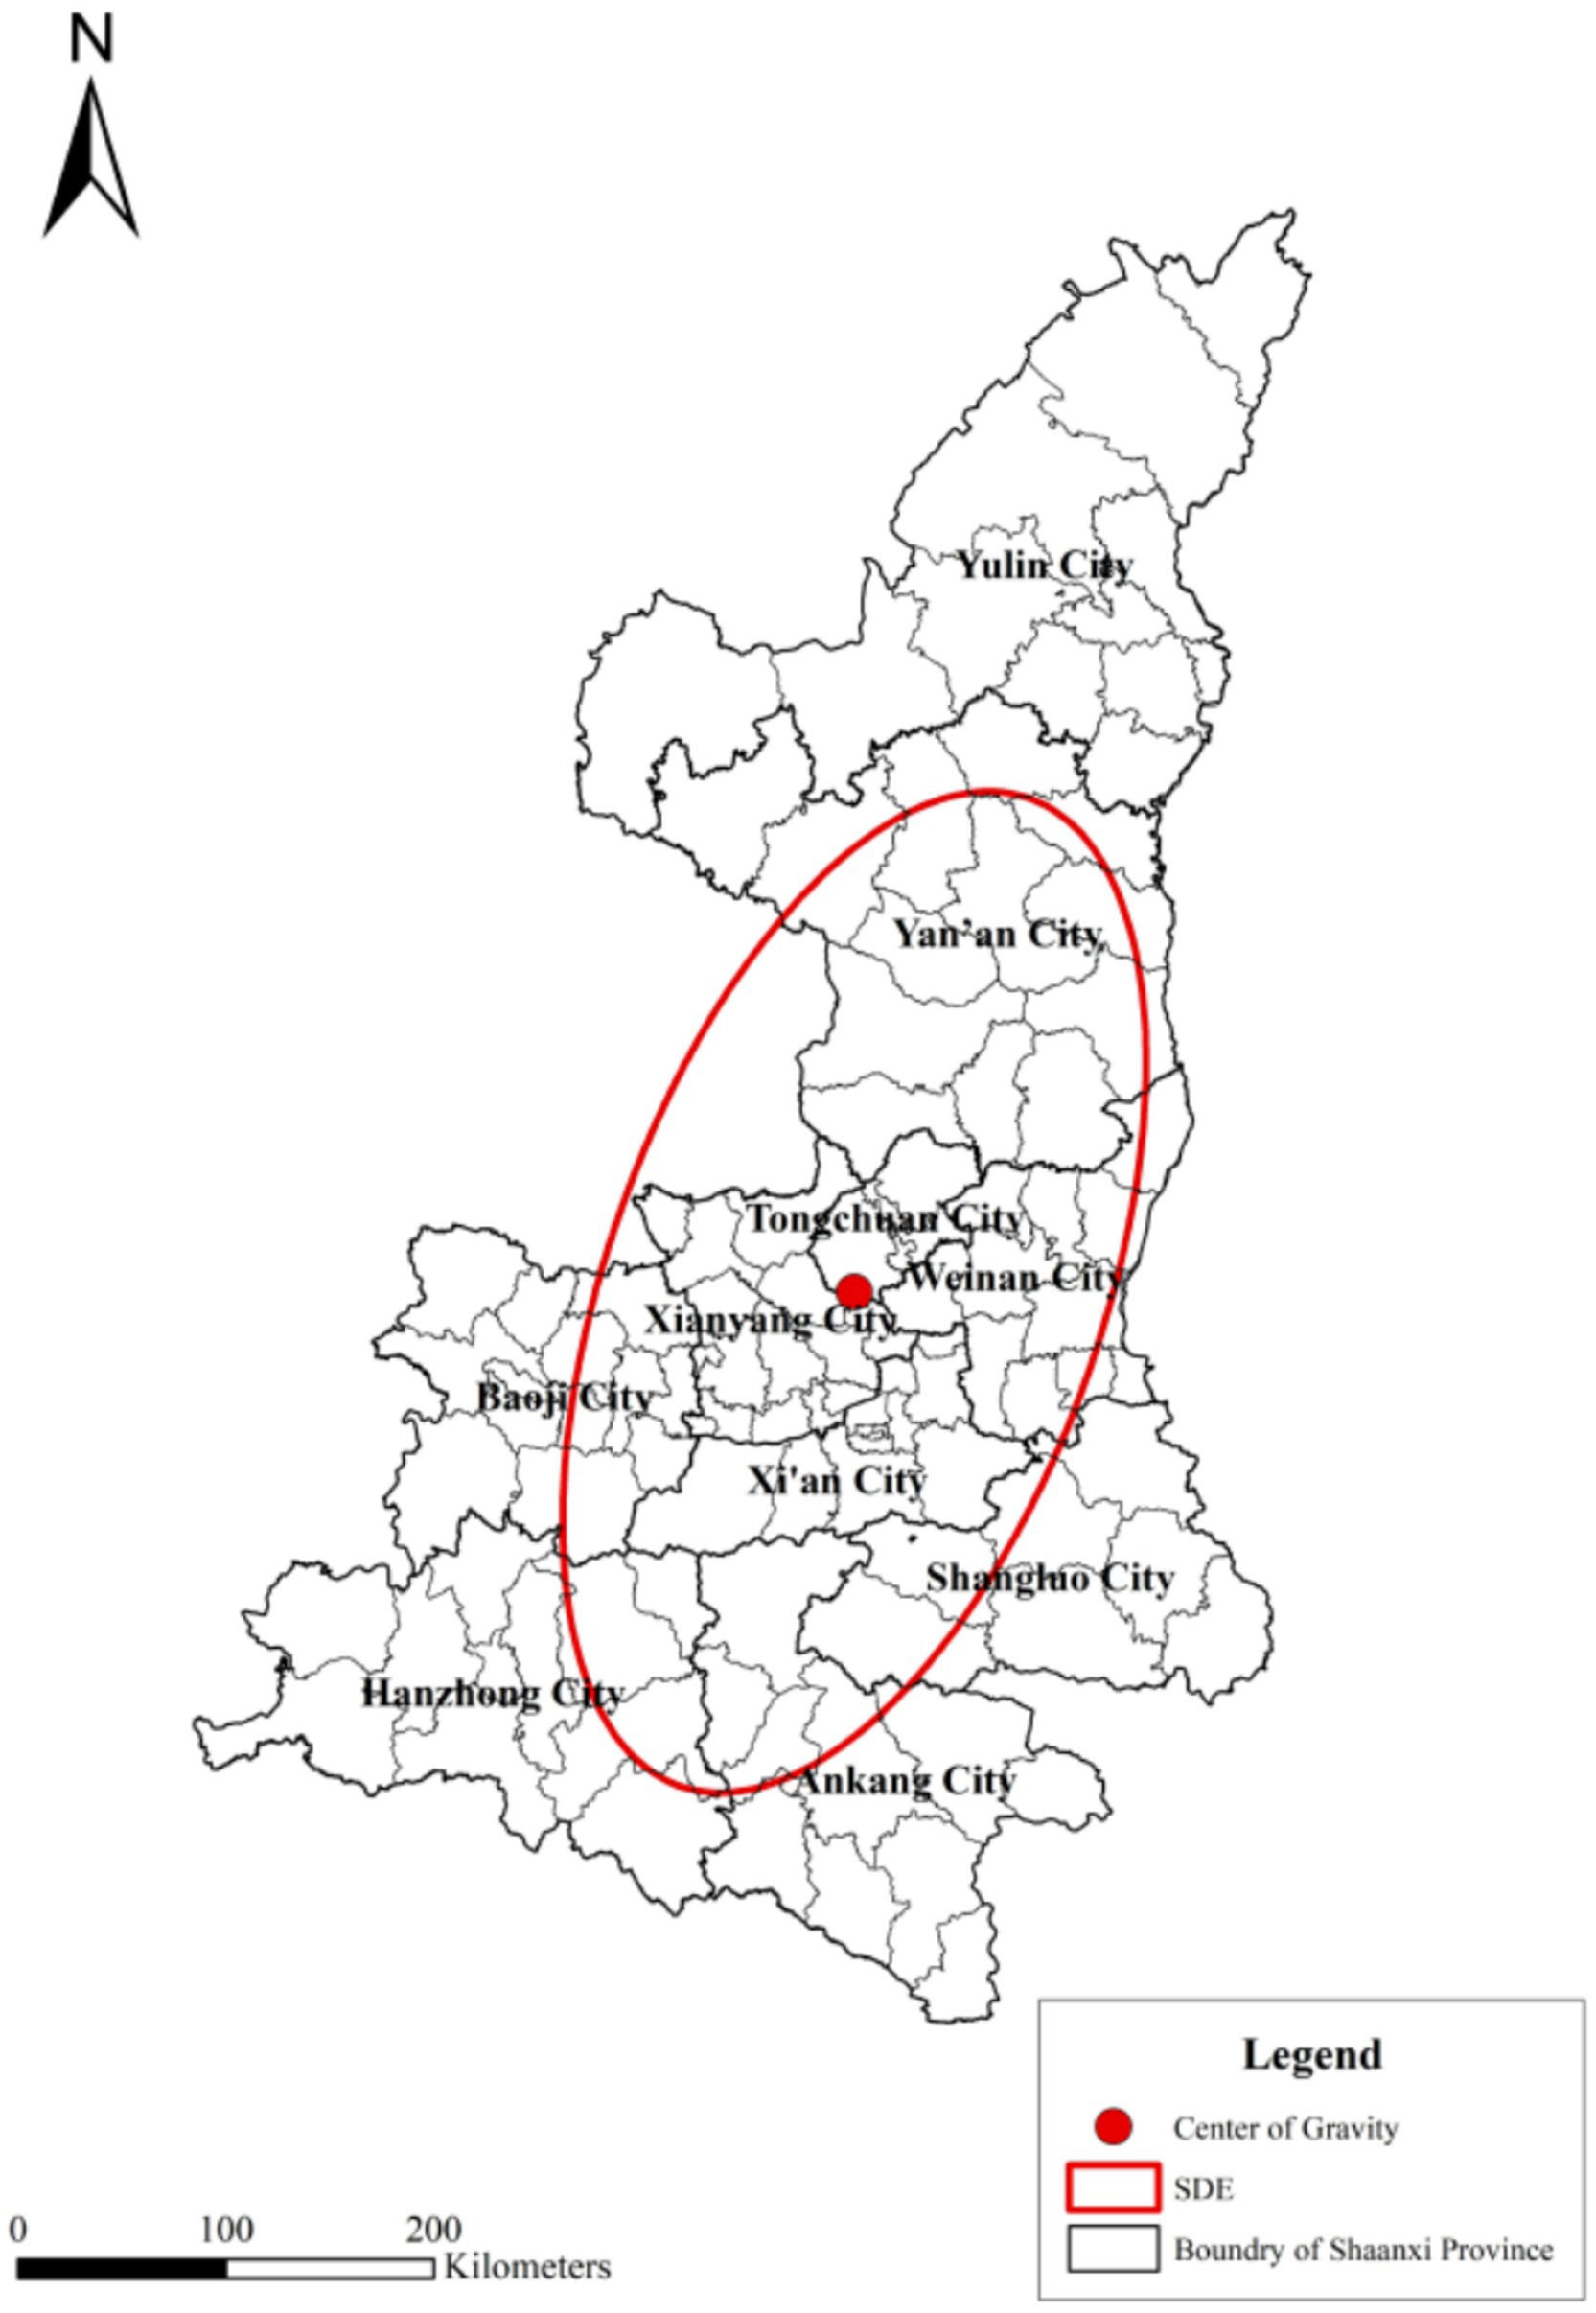
Figure 8. Standard deviational ellipse of school PE resource distribution in Shaanxi.
4.2 Spatial autocorrelation of resource allocation
Using global and local Moran’s I statistics, we assessed the spatial autocorrelation of PE resource allocation. The Global Moran’s I for 2024 is 0.105 (Z = 1.792, p = 0.037; see Table 2), indicating a weak but statistically significant positive spatial autocorrelation. In other words, neighboring districts have somewhat similar resource levels more often than random chance would suggest, although the overall clustering effect is modest.
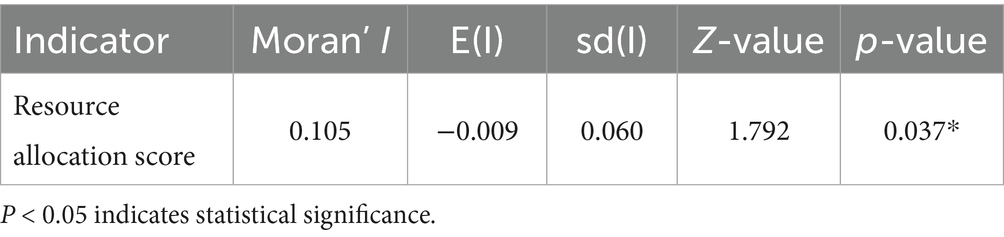
Table 2. Global Moran’s I for school PE resource allocation in Shaanxi Province (2024).
Turning to local patterns, the Local Moran’s I (LISA) results reveal distinct clusters and outliers (Figure 9 and Table 3). Four types of local spatial association are observed:
i. High–High (HH) clusters: 21 districts (19.6% of the total) form clusters of high-resource areas surrounded by high-resource neighbors. These are mainly concentrated in the urban core of central Shaanxi – for example, several central Xi’an districts and nearby city centers in Xianyang, Tongchuan, and Baoji. These pockets represent regional hubs where strong economies and educational investments coincide, creating localized zones of excellence in PE resources.
ii. Low–Low (LL) clusters: 49 districts (45.7%) — nearly half of the province — form extensive clusters of neighboring low-resource areas. These cover much of southern Shaanxi and also appear in poorer parts of central and northern Shaanxi (e.g., parts of Weinan, Baoji, and Yan’an), forming broad swaths of under-provision. Such areas are effectively “spatial poverty traps” where adjacent districts all suffer low resource levels and none provides a positive influence.
iii. Low–High (LH) outliers: 25 districts (23.3%) are low-resource districts adjacent to high-resource districts, often on the margins of urban core regions. Many suburban or peri-urban districts around Xi’an and other cities fall into this category: they have comparatively low PE resources themselves but border much better-resourced urban districts. Proximity to a core city provides some advantages, but it has not been enough to lift these districts out of low resource status — spillover benefits remain limited.
iv. High–Low (HL) outliers: 12 districts (11.2%) are isolated high-resource “islands” surrounded by low-resource neighbors. These rare cases (for example, a well-resourced county amid otherwise lagging counties) stand out from their surroundings but, because their neighbors are low-resource, they cannot impart significant positive effects to nearby areas.
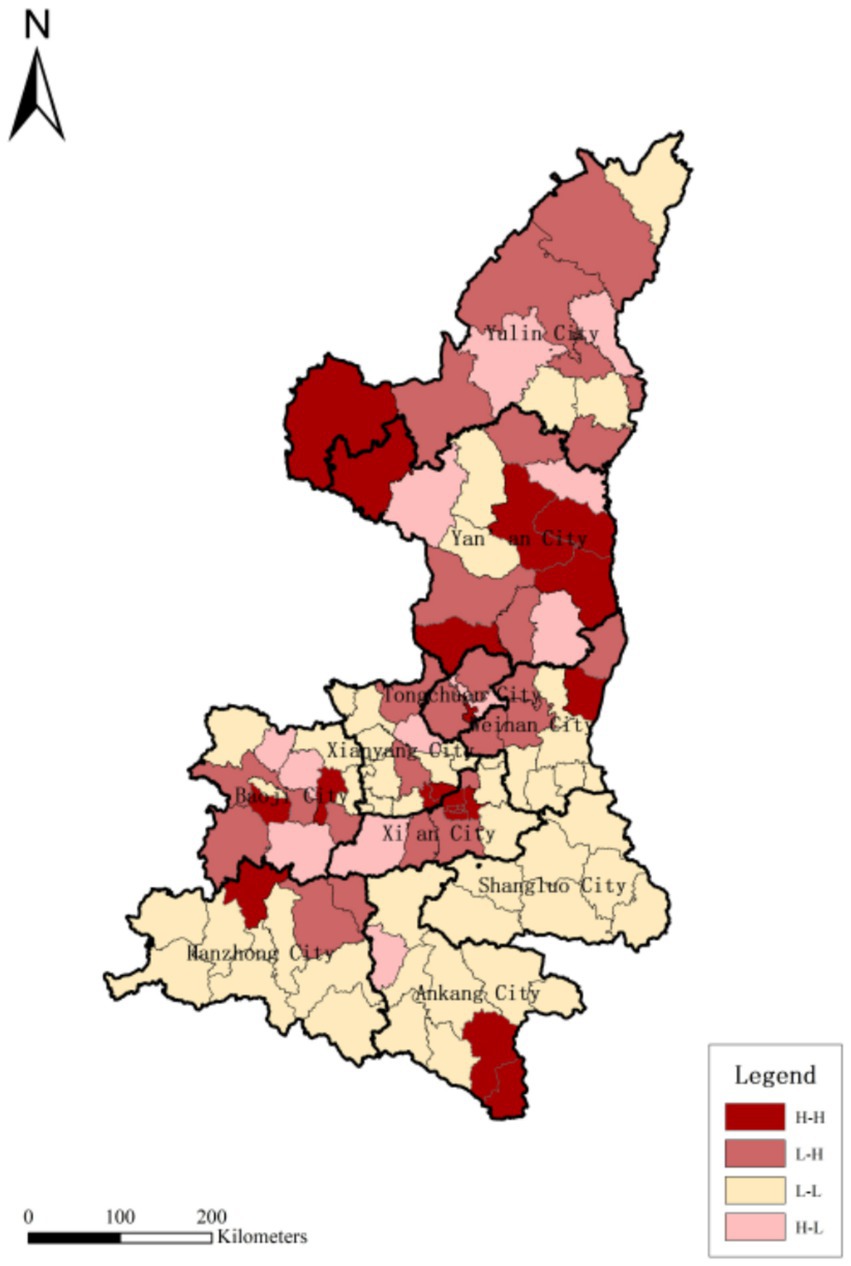
Figure 9. Local clustering of school PE resource allocation in Shaanxi Province.
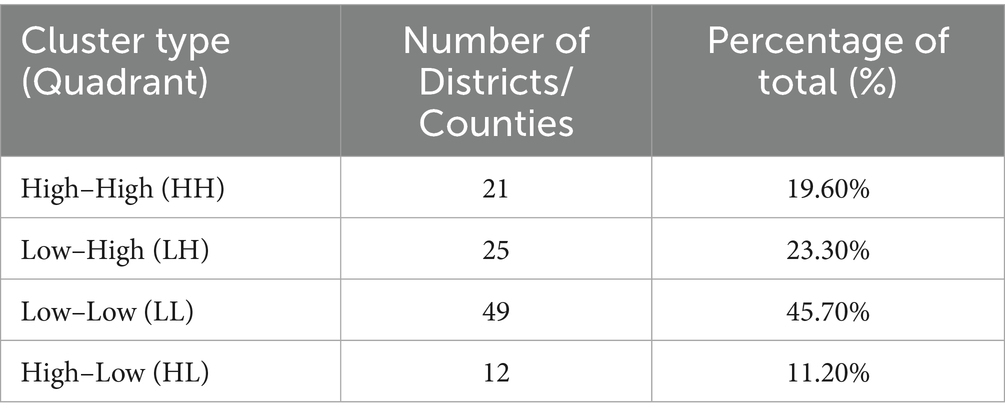
Table 3. Spatial clustering types of school PE resource allocation in Shaanxi Province.
Overall, the predominant pattern is the widespread Low–Low clustering, while High–High clusters are limited to a few central locales. The prevalence of LH outliers around major cities indicates that resource levels drop off sharply outside urban cores, with little natural diffusion outward. In summary, there are significant localized clusters of both high and low resources (as expected in our hypothesis H2), but the global autocorrelation is relatively weak. This suggests that policy interventions are needed to break up the entrenched low-resource clusters—relying on geographic proximity or trickle-down from high-resource areas is insufficient to substantially reduce inequalities. Targeted measures (e.g., special funding, inter-district resource sharing, or “twinning” programs between high- and low-resource schools) will be necessary to address these spatial inequities.
4.3 Sources of inequality in resource allocation
We applied Dagum’s Gini coefficient decomposition from two perspectives: (a) among the province’s three major regions (central, southern, northern Shaanxi), and (b) among the 10 prefecture-level cities. The overall Gini coefficient for the composite resource index in 2024 is 0.176, indicating that allocation is fairly balanced overall, but a non-trivial degree of inequality remains.
For the three-region grouping (central vs. southern vs. northern), the largest share of inequality comes from cross-region disparities. The transvariation Gini (Gt) is 0.073, contributing about 41% of total inequality (Table 4). The next largest source is inequality within each region (Gw = 0.068, ~39%). By contrast, differences between the average resource levels of the three regions (between-group Gini, Gb = 0.035) account for only ~20%. In other words, over 80% of the overall imbalance is due to disparities among districts either across or within regions, whereas the gap between the regions’ mean resource levels is relatively minor.
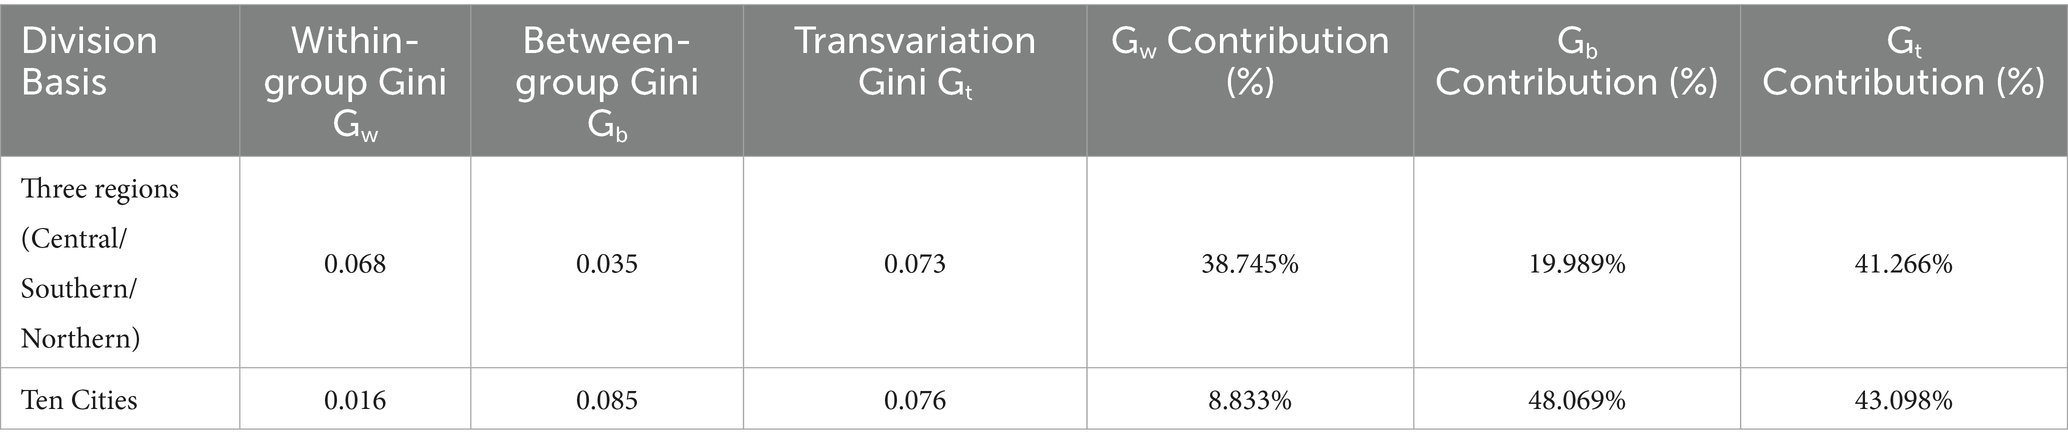
Table 4. Dagum Gini coefficients and contribution of inequality for school PE resources (2024).
For the city-level grouping (10 prefecture-level cities), disparities between cities are the dominant source of inequality. The between-city Gini is 0.085, nearly 48% of total inequality. The transvariation component across cities (Gt = 0.076) contributes about 43%, reflecting overlapping inequalities among districts from different cities. Within-city inequality is minimal (Gw = 0.016, ~9%). Thus, almost half of the province-wide inequality is driven by uneven resource distribution across different cities (for example, between Xi’an and less developed cities), while resource allocation within each individual city is relatively balanced.
4.4 Dominant factors in resource disparities
4.4.1 Overall dominant resource type
When examining which resource dimension contributes most to each district’s composite score, human resources overwhelmingly emerge as the dominant factor. In 103 out of 107 districts (96.3%), the human resources component (e.g., the strength of the PE teaching faculty) is the primary driver of the composite score. Only one district (Fengxiang) is predominantly driven by material resources, and only three districts (Taibai, Yintai, Zhouzhi) by financial resources. This indicates that in the vast majority of districts, improvements in school PE resources rely mainly on having sufficient and qualified teachers, rather than on infrastructure or funding alone.
The profile of the top-performing districts in each resource category reinforces this point (see Appendix Table 2). The highest human-resource scores are found in districts of central and northern Shaanxi (notably urban districts of Xi’an and certain counties in Yan’an/Yulin), which benefit from strong overall education levels and can attract excellent PE teachers. High material-resource scores are more geographically scattered; a few remote counties (e.g., Ningshan, Foping) have ample facilities and land, but they still do not rank highly overall due to shortages of teachers and funding. Meanwhile, some districts show very strong financial input (particularly in developed areas like Xi’an and Baoji), but cases such as Shiquan, Qianyang, and Fugu demonstrate that heavy funding alone does not guarantee a high overall resource level—without parallel investment in human and material resources, large expenditures yield only moderate outcomes. In sum, financial investment or facility provision in isolation is insufficient; a coordinated balance across human, material, and financial inputs is necessary to substantially elevate a district’s overall PE resource allocation.
4.4.2 Dominant sub-factors within human resources
Within the human resources dimension, we further identified which specific sub-factor drives each district’s performance:
i. Student–teacher ratio: This is the key sub-factor in 50 districts (~46.7%). These districts are mostly medium- or low-resource areas in central and southern Shaanxi. They often have lower student density and less urbanization, which helps them maintain favorable student–teacher ratios. However, many still belong to Low–Low clusters, meaning that despite smaller class sizes, both they and their neighbors suffer overall resource scarcity.
ii. Full-time PE teacher ratio: This sub-factor is dominant in 34 districts (~31.8%), mainly higher-resource districts in central and northern Shaanxi. These include many of the urban core districts of Xi’an (e.g., Yanta, Weiyang, Baqiao, Beilin) and strong districts in Yan’an and Yulin. Such areas have a high proportion of full-time PE teachers and often form High–High clusters. In contrast, very few southern Shaanxi districts prioritize this factor, reflecting that the south has comparatively fewer districts with a strong full-time PE faculty presence.
iii. New PE teacher recruitment rate: This factor is dominant in 23 districts (~21.5%). These are typically districts attempting to boost resources by hiring new PE teachers, yet most remain in Low–Low clusters. They are spread across all regions, including some Low–High outliers (low-resource districts next to high-resource neighbors) and High–Low outliers (high-resource districts surrounded by low-resource neighbors). Even with increased hiring, these districts generally still have low overall resources, suggesting that recruitment alone has not overcome their deficits.
iv. Teacher training participation and vacancy rates: No district has either teacher training participation or the PE teacher vacancy rate as its dominant factor. This implies a province-wide shortcoming in these areas. Improvements in professional development and in filling teacher vacancies have not been substantial enough in any district to become the leading driver of resources. It highlights that insufficient emphasis on teacher training and unfilled teaching positions remain problems across the board, limiting their impact on raising PE resource levels.
4.4.3 Dominant sub-factors within material resources
For the material resources category, we examined the two sub-factors:
i. Per-student sports field area: This is the dominant material factor in only 28 districts (~26.2%). These districts typically have lower population density and less developed economies, which allows more campus space per student. Even so, most of them still exhibit only medium or low overall resource levels. The fact that only about a quarter of districts excel in per-student area suggests that in the majority of districts, physical space for sports is limited – especially in densely populated urban areas where school grounds are fully utilized. This underscores the importance of investing in new or expanded facilities in areas where land is available, in order to improve the space per student for PE activities.
ii. Sports equipment compliance rate: This is the primary material resource factor in 79 districts (~73.8%). The vast majority of districts have focused on meeting the national standards for sports equipment availability. Ensuring standard equipment can often be achieved relatively quickly with targeted funding, which explains the emphasis on this indicator across most regions. However, relying solely on equipment compliance is not enough to boost overall PE quality. Many districts have essentially “ticked the box” on equipment (a quicker fix), while more challenging issues like expanding physical space or improving instructional quality may lag behind. In short, most districts have addressed basic equipment needs, but further improvements in facilities and other qualitative aspects are still needed.
4.4.4 Dominant sub-factors within financial resources
Notably, in every single district, the per-student sports equipment expenditure is the dominant financial indicator. In other words, 100% of districts prioritize spending on sports equipment over other types of PE expenditure. This reveals a policy bias toward immediate, visible “hardware” investments. As a result, financial inputs are heavily skewed toward purchasing equipment, while longer-term investments (such as constructing sports fields or funding teacher training) are relatively lacking. This unbalanced allocation has created a structural imbalance: schools might end up well-stocked with equipment but still lack adequate facilities or well-developed human capital. Looking ahead, it is crucial to rebalance financial resources by increasing investments in infrastructure and teacher development to achieve a more comprehensive and sustainable improvement of school PE resources.
4.5 Determinants and interaction effects
Using the Geographical Detector model, we analyzed the influence of various socio-economic and educational factors on the spatial distribution of school PE resources in 2024. We selected eight independent variables (X1–X8) based on relevant studies and data availability (Zhao et al., 2018; Wang et al., 2021; Sun et al., 2023; Yao and Feng, 2023; Dai and Xu, 2008; Zhang et al., 2022). Table 5 summarizes each factor and its explanatory power (q-value) for the resource index.
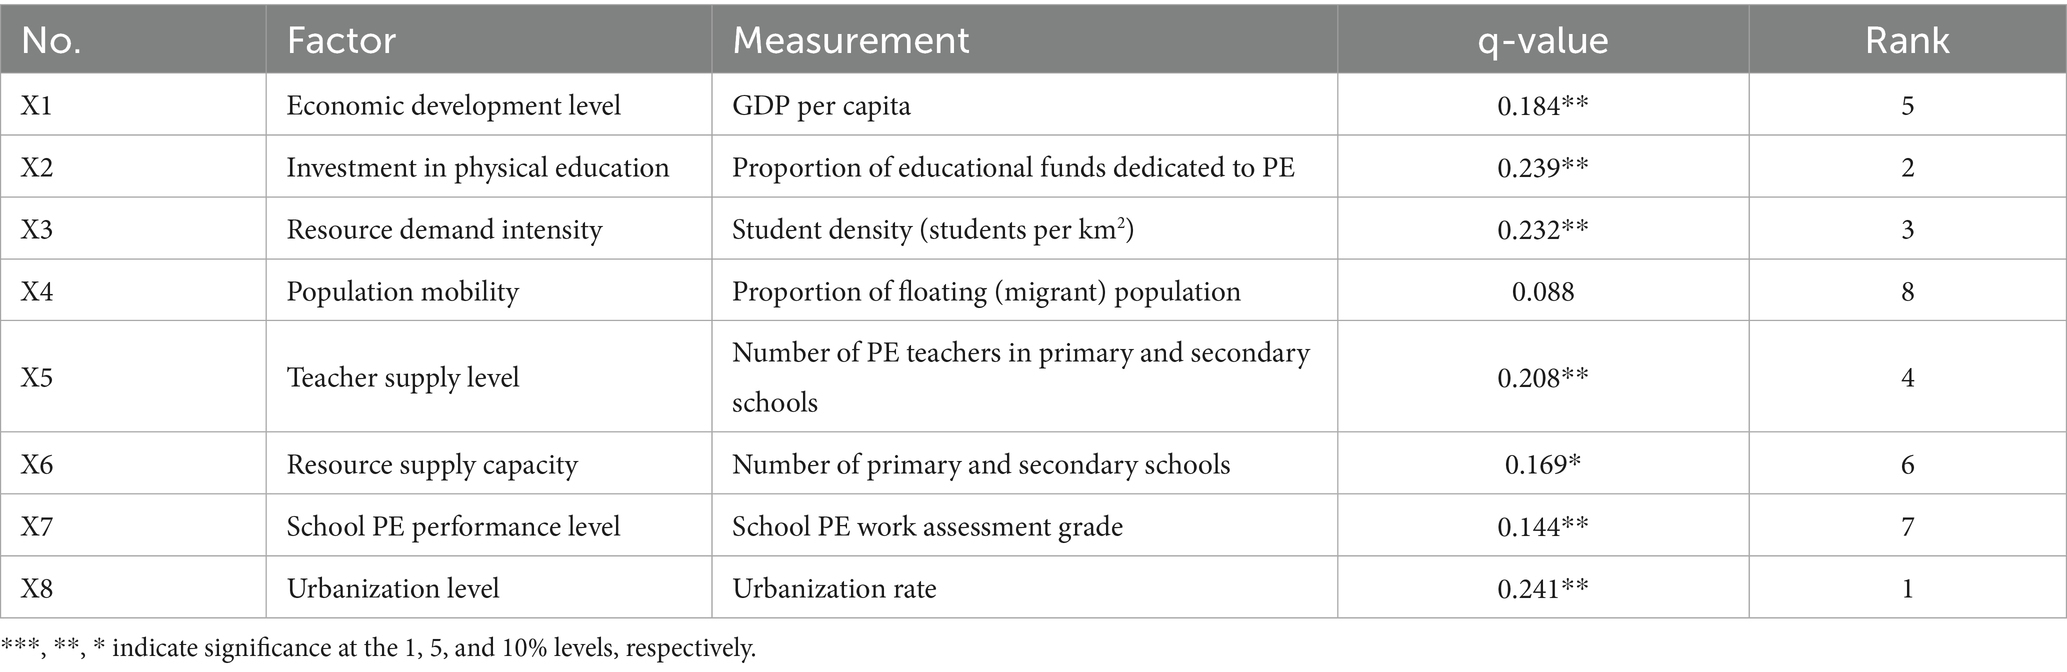
Table 5. Influencing factors of school PE resource allocation in Shaanxi Province (2024).
All factors except population mobility (X4) show a statistically significant effect on resource distribution (p < 0.05), though their strengths vary. The three most influential individual factors are the urbanization level (X8, q = 0.241**), the proportion of educational funds dedicated to PE (X2, q = 0.239**), and resource demand intensity (X3, measured by student density, q = 0.232**). Each of these explains roughly 23–24% of the spatial variance in the resource index, marking them as key drivers of differences between districts. Following these, the supply of PE teachers (X5, q = 0.208**) and overall economic development (X1, GDP per capita, q = 0.184**) also have substantial impacts. By contrast, population mobility (X4, proportion of migrant population) has the lowest q-value (0.088, not significant), indicating that migration patterns alone do not directly translate into better or worse resource allocation in a simple linear sense.
Beyond individual factors, the detector’s interaction analysis reveals that combinations of factors greatly increase explanatory power — in every case, a pair of factors together explains more variance than either factor alone. Some pairs exhibit especially strong synergies (Figure 10 illustrates these interaction effects). The most potent interaction is between urbanization (X8) and the number of schools (X6, a proxy for resource supply capacity), with a combined q-value of 0.539. This value is much higher than the sum of their individual effects, indicating a nonlinear enhancement. In practical terms, districts that are highly urbanized and have a sufficient number of schools enjoy a significantly better resource allocation. Urbanization brings improved infrastructure, concentrated demand, and policy support, which, when matched with an adequate school network, allows resources (funding, staff, facilities) to be utilized far more effectively.
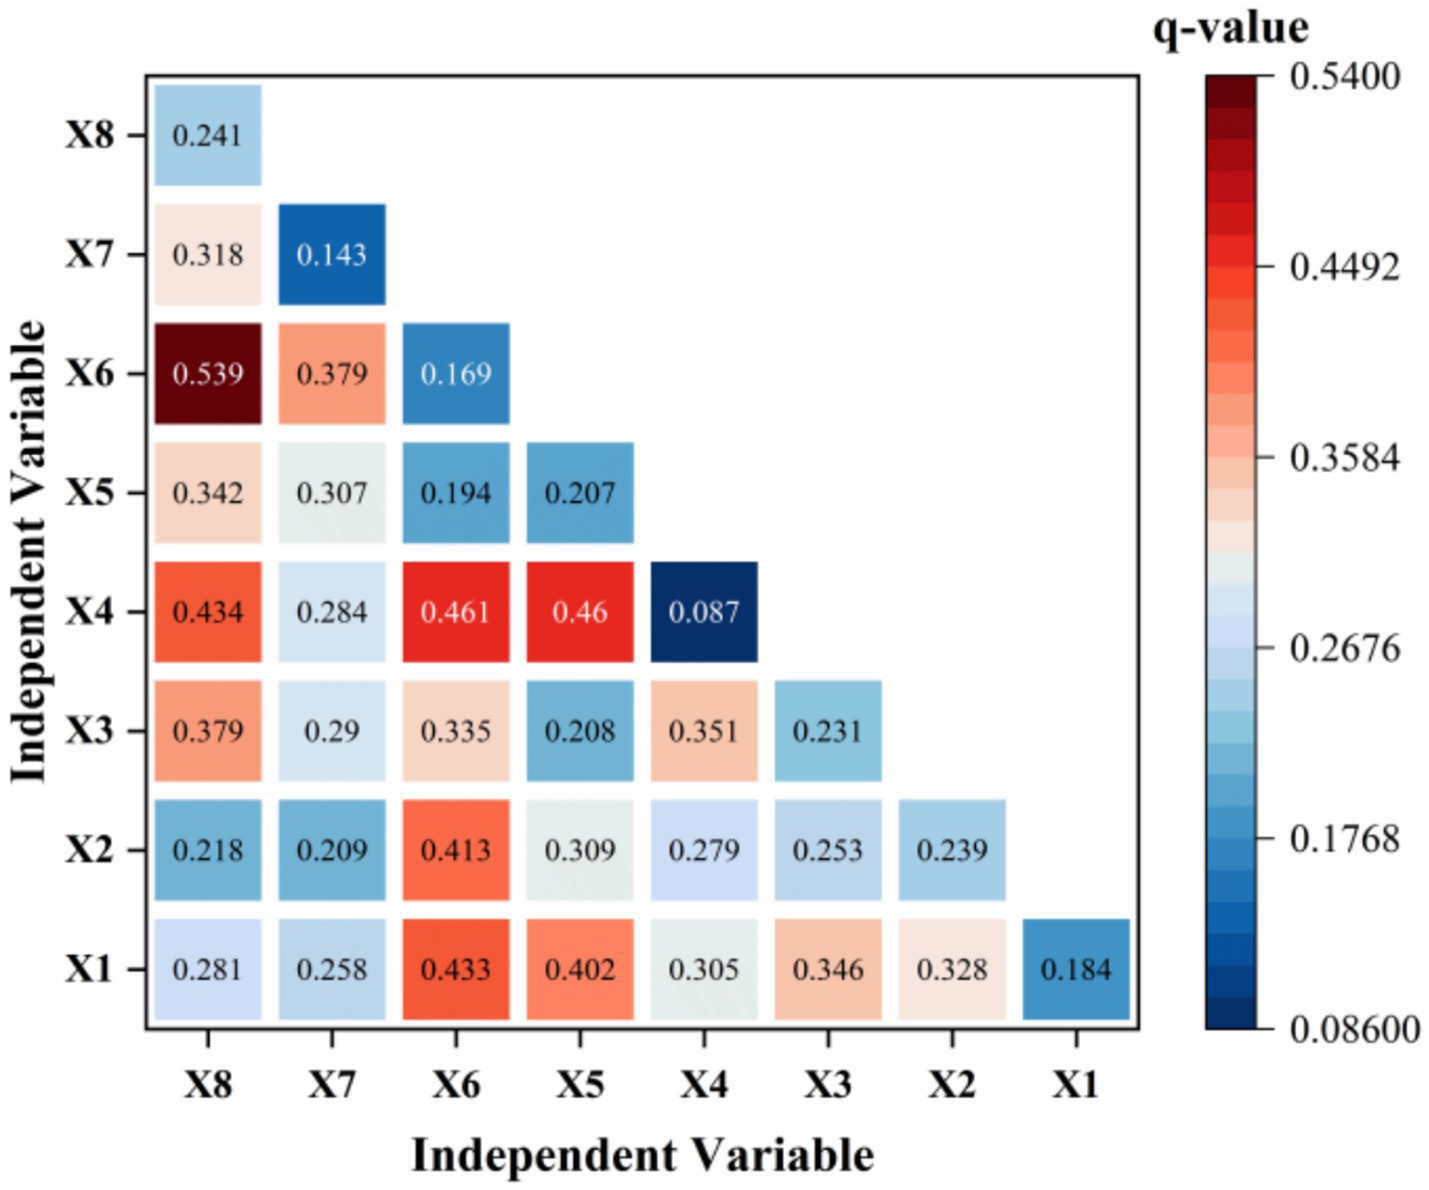
Figure 10. Interaction detection of influencing factors on school physical education resource allocation. The color bar denotes the q-value (0–1). Diagonal cells show single-factor q (factor detection); the lower triangle shows pairwise interaction q (q(A ⊗ B)); the upper triangle is intentionally left blank. Variables: X1 GDP per capita; X2 share of education funds dedicated to PE; X3 student density; X4 population mobility; X5 teacher supply; X6 number of schools; X7 school PE performance grade; X8 urbanization rate. Significance based on 1,000 permutations; non-significant cells (if any) are indicated as “n.s.”
Economic development (X1) interacting with the number of schools (X6) also shows a strong synergy (q = 0.443). Wealthier areas can fund the construction and expansion of schools and attract high-quality teachers; when both high GDP and ample schools coincide, PE resources are notably higher. Similarly, the interaction of PE funding investment (X2) with school supply (X6) has a high joint influence (q = 0.413). This suggests that financial inputs into PE yield the greatest returns in districts that have enough schools (and capacity) to absorb those funds – for example, money for equipment or facilities makes the most difference where there are schools ready to equip or expand.
Interestingly, even a factor like population mobility (X4), which on its own was insignificant, becomes important when combined with other factors. For instance, X4 interacting with teacher supply (X5) produces a q-value of 0.460. In areas experiencing population influx, having a robust supply of teachers to accommodate the growing number of students significantly improves resource adequacy (preventing student–teacher ratios from spiking). Conversely, in areas with population outflow, the ability to reallocate or reduce surplus teachers helps maintain efficiency. Another notable pair is population mobility (X4) with urbanization (X8), which has a joint q of 0.434. Highly urbanized areas that attract migrants often respond by expanding schools and services; this coordinated growth helps maintain balanced resource allocation despite the influx of students. In effect, urbanization and migration reinforce each other’s impact: cities draw in population and, by adapting to that growth, further enhance resource distribution (turning a potential strain into a stimulus for improvement).
In summary, the spatial distribution of school PE resources is shaped by multiple interlinked factors. High urbanization, ample school infrastructure, strong economic conditions, dedicated PE funding, and an abundance of teachers all tend to coincide in high-resource areas. The greatest improvements in resource allocation occur when these favorable conditions coincide, rather than from any single factor alone. This means that policy measures should be comprehensive. To promote equitable and high-quality PE resources across Shaanxi, policymakers should leverage these interactions – for example, by aligning urban development with educational infrastructure expansion, boosting PE funding and teacher recruitment in tandem, and managing population shifts with responsive schooling and staffing strategies. Harnessing these synergies will have a much larger impact than addressing any single factor alone.
4.6 Robustness checks
We tested the stability of our key patterns—the core–periphery gradient, the prevalence of LL clusters, and the dominance of inter-city gaps—with the following checks:
i. Index weights: Recomputed the composite index with equal weights and PCA weights; spatial maps, Global Moran’s I, LISA shares, and headline results were unchanged.
ii. Outliers & sampling: Applied 1% winsorization and leave-one-city-out re-estimation; magnitudes shifted slightly but directions and significance persisted.
iii. Spatial weights: Compared queen/rook contiguity, k-nearest neighbors (k = 4, 6, 8), and inverse-distance matrices; clustering patterns (HH in the core, LL in peripheries) remained.
iv. Classification: Varied Jenks class counts (4/5/6) and used quantiles; visual boundaries moved at the margins, but the gradient pattern held.
v. Inequality decomposition: Replicated Dagum’s Gini with alternative groupings (three macro-regions/east–west split/10 cities); between-city components stayed largest.
vi. GeoDetector settings: Discretized factors via Jenks/quantiles/equal-interval and ran 1,000 permutations; top drivers (urbanization, PE funding share, student density, teacher supply) and non-linear interaction findings were stable.
In summary, across specifications, trimming, and inference choices, the spatial signals are robust; results are not artifacts of weighting, outliers, W-matrices, cartographic breaks, group definitions, or discretization.
5 Discussion
5.1 Key findings
First, there is a clear spatial imbalance in school PE resource allocation across Shaanxi Province, following a core–periphery pattern; central Shaanxi (especially the Xi’an metropolitan area) holds a dominant position with substantially better resources than the peripheral regions in the south and north. This mirrors broader regional disparities observed in education and public services in China (Zhao et al., 2018; Wang et al., 2021). Indeed, a United Nations report notes that rural–urban disparity is one of the most conspicuous forms of spatial inequality worldwide (United Nations, 2020). Our findings demonstrate the same pattern: urbanized core districts concentrate far more PE resources, while remote rural counties suffer chronic shortfalls. This validates H1 and highlights the need for targeted regional policies to support under-resourced areas—particularly southern Shaanxi and remote northern counties—to ensure more equitable educational opportunities.
Second, human resources—particularly the supply of qualified PE teachers—emerged as the most critical factor influencing resource levels across districts. Districts with favorable student–teacher ratios and a higher proportion of full-time PE teachers consistently achieved better composite resource scores. This aligns with literature that underscores the pivotal role of teachers in educational quality and equity (Yuan and Sun, 2022; Jiang et al., 2023), and suggests that strengthening the PE teacher workforce through improved recruitment, training, incentives, and deployment would yield substantial gains in resource equity. By contrast, increasing financial inputs or building facilities without enough trained teachers to use them had little impact on overall resource levels. Globally, UNESCO projects that a shortfall of about 44 million primary and secondary teachers will need to be filled worldwide by 2030 to achieve universal education goals (UNESCO, 2024), underscoring how critical human capital is for educational equity. In our context, investing in human resources stands out as the key lever, as effective PE provision depends more on having skilled teachers than on any other single resource.
Third, our spatial autocorrelation analysis showed that although neighboring districts often have similar resource levels (indicating some clustering), there were only weak positive spillover effects from well-resourced areas to their neighbors. High–High clusters were largely confined to the urban core (e.g., central Xi’an and Xianyang), while sizable Low–Low clusters dominated poorer peripheral regions. However, proximity to a major city alone has not been sufficient to lift adjacent rural districts out of deprivation. This lack of natural diffusion exemplifies an “urban bias” pattern: cities retain advantages while outlying areas remain neglected without deliberate intervention. Accordingly, H2 was only partially supported: we observed pockets of high and low resources, but the expected spillovers from core to periphery were weak. In practical terms, being adjacent to a resource-rich district does not automatically guarantee improvement; deliberate policy measures are needed to facilitate the sharing of resources and expertise. For example, stronger inter-district collaboration and urban–rural partnerships (such as pairing high-resource schools with low-resource counterparts) could help spread best practices and support to lagging areas (General Office of the CPC Central Committee and General Office of the State Council, 2023). Such resource-sharing mechanisms are crucial for breaking the negative feedback loops that trap Low–Low clusters in persistent under-allocation.
Fourth, our inequality decomposition using Dagum’s method revealed that differences across regions and between cities are the dominant sources of overall inequality in PE resources. At the provincial scale, the disparity between central Shaanxi and the southern and northern regions (including the overlapping variation between these groups) accounted for the bulk of inequality, whereas within-region differences were much smaller. Similarly, at the city level, disparities between cities—especially between the provincial capital Xi’an and other cities—contributed about 55% of total inequality, far exceeding within-city disparities (Yao and Feng, 2023). This finding strongly supports H3, indicating that the primary drivers of imbalance are the gaps between major regions and between top-tier cities and the rest. By contrast, resource distribution within any given city or region is relatively even. This implies that policy efforts must operate on multiple geographic scales: provincial initiatives should focus on lifting resource-poor regions (for example, by directing more support to southern Shaanxi and weaker cities), while city-level strategies should aim to narrow the gaps between leading cities and smaller municipalities. Addressing these cross-regional and inter-city disparities will do more to improve overall equity than measures that merely even out resources within already advantaged areas.
Fifth, the Geographical Detector analysis showed that factors act synergistically: no single factor alone can explain the spatial pattern of PE resources. Notably, the interaction between a district’s urbanization level and its school provisioning capacity had a much higher explanatory power (q ≈ 0.539) than either factor on its own. In general, any two determinants considered together influenced resource distribution more than the sum of their individual effects. This indicates strong non-linear synergy—for instance, a highly urbanized area with a robust network of schools enjoys an outsized resource advantage far beyond what high urbanization or abundant schools would produce alone. Even factors with modest independent effects became significant in combination. For example, population mobility by itself had little impact, but areas with high in-migration fared much better when they also had ample teachers and schools to absorb the growing demand. These patterns align with the idea of “cumulative advantage” in education, where multiple favorable conditions reinforce each other. They also highlight that educational resource allocation operates through a complex system of interlocking influences rather than simple linear cause and effect. For policymakers, this means piecemeal fixes targeting any single aspect (funding, infrastructure, or staffing) are likely to have limited impact; only a holistic strategy advancing multiple factors in tandem (improving facilities, funding, and human capacity simultaneously) will generate multiplier effects and substantially raise resource levels. In sum, spatial inequality in school PE resources is rooted in structural urban–rural divides and human capacity constraints, and is amplified by interactions among these factors; therefore, any solution must address all of these dimensions together.
Finally, from a comparative perspective, our findings align with international evidence on educational equity and school physical education. Global syntheses by UNESCO and the OECD emphasize that fair resource distribution—particularly of qualified teachers, minimum facility standards, and sustained financing—is fundamental to equitable learning opportunities (UNESCO, 2015; OECD, 2012). Our observed core–periphery pattern and the prevalence of low–low clusters mirror the urban–rural and regional divides documented in cross-national studies, which report persistent shortfalls in teacher supply and facilities in many low-resource contexts (Hardman and Marshall, 2009; WHO, 2018). Similarly, our finding that the availability of qualified teachers is crucial aligns with research showing that teacher capacity is a decisive factor for educational quality and equity (Darling-Hammond, 2000; Hanushek, 1997). Likewise, the significance of adequate space and equipment in our results echoes studies linking school infrastructure to student engagement and learning conditions (Eime et al., 2013; Fisher, 2001; Earthman, 2002). Notably, we also quantified the system-level synergies between urbanization and school provisioning: our interaction analysis indicates that coordinated improvements in demographic, infrastructural, and fiscal conditions yield non-linear gains in PE resource availability. In this sense, the Shaanxi case provides evidence to inform international efforts to design integrated interventions aimed at breaking spatial poverty traps in school PE.
5.2 Policy implications and recommendations
5.2.1 Targeted strategies for spatial inequality typologies
i Low–low (LL) clusters – uplifting persistently under-resourced Regions: Low–Low (LL) Clusters – Uplifting Persistently Under-Resourced Regions: Low–Low clusters (districts that have low resources and are surrounded by similarly deprived neighbors) represent entrenched pockets of disadvantage, as identified in many peripheral counties of southern and northern Shaanxi. These areas require intensive, targeted support. The provincial government should channel additional funding and special programs to LL cluster counties to break the cycle of under-allocation. For example, earmarked grants could be provided to build or upgrade PE facilities (gymnasiums, sports fields, equipment) and to enrich sports programs in schools that currently lack basic resources. Crucially, strengthening human resources in these regions is paramount (echoing our finding that teacher supply is the linchpin of improvement). This might involve substantial incentives to attract and retain qualified PE teachers in rural and remote schools — such as housing subsidies, salary bonuses, or accelerated career advancement for teachers who serve in hard-to-staff areas. In extremely sparsely populated locales, a strategy of consolidating educational resources could be adopted: for instance, establishing well-resourced central schools or sports centers that serve multiple villages, coupled with transportation or boarding options to ensure student access. In short, a “triple-focus” on finances, facilities, and faculty is needed in LL clusters. These interventions should be coordinated with broader rural development initiatives (improving transportation, internet, healthcare, etc.) so that educational improvements occur hand-in-hand with enhanced overall livability. By intensively “leveling up” these lagging regions, Shaanxi can begin to close the core–periphery gap in PE resources and ensure that children in remote areas enjoy more equal opportunities.
ii Low–high (LH) margin areas – integrating adjacent low and high Regions: LH areas are districts with locally low resources but bordering high-resource neighbors (for example, some suburban counties on the fringes of Xi’an and other core cities). Our results show that mere proximity to an urban hub is not translating into adequate spillover benefits — many LH districts remain unable to capitalize on their neighbors’ advantages due to limited local capacity. To address this, strong urban–rural integration mechanisms must be put in place. First, infrastructure in LH districts should be upgraded (e.g., improving school buildings, sports facilities, and transportation links) to enhance their capacity to absorb resources and serve students. This might include building new schools or dedicated PE centers on the urban periphery so that growing metropolitan areas extend their educational services outward.
Second, formal partnerships with adjacent high-resource districts should be fostered to deliberately transfer resources and expertise. For instance, a low-resource county next to Xi’an could be paired with a well-resourced urban district in a twinning program. Such arrangements, as encouraged by national education policies (General Office of the CPC Central Committee and General Office of the State Council, 2023), enable resource sharing: urban schools can mentor rural ones, share access to sports facilities, and exchange teachers or coaches on rotation. Joint planning bodies may also be established for metro-area cities and their surrounding counties to coordinate school provision and PE resource deployment across administrative boundaries. The goal is to diffuse the advantages of high-resource areas into their hinterlands more effectively, so that being next to a major city becomes a boon rather than a nominal adjacency. By improving local absorptive capacity and actively linking LH margin areas with core-area resources, policymakers can prevent these districts from remaining stuck in limbo and ensure that regional growth is inclusive.
iii High–high (HH) urban cores – sustaining hubs and spreading best practices: HH clusters — exemplified by central Xi’an and a few other districts — enjoy both high internal resources and high-resource neighbors, forming strong positive clusters. These urban core areas benefit from robust economies and policy support, which have yielded abundant school PE resources. Policy attention for HH areas should focus on sustaining quality and leveraging these hubs for wider benefit. On one hand, as urban populations continue to grow, planners must ensure that school provisioning keeps pace so that today’s HH advantages do not erode under future demand. This means proactively reserving land and funding for new schools or expansions in high-growth urban districts, and continuously investing in PE teacher development and curriculum enrichment even in the best-performing schools.
On the other hand, HH districts should be encouraged to serve as resource and knowledge anchors for the region. The successful practices of these high-resource areas — effective investment strategies, resource management models, teacher training programs, etc. — can be documented and replicated in under-resourced regions. Provincial authorities could facilitate this by creating platforms for exchange (e.g., workshops, joint initiatives) where urban schools share expertise with rural educators. Furthermore, direct outreach from HH to LL areas should be incentivized: for example, urban sports universities or large city schools might partner with county education bureaus to host regular training camps for PE teachers from rural schools, or send mobile coaching clinics for students in remote communities. Such efforts complement the twinning approach and ensure that high-resource urban cores actively pull up surrounding areas, rather than simply standing as isolated islands of excellence. In sum, maintaining the high standards in HH clusters while using them as engines of mentorship and support for other areas will contribute to a more balanced provincial landscape.
iv Coordination across governance levels: Implementing the above targeted strategies requires tight coordination between provincial and local (city/county) authorities. Our inequality analysis showed that disparities across broad regions and between cities drive most of the imbalance, which means both top–down and bottom-up efforts are needed. The provincial government should lead large-scale redistributive programs (such as allocating extra funds or launching special initiatives for the poorest regions), while city and county governments tailor on-the-ground solutions (such as school pairings and local teacher incentive programs). A multi-level governance approach ensures that province-wide objectives (e.g., reducing the north–south resource gap) align with city-level actions (e.g., boosting resources in a specific under-served county). By synchronizing investments and policies across these levels, Shaanxi can more effectively tackle the macro-level core–periphery divide as well as micro-level disparities between neighboring districts. In essence, spatially targeted interventions at multiple scales will be required to achieve balanced development of school PE resources.
5.2.2 Integrated planning leveraging urbanization–school synergy
i. Rapid urbanization with low school density: In fast-growing cities or towns where surging population has outpaced the expansion of educational facilities, proactive planning is critical. Policymakers should integrate school construction and teacher recruitment directly into urban development plans. For example, when a new residential area or economic zone is planned, corresponding new schools (with adequate sports facilities) must be built in tandem and staffed with sufficient PE teachers. Education funding should be scaled up in step with population growth so that class sizes remain reasonable and facilities are not overburdened. By anticipating demand, districts can avoid a scenario where urban schools become overcrowded and under-resourced. Our findings show that a high urbanization rate can be an asset only if school capacity expands concurrently — when this happens, both factors reinforce each other and greatly improve resource availability. Thus, city planners and education authorities need to coordinate: every major urbanization initiative should include an education impact assessment and an earmarked budget for new schools and teachers. This integrated approach will ensure that the benefits of urban growth (such as greater funding and infrastructure) directly translate into improved educational resources, rather than exacerbating disparities. In sum, rapidly urbanizing districts should launch multi-pronged programs that simultaneously build schools, hire and train more PE teachers, and invest in equipment and maintenance. Such holistic planning leverages the urbanization–school synergy and creates a positive feedback loop between urban development and educational provision.
ii. Low urbanization with sparse school provision: In rural or sparsely populated areas experiencing stagnant or declining populations (low urbanization), a different approach is needed to ensure efficient use of resources. Here, the goal is to maximize the reach and quality of limited educational infrastructure while gradually building local capacity. Rather than trying to maintain a multitude of small, under-resourced schools, it may be more effective to concentrate resources into a few well-equipped central schools (for example, one per township) that serve a wider region. Students from outlying villages can be supported to attend these central schools through improved transportation (e.g., school bus routes) or boarding options. This consolidation allows even low-density areas to have at least one or two schools with decent facilities and a critical mass of teachers.
At the same time, creative solutions should complement brick-and-mortar investments: for instance, mobile PE units or traveling coaching programs can bring physical education opportunities to remote communities on a scheduled basis. Similarly, deploying specialist PE teachers in a rotating system across clusters of village schools can ensure that all students — even in far-flung areas — regularly receive instruction from qualified instructors. It is also important to monitor demographic trends: if a rural area shows population growth (perhaps due to new industries or returning migrants), officials should be ready to re-open or expand schools there and assign additional teachers to meet the rising demand. Conversely, if certain villages continue to depopulate, resources from those schools might be reallocated to where they can be used more effectively.
Ultimately, for low-urbanization regions, educational planning must be aligned with broader rural development efforts. Investments in roads, electricity, internet, and housing will make it easier to attract teachers to rural schools and encourage families to stay, creating a virtuous cycle. By packaging educational improvements with general rural revitalization, even sparsely populated areas can gradually share in the educational gains seen in more urbanized places. This integrated approach ensures that no region is written off due to low population alone — every child, regardless of location, should have access to a baseline of quality PE resources. The contrast between the two scenarios above highlights a central lesson: aligning school provisioning with the level and pace of urbanization is essential. Whether an area is booming or sparsely populated, synchronizing educational resource planning with development conditions will harness synergies and prevent resource mismatches. In practice, this means education authorities should always be at the planning table alongside economic and urban planners. By doing so, Shaanxi can ensure that future urban growth is inclusive of educational needs, and that rural areas are not left further behind.
5.3 Limitations and future directions
i. Reliance on secondary statistics. Our indicators are compiled from aggregated administrative yearbooks, which may carry coverage gaps, definition changes, publication lags, and possible under-reporting—particularly for PE inputs not directly audited (e.g., equipment compliance beyond minimum checklists). We mitigated these risks by cross-validating overlapping indicators, excluding internally inconsistent entries, winsorizing extremes, and re-estimating all spatial statistics with alternative weightings. Two caveats remain: (i) LL clusters may be slightly overstated if remote districts under-report facilities or teacher counts; (ii) financial intensity may be overstated where procurement is recorded promptly but commissioning/usage lags. These biases would, if anything, reinforce rather than overturn our main conclusions that (a) human resources are the binding constraint and (b) inter-city differences dominate total inequality; if LL areas were better measured, the true gaps could be larger than reported.
ii. Limited qualitative insight into mechanisms. While the spatial and decomposition analyses map where and how much inequality exists, they cannot fully explain why some districts persist as LL clusters or how financial outlays do (or do not) translate into usable capacity. Our interpretation that teacher capacity mediates returns to facilities and equipment rests on theory and comparative evidence rather than first-hand accounts. Future work will adopt a mixed-methods design: (i) semi-structured interviews with PE teachers, headteachers, and local officials in matched HH/LL districts; (ii) school case studies combining facility audits with classroom observation (time-on-task); and (iii) document analysis of budgeting and staffing rules, with cases sampled along LISA quadrants to link qualitative mechanisms to spatial patterns.
iii. Cross-sectional scope. The study focuses on 2024, offering a static snapshot. Longitudinal, multi-year data are needed to track trajectories, evaluate policy impacts, and conduct spatiotemporal analyses (e.g., the widening or narrowing of disparities).
iv. Generalizability. The Shaanxi focus constrains external validity. Applying this framework to other provinces (with different development profiles) and to additional resource domains (e.g., ICT resources, teacher professional development) would test generalizability and extend the model. Cross-province or cross-country comparisons could also distinguish context-specific from general drivers of spatial inequality. Despite these limitations, the present study provides a foundation for future research aimed at more equitable, high-quality PE provision.
6 Conclusion
i. Gradient distribution of resources: The allocation of school PE resources exhibits a clear core–periphery gradient. The center of gravity lies in central Shaanxi with a northeast–southwest orientation, underscoring central Shaanxi’s core status. A majority of districts/counties (66.4%) fall into the middle or lower-middle tiers. While Xi’an and Tongchuan lead on average within central Shaanxi, imbalances persist even inside this core region; most of southern Shaanxi’s districts are lower-middle or low, and northern Shaanxi shows stark contrasts (e.g., Yanchuan County and Hengshan District are relatively well-off versus Suide and Mizhi Counties which are severely deficient). This pattern substantiates H1 (spatial gradient). It indicates that even within core cities, inequitable allocation exists, necessitating fine-grained management and policy guidance to promote balanced development.
ii. Spatial clustering and negative feedback: Spatial clustering exists but overall aggregation is limited. Global Moran’s I indicates only weak positive autocorrelation; local Moran’s I reveals High–High clusters around central Shaanxi’s core cities (e.g., Xi’an, Xianyang) and more prevalent Low–Low clusters in peripheral counties, where neighboring low levels reinforce each other, making proximity alone insufficient to lift allocation. These findings partially support H2. In practical terms, natural spillover from well-resourced areas is not enough to lift poorer areas without deliberate intervention. Geographic proximity to a city does not automatically guarantee resource sharing; policy measures are needed to facilitate the flow of resources and expertise to adjacent low-resource districts.
iii. Dominance of cross-regional and inter-city differences: Inequality decomposition indicates that at the provincial scale, cross-regional contrasts and cross-region overlap (transvariation) jointly account for over ~80% of overall imbalance, while within-region differences are smaller. At the city scale, inter-city differences (~55%) dominate, with cross-city overlap also sizable; within-city disparities are comparatively minor. In essence, gaps between central Shaanxi vs. southern/northern Shaanxi — and especially between the leading city (Xi’an) and other cities — drive the province-wide imbalance. This strongly supports H3 (dominant inequality sources). However, within each city (and within central Shaanxi as a region), resources are somewhat more evenly distributed, lessening their impact on the provincial imbalance. This implies that efforts to achieve balance must focus on leveling up poorer regions and cities rather than solely addressing within-city gaps.
iv. Human resources as the key driver: Human resources predominate as the key driver for most districts: appropriate teacher allocation — achieving reasonable student–teacher ratios and a higher share of full-time PE teachers — is the principal pathway to improve PE provision under constrained resources. Materially, larger per-student field areas often occur in remote, land-abundant yet fiscally constrained locales, which yields lower overall scores; equipment compliance is broadly adequate across districts but remains a shortfall in some remote areas. Financially, per-student equipment expenditure stands out in all districts, indicating a policy tilt toward short-term, tangible “hardware” investments (equipment) at the expense of longer-term infrastructure and teacher development. These results align with H4 (determinants), emphasizing teacher supply as the pivotal lever. In summary, effectively utilizing and improving human resources (teachers) has been crucial for most districts’ PE provision, while material and financial resources are often either underdeveloped (in the case of facilities in remote areas) or skewed toward quick fixes (in the case of spending on equipment). A more balanced approach that also strengthens infrastructure and teacher development is needed to avoid neglecting long-term capacity building.
v. Significance of synergistic effects: Factor detection highlights significant roles for urbanization, PE investment, and demand intensity (student density). Interaction detection shows synergistic effects far exceeding any single factor — particularly combinations of school supply capacity, urbanization, and population mobility, which markedly elevate resource allocation when improved together. This underscores the need for multi-faceted measures (infrastructure + school construction + teacher assignment + funding) rather than single-factor interventions. These interaction patterns further reinforce H4 (determinants and interactions). Therefore, recognizing and leveraging these inter-factor synergies is critical for designing effective strategies to improve the quality and equity of school PE resource allocation.
Beyond policy relevance, the study advances theory in four ways. First, it formalizes an integrated spatial diagnostic—combining GIS mapping, spatial autocorrelation, Dagum Gini decomposition, and GeoDetector—that links observable distributions to decomposed inequality components and factor contributions across scales. Second, by foregrounding school PE within a sports-geography perspective, it connects educational equity and spatial science, extending core–periphery thinking to a seldom-studied domain. Third, the interaction tests operationalize spatially stratified heterogeneity and cumulative advantage: joint improvements in urbanization and school provisioning generate non-linear enhancement effects that single levers cannot achieve. Finally, the empirical prominence of human-capital constraints (teacher supply and configuration) yields a transferable proposition—personnel capacity mediates the returns to financial and material inputs in unequal spatial systems. Together, these contributions bridge methodological, substantive, and systems-theoretic approaches to the spatial allocation of school PE resources.
At the same time, the analysis pinpoints where and why imbalances persist in Shaanxi and provides quantitative evidence to guide targeted action. By identifying disadvantaged districts and their drivers—and documenting strong interaction effects—it supports coordinated packages that link funding, teacher-workforce development, and infrastructure, which outperform single-track measures. The framework is portable to other regions and resource domains (particularly in western China, where similar core–periphery and urban–rural divides prevail). Future work should extend the analysis in time (to capture trends and policy effects) and depth (to incorporate qualitative evidence on implementation and governance), thereby clarifying how specific policy bundles translate into more equitable, higher-quality PE provision.
Data availability statement
Data are included in the article and Supplementary material S1; further inquiries can be directed to the corresponding author.
Ethics statement
The manuscript does not involve human or animal participants and therefore does not require ethics committee approval. All data were obtained either from publicly available government sources or through field surveys conducted by our academic research team, with proper authorization and compliance with institutional standards. All basemaps (Figures 2, 8, 9) used in this study were derived from the Standard Map Service Platform of the Ministry of Natural Resources of the People’s Republic of China (http://bzdt.ch.mnr.gov.cn/), based on the standard map with the approval number GS(2024)0650. The maps are used for academic and non-commercial purposes, and no modifications were made to national boundaries or base layers. The data source complies with national regulations on open map usage and is publicly available with proper attribution.
Author contributions
CX: Conceptualization, Data curation, Writing – original draft. BS: Funding acquisition, Supervision, Writing – review & editing.
Funding
The author(s) declare that financial support was received for the research and/or publication of this article. This work was supported by the National Social Science Foundation of China (China; grant No. 19BTY084); the Philosophy and Social Science Foundation of Shaanxi Province (China; grant No. 2025QN0518); the Scientific Research Program of the Shaanxi Provincial Department of Education (China; grant No. 24JK0111); and the Shaanxi Provincial Sports Bureau General Project (China; grant No. 20250155). The funders provided financial support only and had no role in the study design; data collection, analysis, or interpretation; writing of the manuscript; or the decision to publish.
Conflict of interest
The authors declare that the research was conducted in the absence of any commercial or financial relationships that could be construed as a potential conflict of interest.
Generative AI statement
The authors declare that no Gen AI was used in the creation of this manuscript.
Any alternative text (alt text) provided alongside figures in this article has been generated by Frontiers with the support of artificial intelligence and reasonable efforts have been made to ensure accuracy, including review by the authors wherever possible. If you identify any issues, please contact us.
Publisher’s note
All claims expressed in this article are solely those of the authors and do not necessarily represent those of their affiliated organizations, or those of the publisher, the editors and the reviewers. Any product that may be evaluated in this article, or claim that may be made by its manufacturer, is not guaranteed or endorsed by the publisher.
Supplementary material
The Supplementary material for this article can be found online at: https://www.frontiersin.org/articles/10.3389/feduc.2025.1693461/full#supplementary-material
References
Anselin, L. (1995). Local indicators of spatial association—LISA. Geogr. Anal. 27, 93–115. doi: 10.1111/j.1538-4632.1995.tb00338.x
Armour, K., and Makopoulou, K. (2012). Great expectations: teacher learning in a national professional development programme. Teach. Teach. Educ. 28, 336–346. doi: 10.1016/j.tate.2011.10.006
Bailey, R. (2006). Physical education and sport in schools: a review of benefits and outcomes. J. Sch. Health 76, 397–401. doi: 10.1111/j.1746-1561.2006.00132.x
Bertoni, E., Elacqua, G., and Patrinos, H. A. (2020). Is school funding unequal in Latin America? A cross-country analysis. Washington, DC: Inter-American Development Bank.
Bevans, K., Fitzpatrick, L., Sanchez, B., Riley, A., and Forrest, C. (2010). Physical education resources, class management, and student physical activity levels: a structure–process–outcome approach to evaluating PE effectiveness. Health Educ. Behav. 37, 591–609. doi: 10.1177/1090198110361313
Bos, M. S., and Vegas, E. (2017) Lessons from school finance reforms in Chile and Brazil. Washington, DC: World Bank.
Brewer, C. A., and Pickle, L. (2002). Evaluation of methods for classifying epidemiological data on choropleth maps. Ann. Assoc. Am. Geogr. 92, 662–681. doi: 10.1111/1467-8306.00310
Cheng, X., Li, Y., and Lei, P. (2019). Spatial distribution of school sports resources within a province. J. Physical Educ. 26, 45–53.
Cheong, K. C., and Wu, Y. (2014). Inequality decomposition by factors and groups: a framework and an application to China. China Econ. Rev. 30, 456–470. doi: 10.1016/j.chieco.2014.07.004
Dai, Q., and Xu, C. (2008). Strategies for attracting teachers to rural schools. Educ. Develop. Res. 10, 60–63.
Dagum, C. (1997). A new approach to the decomposition of the Gini income inequality ratio. Empirical Economics 22, 515–531. doi: 10.1007/BF01205777
Darling-Hammond, L. (2000). Teacher quality and student achievement: a review of state policy evidence. Educ. Policy Anal. Arch. 8, 1–50. doi: 10.14507/epaa.v8n1.2000
Earthman, G. I. (2002) School facility conditions and student academic achievement. Los Angeles, CA: UCLA Institute for Democracy, Education, & Access.
Eime, R. M., Young, J. A., Harvey, J. T., Charity, M. J., and Payne, W. R. (2013). A systematic review of the psychological and social benefits of participation in sport for children and adolescents: informing development of a conceptual model of health through sport. International Journal of Behavioral Nutrition and Physical Activity, 10:98. doi: 10.1186/1479-5868-10-98
European Commission EACEA Eurydice (2013). Physical education and sport at School in Europe. Luxembourg: Publications Office of the European Union.
Finn, J. D., and Achilles, C. M. (1999). Tennessee’s class size study: findings, implications, misconceptions. Educ. Eval. Policy Anal. 21, 97–109. doi: 10.3102/01623737021002097
Fisher, K. (2001) Building Better Outcomes: The Impact of School Infrastructure on Student Outcomes and Behaviour. Canberra: Department of Education, Training and Youth Affairs (Schooling Issues Digest). Available online at: https://files.eric.ed.gov/fulltext/ED455672.pdf (Accessed November 12, 2025).
Fotheringham, A. S., and Wong, D. W. (1991). The modifiable areal unit problem in multivariate statistical analysis. Environ. Plan. A 23, 1025–1044. doi: 10.1068/a231025
General Administration of Sport of China (2020). Zhongxiaoxue tiyucailiao sheshi peibei biaozhun national standards for school sports equipment and facilities. Beijing: People’s Sports Publishing House.
General Office of the CPC Central Committee and General Office of the State Council (2023) Opinions on Building a High-Quality and Balanced Basic Public Education Service System (in Chinese). Beijing: Government of China. Available online at: https://www.gov.cn/gongbao/2023/issue_10546/202306/content_6888957.html (Accessed November 12, 2025).
Getis, A., and Ord, J. K. (1992). The analysis of spatial association by use of distance statistics. Geographical Analysis 24, 189–206. doi: 10.1111/j.1538-4632.1992.tb00261.x
Green, K. (2008). Extracurricular sports and lifelong participation. Sport Educ. Soc. 13, 381–398. doi: 10.1080/13573320802444994
Guo, J., and Li, X. (2024). Beyond broad categories: examining spatial nuances in education resource distribution. J. Educ. Dev. 40, 15–23.
Guskey, T. R. (2002). Professional development and teacher change. Teach. Teach. 8, 381–391. doi: 10.1080/135406002100000512
Han, X., and Xu, C. (2023). Spatial equilibrium and coordinated development of school sports resources. J. Xi’an Physic. Educ. Univers. 40, 77–85.
Hanushek, E. A. (1997). Assessing the effects of school resources on student performance: an update. Educ. Eval. Policy Anal. 19, 141–164. doi: 10.3102/01623737019002141
Hardman, K., and Marshall, J. J. (2009). Second worldwide survey of school physical education: final report. Berlin: ICSSPE.
Harrison, F., van Sluijs, E. M. F., Corder, K., and Jones, A. (2016). School grounds and physical activity: Associations at secondary schools, and over the transition from primary to secondary schools. Health & Place 39, 34–42. doi: 10.1016/j.healthplace.2016.02.004
Hu, Y., and Liu, Z. (2020). Spatial stratified heterogeneity in education allocation. Statist. Decis. 36, 23–27.
Ingersoll, R. M. (2001). Teacher turnover and teacher shortages: an organizational analysis. Am. Educ. Res. J. 38, 499–534. doi: 10.3102/00028312038003499
Jenks, G. F. (1967). The data model concept in statistical mapping. Int. Yearb. Cartogr. 7, 186–190.
Jiang, D., Wei, B., and Li, J. (2023). Teacher workforce quality and educational equity in China. Educ. Sci. Res. 34, 45–53.
Lefever, D. W. (1926). Measuring geographic concentration by means of the standard deviational ellipse. Am. J. Sociol. 32, 88–94. doi: 10.1086/214027
Li, X. (2022). Improving the recruitment of new PE teachers in primary and secondary schools. Teach. Manage. 15, 33–35.
Li, J., and Zhou, Y. (2018). A study on compliance with school sports equipment standards. Chin. School Physic. Educ. 36, 72–76.
Liu, X., and Chen, Y. (2020). Recent progress in equalizing school resources across regions. Educ. Econ. 4, 45–50.
Liu, Y., Zhou, X., and Hu, J. (2021). Spatial heterogeneity in compulsory education resource allocation. Statistics Inform. Forum 36, 43–50.
Lou, Y., Ma, H., and Gao, F. (2024). Student–teacher ratios and PE teaching outcomes in rural schools. J. Phys. Educ. 41, 10–18.
Ministry of Education of the People’s Republic of China. (2017) Standards for sports facilities in compulsory education schools. Beijing: Ministry of Education. (in Chinese)
Ministry of Education of the People’s Republic of China (2021). Guidelines on further strengthening school physical education work. Beijing: Ministry of Education.
Moran, P. A. P. (1950). Notes on continuous stochastic phenomena. Biometrika 37, 17–23. doi: 10.1093/biomet/37.1-2.17
Mukhametzyanov, I. (2021). Specific character of objective methods for determining weights of criteria in MCDM problems: Entropy, CRITIC and SD. Decision Making: Applications in Management and Engineering, 4, 76–105. doi: 10.31181/dmame210402076i
National Bureau of Statistics of China. (2024). China City Statistical Yearbook 2024. Beijing: China Statistics Press.
Ni, M. (2019). Bibliometric analysis of research on sports resource allocation in schools. J. Nanjing Inst. Phys. Educ. 18, 1–8.
OECD (2012). Equity and quality in education: Supporting disadvantaged students and schools. Paris: OECD Publishing.
Roux, K. C. J. (2020). The delivery of primary school physical education in South African public schools: The perceptions of educators. South African Journal of Childhood Education, 10:813. doi: 10.4102/sajce.v10i1.813
Sallis, J. F. (2012). Need for built environments that promote physical activity. Br. J. Sports Med. 46, 4–5. doi: 10.1136/bjsports-2012-091337
Shaanxi Provincial Bureau of Statistics. (2024). Shaanxi Statistical Yearbook 2024. Xi’an: China Statistics Press.
Shaanxi Provincial Department of Education (2023). Report on the use of physical education funds in Shaanxi schools. Xi’an: Shaanxi DOE.
Shi, B. (2007). Regional disparities in school sports resources and countermeasures. J. Sports Sci. 28, 19–24.
Slocum, T. A., McMaster, R. B., Kessler, F. C., and Howard, H. H. (2009). Thematic cartography and Geovisualization. 3rd Edn. Upper Saddle River, NJ: Pearson Prentice Hall.
Sun, H., Liu, Y., and Li, M. (2023). Analysis of new PE teacher supply and demand. Contemp. Sports Technol. 13, 33–37.
UNESCO (2015). Quality physical education: Guidelines for policy-makers. Paris: United Nations Educational, Scientific and Cultural Organization.
UNESCO (2024). Global report on physical education 2024. Paris: United Nations Educational, Scientific and Cultural Organization.
United Nations (2020). World social report 2020: Inequality in a rapidly changing world. New York, NY: United Nations.
Wan, G. (2004). Accounting for income inequality in rural China: a regression-based approach. J. Comp. Econ. 32, 348–363. doi: 10.1016/j.jce.2003.11.004
Wang, J.-F., Li, X.-H., and Christakos, G. (2010). Geographical detector-based risk assessment. Acta Geograph. Sin. 65, 1051–1060.
Wang, L., and Liu, J. (2019). Optimal allocation of education expenditure for improving quality. J. Educ. Finance 45, 28–34.
Wang, J.-F., and Xu, C.-D. (2017). Geodetector: principle and prospective. Chin. Geogr. Sci. 27, 847–858. doi: 10.1007/s11769-017-0899-z
Wang, J.-F., Zhang, T.-L., and Fu, B.-J. (2016). A measure of spatial stratified heterogeneity. Ecol. Indic. 67, 250–256. doi: 10.1016/j.ecolind.2016.02.001
Wang, H., Zhang, L., and Sun, H. (2021). Spatio-temporal analysis of compulsory education resources in Liaoning Province. Educ. Econ. 3, 45–53.
WHO (2018). Global action plan on physical activity 2018–2030: More active people for a healthier world. Geneva: World Health Organization.
Wong, D. W., and Lee, J. (2005). Statistical analysis of geographic information. Hoboken, NJ: John Wiley & Sons.
Xia, J., Wang, J., Chen, H., Zhuang, J., Cao, Z., and Chen, P. (2022). An unsupervised machine learning approach to evaluate sports facilities condition in primary school. PLoS One, 17:e0267009. doi: 10.1371/journal.pone.0267009
Xiang, B., Li, W., and Ma, L. (2020). Index of regional education advantage and spatial inequality in China. Educ. Res. 7, 45–53.
Xu, C., and Shi, B. (2025). Spatial characteristics of physical education teacher allocation in basic education: a GIS-based case study of Xi’an, China. Frontiers in Education 10:1649639. doi: 10.3389/feduc.2025.1649639
Yang, N., and Wu, H. (2022). Balanced development of school resources in western China: an assessment. Western China Educ. 34, 60–67.
Yao, X., and Feng, L. (2023). Decomposition of regional inequality in education resources. Stat. Decis. 39, 87–92.
Yao, S., and Zhang, Z. (2001). On regional inequality and diverging clubs in China. J. Comp. Econ. 29, 466–484. doi: 10.1006/jcec.2001.1729
Yuan, X., and Sun, H. (2022). How teacher quality influences educational equity. Contemp. Educ. Forum 5, 12–19.
Yuill, R. S. (1971). The standard deviational ellipse; an updated tool for spatial description. Geografiska Annaler 53, 28–39. doi: 10.1080/04353684.1971.11879337
Zhai, B. (2006). Educational balanced development: theory, target and measuring methods. Educ. Res. 3, 16–21.
Zhang, P., Li, Q., and Hu, L. (2022). Dagum Gini decomposition of education resource inequality in China. Statistics Inform. Forum 37, 88–95.
Zhang, X., and Meng, Q. (2011). Urban–rural comparison of school sports resources in China. J. Phys. Educ. 18, 45–49.
Zhang, X., Zheng, Y., and Chen, L. (2016). Study on improving the full-time PE teacher ratio. China Sport Sci. 36, 38–44.
Zhao, L., Li, Y., and Zhang, R. (2024). Investigation of PE teacher training participation rates. Sports Sci. Res. 45, 66–72.
Zhao, X., Yang, Y., and Luo, Z. (2018). Regional disparities in basic education resources under decentralization. Educ. Res. 9, 73–80.
Zhu, Y. (2025). Qualitative study on the imbalance of school sports resources. Chin. Sport Sci. 45, 10–18.
Keywords: educational equity, spatial inequality, school physical education, resource allocation, Shaanxi Province
Citation: Xu C and Shi B (2025) Spatial inequality and policy implications of school physical education resource allocation: evidence from Shaanxi Province, China. Front. Educ. 10:1693461. doi: 10.3389/feduc.2025.1693461
Edited by:
Nasr Chalghaf, University of Gafsa, TunisiaCopyright © 2025 Xu and Shi. This is an open-access article distributed under the terms of the Creative Commons Attribution License (CC BY). The use, distribution or reproduction in other forums is permitted, provided the original author(s) and the copyright owner(s) are credited and that the original publication in this journal is cited, in accordance with accepted academic practice. No use, distribution or reproduction is permitted which does not comply with these terms.
*Correspondence: Bing Shi, MTgwOTI3MTMxNjVAMTYzLmNvbQ==