 Ranjit Paul1,2Sazol Sarker3†
 Houssam El Aouifi4,5†
 Sadiq Hussain6†Arun K. Baruah7†
 Silvia Gaftandzhieva8*†
- 1North Lakhimpur College (Autonomous), Assam, India
- 2Centre for Computer Science and Application, Dibrugarh University, Dibrugarh, Assam, India
- 3Department of Computer Science & Engineering, Rajshahi University of Engineering & Technology, Rajshahi, Bangladesh
- 4FSJES, Ibn Zohr University, Ait Melloul, Morocco
- 5IRF-SIC Laboratory, Ibn Zohr University, Agadir, Morocco
- 6Examination Branch, Dibrugarh University, Dibrugarh, Assam, India
- 7Department of Mathematics, Dibrugarh University, Dibrugarh, Assam
- 8Faculty of Mathematics and Informatics, University of Plovdiv Paisii Hilendarski, Plovdiv, Bulgaria
Modern higher education institutions (HEIs) face significant challenges in identifying, students who are at risk of low academic performance, at an early stage, while maintaining educational quality, and improving graduation rates. Predicting student success and dropout is crucial for institutional decision-making, as it helps formulate effective strategies, allocate resources efficiently, and improve student support. This study explores machine learning (ML) models for predicting student success, focusing on predicting first-semester CGPA (Cumulative Grade Point Average) and identifying at-risk students. It aims to compare various classifiers and regression models, identify the most effective techniques, and provide explainable insights into the decision-making process using Explainable AI (XAI). The results suggest that Logistic Regression outperforms other models in predicting at-risk students with high precision and recall, offering a reliable tool for early interventions.
1 Introduction
In the current competitive academic world, the image of an academic institution relies on the success of its students in academics and on time graduation. As such, the governing and regulating bodies of every institution do their utmost to make sure that the trends of student performance are monitored to maintain stable academic development and institutional excellence. The growing focus on university rankings and success rates among students has provided a powerful push to determine at-risk or potential dropout students during the first stage of their academic achievements as the reputation of the institution, its financial support, and trustworthiness of stakeholders are all interconnected with the performance of the student (Kukkar et al., 2024).
As education continues to become digitalized, massive volumes of data about the students (including attendance records and grades, as well as the participation in online learning platforms) can be easily accessed. Such an information avalanche combined with the fast progress in machine learning has rendered machine learning (ML) an essential instrument in scholarly analytics. Comparing to traditional methods, ML models can process and analyze large volumes of data to reveal hidden patterns, assess trends of academic performance, and make predictions useful to take action, and more precisely. The cumulative grade point averages (CGPA) of students can be estimated using such models, those at risk of academic failure can be identified, and the academic or behavioral features that may influence the success or failure of students (Kukkar et al., 2023a).
Nevertheless, although the ML-based models have been very successful at prediction, they are not very interpretable due to their black-box nature, which questions the issue of transparency and accountability in decisions. This is especially important in the educational environment, where the institutional level policies and interventions directly influence the academic courses of students. To solve this difficulty, eXplainable Artificial Intelligence (XAI) methods have appeared as effective solutions to overcome this bottleneck between performance predictability and interpretability. SHapley Additive exPlanations (SHAP) and Local Interpretable Model-agnostic Explanations (LIME) are XAI techniques that allow the stakeholders to interpret the effects that separate features have on the predictions made by the model, the importance of variables in a relative sense, and the critical factors behind the decision process in an intuitive and interpretable way (Kalita et al., 2025a).
This is beneficial to both learners and institutional administrators since dropping out students are identified at a very early stage. By identifying it early, personalized mentoring, additional academic services, and motivational programs are implemented in time, which leads to better retention and performance scores (Kukkar et al., 2023b). In addition, the interpretability that is offered by XAI can indicate important performance ranges, important subject relationships, and transition points at which the academic performance of students changes between success and risk. As an illustration, it can be seen that the performance in Subject1 and Subject2, or the percentage of X and the percentage of XII is a good predictor of academic performance in general and hence interventions in certain groups of students can be directed by XAI.
Here, the combination of ML and XAI offers a twofold benefit, such as predictive accuracy and explainable interpretability, which will enable higher education institutions (HEIs) to make evidence-based, explainable, and ethical decisions. These insights, besides assisting the administrators and teachers in developing effective strategies to support academic efforts, can also enable the students to be self-reflective with regard to their learning patterns in order to enhance their performance.
The current research, thus, seeks to forecast and explain the performance of students in academic courses based on different ML models that have been augmented with XAI clarification. It is aimed at the determination of the major academic signs, the forecast of students who are likely to leave school or achieve poor performance, and the visualization of influence determinants in the form of understandable diagrams. It includes predictive modeling and explainable analytics to create a transparent, data-driven framework, which is responsive to the previous literature as it presents normalized and explainable academic performance trends which are actionable by teachers, policy-makers, and both students and teachers.
1.1 Related work
Modern HEIs face challenges related to identifying students with low academic achievement in the early stages of education (Jović et al., 2017), providing high-quality education (Gaftandzhieva et al., 2022), delaying graduation (Jović et al., 2017), developing strategies to increase student success (Ahmed, 2024). Student success and a high percentage of timely graduates are important indicators for measuring the quality of the educational process and contribute to achieving a high rank in the university rankings, which is often a determining factor when prospective students choose HEI. Some researchers define student performance as grade point average (GPA) or final grades, while others consider a student's academic performance as an opportunity to achieve a long-term goal, such as graduation or potential for successful implementation in the labor market (Jović et al., 2017).
Predicting student success is beneficial to various stakeholder groups. Because high academic performance improves a university's ranking and increases students' opportunities for successful professional development, a highly interested group is the HEI governing body. Predicting student success allows governing bodies to obtain valuable information about students' potential outcomes (Al Shibli et al., 2022) and to formulate solutions to improve students' academic performance (Gaftandzhieva et al., 2022), to develop effective plans and strategies for student support (Ahmed, 2024; Ofori et al., 2020; Bujang et al., 2021a) and to allocate resources optimally (Ahmed, 2024), which will lead to an increase in the percentage of graduates. Early prediction of student performance helps teachers identify low-achieving students before the final exam based on current scores and actions taken (Ofori et al., 2020; Paddalwar et al., 2022; Masangu et al., 2021; Gaftandzhieva et al., 2022; Al Shibli et al., 2022; Ujkani et al., 2024), and take measures to improve student performance. Such predictions provide timely insights to teachers and encourage them to intervene and take measures that reduce the percentage of low-performing students and improve their performance. Predictions based on the Learning Management System (LMS) data allow teachers to identify which learning resources or activities impact the final grade (Gaftandzhieva et al., 2022). Such measures can include providing additional resources and support to students who are not achieving well and updating teaching materials. Predicting grades is also beneficial for students, as it gives meaningful feedback (Ofori et al., 2020) and helps them make plans to achieve their goals (Gaftandzhieva et al., 2022). Predicting success is a difficult task, the solution of which must consider the various factors that influence success (Nachouki et al., 2023). By understanding the factors which affect student performance, HEI leaders can develop strategies to improve learning outcomes (Airlangga, 2024). Identifying the factors that influence success allows teachers to take measures that will improve students' academic achievements and increase the effectiveness of their teaching. Important factors for increasing success include institutional support, supervisory practices, self-management skills, student attendance and class participation (Nguyen and Nguyen, 2023), and socio-economic and demographic factors (Airlangga, 2024). The proposed models for predicting success are used in building systems for predicting students at risk and dropout rates, early warning, and personalized recommendation systems to improve the student learning experience (Alamri and Alharbi, 2021).
Due to the many benefits for stakeholders, in recent years, predicting student grades has been of increasing interest to HEIs (Gaftandzhieva et al., 2022). As a result of the digital transformation processes, HEIs accumulate large amounts of data which facilitate the implementation of tools for predicting student success. HEIs management is aware of the potential of the collected data for improving the quality of education, student retention and success rate, which leads to an increase in interest in the use of data-driven approaches. Machine learning algorithms (such as Logistic regression - LR, Support Vector Machines - SVM, Random Forest - RF, Perceptron classification - PC, Linear Discriminant Analysis - LDA, Gradient boosting - GB, Naive Bayes - NB, Neural network - NN, Decision Trees - DT, K-nearest neighbor - kNN, Stacking Regressor - SR, XGBoost, LightGBM) stand out as a powerful technique for predicting the student's academic performance (Nguyen and Nguyen, 2023), which provides insights into how different factors interact to influence learning outcomes (Airlangga, 2024). It is important to note that to achieve high reliability and accuracy of predictions, prediction must be performed on a sufficiently large data set using different machine learning algorithms and multiple parameters must be investigated. The algorithm's efficiency is assessed through performance evaluation metrics encompassing accuracy, precision, recall, F-measure, Mean Absolute Error, Root Mean Squared Error, R-squared, Mean Squared Log Error and Mean Absolute Percentage, and cross-validation techniques are used for validation. A frequently used approach to overcome an unbalanced data set with multiple classifications and avoid model re-fitting is the application of the Synthetic Minority Oversampling Technique - SMOTE and FS (Bujang et al., 2021b; Gaftandzhieva et al., 2022; Arévalo Cordovilla and Peña Carrera, 2024). Based on the analyzed studies (see Table 1), it can be concluded that most models focus on predicting student performance based on a limited set of characteristics, without considering mechanisms for improving student learning outcomes. RF has shown strong predictive performance in most of the studies analyzed, but its complexity and reduced interpretability may pose challenges in its practical application in educational settings. On the other hand, according to some researchers (Arévalo Cordovilla and Peña Carrera, 2024), the simplicity and efficiency of LR may facilitate the timely identification of students at risk, allowing the implementation of personalized interventions that can improve academic performance and retention rates. Although adequate, NN and SVM outperform simpler models in a few studies, suggesting that increased model complexity does not necessarily lead to better predictive accuracy. Table 1 presents the number of students in the dataset, the attributes analyzed, the algorithms used, the best-accuracy scores, the results, and the limitations of the studies reviewed.
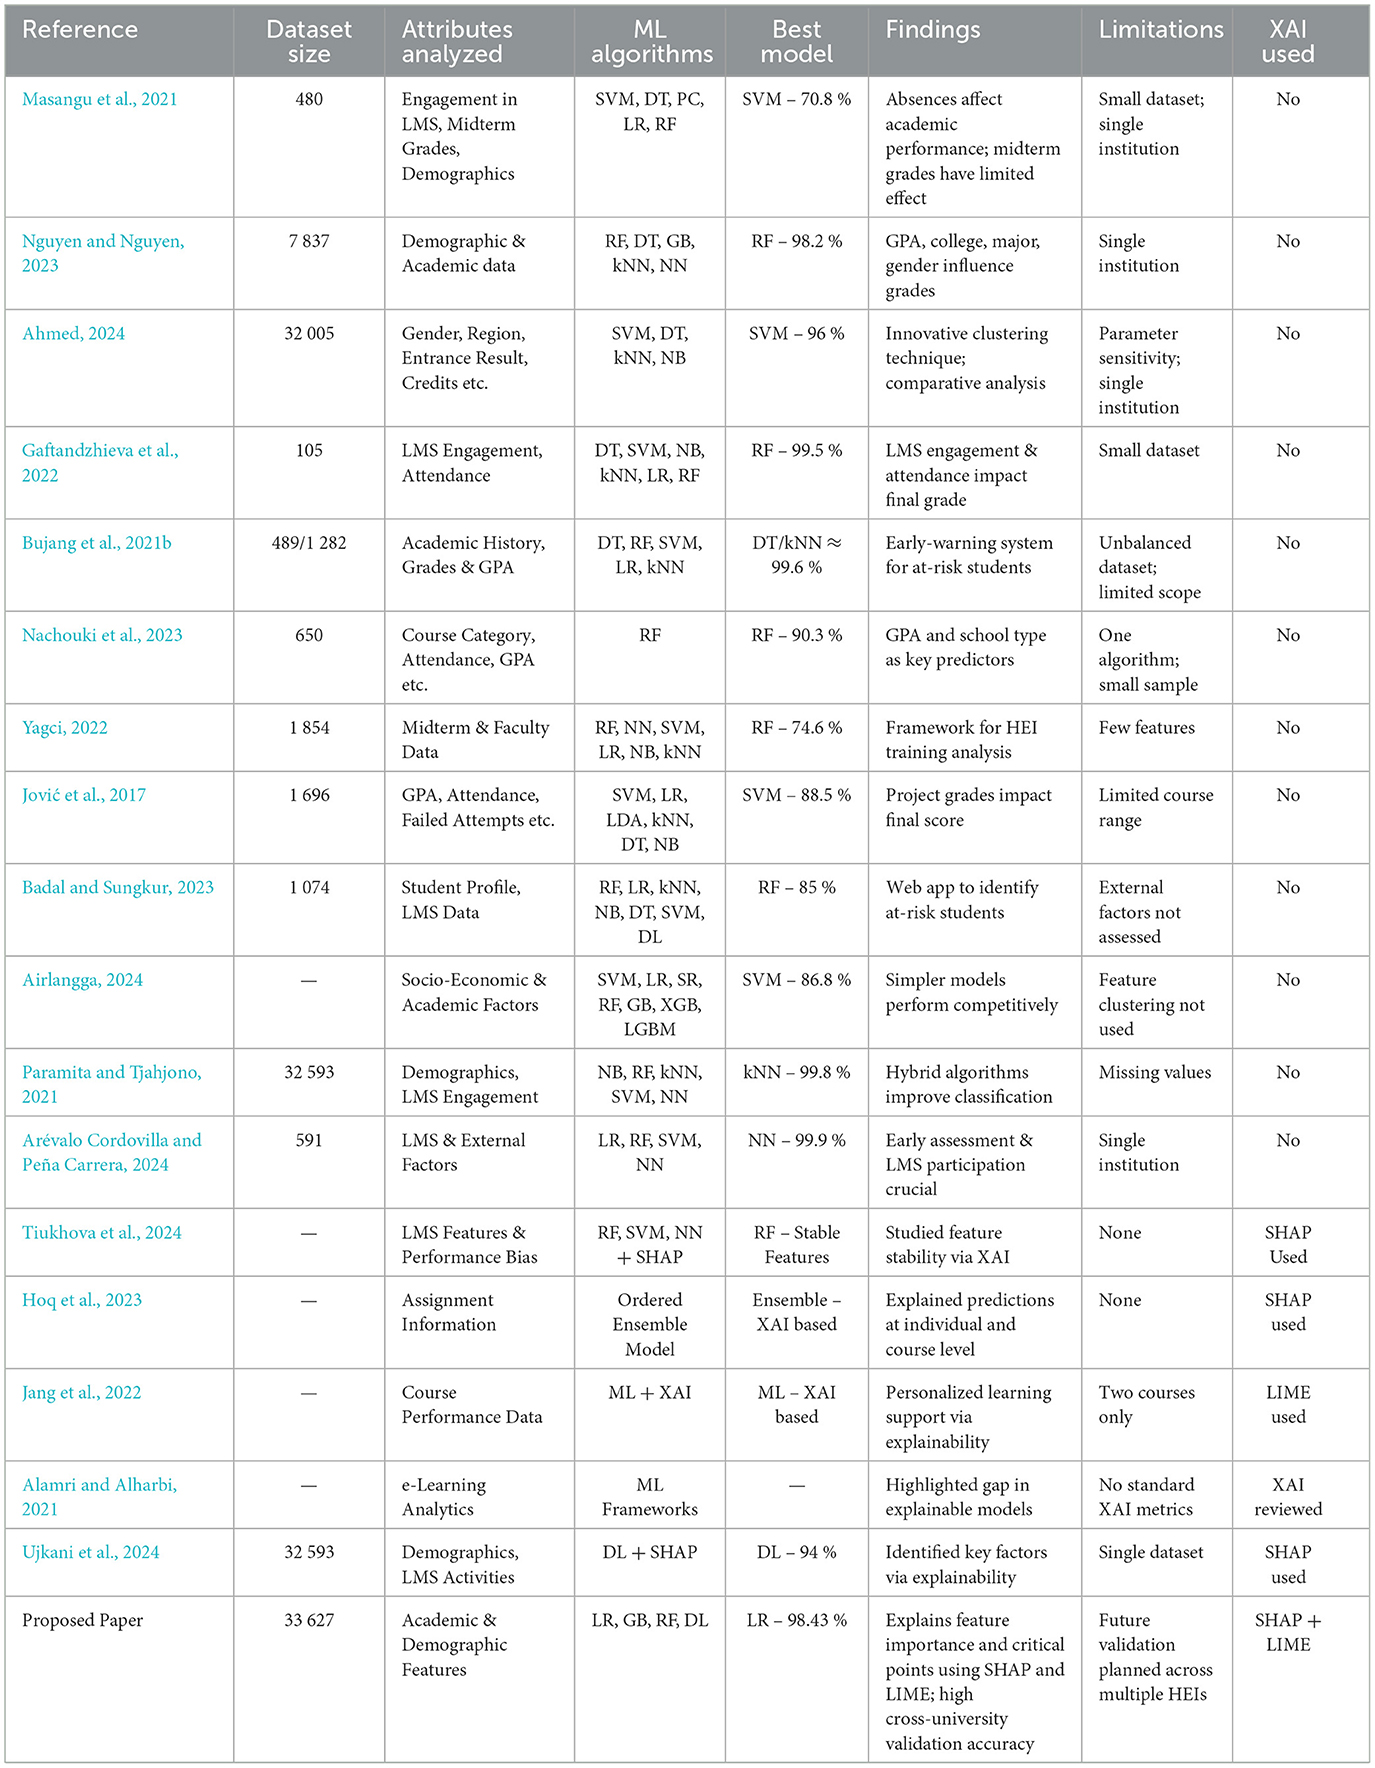
Table 1. Findings and knowledge gap of different studies related to educational datasets.
HEIs leaders and teachers need decision-making support to consistently influence the learning process and keep students motivated, engaged, and successful (Tiukhova et al., 2024). Machine learning algorithms, when applied to large datasets, demonstrate the ability to accurately evaluate the risk of academic failure among students. When it comes to educational data mining, high accuracy is not the only critical factor for the success of such models. It is crucial that stakeholders trust the model and that the reasons for these predictions are explainable (Alsubhi et al., 2023; Alamri and Alharbi, 2021). However, the complexity of these algorithms often encapsulates their decision-making processes within a “black box,” making it difficult to elucidate the specific reasoning underlying their predictions (Ujkani et al., 2024). In recent years, eXplainable Artificial Intelligence (XAI) has emerged as a popular approach to interpreting and explaining the reasons for the decisions of machine learning algorithms (Hoq et al., 2023). XAI utilizes approaches that enhance the clarity of AI models, allowing stakeholders to understand the reasoning behind a model's predictions, rather than merely its accuracy (Ujkani et al., 2024). This allows all stakeholder groups (students, faculty, and administrators) to understand the factors behind the predicted results and tailor their interventions to specific problems. The use of explainable models is also useful for AI system designers, as it allows them to ensure the quality of the trained model if they can actually “look” inside it and verify the correctness of the inferred models (Alamri and Alharbi, 2021). Using XAI to interpret predictions of student achievement is a relatively new but rapidly developing area of research. Tiukhova et al. (2024) propose an approach to apply XAI to study the stability of models for predicting student success. The researchers use traditional techniques, such as concept bias and performance bias, to examine the stability of models for predicting student success over time, the Shapley Additive explanations in a new way to explore the stability of the importance rankings of extracted features generated for these models, and produce new insights that arise from stable features across cohorts, allowing the educator to provide instructional advice. The results contribute to education research in general and expand the field of Learning Analytics by increasing the interpretability and explainability of prediction algorithms and ensuring their applicability in a changing context. Özkurt (2024) emphasizes the need for rigorous scrutiny in outlining the determinants of student achievement, advocating for continued research to inform evidence-based educational policies. He proposes an approach to explaining the predictions of machine learning algorithms by applying the SHAP and LIME methodologies, shedding light on the complex mechanisms driving the predicted outcomes. The promising results may contribute to designing data-driven decision-making processes and more effectively planned interventions to improve student success. Hoq et al. (2023) developed an explainable ordered ensemble model to predict student final grades based on assignment information and explain the predictions made by the model using the XAI SHapley (SHAP) algorithm. Explanations of the model's decisions are presented at two levels – individual for each student and at the course level. This explanation can help students and teachers understand the model's predictions and make them reliable. The proposed model can help explain students' problem-solving behavior, allowing for effective intervention and adaptive support for students. Ujkani et al. (2024) offer practical insights for educators, policymakers and administrators for enhancing the quality and effectiveness of online learning. They use machine learning and deep learning techniques to predict student success and the SHAP technique to predict student grades, identify at-risk students, and key factors contributing to success or failure. The dataset includes data on 32,593 students - demographic data, course enrollments, assessment results, and LMS activities. In contrast to traditional statistical approaches, which investigate associations among variables. The proposed approach employs advanced deep learning techniques to uncover patterns and insights, providing a deeper analysis of the factors that affect student success and facilitating targeted interventions to promote their achievement. The results indicate that student engagement and adherence to registration deadlines are key factors influencing performance. The personalized models deliver an accuracy of up to 94% in the designated tasks, outperforming conventional approaches.
In Alsubhi et al. (2023), Alsubhi et al. use machine learning algorithms to predict the characteristics that contribute to a student's performance. They examine the efficacy of WB and BB categorization models in predicting academic grades and propose a CORELS model that outperforms them. In BB classification models, a decision (or grade) is often predicted with a limited explanation of why that decision was made, whereas, in WB classification models, the decisions made are fully interpreted by stakeholders. The results show that these BB models perform similarly in accuracy and recall whether the classifiers were trying to predict an A or an F grade. The findings provide important information about the most reliable models for predicting grades within a certain range, which could provide insights for HEIs seeking to improve their grading systems—e.g. the usefulness of RF in predicting a C grade and SVM for a D grade. These distinctions offer useful information for institutions seeking to improve their prediction accuracy for certain grades. The results can be directly applied to improve grading prediction systems in similar educational situations, using actual educational data as the basis for analysis. In Jang et al. (2022), the authors present an innovative approach to forecasting student performance using machine learning and XAI techniques. Using XAI, a method is proposed to provide information to teachers to help interpret the classification results and visually present information that can help each student. The proposed method can support personalized learning by expounding the classification results of at-risk students using the XAI technique. A drawback of the study is that the experiments were conducted with data from two courses in the same subject area. Alamri and Alharbi (2021) examine research gaps in the field of explainable models for student performance, highlighting a lack of studies that incorporate state-of-the-art explainable methods and utilize rich predictors, such as e-learning analytics, to forecast student performance. They also point out that no standardized metrics have been adopted to evaluate model explainability, making it challenging to compare the explainability levels of different models.
The point of observation highlights a research gap of critical importance to the existing literature of educational data-mining from the Table 1. Although earlier studies have mostly focused on predictive accuracy, they do not always address the question as to why models derive their conclusions, which restricts their applicability in the practical academic decision-making process. The use of eXplainable Artificial Intelligence (XAI) methods like SHAP and LIME offers insight into the model reasoning and enables educators, administrators, and policymakers to understand the importance of features, detect bias and make data-driven interventions with confidence. The proposed study will address this gap since it will consider XAI in high-accuracy models, so the predictions are not just accurate but understandable. Such integration will enable institutions of higher learning to make predictive analytics a non-black-box process and turn it into an action-oriented, credible, and ethically feasible decision-support mechanism.
1.2 Research objectives
ML models can help analyzing the educational data of the students. Therefore, exploring various aspects of academic performance can provide crucial knowledge about at-risk of failure students. Additionally, an efficient ML model can be selected to distinguish at-risk of dropout students' group from “not at risk” students. Moreover, XAI may provide important insights such as feature importance behind best ML model's decision making, feature specific critical points, sharp transitional points of academic performance and so on. In brief, the four research objectives of this study are as follows:
• Objective 1: To predict the first semester CGPA using regression so that the students at risk may be provided more attention and extra classes to cope up.
• Objective 2: To predict the at-risk students using classification so that the teachers and policy makers can stop the possible dropout of these students.
• Objective 3: To find the best classifiers among different classifiers to predict the at-risk students that may be applied to other similar datasets of different Universities.
• Objective 4: To explain the results using SHAPASH to demonstrate the important features so that the stakeholders come to know how the results are achieved related to XAI.
2 Data mining techniques
2.1 Random forest
In 2001, Breiman introduced random forests (Breiman, 2001), which enhance the bagging algorithm by adding an additional level of randomness. Like bagging, random forests generate each tree using a different bootstrap sample of the data, but the key difference lies in the way the trees are built. Standard trees use the best predictor to split each node, while random forests randomly select a subset of predictors for each node and choose the best split within that subset. Though this approach might seem counterintuitive, it has shown to be highly effective, outpacing other classifiers, including discriminant analysis, support vector machines, and neural networks, and is robust to overfitting.
The random forests algorithm is as follows (Liaw and Wiener, 2002):
• Generate ntree bootstrap samples from the original dataset.
• Grow an unpruned decision tree for each bootstrap sample, ensuring that at every node, a random selection of mtry predictors is considered for the split, rather than using all predictors.
• For new data prediction, combine the outputs of the ntree trees, applying majority voting for classification tasks and averaging for regression.
The following method can be used to estimate the error rate based on the training data:
• For each bootstrap iteration, use the tree trained on the bootstrap sample to predict the data excluded from the sample, known as the “out-of-bag” (OOB) data.
• Aggregate the OOB predictions, considering that each data point is out-of-bag approximately 36% of the time, and compute the error rate, known as the OOB estimate of error rate.
2.2 Naive Bayes
Naive Bayes is a widely used probabilistic algorithm in machine learning, primarily for classification tasks (Duda and Hart, 1973). It utilizes Bayes' theorem to estimate the probability that a given instance belongs to a specific class, based on its observed features. A key characteristic of Naive Bayes is its “naive” assumption of conditional independence, which means that it assumes each feature is independent of the others given the class label (Friedman et al., 1997). Despite this simplifying assumption, Naive Bayes often performs well in real-world applications and provides strong results even when the independence assumption is not perfectly accurate.
The advantages of Naive Bayes (Meiriza et al., 2020) include its simplicity in terms of understanding and design, making it an accessible algorithm for many users. Additionally, it is a fast algorithm for generating class predictions when compared to other classification algorithms and can be efficiently trained on small datasets.
2.3 Decision tree (DT)
DT-based supervised learning is a technique that can be viewed as a hierarchical process, where a data domain (node) is recursively divided into subdomains to maximize information gain. The goal of this process is to enhance classification accuracy by creating subdomains that are more straightforward to classify. The optimization algorithm aims to identify the best split that maximizes information gain, reflecting the ease of classification within the resulting subdomains. The main objective of supervised learning using decision trees is to classify data accurately (Suthaharan, 2016). DTs are used for various tasks, including variable selection, predictive modeling, and handling missing values (Song and Ying, 2015).
A DT consists of nodes and branches. Nodes are categorized into root nodes (representing the entire dataset), internal nodes (representing decision points), and leaf nodes (representing final outcomes). Branches define the paths between nodes and can be expressed as “if-then” rules.
The construction of a decision tree involves three main steps (Song and Ying, 2015):
• Splitting: The dataset is divided into subsets using relevant input variables to create nodes with higher purity, which is a stronger relationship between input features and the target variable.
• Stopping: To prevent overfitting, the model's complexity is controlled by applying stopping rules, like restricting the number of records per leaf, setting a minimum number of records before splitting, or limiting the tree depth.
• Pruning: After the tree is grown, pruning removes nodes that do not significantly contribute to improving the model's precision, reducing overfitting.
2.4 K-nearest neighbor
K-NN algorithm is a non-parametric classification method, also known as instance-based or lazy learning. It assigns a class label to a data sample based on the majority class of its nearest neighbors. This method has been proven effective in various applications, including predicting student performance in big data environments (Nagesh et al., 2017). K-NN works by predicting the label of a test data point using the majority class of its k nearest neighbors in the feature space. However, there are two key challenges in K-NN classification: choosing the appropriate similarity measure and deciding the optimal value of k (Zhang et al., 2017). One of the main benefits of K-NN is its capability to handle big datasets that may not fit in memory, addressing scalability issues common to many other data mining methods. K-NN uses Euclidean distance to measure similarities, making it simple to implement without prior knowledge of data distribution. Additionally, K-NN provides faster and more accurate classifications, making it an efficient choice for generating recommendations (Adeniyi et al., 2016).
2.5 Artificial neural networks (ANN)
ANN is a machine learning model inspired by the human brain's network of neurons which consist of interconnected artificial neurons, each represented by a node, with links between them that carry signals prompting the activation of other neurons. ANNs are trained on historical data to learn patterns and make predictions. ANNs are structured in layers: the input layer receives signals, which pass through hidden layers before reaching the output layer. The network contains numerous neural units and connections, with signals represented by real numbers between 0 and 1. Each neuron has a threshold function that determines whether signals will propagate based on their strength. In the training phase, the network updates its connection weights through back-propagation, continuously comparing its predictions to the actual outputs (Okewu et al., 2021). Neural networks are particularly effective in extracting meaningful insights from complex data by identifying trends and detecting risky patterns. Their ability to discover hidden interactions among various predictors makes them especially useful in applications like Educational Data Mining. This capability allows ANNs to find complex relationships within educational data, contributing to the understanding and improvement of educational systems (Gray et al., 2014).
2.6 Gradient boosting
Gradient Boosting Machines (GBMs) work by gradually adding new models that refine the accuracy of predictions. Each new model is trained to correct the errors made by the previous models, gradually improving the general performance of the model. The main idea behind this is to build new base-learners that closely follow the negative gradient of the loss function of the entire ensemble, allowing each new model to correct the errors of the previous ones and improve overall performance. While the loss function can be chosen arbitrarily, using squared-error loss results in consecutive error-fitting. Researchers have the flexibility to choose or create a custom loss function for specific tasks that makes GBMs efficient to various data-driven problems. This flexibility, joined with the ease of boosting algorithms, makes GBMs simple to implement and experiment. GBMs have showed significant success in practical applications and various machine learning challenges (Natekin and Knoll, 2013).
Boosting algorithms work by combining weak learners—models that perform slightly better than random guessing—into a strong learner through an iterative process. Gradient boosting, a type of boosting algorithm, is specifically designed for regression tasks (Bentéjac et al., 2021).
2.7 Deep learning
Traditional machine learning methods required manual feature extraction from raw data, requiring domain expertise. Whereas, deep learning uses representation learning to automatically discover features from raw data through multiple layers of transformations. Each layer gradually learns more abstract representations. Due to its minimal reliance on manual work and its ability to scale with increased computation and data, deep learning is expected to continue advancing, with new algorithms and architectures accelerating its progress (LeCun et al., 2015). In a standard NN, units are connected and produce activations based on inputs and connections, with learning focused on adjusting weights to produce the desired output. Deep learning addresses the challenge of credit assignment by working across multiple stages in the network, where each stage changes the activations in a non-linear way to improve performance (Schmidhuber, 2015).
2.8 Multilayer perceptron (MLP)
A Multilayer Perceptron (MLP) is a type of ANN designed to simulate the way the human brain processes information. The key feature of ANNs, including MLPs, is their ability to learn and generalize from past experiences, making them effective for modeling complex, non-linear relationships without needing previous assumptions.
The MLP consists of three main components:
• Input Layer: The layer that receives the input data (independent variables).
• Hidden Layers: Layers between the input and output layers where the data is processed through neurons.
• Output Layer: The layer that produces the final output (dependent variables).
The MLP works through a process of forward and backward propagation:
• Step 1: Initially, random weights are assigned to the connections between neurons.
• Step 2: The input data is passed through the network, with each neuron in the hidden layers using an activation function (typically the sigmoid or logistic function) to produce output values.
• Step 3: The error (difference between predicted and actual outputs) is calculated and propagated backward, adjusting the weights and biases to minimize this error.
• Step 4: The process is repeated—forward propagation followed by backpropagation—until the overall error is minimized.
Through this iterative process, the MLP learns to adjust its weights and biases, improving its ability to make accurate predictions. This training process, known as backpropagation, is central to the MLP's ability to learn from data (Depren et al., 2017).
2.9 Logistic regression
Logistic regression is a statistical method used to model binary outcomes (e.g., yes/no, success/failure). Unlike linear regression, which predicts continuous outcomes, logistic regression predicts the probability of an event occurring by using a logit transformation to ensure that the predicted values are bounded between 0 and 1. This transformation is essential because the outcome in logistic regression represents the probability of an event, which cannot exceed these bounds (Stoltzfus, 2011).
The equation for logistic regression is:
Where
• p is the probability of the outcome occurring (e.g., success).
• X1,X2,, …, Xk are the independent variables
• β1,β2,, …, βk are the coefficients estimated by the model.
The transformation of the logit function ensures that the predicted probabilities remain between 0 and 1, making it suitable for binary outcomes.
3 Experimental methodology
The methodology of this study which is presented in Figure 1a begins with dataset preparation, which involves generating or acquiring raw data from various sources, followed by preprocessing steps such as cleaning, handling missing values, normalization, and encoding. After preprocessing, class labels or target values are assigned to the dataset. Once prepared, the dataset is loaded into the system for model training and testing. The next phase focuses on addressing specific objectives by training and testing a regression or classification model. This involves splitting the dataset into training and testing subsets, ensuring a fair evaluation of model performance. The performance of the model is assessed using relevant evaluation metrics, such as accuracy, precision, recall, and F1-score for classification tasks, or RMSE and squared correlation for regression tasks. Subsequently, a comparative analysis is conducted to gain insights by comparing different models or configurations. Finally, based on the performance results, the most suitable regression or classification model is selected to achieve the best outcomes for the research objectives. This systematic approach ensures a reliable and reproducible process for model development and evaluation.
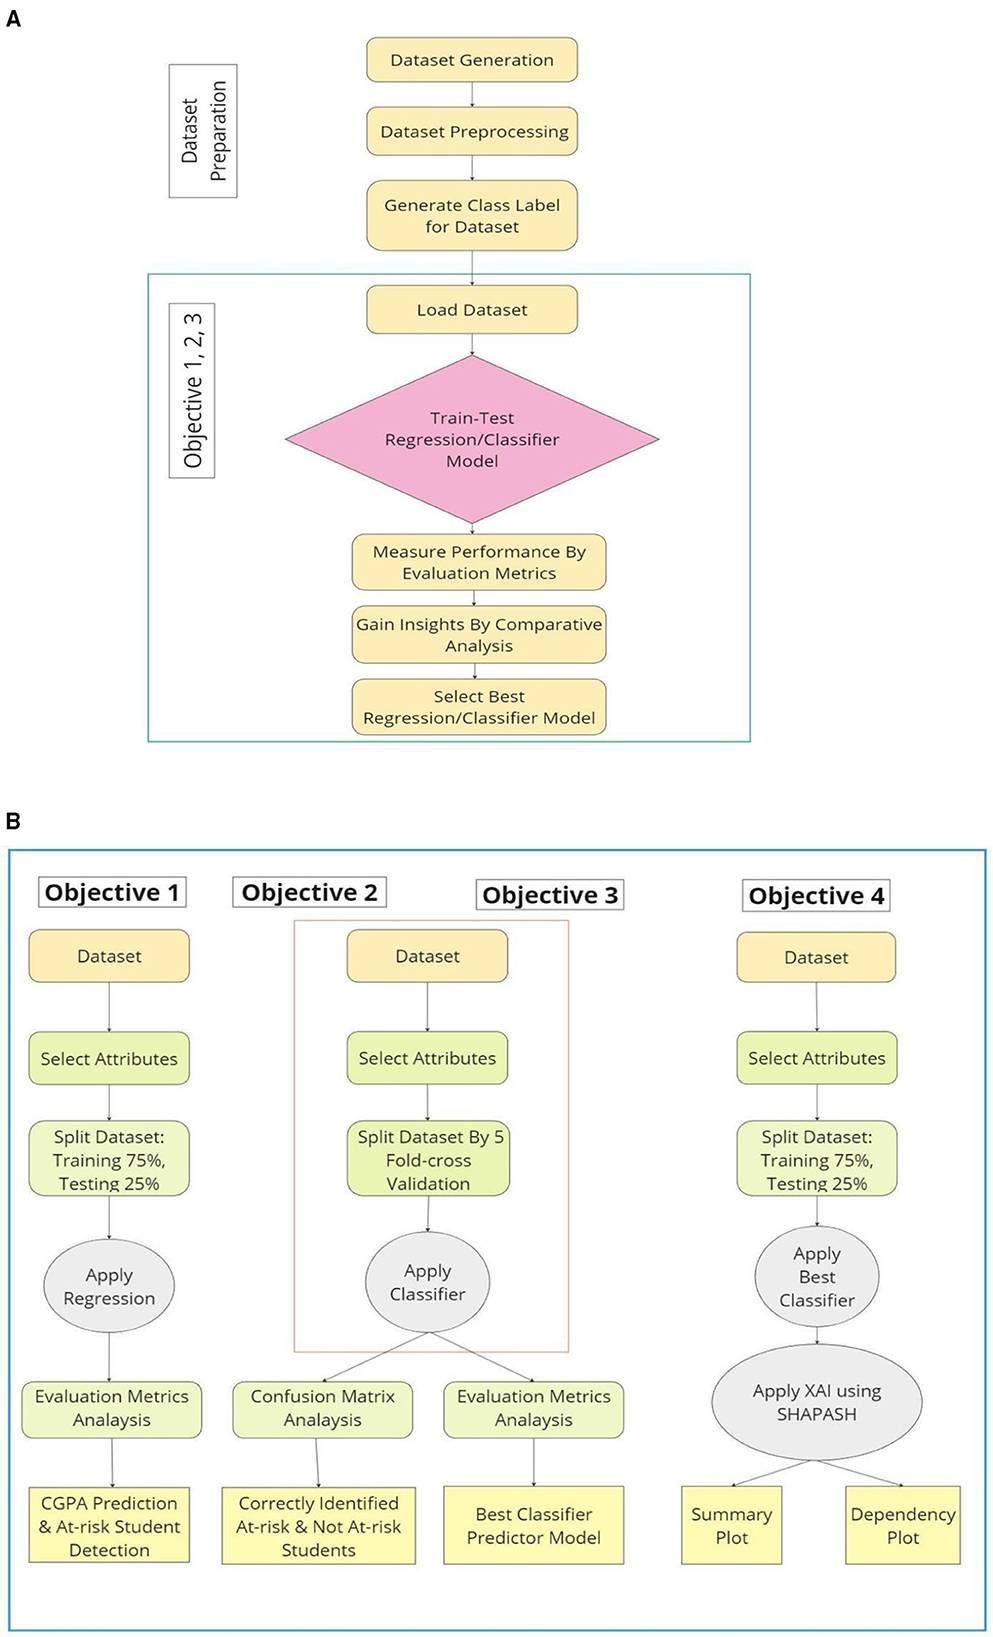
Figure 1. (a) Dataset preparation and block diagram of 1st, 2nd and 3rd research objective. (b). Research objectives (in details).
The detailed methodology depicted in Figure 1b is structured to address four specific objectives using a systematic machine-learning approach. For 1st research objective, the process begins with dataset selection and attribute extraction, followed by splitting the dataset into 75% training and 25% testing subsets. Then, a regression model is applied to predict CGPA, and performance is evaluated using metrics such as RMSE, AE and squared correlation to identify at-risk students. Besides, 2nd research objective focuses on classifying at-risk and not-at-risk students by applying a classifier after selecting relevant attributes. The dataset is split using 5-fold cross-validation to ensure robustness, and the model's performance is analyzed using a confusion matrix. In addition, 3rd research objective aims to determine the best classifier by continuing with the same attribute selection and cross-validation process. Various classifiers are tested, and their performance is evaluated using metrics like accuracy, precision, recall, and F1-score to identify the most effective model. Finally, 4th research objective integrates XAI using SHAPASH, an open-source Python library built on top of SHAP (SHapley Additive exPlanations) to enhance model transparency and describe interpretation of important insights about academic performance. After selecting the best classifier, the dataset is split into training and testing sets, and SHAPASH is applied to generate summary and dependency plots (Kalita et al., 2025b), providing insights into feature importance and model decisions. This methodology ensures accurate predictions, robust classification, and enhanced model interpretability, facilitating better decision-making and providing useful information about academic performance of students to the institutional authorities.
3.1 Dataset description
The dataset belongs to the students of the affiliated colleges under Dibrugarh University, Assam, India. Table 2 describes the 39 attributes in the dataset. There are 33,627 records in the dataset. The dataset comprised of students' data who got admitted in the year 2023. Besides, Figures 2a, b present histogram plots of some selective attributes of the dataset showing the data distribution.
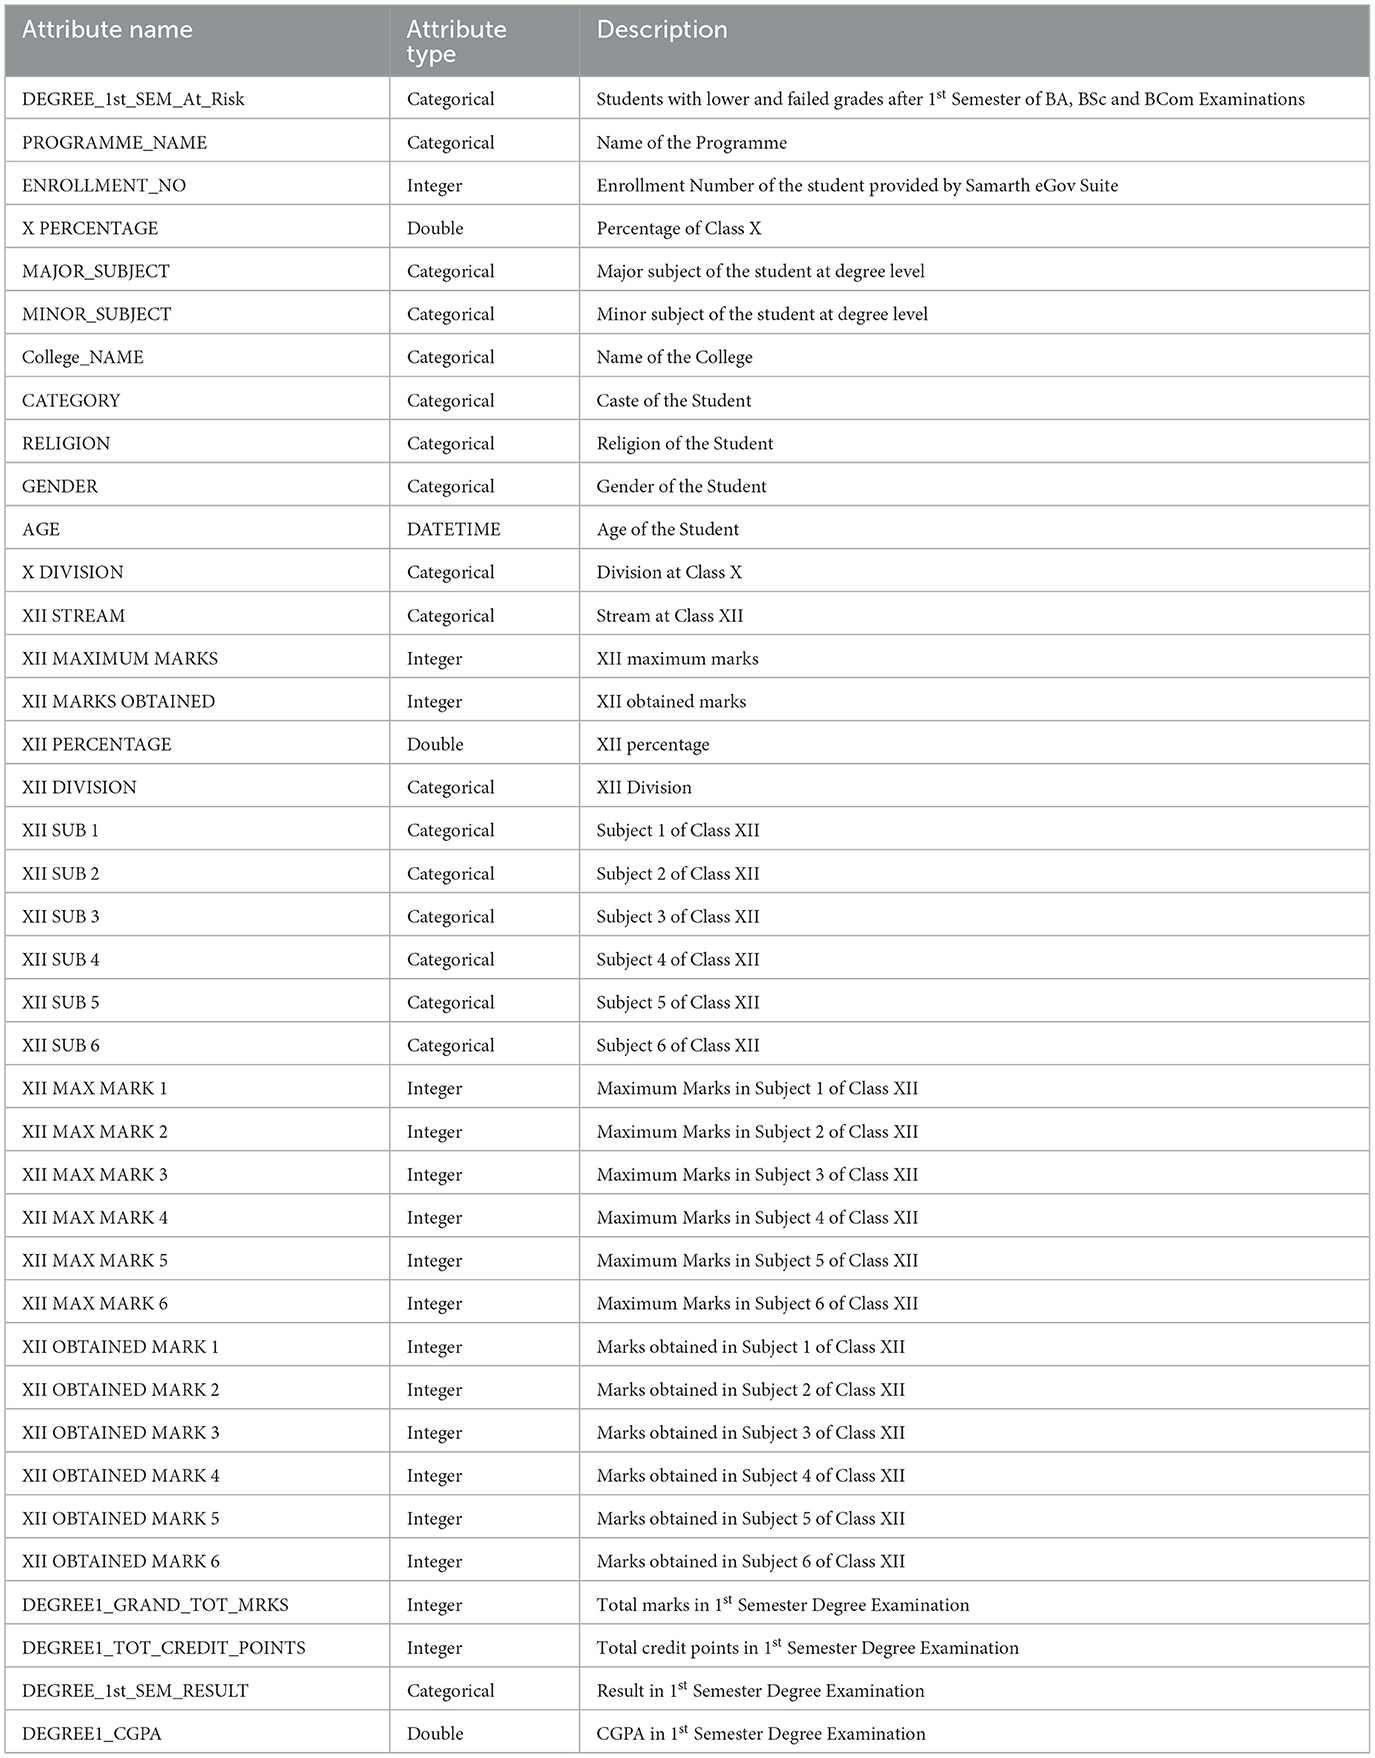
Table 2. Attributes in dataset.
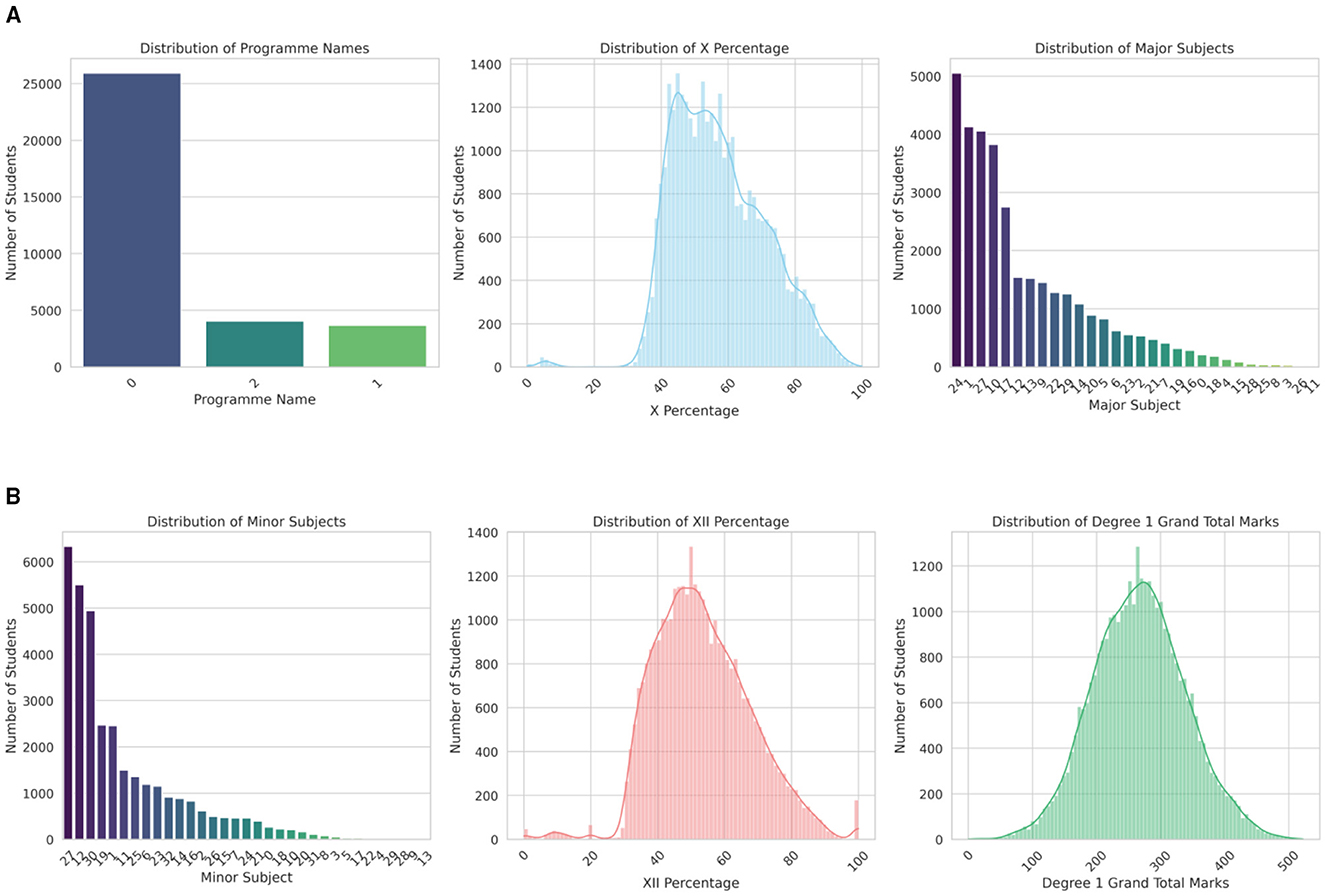
Figure 2. (a). Histogram plots of selective attributes. (b). Histogram plots of selective attributes.
3.2 Evaluation metrics
There are many evaluation metrics used for regression and classification purposes and some of the formulas are listed below.
Here, yi is the actual value, ŷi is the predicted value, y is the mean of the actual values. Again, TP, FP, TN, FN denote True Positive, False Positive, True Negative and False Negative respectively. Besides, Po is the observed proportionate agreement, and Pe is the expected proportionate agreement. Equations 1–4 are used in Table 3 for regression evaluation purpose and Equations 5–9 are used in Tables 4, 5 for classification performance evaluation.
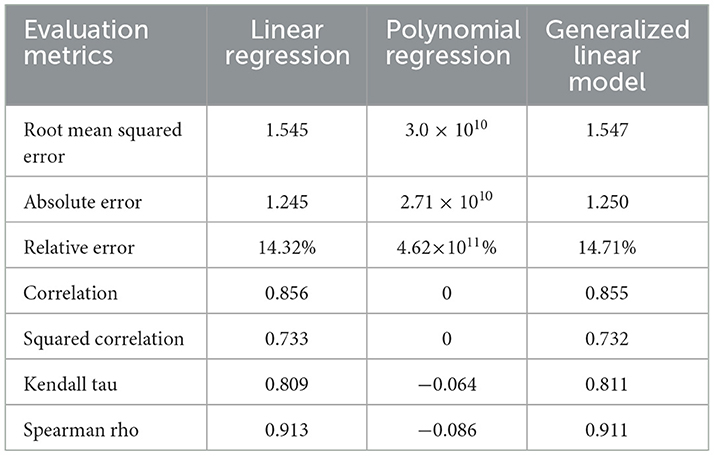
Table 3. Prediction result of the first semester CGPA using regression techniques.
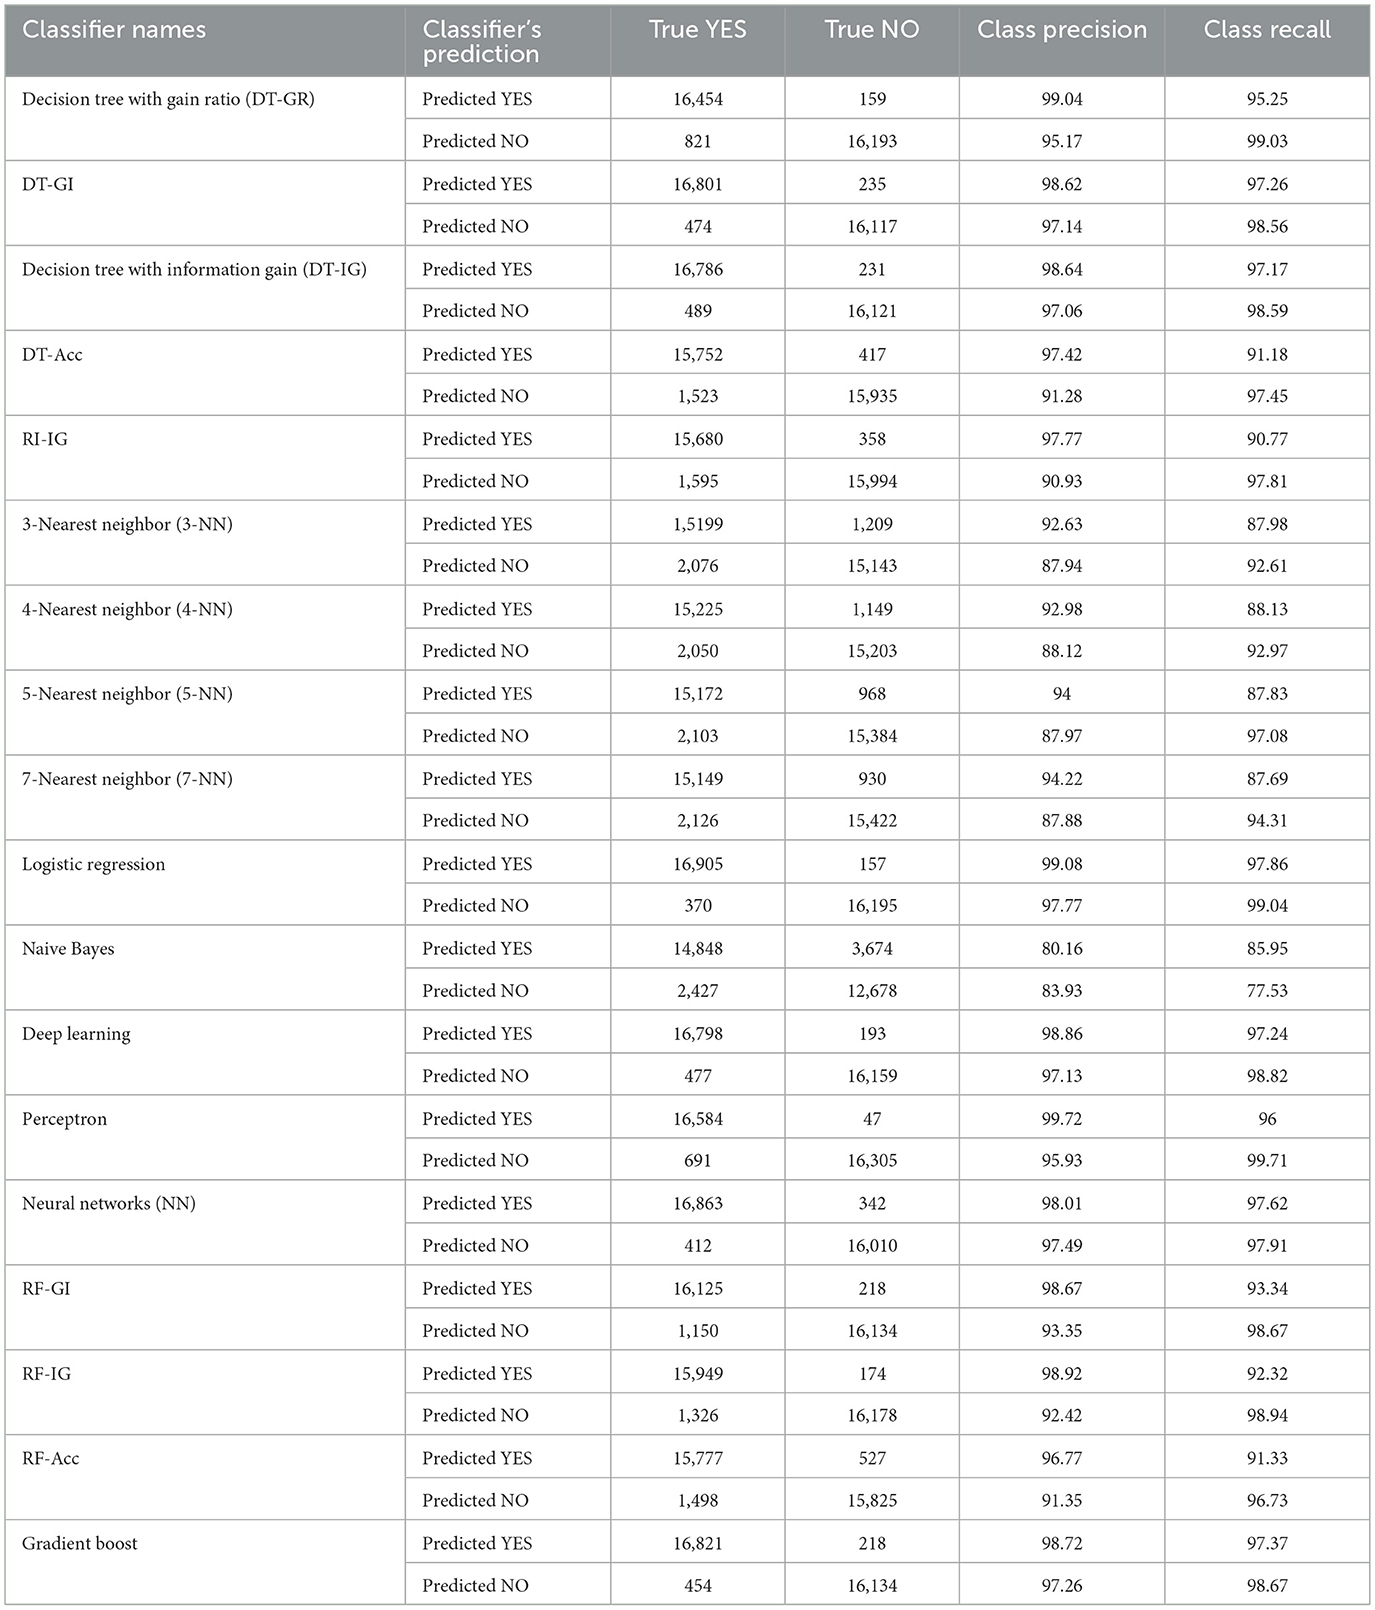
Table 4. Confusion matrices of several classification techniques.
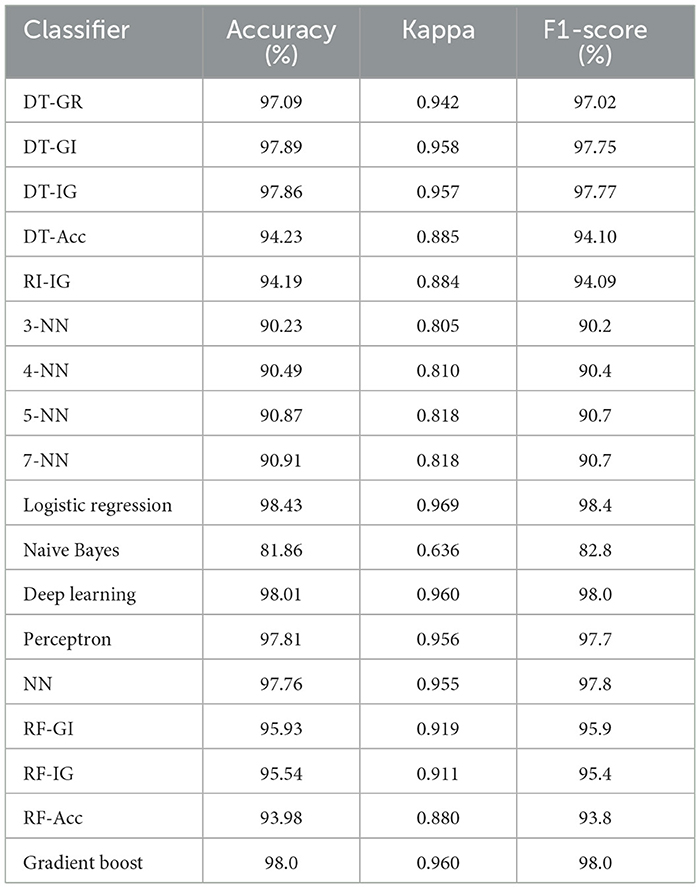
Table 5. Prediction performances of classification techniques of at-risk (dropout) students.
4 Results & discussion
This section presents results of Machine Learning (ML) models analysis following the four research objectives of this study with the sole purpose of exploring and gaining valuable insights about students' academic performance. The SHAPASH framework is used to investigate interpretability of the best ML classification model and thereby, gain insights about the importance of different features on ML prediction.
4.1 Objective 1 - Predicting the first semester CGPA using regression techniques
The first objective of this study is to predict first-semester CGPAs using regression techniques in order to identify at-risk of dropout students. Three regression models–Linear Regression, Polynomial Regression, and Generalized Linear Model (GLM) are evaluated based on various performance evaluation metrics. Table 3 presents results of the applied regression techniques on the dataset and the results show that, Linear Regression and GLM have demonstrated comparably significant performance, with Root Mean Squared Error (RMSE) values of 1.545 and 1.547 respectively, and Absolute Error (AE) values of 1.245 and 1.250. Both models have achieved similar Relative Error (RE) rates of 14.32% and 14.71%, which indicates strong predictive accuracy. On the contrary, Polynomial Regression has exhibited drastically poor performance, with RMSE and AE values exceeding 3.0 × 10¹⁰ and an RE of over 4.6 × 10¹¹, reflecting extreme overfitting and model instability. Correlation and squared correlation metrics further have affirmed the superiority of Linear Regression and GLM, with correlation coefficients of 0.856 and 0.855, and Squared Correlation (R2) values of 0.733 and 0.732, respectively. This proves their ability to predict students' CGPA to a satisfactory degree of accuracy. On the contrary, Polynomial Regression showed no meaningful correlation (R = 0, R2 = 0).
Additionally, rank-based metrics such as Kendall Tau and Spearman Rho have further validated the performance of Linear Regression and GLM, with Kendall Tau values of 0.809 and 0.811, and Spearman Rho values of 0.913 and 0.911 respectively. This indicates consistent relationship between predicted and actual values. Polynomial Regression have failed in these metrics as well. Negative scores highlight its failure in prediction accuracy and reflecting its inadequacy to provide useful insights from the dataset of this study. Overall, Linear Regression has emerged as the best-performing model due to its simplicity, interpretability, and slightly lower error rates compared to GLM. In brief, insights from Linear Regression can assist in finding actionable insights into the key factors of individual student performance, identifying at-risk students, and thereby, crafting a way of timely academic interventions and counseling to enhance institutional performance.
4.2 Objective 2 - Predicting the at-risk students (dropout) using classification techniques
The second objective of this study is to predict the risk of failure of the students using several classification techniques. The confusion matrix analysis of various machine learning algorithms provides valuable insights into their performance for predicting at-risk students, which can aid the teachers and authorities in addressing potential dropouts. The evaluation metrics such as class precision and recall can assist in detecting each algorithm's ability to correctly classify students as “at-risk” or “not at risk” class.
Table 4 presents confusion matrices of several classifiers and among the models, Logistic Regression demonstrated the highest prediction performance, achieving an outstanding precision of 99.08% and a recall of 97.86% for the at-risk class. Its strong recall ensures that most at-risk students are identified, while its high precision minimizes false positives, making it a highly reliable model for early dropout intervention. Logistic regression has detected 16,905 out of 17,275 at-risk students and 16,195 out of 16,352 students as “not at risk” of dropout correctly, whereas the error due to misclassification is very less, that is about 370 at-risk students are identified as “not at risk” and 157 “not at risk” students are falsely detected as at-risk students. Similarly, Deep Learning achieved a precision of 98.86% and a recall of 97.24%, showcasing its high capability to classify at-risk students correctly by finding patterns in the features data. It has accurately identified 16,798 out of 17,275 at-risk students and 16,159 out of 16,352 “not at risk” students. Besides, The Perceptron has also performed exceptionally well with a precision of 99.72% and a recall of 96%, indicating its ability to minimize misclassifications effectively. Again, Neural Networks (NN) has also proved to be a reliable alternative model with 98.01% precision and 97.62% recall performance for the at-risk student's prediction.
Among the four DT models, Decision Tree with Gini Index (DT-GI) has truely marked highest amount of 16,801 at-risk students and 16,117 “not at risk” students with 98.62% precision and 97.26% recall performance for at-risk students identification, whereas, Decision Tree with Accuracy (DT-Acc) has pinpointed 15,752 out of 17,275 at-risk students and 15,935 out of 16,352 “not at risk” students, thereby demonstrating the slightly lower performance with 97.42% precision and 91.18% recall for at-risk students classification. Meanwhile, Rule Induction with Information Gain (RI-IG) resembles performance of Decision Tree models closely with 97.77% precision, 90.77% recall for at-risk students' class and it has correctly spotted 15,680 at-risk and 15,994 “not at risk” students out of 33,627 total students.
Moreover, among three Random Forest Trees models, highest number of 16,125 at-risk students are precisely discovered by Random Forest Trees with Gini Index (RF-GI) and lowest number of 15,777 at-risk students by Random Forest Trees with Accuracy (RF-Acc). Similarly, Random Forest Trees with Information Gain (RF-IG) has recognized highest of 16,178 “not at risk” and RF-Acc has confirmed lowest of 15,825 “not at risk” students without error. In addition, RF-GI, RF-IG and RF-Acc has obtained precision of 98.67, 98.92 and 96.77%, respectively and recall of 93.35, 92.42 and 91.35%, respectively for the at-risk class. However, Gradient Boost has demonstrated top tier performance by correctly recognizing 16,821 at-risk students and 16,134 “not at risk” students out of 33,627 total students with 98.72% precision and 97.37% recall performance for at-risk class. Besides, K-NN models has shown moderate performance, with precision ranging from 92.63 to 94.22% and recall between 87.69 and 88.13%, indicating their considerable misclassification and limited effectiveness compared to the top-performing models.
Conversely, Naive Bayes has performed poorly with high misclassification rate compared to all other models, with a precision of 80.16% and a recall of 85.95% for the “at-risk” class. This indicates a highest rate of false positives and false negatives among the models, making it less suitable for accurate predictions to obtain objectives of this study. It has correctly recognized 14,848 out of 17,275 at-risk and 12,678 out of 16,352 “not at risk” students only. In summary, the confusion matrices analysis highlights that Logistic Regression has exhibited highest accurate prediction and can be nominated for best model with further performance metrics evaluation. Nevertheless, Deep Learning, Random Forest Trees, Gradient Boost and Perceptron models have displayed notably high performance and can be considered as second choice of alternate candidate model. The best classifier model can greatly assist in predicting at-risk students most effectively considering its robust precision and recall values. It can ensure reliable identification of students needing academic support, surveillance and motivation. Therefore, this can pave a way to performance monitoring and guidance of at-risk students and also to draft early intervention strategies to educators and policymakers. Consequently, these valuable insights can be utilized to reduce at-risk students (dropout rates) and improve institutional academic performance.
4.3 Objective 3 - Finding the best classifiers among different classifiers based on prediction performance
The third objective of this study is to identify the best-performing classifiers for predicting at-risk students most effectively that may be applied to datasets from other universities. Table 5 displays classification performance of several classifiers based on different evaluation metrics such as accuracy, kappa and F1-Score. Among the evaluated models, Logistic Regression has emerged as the top-performing classifier with the highest accuracy (98.43%), kappa (0.969), and F1-Score (98.4%). This indicates the model's superior ability to correctly classify at-risk students while maintaining strong correlation with true labels. Close competitors such as Deep Learning and Gradient Boost, both has achieved high accuracy (98.01 and 98.0%, respectively) and F1-Scores (98.0% for both), with kappa values of 0.960 each. These results highlight their robustness and suitability for handling complex data relationships, making them excellent alternatives to Logistic Regression. Besides, the Perceptron model has also performed well, with accuracy, kappa, and F1-Score values of 97.81, 0.956, and 97.7%, respectively, showcasing its effectiveness as a simpler alternative for at-risk students' prediction. Furthermore, NN has accuracy of 97.76%, kappa of 0.955 and F1-Score of 97.8%, which is close to the best performing classifier model.
DT classifiers, particularly those using Gini Index and Information Gain, achieved respectable results, with accuracies of 97.89 and 97.86%, and F1-Scores of 97.75 and 97.77%, respectively, outperforming DT-Acc (94.23%) and RI-IG 94.19%. On the other hand, K-NN models performed moderately, with accuracies ranging between 90.23 and 90.91%, and F1-Scores around 90.2%-90.7%, indicating moderate but limited effectiveness compared to the top-performing models. Moreover, RI-IG has displayed similar moderately high performance like DT classifiers with 94.19% accuracy, kappa of 0.884 and 94.09% F1-Score.
The Random Forest with Gini Index (RF-GI) has outperformed Random Forest with Information Gain (RF-IG) and Random Forest with Accuracy (RF-Acc) and achieved the highest performance across all metrics, with an accuracy of 95.93%, Kappa of 0.919, and F1-score of 95.9%, which indicates a strong overall classification capability and agreement. In comparison, the Random Forest with Information Gain (RF-IG) demonstrated slightly lower performance, achieving an accuracy of 95.54%, kappa of 0.911, and F1-score of 95.4%, suggesting it is nearly as effective. Lastly, the RF-Acc model has recorded the lowest performance, with an accuracy of 93.98%, Kappa of 0.880, and F1-score of 93.8%, indicating a noticeable decline in both classification precision and agreement. In contrast, Naive Bayes exhibited the poorest performance among all classifiers, with an accuracy of 81.86%, kappa of 0.636, and F1-Score of 82.8%. This probabilistic model may perform poorly because of its strong independence assumption, which is not well-suited for this dataset's complexity (Frank et al., 2000).
To summarize, these findings underscore the suitability of Logistic Regression as the best prediction model, with Deep Learning and Gradient Boost as close second choices, while Naive Bayes was determined to be the least effective. Therefore, the best classifier can be selected to find underlying patterns and valuable insights in students' academic performance data. Hence, universities can confidently adopt the best model to predict at-risk students, enabling early interventions, resource allocation, and academic support programs. In summary, best classifier model usage can pave a way to the educational authority to efficiently monitor academic performance, early detect at-risk of failure (dropout) students, as well as motivate students and track performance progression resulting in better academic success and reduced dropout rate.
4.4 Objective 4 - Explaining the results using XAI (eXplainable AI) to demonstrate the important features.
The fourth objective of this study is to interpret the results of best ML model to gain various decision-making insights using XAI. In addition, Logistic Regression classifier model has proven to be the best performing model to be considered for academic performance analysis. Therefore, SHAPASH framework is used to interpret the decision making process of this ML model in order to retrieve various insights such as feature importance and impact on model prediction performance (Islam et al., 2024).
The SHAPASH summary plot in Figure 3 presents 27 input features in a bar graph where features are ranked by sorting from the most important features to the least significant features (top to bottom) by evaluating their contribution to the decision making of the prediction model of whether a student is at risk of failer/dropout in their first semester. The features with highest mean absolute contribution are the most influential and the features with negligible contribution have no significant impact on model decision making (Miranda et al., 2024).
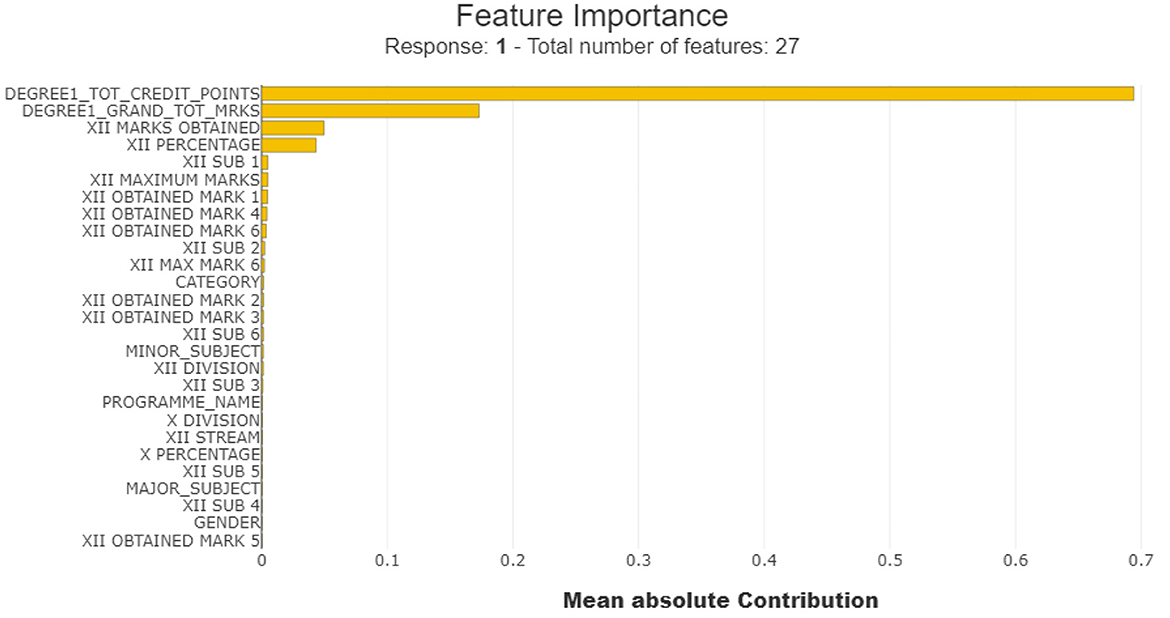
Figure 3. Summary plot of all features using SHAPASH.
According to the result, The DEGREE1_TOT_ CREDIT_POINTS is the most influential feature, with a mean absolute contribution of approximately 0.69, indicating that it significantly impacts the model's decision-making. This suggests that the total credit points earned by students are a critical indicator of academic performance. The second most important feature, DEGREE1_GRAND_TOT_MRKS, has a mean absolute contribution of around 0.17, showing that a student's overall marks also play a pivotal role in identifying at-risk students. Again, XII MARKS OBTAINED, has a mean absolute contribution of around 0.05, showing that a student's overall marks also play an important role in identifying at-risk students.
Additionally, XII_PERCENTAGE, with a contribution closer to 0.04, highlights that high school performance (12th-grade percentage) provides valuable but less substantial insights into academic dropout risk. However, features like XII SUB 1, XII MAXIMUM MARKS have a mean absolute contribution of around 0.005 each and XII OBTAINED MARK 1, XII OBTAINED MARK 4 and XII OBTAINED MARK 6 have a mean absolute contribution of around 0.004 each. Despite of less contribution, these features are also crucial factor as they participate in decision making process of the model. Contribution of these features conveys that 12th grade 1st subject, 12th grade maximum marks, 12th grade obtained mark in subject 1st , 4th and 6th are important key factors though they have moderate correlation with students academic performance and limited contributions to ML model's prediction decision.
However, features at the bottom of the bar graph, such as GENDER, X PERCENTAGE, MAJOR SUBJECT have very negligible contribution that means they don't have any notable correlation with students' academic performance. This reflects that gender of the students do not have any correlation with at-risk students' academic performance which means there is no exact pattern of male or female groups with at-risk or “not at risk” academic performance. Again, achieved percentage in 10th grade also has no meaningful correlation with decision making of at-risk students performance detection.
Figure 4 displays DEGREE1_ GRAND_TOT_MRKS (total marks earned) dependency plot and its influence on at-risk dropout students' prediction. In this graph plot, 2000 students' instances are plotted using SHAPASH where blue dots represent instances with a low predicted probability for the positive class that means “not at risk” class supportive and yellow dots represent instances with a high predicted probability for the positive class which means at-risk class supportive (Islam et al., 2024).
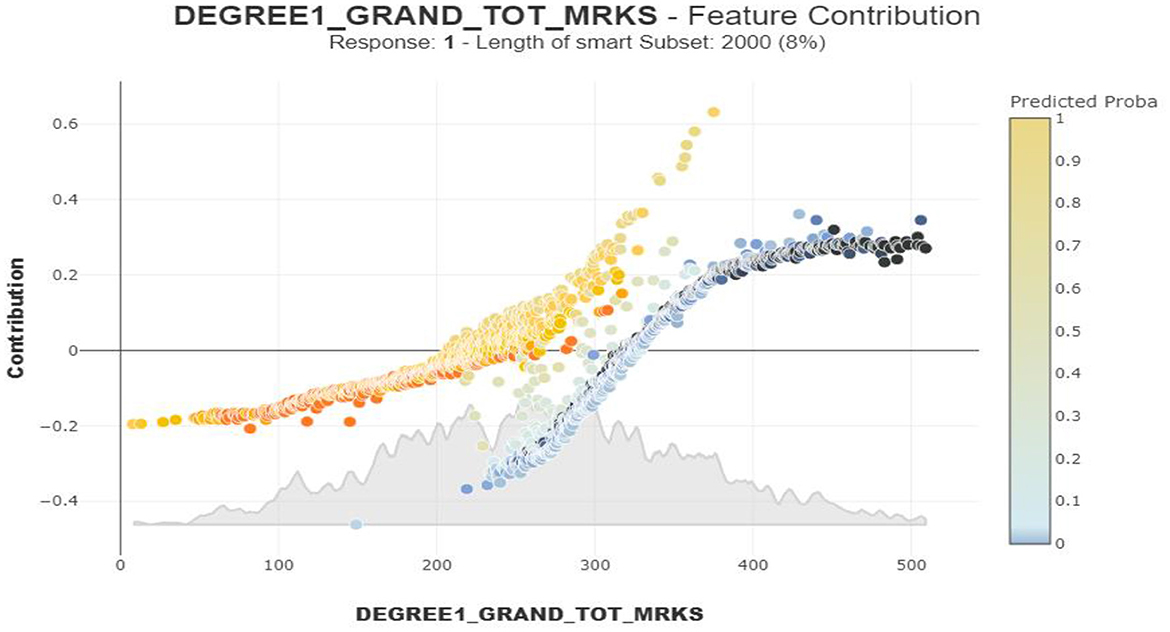
Figure 4. Dependence Plot of DEGREE1_GRAND_TOT_MRKS.
Students with lower marks than 200 are at a higher risk of dropout, reflected by the consistent negative contribution and the presence of yellow or orange points. Meanwhile, there is a crucial transition zone that can be noticed where dropout risk decreases as marks increase in between 200 and 300 marks range. Again, students scoring above 300 marks consistently show positive contribution and the presence of blue points, indicating a lower probability of students' dropout risk. In brief, the findings clarify the importance of crossing the approximate 200-mark threshold, as this significantly reduces students' dropout risk, and suggest prioritizing support for students with marks below this threshold level.
Figure 5 highlights the relationship between DEGREE1_TOT_ CREDIT_POINTS (total credit points earned by students) dependency plot and their dropout risk. According to this SHAPASH dependency plot, students with lower credit points below 50 have a significantly higher dropout risk, as indicated by positive contribution values and orange points. This group requires immediate academic intervention, recovery support and guidance. As credit points increase, the SHAP contribution values move closer to zero, indicating reduced contributions to dropout risk. A sharp transition from greater risk of dropout to lower can be observed where credit points reaches around 100. For students with credit points above 100, the SHAP contribution values become negative, and the points turn blue, depicting a notable effect where higher credit points are strongly associated with “not at risk” students' detection. Finally, this dependency plot analysis underscores a critical threshold near 50 credit points, below which students are particularly vulnerable to dropping out and a transition point of probability drop at 100 credit point favoring at-risk students' total reduction 100 to 200 credit points zone.
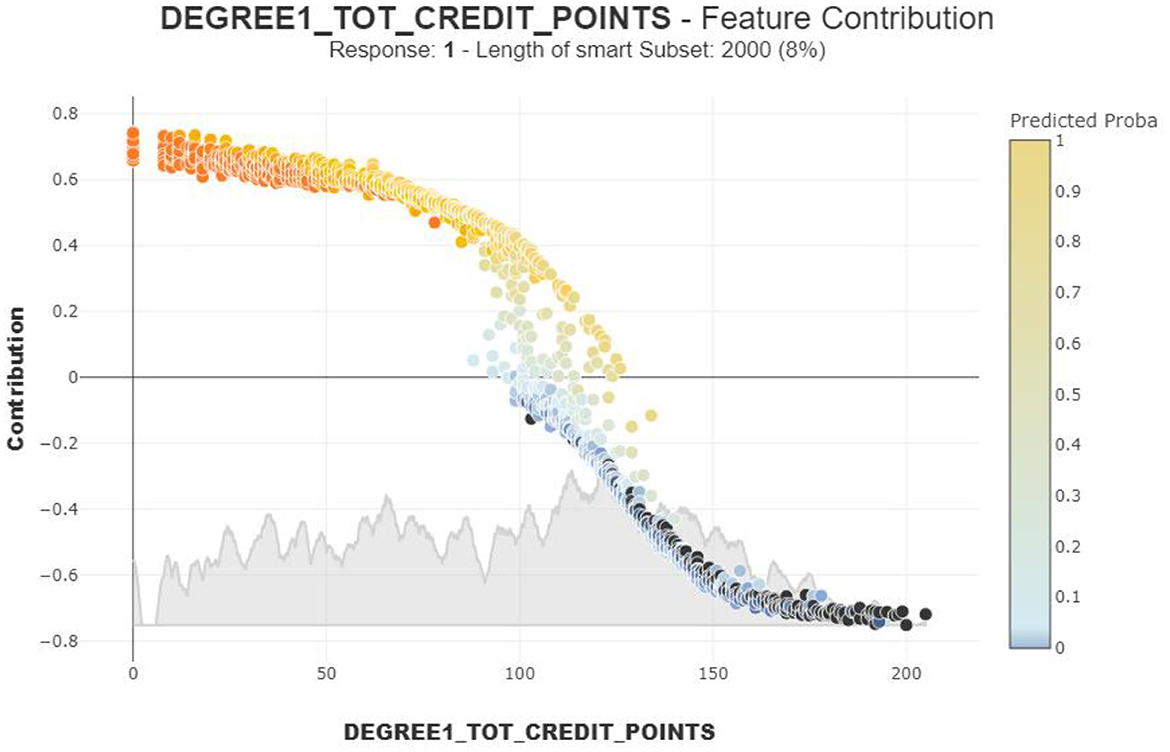
Figure 5. Dependence Plot of DEGREE1_TOT_CREDIT_POINT.
Finally, these results provide valuable insights such as feature importance and contribution to ML model's decision making, impactful and negligible features by showcasing graphical transparent view and providing stakeholders with clear insights into how predictions are achieved, enabling targeted interventions for at-risk students. It also extracts crucial feature specific knowledge such as critical and sharp transitional total credit points threshold (50 credit, 100 credit respectively), grand total marks range (below 200, around [200–300] and above 300) and at-risk student performance correlation and so on. In summary, insights found by XAI can greatly help stakeholders and authorities to understand precise observations and feature patterns, and make informed decisions by identifying key factors influencing academic result, improving transparency, and enhancing trust in the model's predictions.
4.5 Comparative validation and generalization scope
In order to confirm the applicability and strength of the suggested findings, one will have to compare the formulated models with those of the associated studies and design further extensive validation with the dataset of other universities. Not only does comparative analysis indicate the strengths of the proposed framework, but also puts its performance in the global academic context.
Table 6 provides a comparison of the findings of this work with the other works on the topic of student performance prediction done in the recent period. The table outlines the models used in machine learning, the accuracy attained and the nature of the datasets used, as to how the proposed framework works compared to different learning settings.
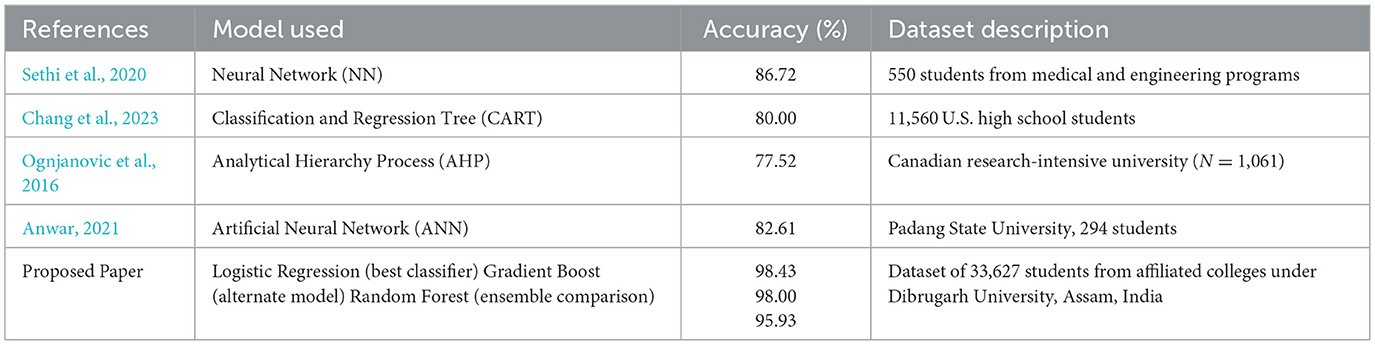
Table 6. Comparative analysis of prediction models across related studies.
The results relative to those of other models like CART, AHP, and ANN have an excellent accuracy of 98.43 showing that the proposed Logistic Regression model is superior to the other models employed in earlier researches. The stability and versatility of the framework in various learning paradigms is again validated by the Gradient Boost (98.00%) and Random Forest (95.93%) models.
Nevertheless, the data used in this study is the resultant of a one-university system, which can be potentially restrictive to the application of outside generalization. The cross-institutional validation (testing the model on datasets of other universities throughout India and beyond) will thus become the next step in the research. This validation will help assess the consistency of the model parameters, ranking of feature importance and explanations across institutions that use different grading systems, student bodies and curriculum designs.
Moreover, by expanding the sample to multi-university datasets, the future research will evaluate the model transferability and its possible application as a generalized predictive early-warning framework of academic risk. The wider validation will make sure that the results will not be limited to local consistency, but instead, taken to be scalable, data-driven decision-support system to the higher education institutions all around the world.
4.6 Cross-university validation for generalization
In order to assess the extrinsic validity of the developed forecasting framework, the model was also tested on another dataset, which was a secondary test in a European university (Portugal) (https://www.kaggle.com/datasets/thedevastator/higher-education-predictors-of-student-retention). This dataset is comprised of 22 features which cover demographic, socio-economic as well as educational factors including marital status, parental credentials, tuition-fee credentials and approved curricular units. The task was to find out whether the proposed system is capable of preserving its predictive reliability when used in a different institutional setting. The results are described in Table 7.
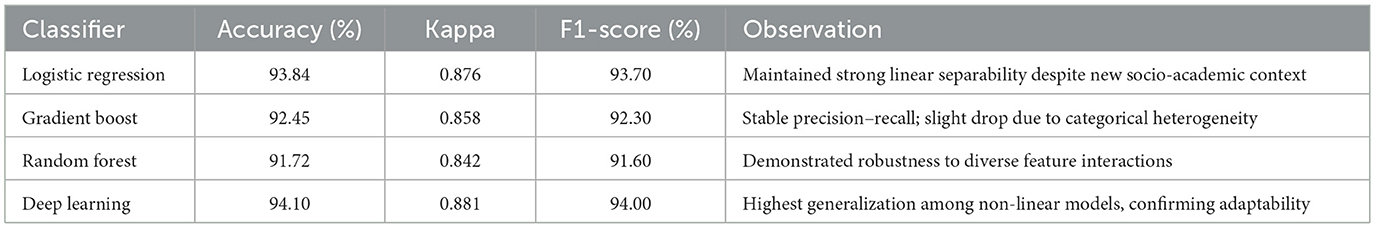
Table 7. Validation of proposed models on the Portugal dataset.
The cross-university validation, however, establishes that the suggested predictive framework can be used across different institutional settings. Despite the socio-economic and curricular structure of the Portugal dataset being significantly different to the Dibrugarh dataset, both the Logistic Regression model and the Deep Learning model were able to reach an accuracy of over 93% which means that their transferability is high. The minor decrease in performance (≈4–5%) is an anticipated domain variation as opposed to overfitting, which confirms the strength of the underlying feature outcome correlations. These findings support the argument that the model represents a general pattern of academic success that can be generalized to the higher-education systems of the globe. Further studies will continue by validating in more universities in Asia and Europe to further support the cross-institutional scalability and create a cohesive AI-based framework of academic risk-predictions.
4.7 Limitations and future work scopes
One of the limitations of this study is feature selection techniques are not utilized as the data is collected from real world situations. Another limitation is the absence of more demographic and socioeconomic features in the dataset. Incorporation of such features may impact the overall academic performance of the students. The dataset explored only the 1st Semester Examination results. The performance progression of other semester results may be another research goal for future study. The model may be tested for another University's records for generalization of the findings. The detection of students with consistent performance using previous examination performance trends can be an interesting working trajectory (Sarker et al., 2024). In future studies, efficient feature engineering by educational data exploration techniques can assist in better model performance. To gain better insights, association rule mining can also be exploited. Some novel or ensemble techniques may be examined in the dataset in comparison to the traditional machine learning classifiers can be another extension of the work.
5 Conclusion
The study has investigated students' academic performance using ML models and also discussed interpretation of the decision-making process by the best ML model over the dataset features. The first objective provides a suitable model (Linear Regression) and some valuable insights about individual student's performance and probable risk of failure, various features contribution to at-risk academic result. Thus, authorities can initiate timely monitoring and extra classes to the struggling students to cope up resulting in failure risk mitigation. In addition, the second objective provides useful findings such as correctly detected at-risk and “not at risk” category students with a high degree of accuracy. Therefore, the teachers and policy makers can take counter measures to reduce the possible at-risk students (dropout rate). Moreover, third objective helps to select the best model (Logistic Regression) that can be applied to other similar datasets of different Universities to extract useful information such as at-risk or “not at risk” students effectively. Lastly, the fourth objective delivers knowledge regarding the internal decision making of the best model, feature importance and impact on ML model and some very useful patterns like critical points and sharp transitional range that affect at-risk students' detection greatly.
Data availability statement
The raw data supporting the conclusions of this article will be made available by the authors, without undue reservation.
Author contributions
RP: Writing – review & editing, Writing – original draft. SS: Writing – review & editing, Writing – original draft. HA: Writing – original draft, Writing – review & editing. SH: Writing – review & editing, Writing – original draft. AB: Writing – original draft, Writing – review & editing. SG: Writing – original draft, Writing – review & editing, Funding acquisition.
Funding
The author(s) declare that financial support was received for the research and/or publication of this article. This paper is financed by the European Union-NextGenerationEU, through the National Recovery and Resilience Plan of the Republic of Bulgaria, project No BG-RRP-2.004-0001-C01.
Conflict of interest
The authors declare that the research was conducted in the absence of any commercial or financial relationships that could be construed as a potential conflict of interest.
Generative AI statement
The author(s) declare that no Gen AI was used in the creation of this manuscript.
Any alternative text (alt text) provided alongside figures in this article has been generated by Frontiers with the support of artificial intelligence and reasonable efforts have been made to ensure accuracy, including review by the authors wherever possible. If you identify any issues, please contact us.
Publisher's note
All claims expressed in this article are solely those of the authors and do not necessarily represent those of their affiliated organizations, or those of the publisher, the editors and the reviewers. Any product that may be evaluated in this article, or claim that may be made by its manufacturer, is not guaranteed or endorsed by the publisher.
References
Adeniyi, D. A., Wei, Z., and Yongquan, Y. (2016). Automated web usage data mining and recommendation system using K-Nearest Neighbor (KNN) classification method. Appl. Comp. Inf. 12, 90–108. doi: 10.1016/j.aci.2014.10.001
Ahmed, E. (2024). Student performance prediction using machine learning algorithms. Appl. Comp. Intell. Soft Comp. 2024:4067721. doi: 10.1155/2024/4067721
Airlangga, G. (2024). A comparative analysis of machine learning models for predicting student performance: evaluating the impact of stacking and traditional methods. Brilliance Res. Artif. Intell. 4, 491–499. doi: 10.47709/brilliance.v4i2.4669
Al Shibli, K. S., Al Abri, A. S. S., Sunny, L., Ishwar, N., and Cherian, S. P. (2022). Model for prediction of student grades using data mining algorithms. Eur. J. Inf. Technol. Comp. Sci. 2, 1–6. doi: 10.24018/compute.2022.2.2.47
Alamri, R., and Alharbi, B. (2021). Explainable student performance prediction models: a systematic review. IEEE Access 9, 33132–33143. doi: 10.1109/ACCESS.2021.3061368
Alsubhi, B., Alharbi, B., Aljojo, N., Banjar, A., Tashkandi, A., Alghoson, A., et al. (2023). Effective feature prediction models for student performance. Eng. Technol. Appl. Sci. Res. 13, 11937–11944. doi: 10.48084/etasr.6345
Anwar, M. (2021). Prediction of the graduation rate of engineering education students using artificial neural network algorithms. Education 5, 15–23. doi: 10.24036/00411za0002
Arévalo Cordovilla, F. E., and Peña Carrera, M. (2024). Comparative analysis of machine learning models for predicting student success in online programming courses: a study based on LMS data and external factors. Mathematics 12:3272. doi: 10.3390/math12203272
Badal, Y. T., and Sungkur, R. K. (2023). Predictive modelling and analytics of students' grades using machine learning algorithms. Educ. Inf. Technol. 28, 3027–3057. doi: 10.1007/s10639-022-11299-8
Bentéjac, C., Csörgo, A., and Martínez-Muñoz, G. (2021). A comparative analysis of gradient boosting algorithms. Artif. Intell. Rev. 54, 1937–1967. doi: 10.1007/s10462-020-09896-5
Bujang, S. D. A., Selamat, A., Ibrahim, R., Krejcar, O., Herrera-Viedma, E., Fujita, H., et al. (2021b). Multiclass prediction model for student grade prediction using machine learning. IEEE Access 9, 95608–95621. doi: 10.1109/ACCESS.2021.3093563
Bujang, S. D. A., Selamat, A., and Krejcar, O. (2021a). A predictive analytics model for students grade prediction by supervised machine learning. IOP Conf. Ser.: Mater. Sci. Eng. 1051:12005. doi: 10.1088/1757-899X/1051/1/012005
Chang, C. N., Lin, S., Kwok, O. M., and Saw, G. K. (2023). Predicting STEM major choice: a machine learning classification and regression tree approach. J. STEM Educ. Res. 6, 358–374. doi: 10.1007/s41979-023-00099-5
Depren, S. K., Aşkin, Ö. E., and Öz, E. (2017). Identifying the classification performances of educational data mining methods: a case study for TIMSS. Educ. Sci. Theory Pract. 17, 1605–1623.
Duda, R. O., and Hart, P. E. (1973). Pattern Classification and Scene Analysis, Vol. 3. New York: Wiley, 731–739.
Frank, E., Trigg, L., Holmes, G., and Witten, I. H. (2000). Naive bayes for regression. Machine Learn. 41, 5–25. doi: 10.1023/A:1007670802811
Friedman, N., Geiger, D., and Goldszmidt, M. (1997). Bayesian network classifiers. Machine Learn.29, 131–163. doi: 10.1023/A:1007465528199
Gaftandzhieva, S., Talukder, A., Gohain, N., Hussain, S., Theodorou, P., Salal, Y. K., et al. (2022). Exploring online activities to predict the final grade of student. Mathematics 10:3758. doi: 10.3390/math10203758
Gray, G., McGuinness, C., and Owende, P. (2014). “An application of classification models to predict learner progression in tertiary education,” in 2014 IEEE International Advance Computing Conference (IACC) (Gurgaon: IEEE), 549–554. doi: 10.1109/IAdCC.2014.6779384
Hoq, M., Brusilovsky, P., and Akram, B. (2023). Analysis of an Explainable Student Performance Prediction Model in an Introductory Programming Course. Bengaluru: International Educational Data Mining Society.
Islam, M. R., Nitu, A. M., Marjan, M. A., Uddin, M. P., Afjal, M. I., and Mamun, M. A. A. (2024). Enhancing tertiary students' programming skills with an explainable Educational Data Mining approach. PLoS ONE 19:e0307536. doi: 10.1371/journal.pone.0307536
Jang, Y., Choi, S., Jung, H., and Kim, H. (2022). Practical early prediction of students' performance using machine learning and eXplainable AI. Educ. Inf. Technol. 27, 12855–12889. doi: 10.1007/s10639-022-11120-6
Jović, J., Kisić, E., Milić, M. R., Domazet, D., and Chandra, K. (2017). “Prediction of student academic performance using machine learning algorithms,” in 13th International Conference on e-Learning (Belgrade: CEUR Workshop Proceedings) 2022, 35.
Kalita, E., Alfarwan, A. M., El Aouifi, H., Kukkar, A., Hussain, S., Ali, T., et al. (2025a). Predicting student academic performance using Bi-LSTM: a deep learning framework with SHAP-based interpretability and statistical validation. Front. Educ. 10:1581247. doi: 10.3389/feduc.2025.1581247
Kalita, E., El Aouifi, H., Kukkar, A., Hussain, S., Ali, T., and Gaftandzhieva, S. (2025b). LSTM-SHAP based academic performance prediction for disabled learners in virtual learning environments: a statistical analysis approach. Soc. Netw. Anal. Min. 15, 1–23. doi: 10.1007/s13278-025-01484-1
Kukkar, A., Mohana, R., Sharma, A., and Nayyar, A. (2023a). Prediction of student academic performance based on their emotional wellbeing and interaction on various e-learning platforms. Educ. Inf. Technol. 28, 9655–9684. doi: 10.1007/s10639-022-11573-9
Kukkar, A., Mohana, R., Sharma, A., and Nayyar, A. (2024). A novel methodology using RNN+ LSTM+ ML for predicting student's academic performance. Educ. Inf. Technol. 29, 14365–14401. doi: 10.1007/s10639-023-12394-0
Kukkar, A., Sharma, A., Singh, P. K., and Kumar, Y. (2023b). “Predicting students final academic performance using deep learning techniques,” in IoT, Big Data and AI for Improving Quality of Everyday Life: Present and Future Challenges: IOT, Data Science and Artificial Intelligence Technologies (Cham: Springer International Publishing), 219–241. doi: 10.1007/978-3-031-35783-1_13
LeCun, Y., Bengio, Y., and Hinton, G. (2015). Deep learning. Nature 521, 436–444. doi: 10.1038/nature14539
Masangu, L., Jadhav, A., and Ajoodha, R. (2021). Predicting student academic performance using data mining techniques. Adv. Sci. Technol. Eng. Syst. J. 6, 153–163. doi: 10.25046/aj060117
Meiriza, A., Lestari, E., Putra, P., Monaputri, A., and Lestari, D. A. (2020). “Prediction graduate student use naive Bayes classifier,” in Sriwijaya International Conference on Information Technology and Its Applications (SICONIAN 2019) (Palembang: Atlantis Press), 370–375. doi: 10.2991/aisr.k.200424.056
Miranda, E., Aryuni, M., Rahmawati, M. I., Hiererra, S. E., and Dian Sano, A. V. (2024). Machine Learning's model-agnostic interpretability on the prediction of students' academic performance in video-conference-assisted online learning during the COVID-19 pandemic. Comp. Educ. Artif. Intell. 7:100312. doi: 10.1016/j.caeai.2024.100312
Nachouki, M., Mohamed, E. A., Mehdi, R., and Abou Naaj, M. (2023). Student course grade prediction using the random forest algorithm: analysis of predictors' importance. Trends Neurosci. Educ. 33:100214. doi: 10.1016/j.tine.2023.100214
Nagesh, A. S., Satyamurty, C. V., and Akhila, K. (2017). Predicting student performance using KNN classification in bigdata environment. CVR J. Sci. Technol. 13, 83–87.
Natekin, A., and Knoll, A. (2013). Gradient boosting machines, a tutorial. Front. Neurorob. 7:21. doi: 10.3389/fnbot.2013.00021
Nguyen, M. K., and Nguyen, H. D. (2023). Predicting graduation grades using machine learning: a case study of Can Tho University students. CTU J. Innovation Sustainable Dev. 15, 83–92. doi: 10.22144/ctujoisd.2023.038
Ofori, F., Maina, E., and Gitonga, R. (2020). Using machine learning algorithms to predict students' performance and improve learning outcome: a literature based review. J. Inf. Technol. 4, 23–45.
Ognjanovic, I., Gasevic, D., and Dawson, S. (2016). Using institutional data to predict student course selections in higher education. Internet Higher Educ. 29, 49–62. doi: 10.1016/j.iheduc.2015.12.002
Okewu, E., Adewole, P., Misra, S., Maskeliunas, R., and Damasevicius, R. (2021). Artificial neural networks for educational data mining in higher education: a systematic literature review. Appl. Artif. Intell. 35, 983–1021. doi: 10.1080/08839514.2021.1922847
Özkurt, C. (2024). Assessing student success: the impact of machine learning and XAI-BBO approach. J. Smart Syst. Res. 5, 40–54. doi: 10.58769/joinssr.1480695
Paddalwar, S., Mane, V., and Ragha, L. (2022). “Predicting students' academic grade using machine learning algorithms with hybrid feature selection approach,” in ITM Web of Conferences, Vol. 44 (Navi Mumbai: EDP Sciences), 3036. doi: 10.1051/itmconf/20224403036
Paramita, A. S., and Tjahjono, L. M. (2021). Implementing machine learning techniques for predicting student performance in an E-learning environment. Int. J. Inf. Inf. Syst. 4, 149–156. doi: 10.47738/ijiis.v4i2.112
Sarker, S., Paul, M. K., Thasin, S. T. H., and Hasan, M. A. M. (2024). Analyzing students' academic performance using educational data mining. Comp. Educ. Artif. Intell. 7:100263. doi: 10.1016/j.caeai.2024.100263
Sethi, K., Jaiswal, V., and Ansari, M. D. (2020). Machine learning based support system for students to select stream (subject). Recent Adv. Comp. Sci. Commun. 13, 336–344. doi: 10.2174/2213275912666181128120527
Song, Y. Y., and Ying, L. U. (2015). Decision tree methods: applications for classification and prediction. Shanghai Arch. Psychiatry 27:130.
Stoltzfus, J. C. (2011). Logistic regression: a brief primer. Acad. Emerg. Med. 18, 1099–1104. doi: 10.1111/j.1553-2712.2011.01185.x
Suthaharan, S. (2016). Machine learning models and algorithms for big data classification. Integr. Ser. Inf. Syst. 36, 1–12. doi: 10.1007/978-1-4899-7641-3
Tiukhova, E., Vemuri, P., Flores, N. L., Islind, A. S., Óskarsdóttir, M., Poelmans, S., et al. (2024). Explainable learning analytics: assessing the stability of student success prediction models by means of explainable AI. Decis. Support Syst. 182:114229. doi: 10.1016/j.dss.2024.114229
Ujkani, B., Minkovska, D., and Hinov, N. (2024). Course success prediction and early identification of at-risk students using explainable artificial intelligence. Electronics 13:4157. doi: 10.3390/electronics13214157
Yagci, M. (2022). Educational data mining: prediction of students' academic performance using machine learning algorithms. Smart Learn. Environ. 9:11. doi: 10.1186/s40561-022-00192-z
Keywords: higher education institutions, student success, dropout prediction, machine learning, predictive analytics, explainable AI (XAI)
Citation: Paul R, Sarker S, El Aouifi H, Hussain S, Baruah AK and Gaftandzhieva S (2025) Analyzing dropout of students and an explainable prediction of academic performance utilizing artificial intelligence techniques. Front. Educ. 10:1698505. doi: 10.3389/feduc.2025.1698505
Received: 04 September 2025; Revised: 06 November 2025;
Accepted: 17 November 2025; Published: 03 December 2025.
Edited by:
Eduardo Hernández-Padilla, Autonomous University of the State of Morelos, MexicoReviewed by:
Rakeshkumar Mahto, California State University, United StatesPedro Castañeda, Universidad Peruana de Ciencias Aplicadas, Peru
Copyright © 2025 Paul, Sarker, El Aouifi, Hussain, Baruah and Gaftandzhieva. This is an open-access article distributed under the terms of the Creative Commons Attribution License (CC BY). The use, distribution or reproduction in other forums is permitted, provided the original author(s) and the copyright owner(s) are credited and that the original publication in this journal is cited, in accordance with accepted academic practice. No use, distribution or reproduction is permitted which does not comply with these terms.
*Correspondence: Silvia Gaftandzhieva, c2lzc2l5ODhAdW5pLXBsb3ZkaXYuYmc=
†ORCID: Sazol Sarker orcid.org/0009-0004-3582-1279
Houssam El Aouifi orcid.org/0000-0002-5878-726X
Sadiq Hussain orcid.org/0000-0002-9840-4796
Arun K. Baruah orcid.org/0009-0003-2115-9977
Silvia Gaftandzhieva orcid.org/0000-0002-0569-9776