 Xiaopu Lin1†
 Lingling Xu
- 1Department of Huiqiao Medical Centre, Nanfang Hospital, Southern Medical University, Guangzhou, China
- 2Department of Endocrinology, Shenzhen Hospital, Southern Medical University, Shenzhen, China
- 3The Third School of Clinical Medicine, Southern Medical University, Guangzhou, China
Aim: This study aimed to explore the relationship between lower-limb muscle mass/visceral fat area and diabetic kidney disease (DKD) progression in patients with type 2 diabetes mellitus (T2DM).
Methods: A total of 879 participants with T2DM were divided into 4 groups according to the prognosis of CKD classification from Kidney Disease: Improving Global Outcomes (KDIGO). Rectus femoris cross-sectional area (RFCSA) was measured through ultrasound, and visceral fat area (VFA) was evaluated with bioelectric impedance analysis (BIA).
Results: T2DM patients with high to very high prognostic risk of DKD showed a reduced RFCSA (male P < 0.001; female P < 0.05), and an enlarged VFA (male P < 0.05; female P < 0.05). The prognostic risk of DKD was negatively correlated with RFCSA (P < 0.05), but positively correlated with VFA (P < 0.05). Receiver-operating characteristic analysis revealed that the cutoff points of T2DM duration combined with RFCSA and VFA were as follows: (male: 7 years, 6.60 cm2, and 111 cm2; AUC = 0.82; 95% CI: 0.78–0.88; sensitivity, 78.0%; specificity, 68.6%, P < 0.001) (female: 9 years, 5.05 cm2, and 91 cm2; AUC = 0.73; 95% CI: 0.66–0.81; sensitivity, 73.9%; specificity, 63.3%, P < 0.001).
Conclusion: A significant association was demonstrated between reduced RFCSA/increased VFA and high- to very high-prognostic risk of DKD. T2DM duration, RFCSA, and VFA may be valuable markers of DKD progression in patients with T2DM.
Clinical trial registration: http://www.chictr.org.cn, identifier ChiCTR2100042214
Introduction
Diabetic kidney disease (DKD) is an important microvascular complication of diabetes, leading to increased mortality in diabetic patients (1). It has been reported that T2DM affects 8.2% of adults (2), 20%–40% of whom are expected to be diagnosed with DKD (3). The only treatment options for late stage DKD include dialysis or kidney transplantation, which are costly, significantly increasing personal and social burdens (4). Hence, identifying and managing the risk factors for DKD is of paramount importance in clinical practice.
Skeletal muscle constituting about 40% of body weight in healthy weight adults falls in quantity and quality with age (5). The mass of skeletal muscle also differs between the sexes. Sarcopenia characterized by gradual skeletal muscle strength and mass deterioration is also considered a complication of DM and has received increasing attention in recent years (6, 7). Many studies have shown that sarcopenia syndrome is commonly found in chronic kidney disease (CKD) patients, mainly those with end-stage kidney disease (ESKD) who received hemodialysis (8). Although previous studies have explored sarcopenia in DM or CKD (9, 10), whether it is associated with DKD is still unclear. No unified definition of sarcopenia has been recommended so far, and the consensus by the European Working Group on Sarcopenia in Older People (EWGSOP) is widely accepted (6, 11). The Asian Working Group for Sarcopenia (AWGS) further provided specific cutoff values for Asian population (12). The assessment of sarcopenia is complex and time-consuming, requiring simple techniques capable of monitoring changes in muscle mass as disease progresses. Douglas W. et al. demonstrated that ultrasound‐derived rectus femoris cross-sectional area (RFCSA) appeared to be a reliable index of total quadriceps volume, which was a measure of muscle mass (13). Mueller et al. showed that ultrasound might be a rapid and convenient method to assess sarcopenia (14).
Obesity has become a global health problem due to its associations with coronary artery disease, T2DM, nonalcoholic fatty liver disease, etc. (15, 16). Moreover, some studies have shown that abdominal obesity adversely affects renal prognosis, which is independent of diabetes (17, 18). Previous studies demonstrated that excessive visceral fat area (VFA) was related to insulin resistance and was a crucial risk factor for the development of T2DM compared with waist circumference or body mass index (BMI) (19, 20). The present study was designed to investigate the relationship between RFCSA/VFA and the prognostic risk of DKD, and to elucidate whether RFCSA/VFA was a marker for DKD progression.
Materials and methods
Study design
This controlled, open-label, cross-sectional trial was performed to explore the relationship between RFCSA/VFA and DKD progression. A total of 879 participants were enrolled at the Department of Endocrinology, Shenzhen Hospital, Southern Medical University, China, between March 2020 and December 2021.
Patients included were more than 18 years and were diagnosed with T2DM.
The exclusion criteria were listed as follows: acute complications of diabetes, such as hyperglycemic hyperosmolar coma, hypoglycemic coma, diabetic ketoacidosis and lactic acidosis; nondiabetic nephropathy; myasthenia or muscular atrophy caused by other factors, such as central and peripheral nervous system inflammatory or degenerative diseases, congenital/hereditary diseases, cerebrovascular diseases, craniocerebral trauma, and bone and joint diseases; and malignant tumors, chronic heart failure with decreased ejection fraction, severe liver disease, uncontrolled hypertension, and pregnancy.
The patients’ clinical data, such as sex, age, diabetes duration, BMI, blood pressure, history of alcohol consumption, smoking history, were recorded. Laboratory measurements, including blood urea nitrogen (BUN), creatinine (Cr), cystatin C (CysC), serum uric acid (SUA), blood lipid profile, glycosylated hemoglobin (HbA1c), fasting plasma glucose (FPG), fasting C-peptide (FCP), and fasting insulin (FINS), were tested after an 8-h fast. Also, 24-h urinary albumin excretion rate (UAER) and urinary albumin-to-creatinine ratio (UACR) were measured and recorded. Estimated glomerular filtration rate (eGFR) was calculated using CKD-EPI (21, 22). According to the prognosis of CKD classification from Kidney Disease: Improving Global Outcomes (KDIGO) 2020 Clinical Practice Guideline (23), the participants were divided into 4 groups as follows: low risk, moderate risk, high risk and very high-risk groups.
RFCSA assessment using ultrasound
RFCSA was measured by ultrasonography using a 3-12 MHz transducer array (Philips Ultrasound, WA, USA) as previously described (24, 25). All measurements were made by the same sonographer. The patients were asked to keep relaxed, extend legs and to be in a supine position with upper body elevated by 30°. The point 60% of the distance from the anterior superior iliac spine to the superior border of the patella was located, and the ultrasound probe was placed perpendicularly along the superior part of the right thigh to obtain the transverse images of the RF (14).
VFA assessment by BIA
Abdominal VFA was estimated using an Omron DUALSCAN BIA machine (Omron HDS-2000, Kyoto, Japan), which was a multifrequency impedance body composition analyzer. Eight-point tactile electrode method was utilized following the protocol. Resistance at five specific frequencies (1, 50, 250, 500 kHz, and 1 MHz) and reactance at three specific frequencies (5, 50 and 250 kHz) were measured to obtain the reading of VFA (cm2) on the screen. All measurements were performed by the same experienced researcher.
Statistical analysis
Statistical analyses were performed using SPSS version 20.0 (SPSS Inc., Chicago, IL, USA). Descriptive data were expressed as mean ± standard deviation for continuous variables with a normal distribution and as median (interquartile range) for non-normal distribution variables. Categorical variables were summarized using percentage or frequency. Continuous data with normal distribution in different groups were compared using independent sample t test or one-way analysis of variance (ANOVA), whereas the Kruskal–Wallis test was performed for parameters with a skewed distribution. Pearson’s χ2 test was employed to analyze categorical data. Spearman’s correlation analysis was used to explore the association between different prognostic risks of DKD and clinical characteristics (age, duration, TG, HbA1c, RFCSA, and VFA) of patients with T2DM stratified by sex. Multivariate logistic regression was performed to determine the risk factors for high-/very high-risk prognosis of DKD. Furthermore, receiver-operating characteristic (ROC) analysis was performed to determine the optimal cutoff points of diabetes duration, RFCSA and VFA for indicating high/very high prognostic risk of DKD in male and female patients respectively. All statistical analyses were 2-tailed and a P < 0 .05 was considered significant.
Results
Baseline characteristics of patients
In total, 941 T2DM patients underwent screening, and 879 participants were enrolled, as 62 were excluded based on exclusion criteria. Of these subjects, 270 patients (30.72%) were diagnosed with DKD according to KDIGO 2020 Clinical Practice Guideline (23). The patients were stratified into 4 groups according to KDIGO prognostic risk classification (low risk, moderate risk, high risk, and very high risk) (23). The baseline characteristics of the participants enrolled are presented in Table 1. Significant differences in sex (P < 0.05), age (P < 0.001), duration (P < 0.001), SBP (P < 0.001), DBP (P < 0.001), Cr (P < 0.001), BUN (P < 0.001), CysC (P < 0.001), SUA (P < 0.001), TG (P < 0.05), HDL (P < 0.05), HbA1c (P < 0.05), FPG (P < 0.001), FCP (P < 0.001), FINS (P < 0.05), UAER (P < 0.001), and UACR (P < 0.001) were observed among the groups. However, smoking, alcohol consumption, BMI, TC, and LDL displayed nonsignificant differences among the groups. Considering that the muscle content distribution was different between men and women, it was necessary to conduct statistical analysis for each sex. Male or female patients were then divided into two groups: high- to very high-risk and low- to moderate-risk groups. The results showed that RFCSA of the high- to very high-risk group was lower than that of the low- to moderate-risk group (male P < 0.001; female P < 0.05), whereas VFA of the high- to very high-risk group was higher than that of the low- to moderate-risk group (male P < 0.05; female P < 0.05) regardless of sex (Table 2).
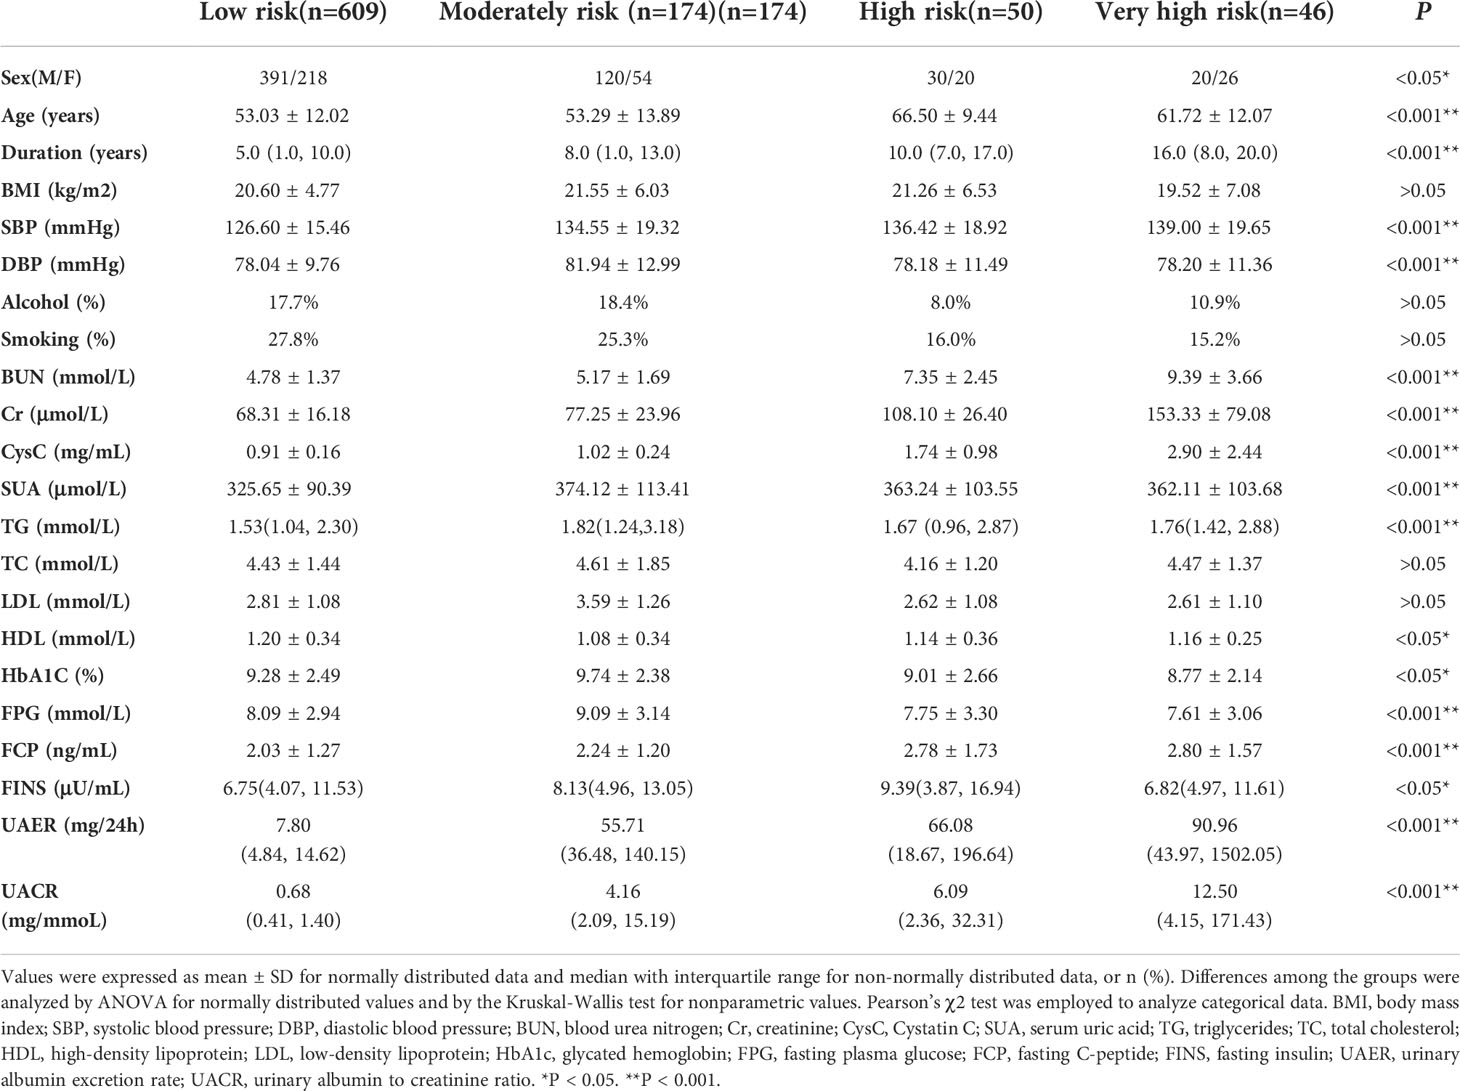
Table 1 Clinical characteristics of T2DM patients with different prognosis risk of DKD.
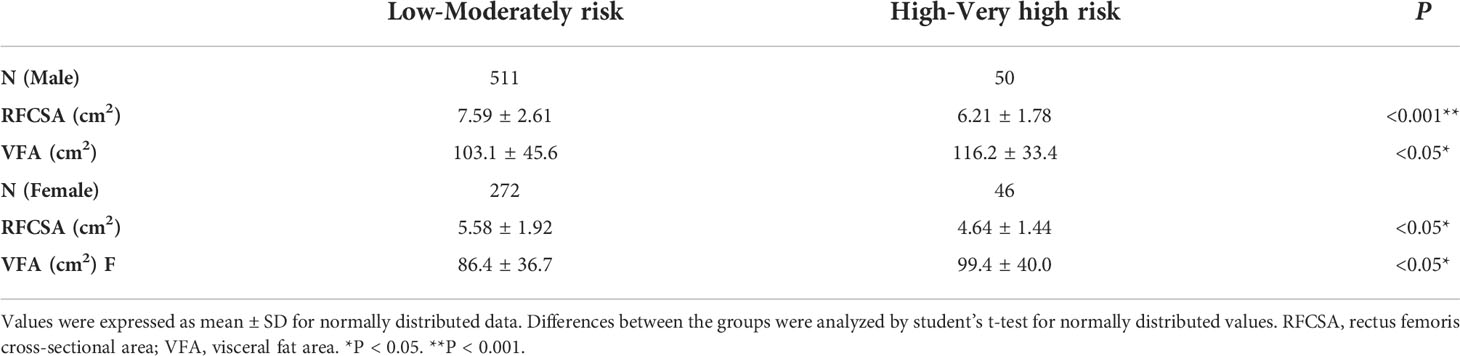
Table 2 RFCSA and VFA of T2DM patients with different prognosis risk of DKD.
Correlation analysis between the prognostic risk of DKD and clinical parameters of patients with T2DM
Spearman’s correlation was conducted to analyze the relationship between the prognostic risk of DKD and clinical parameters of male and female patients separately, and similar findings were noted. The results showed that the prognostic risk of DKD was negatively correlated with RFCSA (male r = − 0.138, P < 0.05; female r = − 0.194, P < 0.05), and positively correlated with age (male r = 0.210, P < 0.001; female r = 0.223, P < 0.001), duration (male r = 0.291, P < 0.001; female r = 0.212, P < 0.001), TG (male r = 0.103, P < 0.05; female r = 0.124, P < 0.05), and VFA (male r = 0.139, P < 0.05; female r = 0.144, P < 0.05). However, no significant association was observed between HbA1c and the prognostic risk of DKD in male or female patients with T2DM (Table 3).
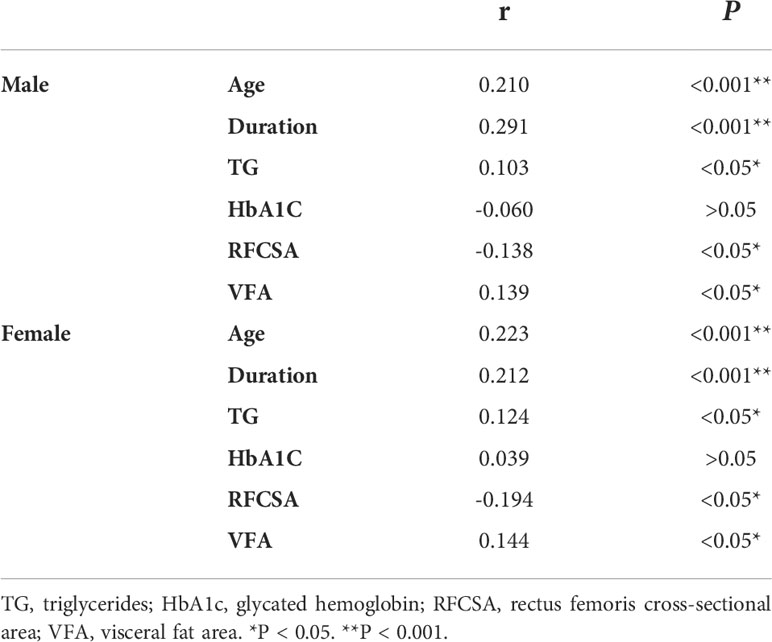
Table 3 Spearman’s correlation analysis of different prognosis risk of DKD with Clinical characteristics in T2DM patients stratified by gender.
Multivariate logistic regression between the prognostic risk of DKD and clinical variables of patients with T2DM
Age and TG were excluded from multivariate logistic regression due to high inter-correlation between age and duration (P < 0.001, data not shown) and between VFA and TG (P < 0.001, data not shown). We performed multivariate logistic regression analysis using the prognostic risk of DKD as dependent variable (high-risk and very high-risk group defined as “1”, and low-risk and moderate-risk group defined as “0”), and duration, RFCSA and VFA as independent variables. As shown in Table 4, duration (β 1.11, 95% CI 1.07–1.16, P < 0.001), RFCSA (β 0.69, 95% CI 0.57–0.83, P < 0.001), and VFA (β 1.01, 95% CI 1.00–1.02, P < 0.05) was found to be significantly associated with high- to very high-risk prognosis of DKD in male patients with T2DM. Similarly, duration (β 1.04, 95% CI 1.01–1.07, P < 0.001), RFCSA (β 0.73, 95% CI 0.59–0.91, P < 0.05), and VFA (β 1.01, 95% CI 1.00–1.02, P < 0.05) was shown to be significantly linked with high- to very high-risk prognosis of DKD in female T2DM patients (Table 4).
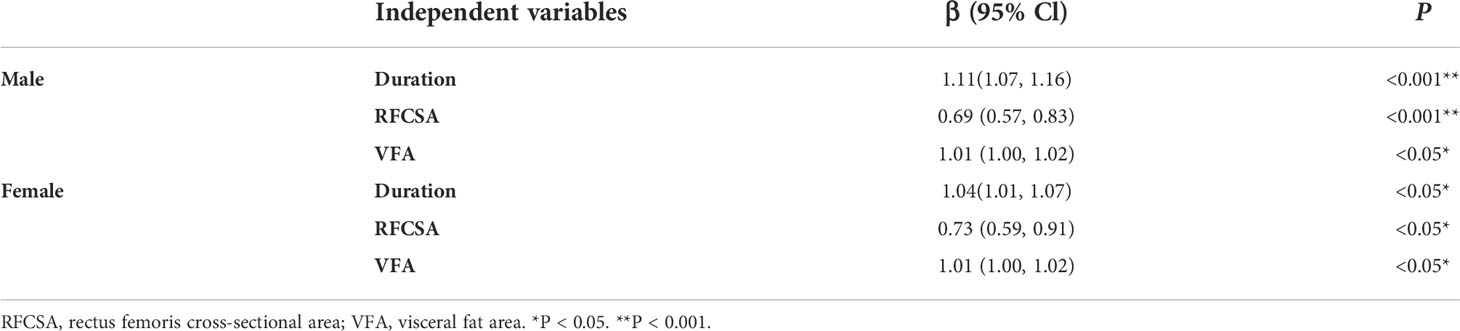
Table 4 Risk factors for high-/very high-risk prognosis of DKD in multivariate logistic regression.
ROC analysis
We performed ROC analysis to investigate the optimal cutoff points for diabetes duration, RFCSA and VFA, which could be used to distinguish a high- to very high-risk prognosis of DKD. Multivariate logistic regression analysis was carried out to assess the predictive capability of the combined parameters of diabetes duration, RFCSA and VFA, which were used as independent variables for multivariable ROC analysis. For T2DM male patients, the cutoff values of diabetes duration, RFCSA and VFA were revealed as 7 years, 6.60 cm2 and 111 cm2, respectively, with an AUC of 0.82 (95% CI: 0.78–0.88), a sensitivity of 78.0%, and a specificity of 68.6% (P < 0.001) (Figure 1 blue). For T2DM female patients, the cutoff of diabetes duration, RFCSA and VFA were 9 years, 5.05 cm2 and 91 cm2, respectively, the AUC was 0.73 (95% CI: 0.66–0.81), the sensitivity was 73.9%, and the specificity was 63.3% (P < 0.001) (Figure 1 green).
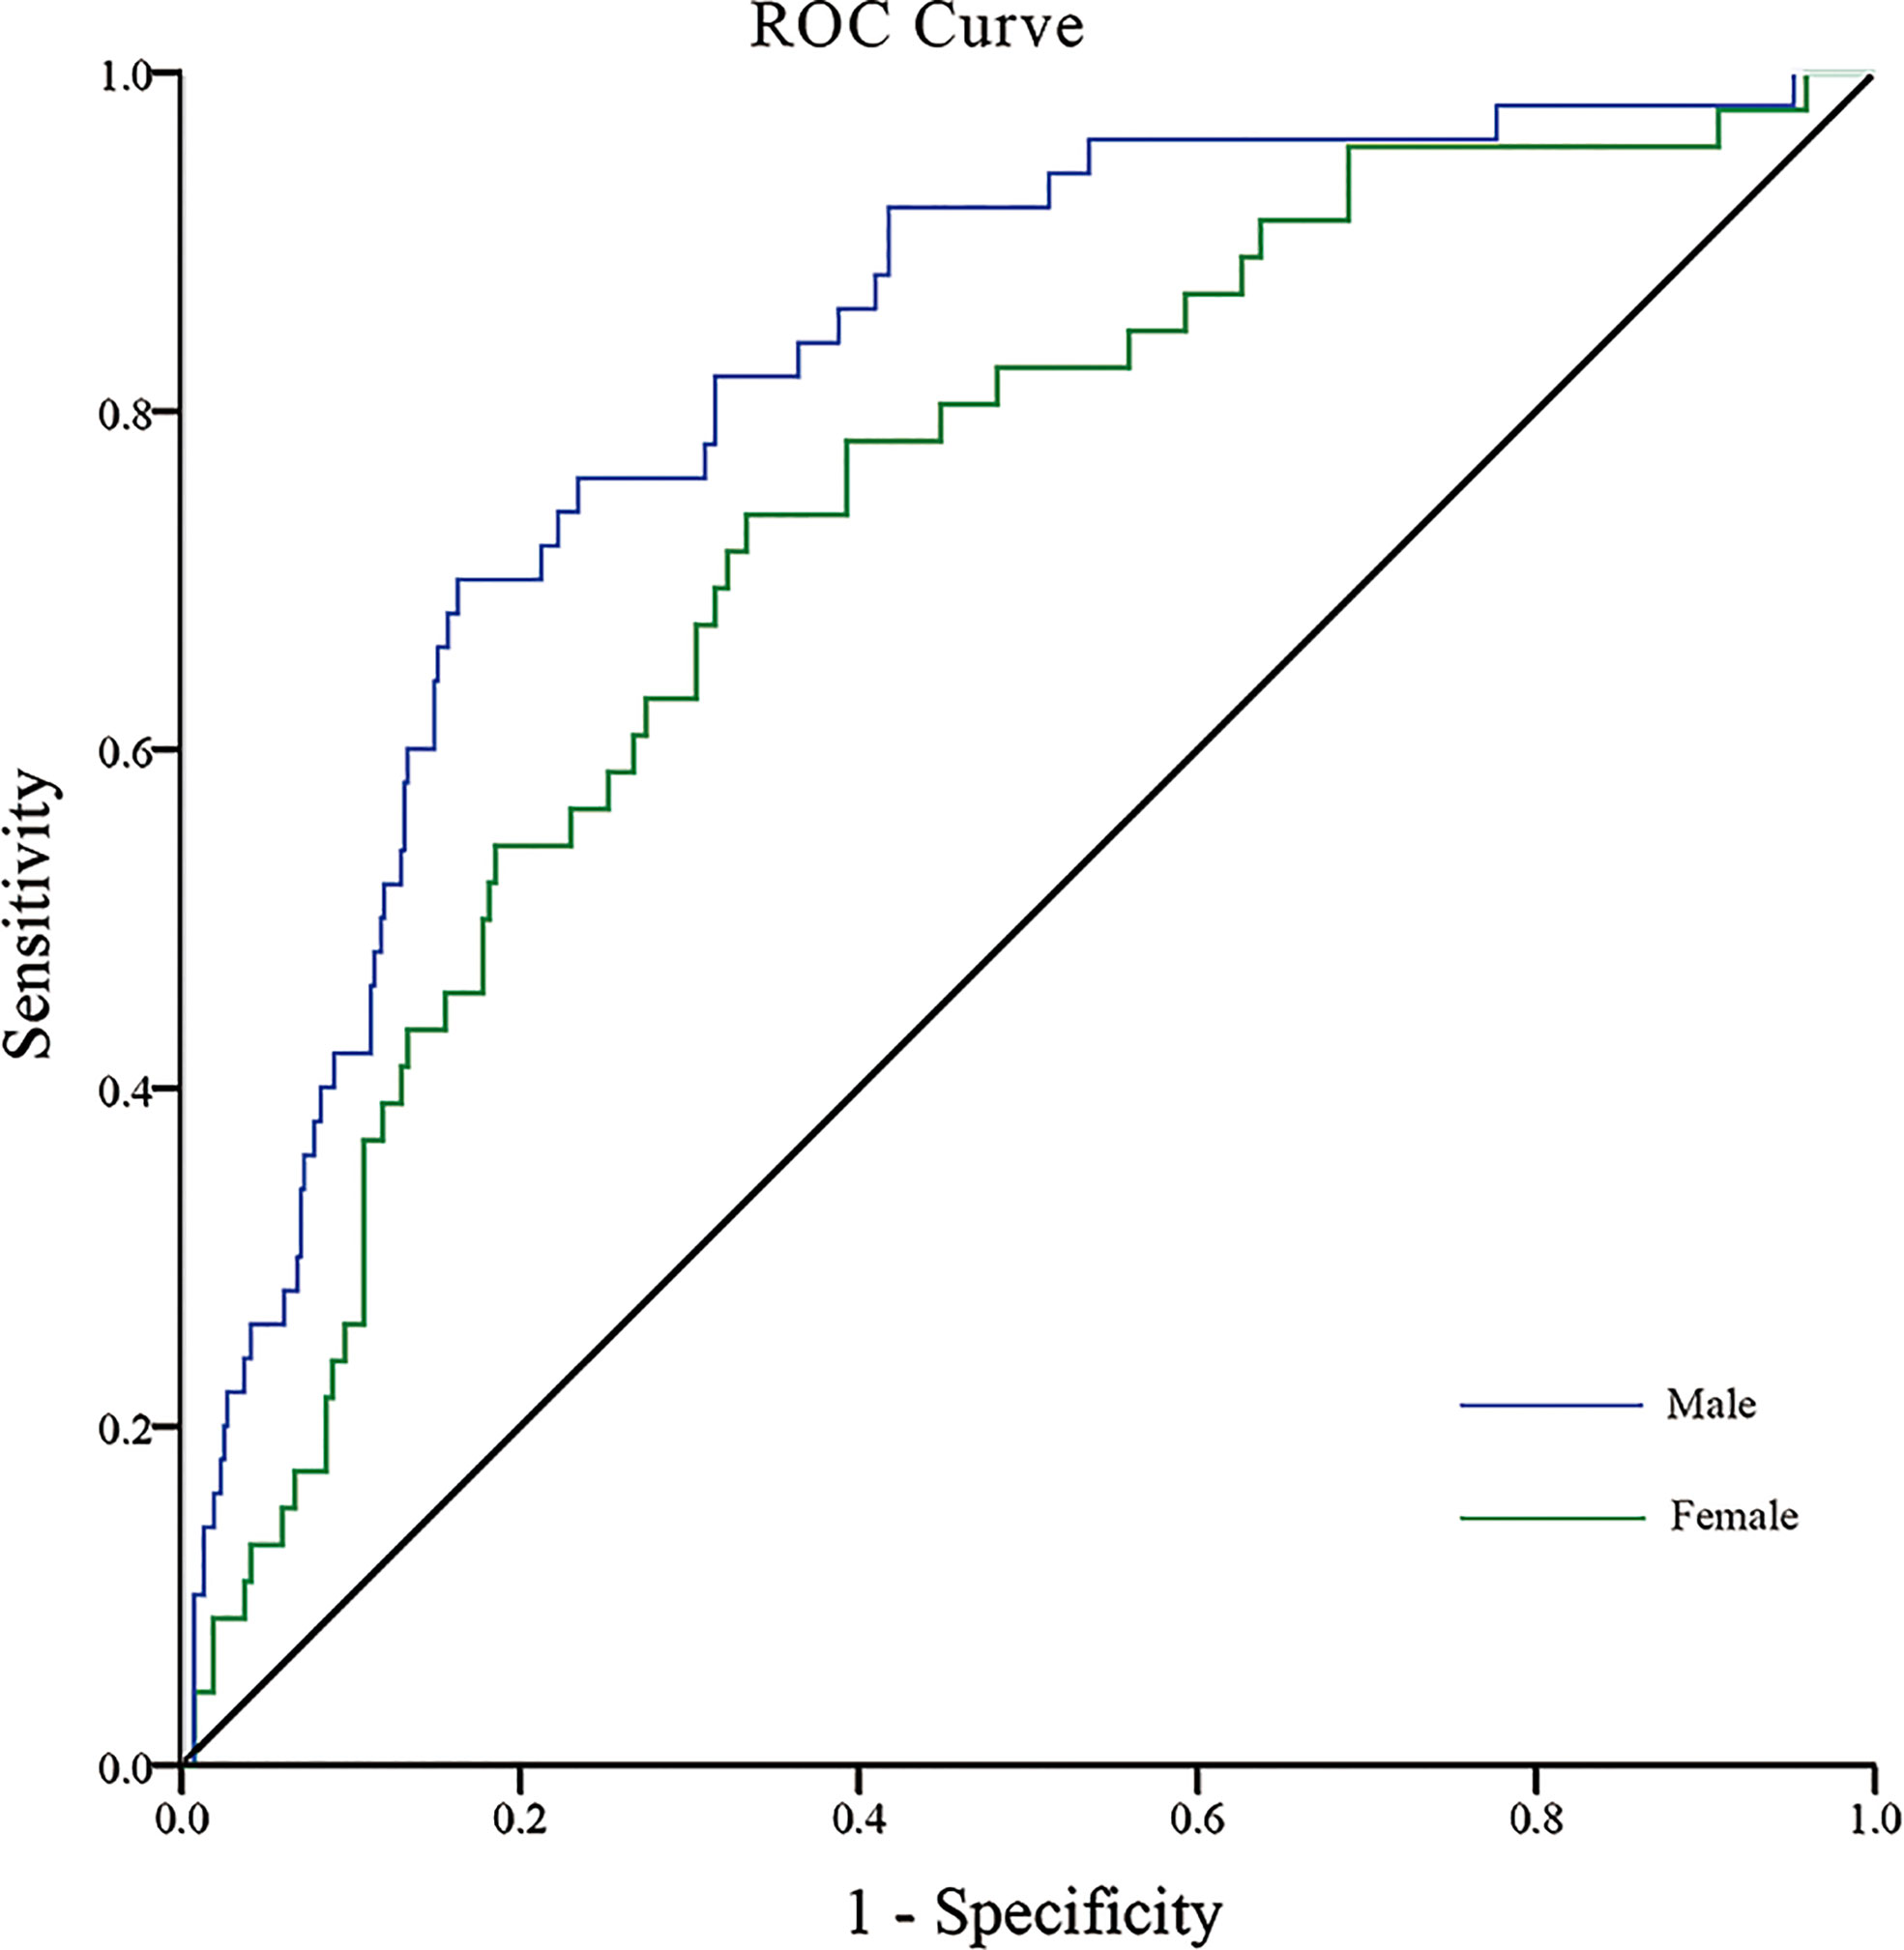
Figure 1 ROC analysis of T2DM duration combined with RFCSA and VFA to predict high-/very high-risk prognosis of DKD in male/female T2DM patients. [Male (blue): AUC=0.82; 95% CI: 0.78–0.88; Sensitivity 78.0%, Specificity 68.6%; P < 0.001] [Female (green): AUC=0.73; 95% CI: 0.66–0.81; Sensitivity 73.9%, Specificity 63.3%, P < 0.001].
Discussion
DKD is a major cause of CKD worldwide and brings enormous economic burden to patients and society (26). In addition to the use of medication to control hyperglycemia and hypertension, modifying other related factors is of great importance for the management of DKD patients. Sarcopenia is a frequent condition reported in CKD patients and is considered to be linked with an increased risk of hospitalization and all-cause mortality (27). Previous studies have shown that sarcopenia reflects progressive and cumulative effects of CKD on skeletal muscle (13, 28). Abdominal obesity is a risk factor for multiple complications of diabetes. Heng Wan et al. showed that abdominal obesity was strongly associated with DKD (29).
In the present study, the patients were divided into two groups (high- to very high-risk group and low- to moderate-risk group) to explore the relationship between RFCSA/VFA and the prognostic risk of DKD. The results showed an obviously reduced RFCSA in the high- to very high-risk group compared with the low- to moderate-risk group. Although sarcopenia has been extensively explored in patients with diabetes or CKD (9, 30, 31), the changes of RFCSA in DKD patients has not yet been reported. Many studies have shown that the incidence rate of sarcopenia in ESKD patients is higher than that in patients with early-stage renal disease, which is consistent with our results (8). Some studies reported that abdominal obesity, compared with general obesity, had a greater impact on the risk of DKD (32, 33). Chin-Hsiao Tseng demonstrated a close and independent association between abdominal obesity and elevated UAER in female patients with diabetes but not in male diabetic patients (34). Our results showed an enlarged VFA in high- to very high-risk male and female DKD patients.
Furthermore, our study showed that the prognostic risk of DKD was positively correlated with age, duration and TG, which were recognized as important factors influencing the progression of DKD. A systematic review and meta-analysis of 20 cohorts comprising 41,271 individuals showed that the independent risk factors for DKD development were duration, age, smoking status, HbA1c, TG, HDL-C, BMI, SBP, UACR, and eGFR (35). In the present study, no relationship was established between HbA1c and DKD, which was different from the conclusions of previous studies (36). This discrepancy could be explained by the fact that HbA1c only reflected glycemic control in the recent 3 months. In addition, another explanation might be that some DKD patients were complicated with renal anemia, resulting in lower HbA1c concentration compared with the actual level.
This study also showed that the prognostic risk of DKD was negatively correlated with RFCSA. The exact underlying mechanism has not been fully elucidated. However, abnormal renal function and hyperglycemia are considered essential factors for sarcopenia in patients with DKD. Firstly, sarcopenic obesity, a combination of sarcopenia and obesity, reflects a vicious link between insulin resistance and sarcopenia. Obesity-induced insulin resistance triggers a series of events that lead to a decrease in muscle glucose supply and quantitative and qualitative deterioration of muscles, further enhancing insulin resistance and creating a vicious cycle (37). Secondly, accumulation of advanced glycation end-products (AGEs) and diabetic vasculopathy may also impair muscle mass and strength, leading to sarcopenia (38–40). Thirdly, with the worsening of renal function, sarcopenia occurs due to accelerated protein catabolism, and reduced energy and protein intake during dialysis (8).
The relationship between DKD and abdominal obesity was investigated in many previous studies. A meta-analysis, including 2205 patients with VFA measurements from 3 cross-sectional studies, demonstrated that VFA was associated with greater odds of DKD in patients with type 2 diabetes (34). Asakawa H et al. showed that VFA level was significantly higher in patients with DKD than those without DKD (41). However, some studies showed the contradictory conclusions. Man et al. (42) found that abdominal obesity had no association with DKD in patients with T2DM. Therefore, the relationship between abdominal obesity and DKD deserves further investigation. The present study found that VFA was positively correlated with the prognostic risk of DKD. Although the mechanisms underlying the linking between DKD and abdominal obesity are still unclear, several hypotheses may be proposed. Firstly, excessive visceral fat accumulation leads to systemic inflammation, which may contribute to a cascade of events such as insulin resistance, oxidative stress, and renal damage (43, 44). Secondly, the renin–angiotensin system (RAS) is activated by adipose tissue, which changes sodium retention and renal hemodynamics, ultimately leading to renal damage (45, 46). Thirdly, other metabolic syndromes that are associated with obesity also play an important role in the occurrence and development of DKD (47, 48).
Based on the results of this study, we suggested that the loss of lower-limb muscle mass and the increase in VFA were closely related to the progression of DKD. The prognostic risk of DKD was high or very high for male T2DM patients, with a duration of more than 7 years, a RFCSA of less than 6.60 cm2, and a VFA of more than 111 cm2. The prognostic risk of DKD was also high or very high for female T2DM patients, with a duration being more than 9 years, a RFCSA being less than 5.05 cm2, and a VFA being more than 91 cm2. Therefore, we speculated that the modified lifestyle to increase skeletal muscle mass and reduce visceral fat accumulation might delay the progression of DKD in patients with T2DM.
This study had some limitations. Firstly, certain confounding factors, such as the level of physical activity and the use of anti-diabetes medication, might also influence the results of the study. Secondly, the current conclusion was summarized from a cross-sectional trial. Thirdly, VFA was measured using a novel BIA device that has yet only received limited validation (49) rather than a more accurate and reliable method such as computed tomography (CT).
Conclusions
The lower-limb muscle mass of T2DM patients decreased whereas VFA increased with the progression of DKD. The prognostic risk of DKD was negatively correlated with RFCSA but positively correlated with VFA. T2DM duration, RFCSA and VFA were found to be markers of DKD progression. Based on the conclusion of this study, for patients who have not developed DKD or are in the early stage of DKD, individualized lifestyle guidance (including diet and exercise) and reasonable hypoglycemic medicine selection should be given to increase muscle content and reduce abdominal fat, which may delay the occurrence and progress of DKD. In the future, cohort study and fundamental research are needed to verify the viewpoint and further explore relevant mechanisms.
Data availability statement
The original contributions presented in the study are included in the article/supplementary material. Further inquiries can be directed to the corresponding author.
Ethics statement
The studies involving human participants were reviewed and approved by Medical ethics committee of Shenzhen Hospital, Southern Medical University (Approval No. NYSZYYEC20200035). The patients/participants provided their written informed consent to participate in this study.
Author contributions
Each author has made an important scientific contribution to the study and is thoroughly familiar with the primary data. XL and ZC carried out the clinical studies, participated in the statistical analysis and drafted the manuscript. HH and JZ carried out the data acquisition, participated in the manuscript preparation and literature research. LX conceived of the study, and participated in its design and helped to review the manuscript. All authors listed have read the complete manuscript and have approved submission of the paper.
Funding
This study was supported by grant from the National Natural Science Foundation of China (No. 82270895), Science and Technology Planning Project of Shenzhen (No. JCYJ20210324130204011) and Young Scientific Talents Research Project of China Endocrine and Metabolism (No.2021-N-03).
Conflict of interest
The authors declare that the research was conducted in the absence of any commercial or financial relationships that could be construed as a potential conflict of interest.
Publisher’s note
All claims expressed in this article are solely those of the authors and do not necessarily represent those of their affiliated organizations, or those of the publisher, the editors and the reviewers. Any product that may be evaluated in this article, or claim that may be made by its manufacturer, is not guaranteed or endorsed by the publisher.
References
1. Samsu N. Diabetic nephropathy: Challenges in pathogenesis, diagnosis, and treatment. BioMed Res Int (2021) 2021:1497449. doi: 10.1155/2021/1497449
2. Zheng Y, Ley SH, Hu FB. Global aetiology and epidemiology of type 2 diabetes mellitus and its complications. Nat Rev Endocrinol (2018) 14(2):88–98. doi: 10.1038/nrendo.2017.151
3. Professional practice committee: Standards of medical care in diabetes-2018. Diabetes Care (2018) 41(Suppl 1):S3. doi: 10.2337/dc18-Sppc01
4. Chen T, Harris DC. Challenges of chronic kidney disease prevention. Med J Aust (2015) 203(5):209–10. doi: 10.5694/mja15.00241
5. Kim KM, Jang HC, Lim S. Differences among skeletal muscle mass indices derived from height-, weight-, and body mass index-adjusted models in assessing sarcopenia. Korean J Internal Med (2016) 31(4):643–50. doi: 10.3904/kjim.2016.015
6. Cruz-Jentoft AJ, Baeyens JP, Bauer JM, Boirie Y, Cederholm T, Landi F, et al. Sarcopenia: European consensus on definition and diagnosis: Report of the European working group on sarcopenia in older people. Age Ageing (2010) 39(4):412–23. doi: 10.1093/ageing/afq034
7. Scott D, de Courten B, Ebeling PR. Sarcopenia: A potential cause and consequence of type 2 diabetes in australia's ageing population? Med J Aust (2016) 205(7):329–33. doi: 10.5694/mja16.00446
8. Sabatino A, Cuppari L, Stenvinkel P, Lindholm B, Avesani CM. Sarcopenia in chronic kidney disease: What have we learned so far? J Nephrol (2021) 34(4):1347–72. doi: 10.1007/s40620-020-00840-y
9. Nishikawa H, Fukunishi S, Asai A, Yokohama K, Ohama H, Nishiguchi S, et al. Sarcopenia, frailty and type 2 diabetes mellitus (Review). Mol Med Rep (2021) 24(6):854. doi: 10.3892/mmr.2021.12494
10. Anagnostis P, Gkekas NK, Achilla C, Pananastasiou G, Taouxidou P, Mitsiou M, et al. Type 2 diabetes mellitus is associated with increased risk of sarcopenia: A systematic review and meta-analysis. Calcif Tissue Int (2020) 107(5):453–63. doi: 10.1007/s00223-020-00742-y
11. Cruz-Jentoft AJ, Bahat G, Bauer J, Boirie Y, Bruyère O, Cederholm T, et al. Sarcopenia: Revised European consensus on definition and diagnosis. Age Ageing (2019) 48(1):16–31. doi: 10.1093/ageing/afy169
12. Chen LK, Liu LK, Woo J, Assantachai P, Auyeung TW, Bahyah KS, et al. Sarcopenia in Asia: Consensus report of the Asian working group for sarcopenia. J Am Med Dir Assoc (2014) 15(2):95–101. doi: 10.1016/j.jamda.2013.11.025
13. Gould DW, Watson EL, Wilkinson TJ, Wormleighton J, Xenophontos S, Viana JL, et al. Ultrasound assessment of muscle mass in response to exercise training in chronic kidney disease: A comparison with mri. J cachexia sarcopenia Muscle (2019) 10(4):748–55. doi: 10.1002/jcsm.12429
14. Mueller N, Murthy S, Tainter CR, Lee J, Riddell K, Fintelmann FJ, et al. Can sarcopenia quantified by ultrasound of the rectus femoris muscle predict adverse outcome of surgical intensive care unit patients as well as frailty? a prospective, observational cohort study. Ann Surg (2016) 264(6):1116–24. doi: 10.1097/sla.0000000000001546
15. Kodama S, Horikawa C, Fujihara K, Yoshizawa S, Yachi Y, Tanaka S, et al. Quantitative relationship between body weight gain in adulthood and incident type 2 diabetes: A meta-analysis. Obes Rev an Off J Int Assoc Study Obes (2014) 15(3):202–14. doi: 10.1111/obr.12129
16. Bogers RP, Bemelmans WJ, Hoogenveen RT, Boshuizen HC, Woodward M, Knekt P, et al. Association of overweight with increased risk of coronary heart disease partly independent of blood pressure and cholesterol levels: A meta-analysis of 21 cohort studies including more than 300 000 persons. Arch Internal Med (2007) 167(16):1720–8. doi: 10.1001/archinte.167.16.1720
17. Alicic RZ, Patakoti R, Tuttle KR. Direct and indirect effects of obesity on the kidney. Adv chronic Kidney Dis (2013) 20(2):121–7. doi: 10.1053/j.ackd.2012.12.006
18. Gabbay E, Slotki I, Shavit L. Weighing the evidence: Obesity, metabolic syndrome, and the risk of chronic kidney disease. BMC Nephrol (2015) 16:133. doi: 10.1186/s12882-015-0137-y
19. Lebovitz HE, Banerji MA. Point: Visceral adiposity is causally related to insulin resistance. Diabetes Care (2005) 28(9):2322–5. doi: 10.2337/diacare.28.9.2322
20. Wander PL, Boyko EJ, Leonetti DL, McNeely MJ, Kahn SE, Fujimoto WY. Change in visceral adiposity independently predicts a greater risk of developing type 2 diabetes over 10 years in Japanese americans. Diabetes Care (2013) 36(2):289–93. doi: 10.2337/dc12-0198
21. Alberti KG, Zimmet PZ. Definition, diagnosis and classification of diabetes mellitus and its complications. part 1: Diagnosis and classification of diabetes mellitus provisional report of a who consultation. Diabetic Med J Br Diabetic Assoc (1998) 15(7):539–53. doi: 10.1002/(sici)1096-9136(199807)15:7<539::aid-dia668>3.0.co;2-s
22. Levey AS, Stevens LA, Schmid CH, Zhang YL, Castro AF 3rd, Feldman HI, et al. A new equation to estimate glomerular filtration rate. Ann Internal Med (2009) 150(9):604–12. doi: 10.7326/0003-4819-150-9-200905050-00006
23. Kidney Disease: Improving Global Outcomes (KDIGO) Diabetes Work Group. Kdigo 2020 clinical practice guideline for diabetes management in chronic kidney disease. Kidney Int (2020) 98(4s):S1–s115. doi: 10.1016/j.kint.2020.06.019
24. Seymour JM, Ward K, Sidhu PS, Puthucheary Z, Steier J, Jolley CJ, et al. Ultrasound measurement of rectus femoris cross-sectional area and the relationship with quadriceps strength in copd. Thorax (2009) 64(5):418–23. doi: 10.1136/thx.2008.103986
25. Shrikrishna D, Patel M, Tanner RJ, Seymour JM, Connolly BA, Puthucheary ZA, et al. Quadriceps wasting and physical inactivity in patients with copd. Eur Respir J (2012) 40(5):1115–22. doi: 10.1183/09031936.00170111
26. Collins AJ, Foley RN, Herzog C, Chavers B, Gilbertson D, Ishani A, et al. Us renal data system 2010 annual data report. Am J Kidney Dis (2011) 57(1 Suppl 1):A8. doi: 10.1053/j.ajkd.2010.10.007
27. Noce A, Marrone G, Ottaviani E, Guerriero C, Di Daniele F, Pietroboni Zaitseva A, et al. Uremic sarcopenia and its possible nutritional approach. Nutrients (2021) 13(1):147. doi: 10.3390/nu13010147
28. Kaltsatou A, Sakkas GK, Poulianiti KP, Koutedakis Y, Tepetes K, Christodoulidis G, et al. Uremic myopathy: Is oxidative stress implicated in muscle dysfunction in uremia? Front Physiol (2015) 6:102. doi: 10.3389/fphys.2015.00102
29. Wan H, Wang Y, Xiang Q, Fang S, Chen Y, Chen C, et al. Associations between abdominal obesity indices and diabetic complications: Chinese visceral adiposity index and neck circumference. Cardiovasc Diabetol (2020) 19(1):118. doi: 10.1186/s12933-020-01095-4
30. Umegaki H. Sarcopenia and frailty in older patients with diabetes mellitus. Geriatr gerontol Int (2016) 16(3):293–9. doi: 10.1111/ggi.12688
31. Watanabe H, Enoki Y, Maruyama T. Sarcopenia in chronic kidney disease: Factors, mechanisms, and therapeutic interventions. Biol Pharm Bull (2019) 42(9):1437–45. doi: 10.1248/bpb.b19-00513
32. Blaslov K, Bulum T, Duvnjak L. Waist-to-Height ratio is independently associated with chronic kidney disease in overweight type 2 diabetic patients. Endocr Res (2015) 40(4):194–8. doi: 10.3109/07435800.2014.987868
33. Hanai K, Babazono T, Nyumura I, Toya K, Ohta M, Bouchi R, et al. Involvement of visceral fat in the pathogenesis of albuminuria in patients with type 2 diabetes with early stage of nephropathy. Clin Exp Nephrol (2010) 14(2):132–6. doi: 10.1007/s10157-009-0245-8
34. Zhao Q, Yi X, Wang Z. Meta-analysis of the relationship between abdominal obesity and diabetic kidney disease in type 2 diabetic patients. Obes facts (2021) 14(4):338–45. doi: 10.1159/000516391
35. Jiang W, Wang J, Shen X, Lu W, Wang Y, Li W, et al. Establishment and validation of a risk prediction model for early diabetic kidney disease based on a systematic review and meta-analysis of 20 cohorts. Diabetes Care (2020) 43(4):925–33. doi: 10.2337/dc19-1897
36. Macisaac RJ, Ekinci EI, Jerums G. Markers of and risk factors for the development and progression of diabetic kidney disease. Am J Kidney Dis (2014) 63(2 Suppl 2):S39–62. doi: 10.1053/j.ajkd.2013.10.048
37. Chen H, Ma J, Liu A, Cui Y, Ma X. The association between sarcopenia and fracture in middle-aged and elderly people: A systematic review and meta-analysis of cohort studies. Injury (2020) 51(4):804–11. doi: 10.1016/j.injury.2020.02.072
38. Chiu CY, Yang RS, Sheu ML, Chan DC, Yang TH, Tsai KS, et al. Advanced glycation end-products induce skeletal muscle atrophy and dysfunction in diabetic mice Via a rage-mediated, ampk-Down-Regulated, akt pathway. J Pathol (2016) 238(3):470–82. doi: 10.1002/path.4674
39. Moon SS. Low skeletal muscle mass is associated with insulin resistance, diabetes, and metabolic syndrome in the Korean population: The Korea national health and nutrition examination survey (Knhanes) 2009-2010. Endocr J (2014) 61(1):61–70. doi: 10.1507/endocrj.ej13-0244
40. Cleasby ME, Jamieson PM, Atherton PJ. Insulin resistance and sarcopenia: Mechanistic links between common Co-morbidities. J Endocrinol (2016) 229(2):R67–81. doi: 10.1530/joe-15-0533
41. Asakawa H, Tokunaga K, Kawakami F. Relationship of abdominal fat with metabolic disorders in diabetes mellitus patients. Diabetes Res Clin Pract (2002) 55(2):139–49. doi: 10.1016/s0168-8227(01)00294-7
42. Man REK, Gan ATL, Fenwick EK, Gupta P, Wong MYZ, Wong TY, et al. The relationship between generalized and abdominal obesity with diabetic kidney disease in type 2 diabetes: A multiethnic Asian study and meta-analysis. Nutrients (2018) 10(11):1685. doi: 10.3390/nu10111685
43. Hall ME, do Carmo JM, da Silva AA, Juncos LA, Wang Z, Hall JE. Obesity, hypertension, and chronic kidney disease. Int J Nephrol renovasc Dis (2014) 7:75–88. doi: 10.2147/ijnrd.s39739
44. Lv X, Zhou W, Sun J, Lin R, Ding L, Xu M, et al. Visceral adiposity is significantly associated with type 2 diabetes in middle-aged and elderly Chinese women: A cross-sectional study. J Diabetes (2017) 9(10):920–8. doi: 10.1111/1753-0407.12499
45. Hall JE, Henegar JR, Dwyer TM, Liu J, Da Silva AA, Kuo JJ, et al. Is obesity a major cause of chronic kidney disease? Adv Renal replace Ther (2004) 11(1):41–54. doi: 10.1053/j.arrt.2003.10.007
46. Wahba IM, Mak RH. Obesity and obesity-initiated metabolic syndrome: Mechanistic links to chronic kidney disease. Clin J Am Soc Nephrol CJASN (2007) 2(3):550–62. doi: 10.2215/cjn.04071206
47. Hirano T, Satoh N, Kodera R, Hirashima T, Suzuki N, Aoki E, et al. Dyslipidemia in diabetic kidney disease classified by proteinuria and renal dysfunction: A cross-sectional study from a regional diabetes cohort. J Diabetes Invest (2022) 13(4):657–67. doi: 10.1111/jdi.13697
48. Radcliffe NJ, Seah JM, Clarke M, MacIsaac RJ, Jerums G, Ekinci EI. Clinical predictive factors in diabetic kidney disease progression. J Diabetes Invest (2017) 8(1):6–18. doi: 10.1111/jdi.12533
49. Yamakage H, Ito R, Tochiya M, Muranaka K, Tanaka M, Matsuo Y, et al. The utility of dual bioelectrical impedance analysis in detecting intra-abdominal fat area in obese patients during weight reduction therapy in comparison with waist circumference and abdominal ct. Endocr J (2014) 61(8):807–19. doi: 10.1507/endocrj.ej14-0092
Keywords: Sarcopenia, abdominal obesity, visceral fat area, diabetic kidney disease, type 2 diabetes mellitus
Citation: Lin X, Chen Z, Huang H, Zhong J and Xu L (2022) Diabetic kidney disease progression is associated with decreased lower-limb muscle mass and increased visceral fat area in T2DM patients. Front. Endocrinol. 13:1002118. doi: 10.3389/fendo.2022.1002118
Received: 24 July 2022; Accepted: 20 September 2022;
Published: 06 October 2022.
Edited by:
Maria Margherita Rando, Agostino Gemelli University Polyclinic (IRCCS), ItalyReviewed by:
Leigh C Ward, The University of Queensland, AustraliaGuido Gembillo, University of Messina, Italy
Jianping Liu, Second Affiliated Hospital of Nanchang University, China
Copyright © 2022 Lin, Chen, Huang, Zhong and Xu. This is an open-access article distributed under the terms of the Creative Commons Attribution License (CC BY). The use, distribution or reproduction in other forums is permitted, provided the original author(s) and the copyright owner(s) are credited and that the original publication in this journal is cited, in accordance with accepted academic practice. No use, distribution or reproduction is permitted which does not comply with these terms.
*Correspondence: Lingling Xu, bHVjeWxpbmdsQDEyNi5jb20=
†These authors have contributed equally to this work