 Ana Ramos-Levi1†
 Ana Barabash2,3,4†
 Johanna Valerio2
 Nuria García de la Torre2,4*
 Leire Mendizabal5
 Mirella Zulueta5
 Maria Paz de Miguel2,3
 Angel Diaz2,3Alejandra Duran2,3
 Cristina Familiar2
 Inés Jimenez2
 Laura del Valle2
 Veronica Melero2
 Inmaculada Moraga2Miguel A. Herraiz6
 María José Torrejon7
 Maddi Arregi5
 Laureano Simón5
 Miguel A. Rubio2,3
 Alfonso L. Calle-Pascual2,3,4*
- 1Endocrinology and Nutrition Department, Hospital Universitario de la Princesa, Instituto de Investigación Princesa, Universidad Autónoma de Madrid, Madrid, Spain
- 2Endocrinology and Nutrition Department, Hospital Clínico Universitario San Carlos and Instituto de Investigación Sanitaria del Hospital Clínico San Carlos (IdISSC), Madrid, Spain
- 3Facultad de Medicina. Medicina II Department, Universidad Complutense de Madrid, Madrid, Spain
- 4Centro de Investigación Biomédica en Red de Diabetes y Enfermedades Metabólicas Asociadas (CIBERDEM), Madrid, Spain
- 5Patia Europe, Clinical Laboratory, San Sebastián, Spain
- 6Gynecology and Obstetrics Department, Hospital Clínico Universitario San Carlos and Instituto de Investigación Sanitaria del Hospital Clínico San Carlos (IdISSC), Madrid, Spain
- 7Clinical Laboratory Department Hospital Clínico Universitario San Carlos and Instituto de Investigación Sanitaria del Hospital Clínico San Carlos (IdISSC), Madrid, Spain
Hypothesis: Gestational diabetes mellitus (GDM) entails a complex underlying pathogenesis, with a specific genetic background and the effect of environmental factors. This study examines the link between a set of single nucleotide polymorphisms (SNPs) associated with diabetes and the development of GDM in pregnant women with different ethnicities, and evaluates its potential modulation with a clinical intervention based on a Mediterranean diet.
Methods: 2418 women from our hospital-based cohort of pregnant women screened for GDM from January 2015 to November 2017 (the San Carlos Cohort, randomized controlled trial for the prevention of GDM ISRCTN84389045 and real-world study ISRCTN13389832) were assessed for evaluation. Diagnosis of GDM was made according to the International Association of Diabetes and Pregnancy Study Groups (IADPSG) criteria. Genotyping was performed by IPLEX MassARRAY PCR using the Agena platform (Agena Bioscience, SanDiego, CA). 110 SNPs were selected for analysis based on selected literature references. Statistical analyses regarding patients’ characteristics were performed in SPSS (Chicago, IL, USA) version 24.0. Genetic association tests were performed using PLINK v.1.9 and 2.0 software. Bioinformatics analysis, with mapping of SNPs was performed using STRING, version 11.5.
Results: Quality controls retrieved a total 98 SNPs and 1573 samples, 272 (17.3%) with GDM and 1301 (82.7%) without GDM. 1104 (70.2%) were Caucasian (CAU) and 469 (29.8%) Hispanic (HIS). 415 (26.4%) were from the control group (CG), 418 (26.6%) from the nutritional intervention group (IG) and 740 (47.0%) from the real-world group (RW). 40 SNPs (40.8%) presented some kind of significant association with GDM in at least one of the genetic tests considered. The nutritional intervention presented a significant association with GDM, regardless of the variant considered. In CAU, variants rs4402960, rs7651090, IGF2BP2; rs1387153, rs10830963, MTNR1B; rs17676067, GLP2R; rs1371614, DPYSL5; rs5215, KCNJ1; and rs2293941, PDX1 were significantly associated with an increased risk of GDM, whilst rs780094, GCKR; rs7607980, COBLL1; rs3746750, SLC17A9; rs6048205, FOXA2; rs7041847, rs7034200, rs10814916, GLIS3; rs3783347, WARS; and rs1805087, MTR, were significantly associated with a decreased risk of GDM, In HIS, variants significantly associated with increased risk of GDM were rs9368222, CDKAL1; rs2302593, GIPR; rs10885122, ADRA2A; rs1387153, MTNR1B; rs737288, BACE2; rs1371614, DPYSL5; and rs2293941, PDX1, whilst rs340874, PROX1; rs2943634, IRS1; rs7041847, GLIS3; rs780094, GCKR; rs563694, G6PC2; and rs11605924, CRY2 were significantly associated with decreased risk for GDM.
Conclusions: We identify a core set of SNPs in their association with diabetes and GDM in a large cohort of patients from two main ethnicities from a single center. Identification of these genetic variants, even in the setting of a nutritional intervention, deems useful to design preventive and therapeutic strategies.
Introduction
Gestational diabetes mellitus (GDM), defined as diabetes newly diagnosed in the second or third trimester of pregnancy, and was not clearly overt diabetes prior to gestation (1), is a frequent gestational metabolic complication that has become a major public health issue. Its prevalence has significantly increased in parallel with increasing rates of obesity, older age at pregnancy, and the implementation of the International Association of the Diabetes and Pregnancy Study Groups criteria (IADPSG criteria) (2). GDM is associated with adverse maternal and neonatal outcomes and an increased risk for the future development of type 2 diabetes both in the mother and the offspring (1, 2), so strategies for early detection and prevention, and interventions to control maternal glucose levels have become a priority.
The complex underlying pathogenesis of GDM includes a specific genetic background and the effect of environmental factors. Although there is still much to be known regarding the underlying mechanisms responsible for the development of GDM, several modifiable and non-modifiable factors have been acknowledged; for instance, increased adiposity, lifestyle, ethnicity, increased maternal age, polycystic ovary syndrome or a family history for type 2 diabetes. Regarding the genetic background, several genetic polymorphisms have been identified as potentially associated with an increased risk of developing GDM, most of them overlapping with those associated with the risk of type 2 diabetes. However, there is still controversy on the true impact of genetic polymorphisms on the risk of these metabolic alterations, and whether this increased risk could be modulated by clinical interventions such as diet. In previous studies (3, 4) we found that an early nutritional intervention with a supplemented Mediterranean diet (MedDiet) reduces the incidence of GDM and, consequently, our hospital recommended the adoption of this nutritional intervention to all pregnant women.
The objective of this study is to examine the link between a set of single nucleotide polymorphisms (SNPs) associated with diabetes and GDM, according to different bibliographical references, and the development of GDM in pregnant women of different ethnicities, in the setting of a clinical intervention based on the MedDiet.
Methods
Study population
The study population originates from our hospital-based cohort of pregnant women screened for GDM from January 2015 to November 2017 (the San Carlos Cohort, randomized controlled trial (RCT) for the prevention of GDM registered December 4, 2013 at ISRCTN84389045 (DOI 10.1186/ISRCTN84389045) and real-world study, registered October 11th, 2016 at ISRCTN13389832 (DOI 10.1186/ISRCTN13389832) (3, 4) with approval by the Clinical Trials Committee of the Hospital Clínico San Carlos (July 17, 2013, CI 13/296-E and October 1st, 2016, CI16/442-E, respectively), and compliance with the Declaration of Helsinki). The central location of our hospital and its relatively large reference healthcare population of around 445,000 implied that our study sample could adequately represent the population living in our country.
Figure 1 shows the CONSORT 2010 flowchart of our study population. From January 2015 to November 2017, a total of 2418 women who attended their first gestational visit (at 8 ± 2 gestational weeks (GW), in which the first ultrasound is performed and analytical screening for chromosomal alterations is carried out), with fasting plasma glucose (FPG) < 92 mg/dL, were assessed for the clinical trial. Inclusion criteria were ≥18 years old, singleton gestation, and willingness to participate in the study. Exclusion criteria comprised gestational age at entry >14 weeks, pre-gestational diabetes, diseases affecting carbohydrate metabolism, intolerance to nuts or extra-virgin olive oil (EVOO), and medical conditions or pharmacological therapy that could compromise the effect of the intervention and/or the follow-up program. All patients included signed a written informed consent.
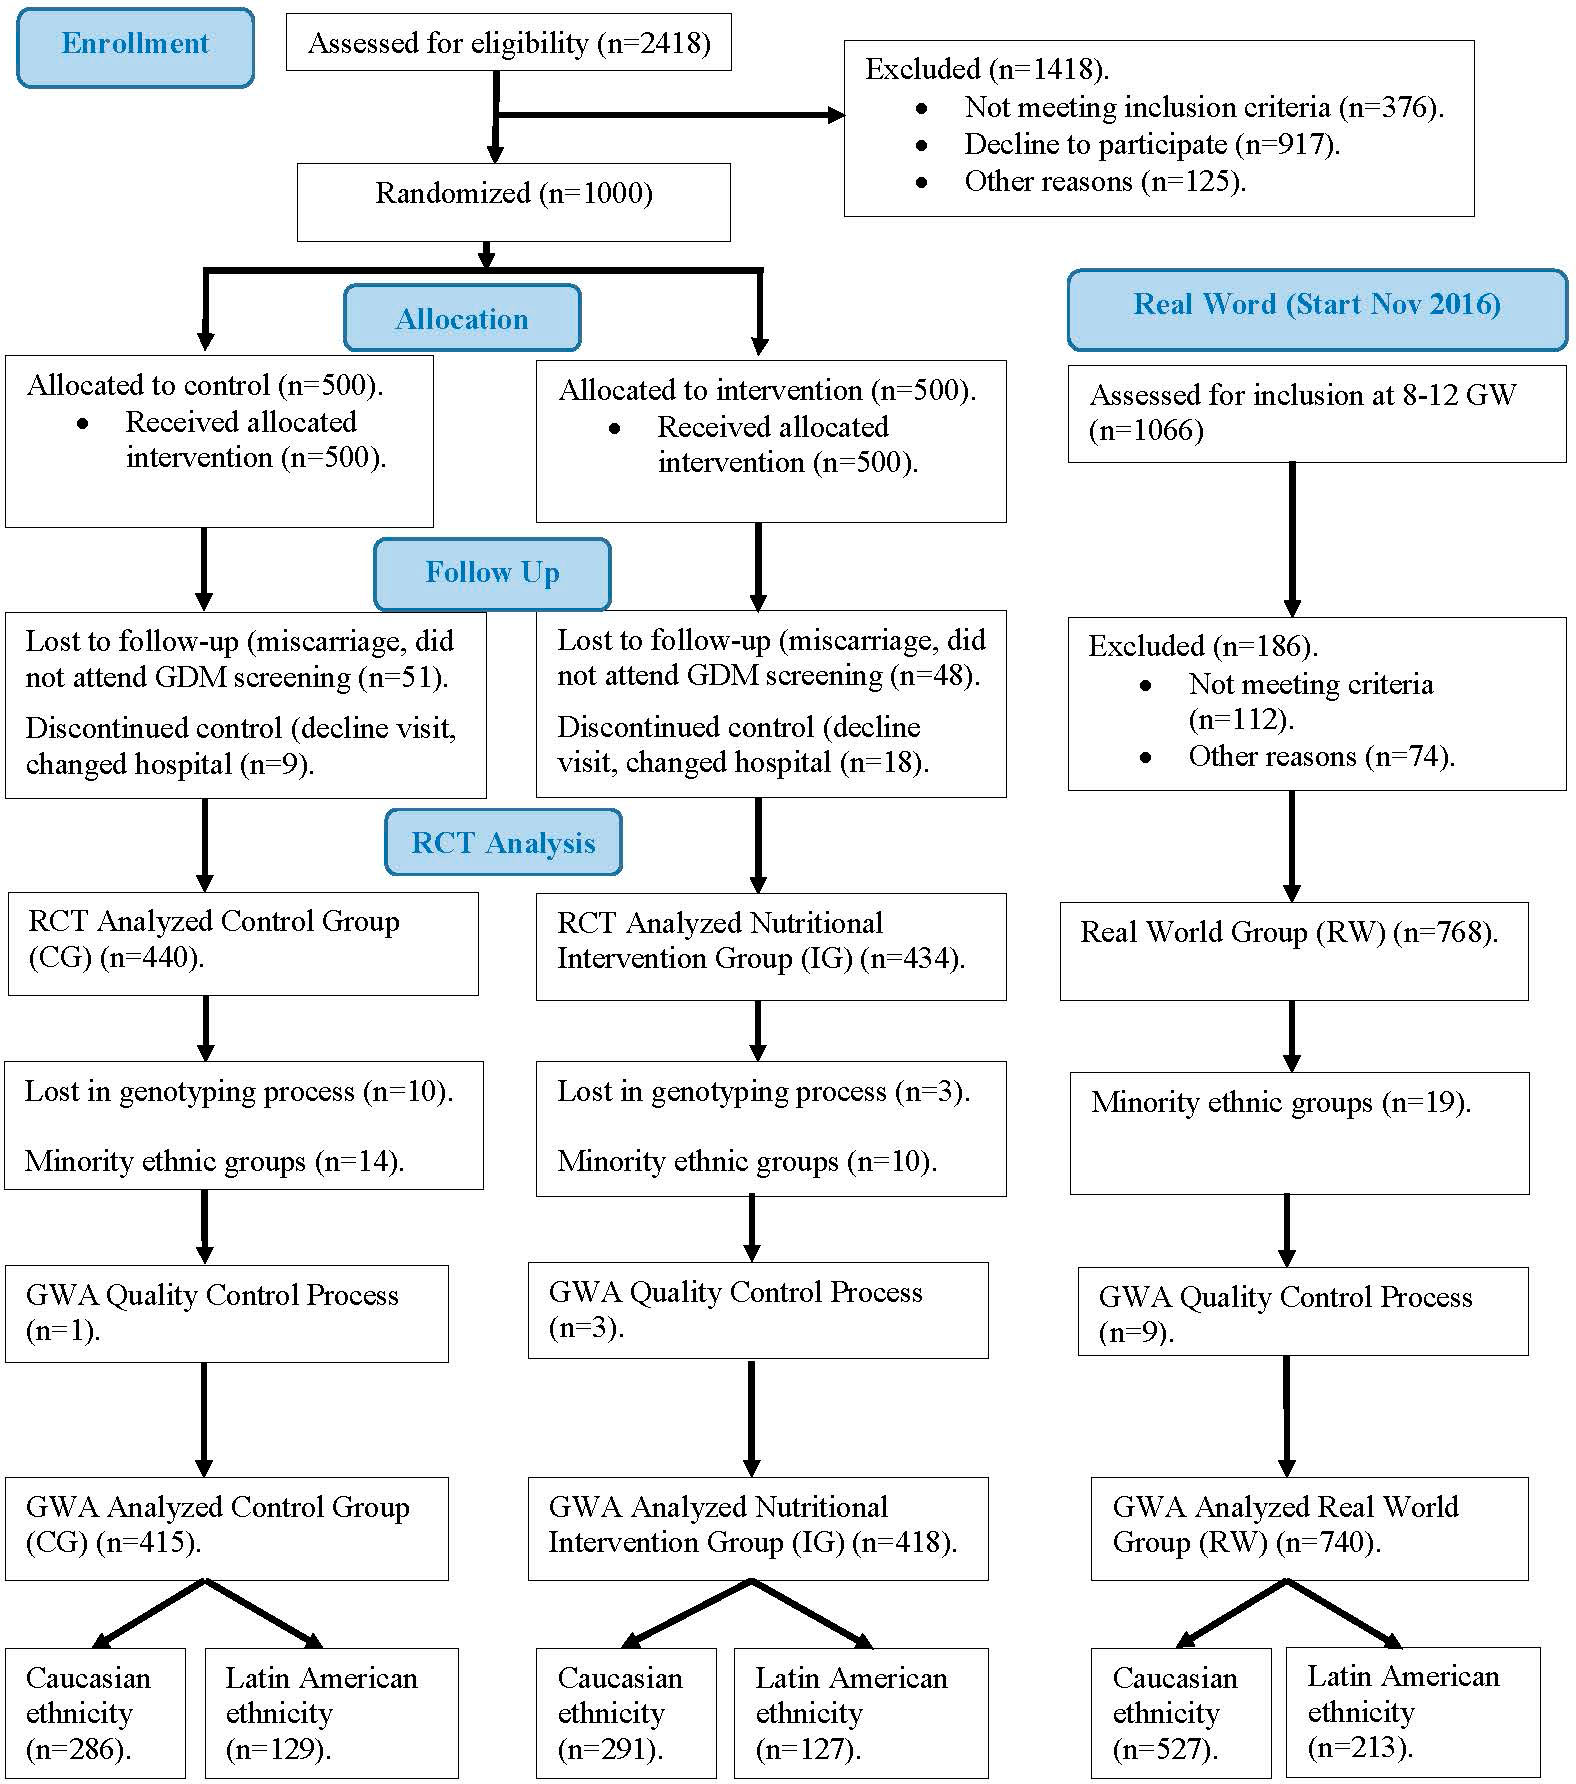
Figure 1 Flow diagram of women included in our study.
A sample of 1000 women was selected and randomly divided into two groups of the same size, control group (CG) and intervention group (IG), according to two nutritional intervention models. The same basic MedDiet and daily exercise habits were recommended for both groups. Participants allocated to IG received lifestyle guidance from dieticians one week after inclusion in a unique 1-hour group session. The key IG recommendation was a daily consumption of at least 40 mL of EVOO and a handful (25-30g) of pistachios. To ensure the consumption of the minimum amount recommended, women were provided with 20 L of EVOO and 4 Kg of roasted pistachios. Women in the CG were advised by midwives to restrict consumption of dietary fat, including EVOO and nuts. These recommendations are provided in local antenatal clinics as part of the available guidelines in pregnancy standard care (5). The first women was included on January 2nd, 2015 and the last one was included on December 27th, 2015. The follow up until delivery on July 2016. The study was completed by 874 women (440/434, CG/IG). This group is the initial sub-cohort of this paper.
The aforementioned RCT concluded that an early nutritional intervention with a supplemented MedDiet reduces the incidence of GDM (3). Based on these results, our hospital recommended the adoption of this nutritional intervention (i.e., MedDiet enriched with EVOO and nuts), without providing these specific products, to all pregnant women, from the beginning of gestation, in real word (4). Thus, from November 2016 onwards, every pregnant woman who attended the first gestational visit were invited to participate in our study based on the implementation of the RCT results in clinical practice. The last women included on November 30, 2017 was follow up until delivery on July 2018. In accordance with the inclusion and exclusion criteria indicated above, a new sub-cohort (real-world group, RW) was defined, with 768 samples that are included in this study.
Ethnicity of participants includes mainly Caucasian and Hispanic, as well as some minority ethnicities (Chinese, African and others). Given the characteristics of this study, samples corresponding to these minority ethnic groups were excluded. Therefore, samples from 1586 pregnant women were available and were used for this study. The characteristics of patients included in the study are displayed in Table 1.
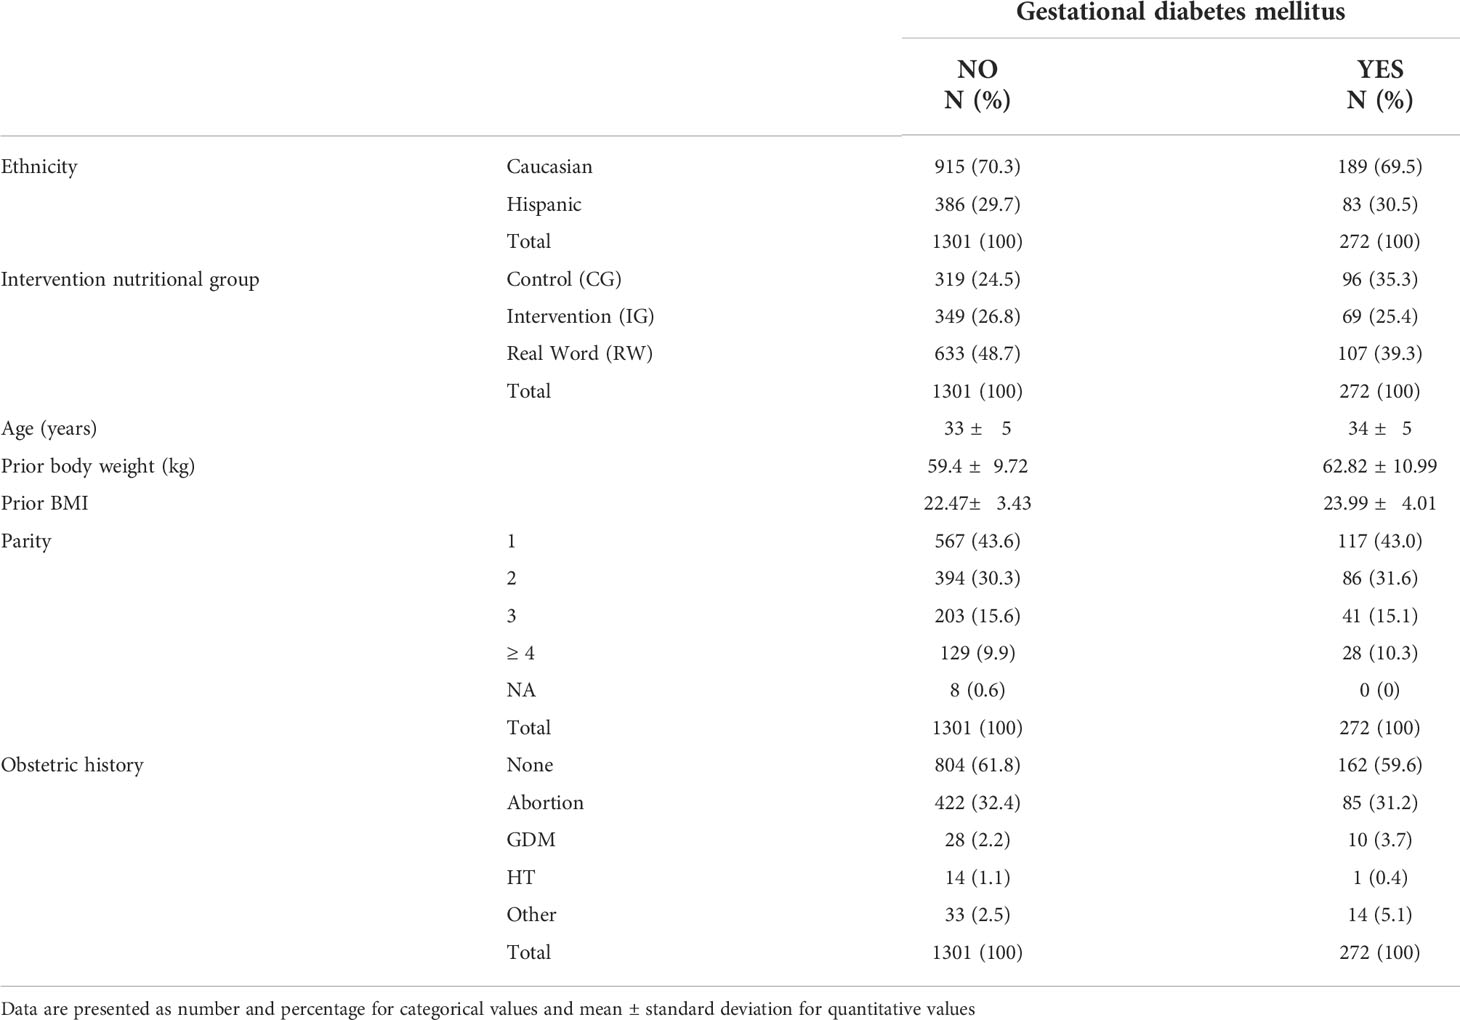
Table 1 Main characteristics of patients included in the study.
Patient data collection
Data regarding clinical, demographic and anthropometric characteristics was collected from medical records and follow-up visits. Specifically, we collected information on maternal age, ethnicity, gestational week at the time of the oral glucose tolerance test (OGTT), body mass index, family history of type 2 diabetes, past medical history of GDM, past obstetric history and parity, gestational weight gain, associated comorbidities, and the newborn’s birthweight.
Diagnosis of gestational diabetes mellitus
A 2-hour OGTT with 75-g glucose was performed at 24-28 weeks of gestation. FPG levels were determined by the glucose oxidase method in fresh plasma samples. The International Association of Diabetes and Pregnancy Study Groups (IADPSG) criteria were used for the diagnosis of GDM (2).
Genotype analysis
Genomic DNA was extracted from EDTA-stabilized blood samples taken during the OGTT using the Maxwell RSC instrument (Promega, Dubendorf, Switzerland).
Genotyping was performed by IPLEX MassARRAY PCR using the Agena platform (Agena Bioscience, SanDiego, CA). IPLEX MassARRAY PCR and extension primers were designed from sequences containing each target SNP and 150 upstream and downstream bases with AssayDesign Suite (http://agenabio.com/assay-design-suite-20-software) using the default settings. Single base extension reactions were performed on the PCR reactions with the iPLEX Gold Kit (AgenaBioscience) and 0.8µl of the custom UEP pool. The kit contains mass modified terminator nucleotides that increase the mass difference between extended UEPs, allowing for greater accuracy in genotyping. The mass difference with unmodified terminator nucleotides ranges from 9 to 40 kDa, depending on the two nucleotides compared. With the mass-modified terminator nucleotides the mass difference increases to 16–80 kDa. The single base extension reactions were cycled with a nested PCR protocol that used five cycles of annealing and extension nested with a denaturation step in a cycle that was repeated 40 times for a total of 200 annealing and extension steps. The goal was to extend nearly all of the UEPs. Following single base extension, the reactions were diluted with 16µl of water and deionized with 6 ng of resin. After deionizing for 20 min the reactions were dispensed onto SpectroChipArrays with a Nanodispenser (Agena Bioscience). The speed of dispensation was optimized to deliver an average of 20 nl of each reaction to a matrix pad on the SpectroChip. An Agena Bioscience Compact MassArray Spectrometer was used to perform MALDI-TOF mass spectrometry according to the iPLEX Gold Application Guide. The Typer 4 software package (Agena Bioscience) was used to analyze the resulting spectra and the composition of the target bases was determined from the mass of each extended oligo. These panels were designed in collaboration with PATIA and Genotyping was performed at the Agena platform located at the Epigenetics and Genotyping laboratory, Central Unit for Research in Medicine (UCIM), Faculty of Medicine, University of Valencia, Valencia, Spain.
Selection of SNPs
The 110 single-nucleotide polymorphisms were based on literature references (6–12). Specifically, SNPs were prioritized according to the results of large meta-analysis of genome-wide association studies (GWAS) performed in European and other populations, and with the presumption that their effects can be extrapolated and generalized, and that large sample sizes allow solid estimations of the true size effect. Allele frequencies were considered to maximize the SNPs’ predictive power (effect size x allele frequency). In addition, significant SNPs identified in smaller association studies were also included. As a result, the selected SNPs for analysis fulfilled the following criteria: odds ratio (OR) >1.2, Rare Allele Frequency (RAF) >0.20 and Association Statistical Significance of p <1 × 10⁻⁵ (Supplementary Table 1).
GWA quality control
Quality control steps removed participants with a high missing genotype rate (MIND >5%, 13 samples), removed SNPs with a high missing genotype data (GENO > 5%, 1 variant), removed SNPs due to Hardy-Weinberg exact test (HWE, p < 1 × 10⁻⁶, 7 variants), and removed SNPs due to allele low frequency threshold (MAF < 5%, 4 variants). As a result, our data warehouse included 1573 women and 98 SNPs, with a total genotyping rate of 0.996544 (Supplementary Table 1).
Statistical analysis
Statistical analyses regarding patients’ characteristics were performed in SPSS (Chicago, IL, USA) version 24.0. Data are presented as mean ± standard deviation or median and interquartile range according to the normality of their distribution. χ2 test was used to compare qualitative characteristics and quantitative characteristics were assessed with Student’s t-test. A two-sided p-value <0.05 was considered statistically significant.
The association between each SNP and GDM risk was evaluated by genetic binary logistic regression models. All genetic association tests were performed using PLINK v.1.9 and 2.0 software (13). Specifically, we used the following models and tests: ADDITIVE model – test ADD; DOMINANT model – test DOM; RECESSIVE model – test REC and HETHOM model -test HOM and HET.
In all the logistic regression models, a variable was added to represent the nutritional intervention group [GROUP]. We defined this variable with values 1, 2 and 3 corresponding respectively to the CG, IF and RW groups of Figure 1. The reference group for the logistic regression model was the CG group.
The analysis was carried out by stratifying the sample by ethnicity, according to the two categories present in the data: Caucasian (CAU) and Hispanic (HIS). The allele indicated in the previous literature was taken as the reference allele (REF). In the logistic regression models, the minor allele (A1) was always taken as the base category, meaning that it can be a risk allele when OR > 1 or a protective allele when OR < 1. For each test of a model, the corresponding p-value was obtained using the PLINK software. As false discovery rate control (FDR), we started with the set of p-values and then we calculated the q-values (i.e. minimum FDR incurred when calling a test significant) and lfdr-values (local false discovery rate, i.e. the empirical Bayesian posterior probability that the null hypothesis is true, conditional on the observed p-value) using the qvalue package (version 2.24.0) of R software (version 4.1.2) (14), with smoother method option and adjustment of lambda parameter in the interval 0.01-0.95 with increment of 0.01 (14). As association significance criteria we used the following thresholds: p-value ≤ 0.05, q-value ≤ 0.05, lfdr-value ≤ 0.1.
Bioinformatics analysis
We mapped each SNP to its nearest corresponding protein-coding gene and then we performed gene ontology (GO) enrichment analysis and protein–protein interaction (PPI) analysis for the set of SNPs that reached significance in any of the criteria indicated above. The analysis was performed using STRING, version 11.5 (15).
Results
Patient data and SNP data
Quality controls retrieved a total 98 SNPs and 1573 samples, 272 (17.3%) with GDM and 1301 (82.7%) without GDM. 1104 (70.2%) were Caucasian (CAU) and 469 (29.8%) Hispanic (HIS). 415 (26.4%) were from the control group (CG), 418 (26.6%) from the nutritional intervention group (IG) and 740 (47.0%) from the real-world group (RW). Women’s main demographic and anthropometric characteristics are represented in Table 1. Table 2a CAU and 2b HIS show the main characteristics of the variants for the Caucasian and Hispanic ethnicities, respectively.

Table 2 CAU Characteristics of variants. CAUCASIAN.

Table 2 HIS Characteristics of variants. HISPANIC.
Supplementary Tables 2 CAU-2HIS show, respectively, for each ethnicity, logistic regression analysis performed for the 98 SNPs and 1573 samples. Tables 3a CAU and 3b HIS extract, respectively, the main relevant findings for the two ethnic strata considered; specifically, these tables show the SNPs for which a discovery (p-value ≤0.05, or q-value ≤ 0.05, or lfdr ≤ 0.1) was obtained in at least one of the SNP genetic tests performed.
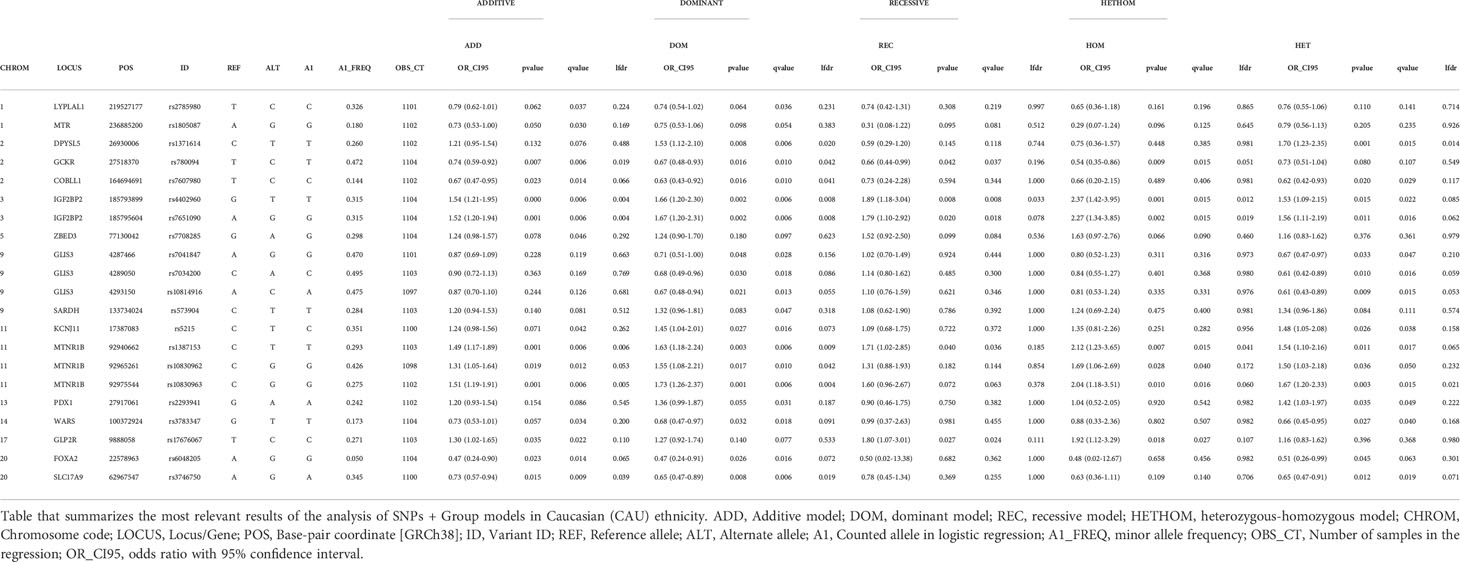
Table 3 CAU (SNP + GROUP) MODELS. SIGNIFICANT SNPs. CAUCASIAN.
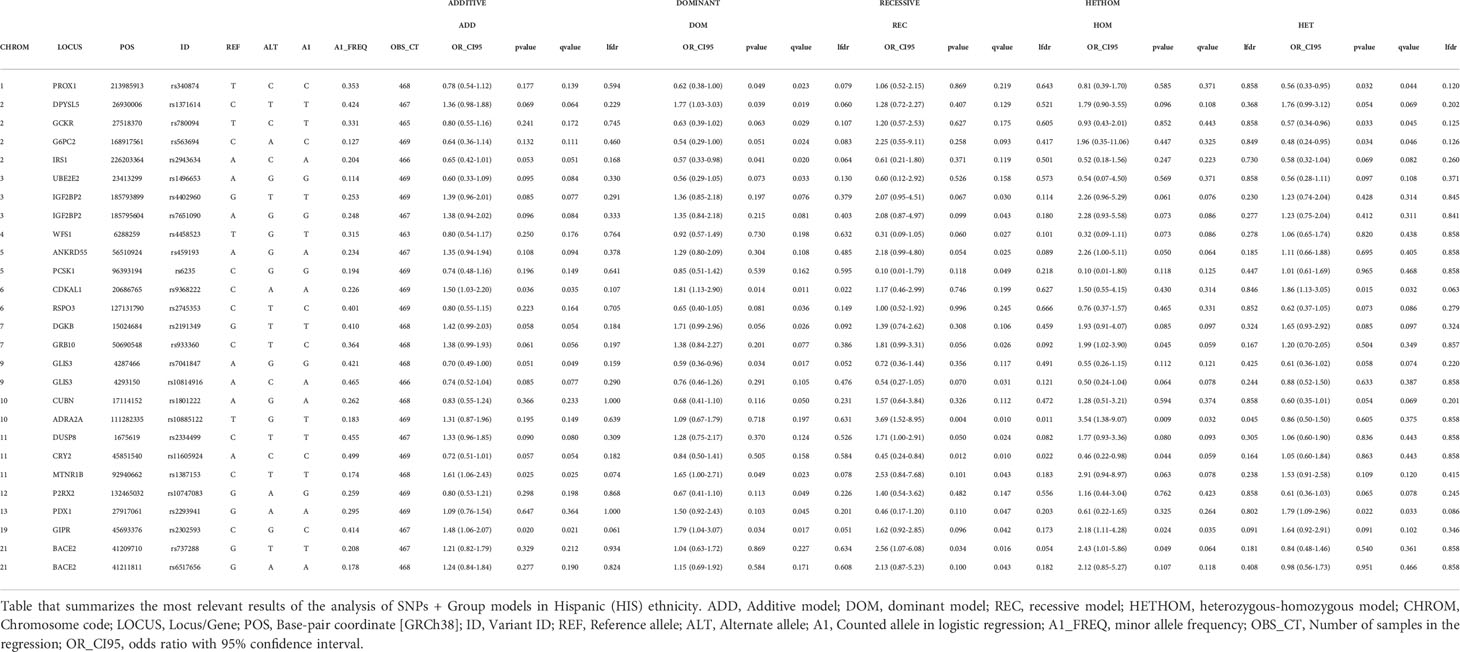
Table 3 HIS (SNP + GROUP) MODELS. SIGNIFICANT SNPs. HISPANIC.
General findings and effect of the nutritional intervention
Of a total of 110 variants included in the study, 98 (89.1%) passed the quality control. Of these, 40 (40.8%) presented some kind of significant association with GDM in at least one of the genetic tests considered, that is, the corresponding threshold was reached in some assessment criteria, with the following distribution by ethnicity: 13 (32.5%) only in the Caucasian ethnic stratum, 19 (47.5%) only in the Hispanic ethnic stratum and 8 (20.0%) in both ethnic strata (Table 3a CAU, 3b HISP). The nutritional intervention presented a significant association with GDM, regardless of the variant considered; we obtained an OR < 1 for GROUP variable in favor of MedDiet, with all the significance criteria satisfied in practically all the tests of each model (Supplementary Tables 1CAU and 1HIS).
Caucasian ethnicity findings
Table 3a CAU summarizes the most relevant findings for Caucasian pregnant women. The genetic variants significantly associated with increased risk of GDM were rs4402960, rs7651090, IGF2BP2; rs1387153, rs10830963, rs10830962, MTNR1B; rs17676067, GLP2R, rs1371614, DPYSL5; rs5215, KCNJ11; and rs2293941, PDX1. Variants significantly associated with decreased risk of GDM were rs780094, GCKR; rs7607980, COBLL1; rs3746750, SLC17A9; rs6048205, FOXA2; rs7041847, rs7034200, rs10814916, GLIS3; rs3783347, WARS; and rs1805087, MTR.
Hispanic ethnicity findings
Table 3b HIS summarizes the most relevant findings for Hispanic pregnant women. The genetic variants significantly associated with increased risk of GDM were rs9368222, CDKAL1; rs2302593, GIPR; rs10885122, ADRA2A; rs1387153, MTNR1B; rs737288, BACE2; rs1371614, DPYSL5; and rs2293941, PDX1. Variants significantly associated with decreased risk for GDM were rs340874, PROX1; rs2943634, IRS1; rs7041847, GLIS3; rs780094, GCKR; rs563694, G6PC2; and rs11605924, CRY2.
OR and p and q-values can be seen in the tables.
Additional findings
There are some variants for which some indication of association with GDM was obtained, but the results were not conclusive. Specifically, for CAU we can point to variants rs2785980 (LYPLAL1), rs7708285 (ZBED3) and rs573904 (SARDH), while for HIS we can point to variants rs1496653 (UBE2E2), rs4402960 (IGF2BP2), rs7651090 (IGF2BP2), rs4458523 (WFS1), rs459193 (ANKRD55), rs6235 (PCSK1), rs2745353 (RSPO3), rs2191349 (DGKB), rs933360 (GRB10), rs10814916 (GLIS3), rs1801222 (CUBN), rs2334499 (DUSP8), rs10747083 (P2RX2) and rs6517656 (BACE2) (Table 3a CAU and Table 3b HISP).
Bioinformatics analysis results
The 40 variants that presented some type of association with GDM were mapped to the closest gene/locus, resulting in a total of 34 encoding proteins that were used as STRING input data (Supplementary Table 3). Basic settings of analysis were: full STRING network, edges indicate both functional and physical protein associations, evidence as meaning of network edges, all active interaction sources, medium confidence (0.400) as minimum required interaction score. The complete results provided by the software can be found in Supplementary Table 4. The aspects that were considered most relevant to the objective of the work were selected by inspection so that Supplementary Table 5. Table 4 displayed the bioinformatic analysis of relevant results, and the graph in Figure 2 were obtained.
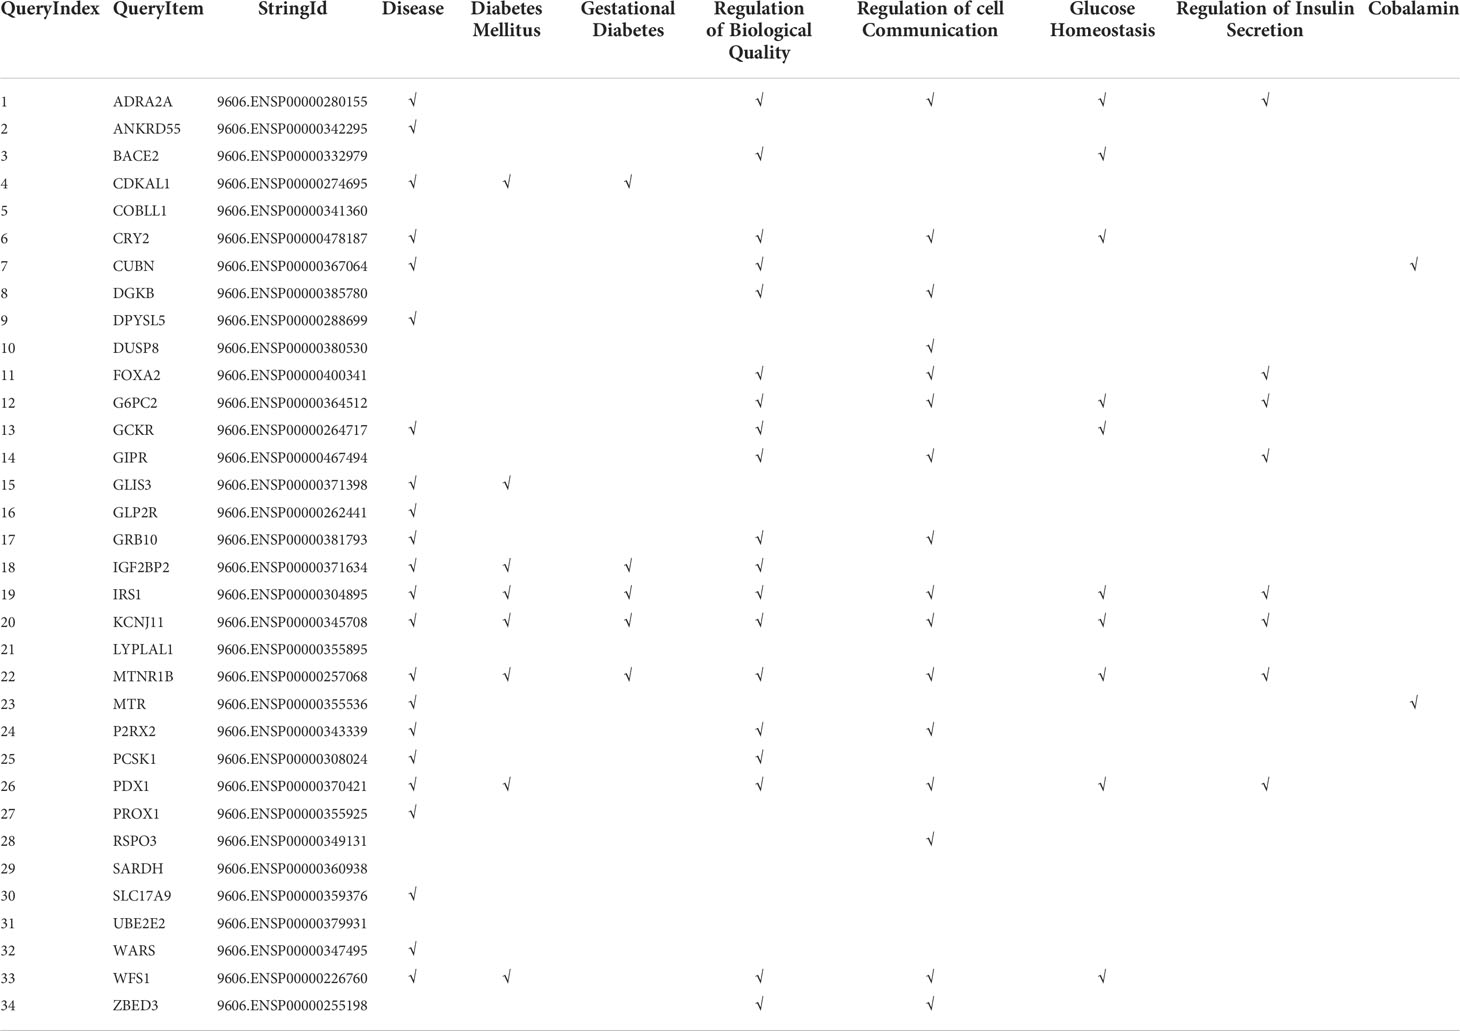
Table 4 Bioinformatic analysis relevant results.
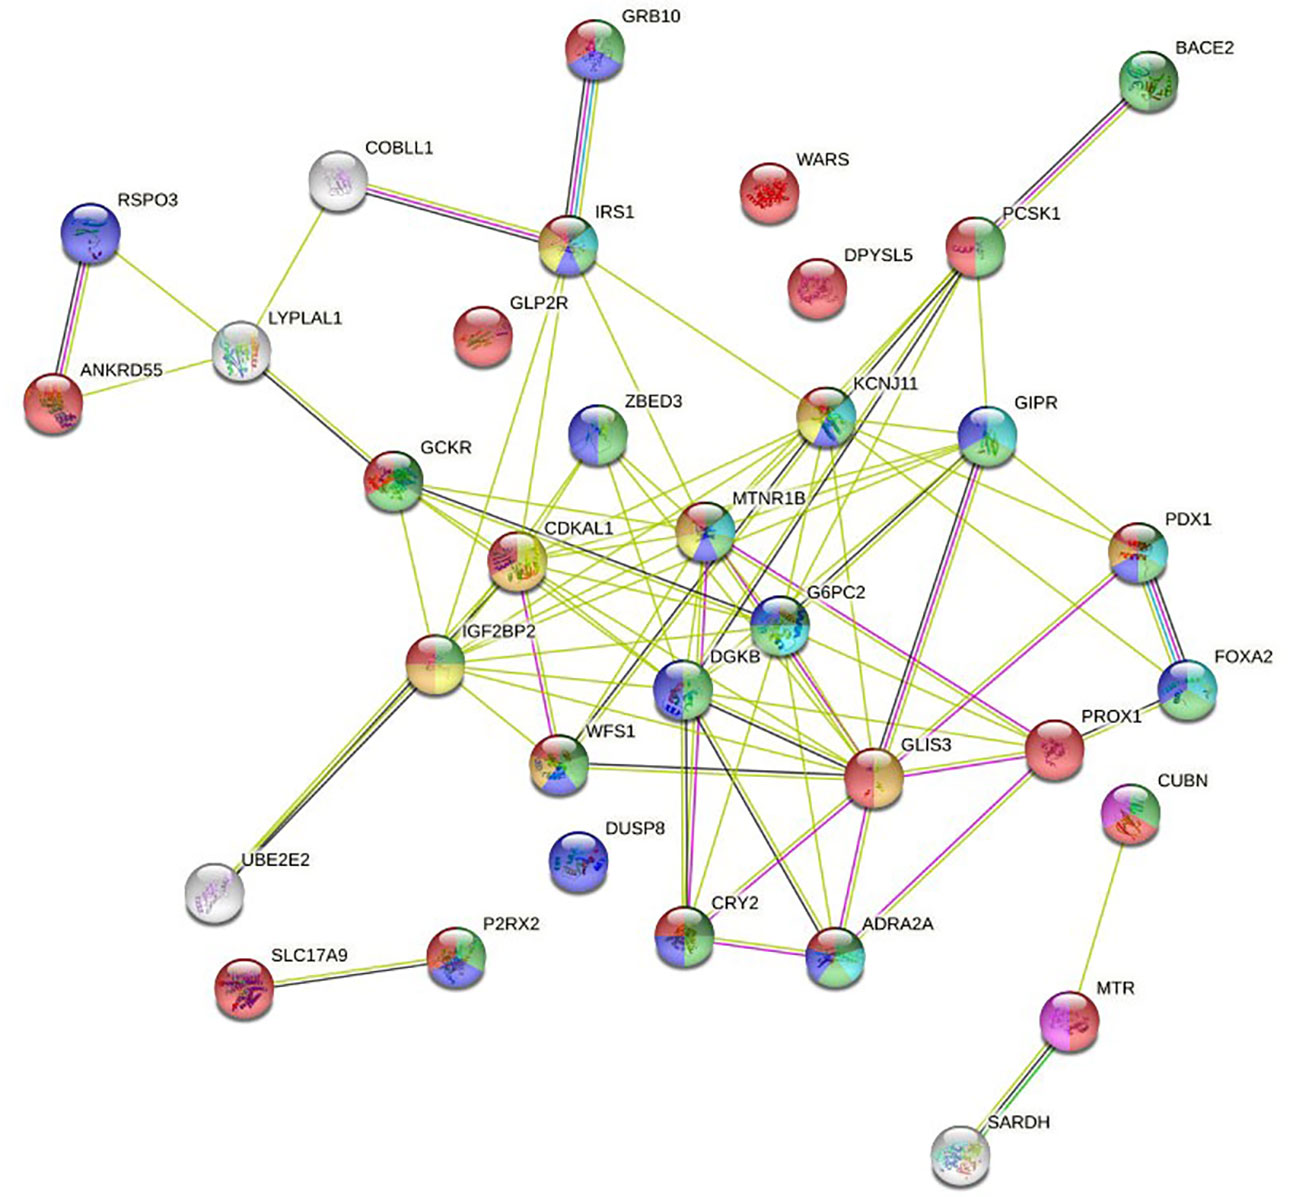
Figure 2 Full STRING network of both functional and physical protein associations. The edges indicate both functional and physical protein associations.
Discussion
In this study, we have evaluated the association of 98 susceptibility genetic variants with the diagnosis of GDM in a large population of pregnant women from two ethnic groups, from a single center, living in Spain, in the setting of an ongoing nutritional intervention program. To our knowledge, this is the first time that a large relevant set of SNPs has been analyzed in such a large sample of GDM patients, and with a close follow-up regarding their diet and lifestyle.
We have observed that the nutritional intervention presented a significant association with GDM, regardless of the variant considered, OR < 1 (p < 0.05, q <0.05, lfdr < 0.1), in practically all models for both ethnicities [Supplementary Table 2 CAU-2HIS], confirming the protective effect of the MedDiet for GDM, as previously reported (3, 4, 16, 17) and, at the same time, confirming the significance of the observed SNPs. The variable of the logistic regression model that represents the nutritional group [GROUP] provided relevant information to assess the association of the genetic variants with GDM. The analysis showed that the SNP-GDM association tests identified as significant, when adjusted by the GROUP variable, had a lower FDR, that is, the discoveries have a low proportion of false significant identified associations, evaluated by q-values, and a low local false discovery rate, evaluated by lfdr-values. Furthermore, q-values indicate that it is possible to qualify as discovery a null hypothesis with a p-value greater than the usual threshold of 0.05, increasing the set of variants that deserve further investigation, without significantly increasing the false discovery rate.
Although case-control-based GWAS usually refer to the additive model, it is currently recommended to also consider other genetic models (18) for a better understanding of the variant-disease relationship. Our study includes four genetic models that provide joint information on this relationship, aiding in the understanding of genetic analysis and providing further strengths to our findings. We can point out that, with some minor exceptions, when a significant association is observed for a given SNP in several models, the corresponding OR verify ORADD < ORDOM < ORREC < ORHOM, when minor allele is a risk allele or ORADD > ORDOM > ORREC > ORHOM when minor allele is protective (Table 3a CAU-3b HIS).
Logistic regression results are consistent with information collected on STRING databases relative to PPI, both known and predicted, or associations identified by co-expression, protein homology, or text mining. The most significant variants in genetic tests are located in locus/genes encoding proteins annotated in the knowledge database as associated with biological processes related to diabetes and GDM (Table 4). Most of the nodes in Figure 2 have the name of a locus/gene that are well referenced in the literature because several SNPs with a significant association with diabetes and GDM are located nearby. Specifically, the nodes located in the central core of the graph, MNTR1B (rs1387153, rs10830962, rs10830963), IGF2BP2 (rs4402960, rs7651090), KCNJ11 (rs5215), GCKR (rs780094), CDKAL1 (rs9368222), IRS1 (rs2943634), ADRA2A (rs10885122), CRY2(rs11605924), DKGB (rs2191349), G6PC2 (rs563694), GLIS3 (rs7041847, rs7034200, rs10814916), GIPR (rs2302593), WFS1 (rs4458523), ZBED3 (rs7708285), PROX1 (rs340874), FOXA2 (rs6048205), PDX1 (rs2293941), PCSK1 (rs6235), have been referred in various GWAS as associated to diabetes (6, 19–25), GDM (26–34) or both (35, 36).
We can observe a subnetwork made up of the RSPO3 (rs2745353), ANKRD55 (rs459193), LYPLAL1 (rs2785980) and COBLL1 (RS7607980) nodes. Although this is not annotated in STRING gene ontology, the revised literature reports that all of them are related to fasting insulin and show a significant association with diabetes and GDM (6, 19, 21–23, 35, 36).
In addition to the central core, where the nodes with the highest intensity of interaction are located, the network has three terminal nodes, four isolated nodes, and two isolated subnetworks, one made up of two nodes and the other made up of three nodes.
BACE2 (rs737288, rs6517656) node has been associated with GDM in some studies (8, 37), but not in others (28, 38). It is related to higher fasting C-peptide levels. As can be seen in the graph, it has a close interaction with PCSK1. In our work, the association for the Hispanic ethnic stratum is significant. GRB10 (rs933360) node has strong interaction with the IRS1 node, an insulin receptor substrate 1 that may mediate the control of various cellular processes by insulin. It is associated with diabetes in some studies (32–34), and with both diabetes and GDM in other (35, 36). We have found an association with GDM in the Hispanic ethnic stratum. UBE2E2 (rs1496653) node is an ubiquitin-conjugating enzyme associated with diabetes in some reports (20, 21, 25), and with GDM in other studies (27, 35, 36). In our work, it shows interaction with IGF2BP2, but it barely reaches significance in the Hispanic ethnicity.
DPYSL5 (rs1371614) has been associated with diabetes (6, 23, 24) and GDM (35, 36). It is a dihydropyrimidinase-related protein that has been linked with fasting glucose. In our study, we found an association in some models for both ethnic groups. WARS (rs3783347) is a shear stress-responsive gene that has been associated with diabetes (19, 22–24). In our study, it is significant in some models for Caucasian ethnicity. DUSP8 (rs2334499), dual specificity protein phosphatase 8, has phosphatase activity with synthetic phosphatase substrates and negatively regulates mitogen-activated protein kinase activity. Some studies (20, 21) report association with diabetes, while others (27, 36) do so with GDM. Our work shows association in a model for Hispanics. GLP2R (rs17676067) is a receptor for glucagon-like peptide 2, which has been reported as associated with diabetes (21). Our work shows association in the ADD, REC and HOM models for Caucasian ethnicity.
SLC17A9 (rs3746750), Solute Carrier Family 17 Member 9, is a protein coding gene related with transporter activity and involved in vesicular storage and exocytosis of ATP. It has been related to purinergic signaling and diabetes (39, 40). In our work, it shows a significant association in the ADD, DOM and HET models for Caucasian ethnicity. In the graph, we can see a strong association of SLC17A9 with P2RX2 (rs10747083), purinoceptor 2, ion channel gated by extracellular ATP involved in a variety of cellular responses. It is included in some studies as associated with diabetes (19, 22, 23) and GDM (36). In our study, it hardly reaches significance in the DOM model of the Hispanic ethnicity.
The CUBN (rs18001222), MTR (rs1805087), and SARDH (rs573904) proteins define a subnetwork in the graph that play a role in one-carbon metabolism with functions in many cellular processes. Also, genetic variants in the transport and metabolism of folate modify glycemic control and risk of GDM, and the effect of folic acid on homocysteine levels is modulated by CUBN (rs1801222) (41). CUBN, cubilin, is a cotransporter which plays a role in lipoprotein, vitamin and iron metabolism; serves as transporter in several absorptive epithelia, including embryonic yolk sac. In a study by Böger et al. (42) it is described as “a gene locus for albuminuria”, an idea that is reiterated in subsequent works (43). It has also been associated with type 2 diabetes in an elderly population (44). In our work, it is in the limits of significance in the DOM and HET model in the Hispanic ethnicity. MTR, 5 -methyltetrahydrofolate–homocysteine methyltransferase, catalyzes the transfer of a methyl group from methyl- cobalamin to homocysteine; belongs to the vitamin-B12 dependent methionine synthase family, and has been associated with various biological processes related to pregnancy (45). In our work, it has been significant in the ADD model for Caucasian ethnicity.
It should be noted that some studies are partially in disagreement with the most widely accepted results, that is, they report no association with diabetes or GDM in some of the variants mentioned above. In this regard, the following works can be consulted (9, 38, 46–49):. As an example, in our study some SNPs included in the initial list of variants and clearly identified in the literature, such as TCFL2, KCNQ1, HNFA1A, SCL30A8, have not reached a level of significance in any association model with GDM. This could be related to the complex genetic and epigenetic architecture, with both similarities and differences between diabetes and GDM, which deserves further investigation.
The idea of considering the evaluation of the impact of diet and lifestyle on the significance of SNPs in their association with GDM is currently attracting the interest of investigators (50). In this regard, we remark that our study has been performed with a meticulous evaluation of lifestyle habits, showing the protective effect of a healthy MedDiet, and that significant SNPs remained as such, after performing a rigorous genetic and statistical bioinformatic analysis.
Conclusion
Identifying the potential susceptibility genetic variants that could be associated with developing GDM and their modulation due to a nutritional intervention deems useful to design preventive and therapeutic strategies, especially in the setting of the increasing prevalence of GDM. In this study, we have examined a set of 98 SNPs in a large cohort of patients from two main ethnicities from a single center, and in the setting of an ongoing clearly beneficial nutritional intervention. The study confirms previous works that promote the therapeutic recommendation of Mediterranean Diet to all pregnant women to prevent GDM. In addition, we have confirmed a core set of SNPs reported in the literature as associated with diabetes and GDM. However, our statistical models, that include the nutritional intervention as an additional variable, highlight and reinforce the significance of the association effects, reducing the FDR levels. This means that a safer tool is available to control the risk of GDM based on the genomic profile of the individual. Therefore, genotypic analysis of women of child-bearing age and recommending a MedDiet, will assist the prompt identification and management of GDM.
Data availability statement
The original contributions presented in the study are included in the article/Supplementary Material. Further inquiries can be directed to the corresponding authors.
Ethics statement
The studies involving human participants were reviewed and approved by the Clinical Trials Committee of the Hospital Clínico San Carlos. The patients/participants provided their written informed consent to participate in this study.
Author contributions
Conceptualization and design: AR-L, AB, AC-P, NT, ADu, MH, MR, LM, MZ, PM, ADi, LV, VM, JV. Data curation, and analysis and interpretation of data: AR-L, AB, AC-P, NT, ADu, CF, IJ, LV, VM, IM, JV. Funding acquisition: AC-P, NT. Investigation: AC-P, MT, PM, ADi, AB, MA, LS, LM, MZ, MR, MT. Methodology: AC-P, NT, ADu, CF, IJ, MH, MT, IM, PM, MA, LS, LM, MZ, AB, LV, VM, JV. MR. Software: AR-L. Supervision, Validation and Visualization: AC-P, AR-L, AB, NT, MR. Writing – original draft: AC-P, AR-L, AB, NT. Writing – review & editing: AR-L, AC-P, AB, NT, ADu, MR, MA, LS, LM, MZ. All authors have seen and agree with the content of the full last version of manuscript.
Funding
This research was funded by grants from the Instituto de Salud Carlos III/MICINN of Spain under grant number PI20/01758, and European Regional Development Fund (FEDER)’’A way to build Europe’’ and Ministerio de Ciencia e Innovación, and Agencia Estatal de Investigación of Spain under grant number PREDIGES RTC2019-007406-1.The design and conduct of the study; collection, management, analysis, and interpretation of the data; preparation, review, and approval of the manuscript; and decision to submit the manuscript for publication are the responsibilities of the authors alone and independent of the funders.
Acknowledgments
We wish to acknowledge our deep appreciation to the administrative personnel and nurses and dieticians from the Laboratory Department (Marisol Sanchez Orta, María Dolores Hermoso Martín, María Victoria Saez de Parayuelo), the Pregnancy and Diabetes Unit and to all members of the Endocrinology and Nutrition and Obstetrics and Gynecology departments of the San Carlos Clinical Hospital and the Central Unit for Research in Medicine (UCIM),University of Valencia, Valencia, Spain.
Conflict of interest
LM, MZ, LS, MA are employees of Patia Europe.
The remaining authors declare that the research was conducted in the absence of any commercial or financial relationships that could be construed as a potential conflict of interest.
Publisher’s note
All claims expressed in this article are solely those of the authors and do not necessarily represent those of their affiliated organizations, or those of the publisher, the editors and the reviewers. Any product that may be evaluated in this article, or claim that may be made by its manufacturer, is not guaranteed or endorsed by the publisher.
Supplementary material
The Supplementary Material for this article can be found online at: https://www.frontiersin.org/articles/10.3389/fendo.2022.1036088/full#supplementary-material
References
1. American Diabetes Association Professional Practice Committee. Management of diabetes in pregnancy: Standards of medical care in diabetes–2022. Diabetes Care (2022) 45(Supplement_1):S232–43. doi: 10.2337/dc22-S015
2. Metzger BE, Gabbe SG, Persson B, Buchanan TA, Catalano PA, Damm P, et al. International association of diabetes and pregnancy study groups consensus panel. international association of diabetes and pregnancy study groups recommendations on the diagnosis and classification of hyperglycemia in pregnancy. Diabetes Care (2010) 33:676–82. doi: 10.2337/dc10-0719
3. Assaf-Balut C, García de la Torre N, Durán A, Fuentes M, Bordiú E, del Valle L, et al. A Mediterranean diet with additional extra virgin olive oil and pistachios reduces the incidence of gestational diabetes mellitus (GDM): A randomized controlled trial: The st. carlos GDM prevention study. PloS One (2017) 12(10):e0185873. doi: 10.1371/journal.pone.0185873
4. García de la Torre N, Assaf-Balut C, Jimenez-Varas I, del Valle L, Durán A, Fuentes M, et al. Effectiveness of following Mediterranean diet recommendations in the real world in the incidence of gestational diabetes mellitus (GDM) and adverse maternal-foetal outcomes: A prospective, universal, interventional study with a single group. the St carlos study. Nutrients (2019) 11:1210. doi: 10.3390/nu11061210
5. Sociedad Española de Ginecología y Obstetricia. Protocolos asistenciales en obstetricia. Control prenat. del embarazo norm (2010) Available at: Sociedad Española de Ginecología y Obstetricia, Pº de la Habana, 190 Bajo (28036) Madrid. E-mail:c2Vnb0BzZWdvLmVz|Fax: 34 91 350 98 18.
6. Manning AK, Hivert MF, Scott RA, Grimsby JL, Bouatia-Naji N, Chen H, et al. DIAbetes genetics replication and meta-analysis (DIAGRAM) consortium, multiple tissue human expression resource (MUTHER) consortium. a genome-wide approach accounting for body mass index identifies genetic variants influencing fasting glycemic traits and insulin resistance. Nat Genet (2012) 44:659–69. doi: 10.1038/ng.2274
7. Zhang C, Bao W, Rong Y, Yang H, Bowers K, Yeung E, et al. Genetic variants and the risk of gestational diabetes mellitus: a systematic review. Hum Reprod Update (2013) 19(4):376–90. doi: 10.1093/humupd/dmt013
8. Hayes MG, Urbanek M, Hivert MF, Armstrong LL, Morrison J, Guo C, et al. Identification of HKDC1 and BACE2 as genes influencing glycemic traits during pregnancy through genome-wide association studies. Diabetes. (2013) 62(9):3282–91. doi: 10.2337/db12-1692
9. Huerta-Chagoya A, Vázquez-Cárdenas P, Moreno-Macías H, Tapia-Maruri L, Rodríguez-Guillén R, López-Vite E, et al. Genetic determinants for gestational diabetes mellitus and related metabolic traits in Mexican women. PloS One (2015) 10(5):e0126408. doi: 10.1371/journal.pone.0126408
10. Lowe WL Jr, Scholtens DM, Sandler V, Hayes MG. Genetics of gestational diabetes mellitus and maternal metabolism. Curr Diabetes Rep (2016) 16(2):15. doi: 10.1007/s11892-015-0709-z
11. Wu L, Cui L, Tam WH, Ma RC, Wang CC. Genetic variants associated with gestational diabetes mellitus: a meta-analysis and subgroup analysis. Sci Rep (2016) 6:30539. doi: 10.1038/srep30539
12. Ding M, Chavarro J, Olsen S, Lin Y, Ley SH, Bao W, et al. Genetic variants of gestational diabetes mellitus: a study of 112 SNPs among 8722 women in two independent populations. Diabetologia. (2018) 61(8):1758–68. doi: 10.1007/s00125-018-4637-8
13. Chang CC, Chow CC, Tellier LC, Vattikuti S, Purcell SM, Lee JJ. Second-generation PLINK: rising to the challenge of larger and richer datasets. Gigascience. (2015) 4:7. doi: 10.1186/s13742-015-0047-8
14. Storey JD, Tibshirani. R. Statistical significance for genome-wide experiments. Proc Natl Acad Sci (2003) 100:9440–5. doi: 10.1073/pnas.1530509100
15. Szklarczyk D, Gable AL, Lyon D, Junge A, Wyder S, Huerta-Cepas J, et al. STRING v11: protein-protein association networks with increased coverage, supporting functional discovery in genome-wide experimental datasets. Nucleic Acids Res (2019) 47(D1):D607–13. doi: 10.1093/nar/gky1131
16. Assaf-Balut C, García de la Torre N, Fuentes M, Durán A, Bordiú E, Del Valle L, et al. A high adherence to six food targets of the Mediterranean diet in the late first trimester is associated with a reduction in the risk of materno-foetal outcomes: The st. carlos gestational diabetes mellitus prevention study. Nutrients (2019) 11:66. doi: 10.3390/nu11010066
17. Melero V, Assaf-Balut C, Garcia de la Torre N, Jiménez I, Bordiú E, del Valle L, et al. Benefits of adhering to a Mediterranean diet supplemented with extra virgin olive oil and pistachios in pregnancy on the health of offspring at 2 years of age. results of the San carlos gestational diabetes mellitus prevention study. J Clin Med (20) 9:1454. doi: 10.3390/jcm9051454
18. Liu HM, Zheng JP, Yang D, Liu ZF, Li Z, Hu ZZ, et al. Recessive/dominant model: Alternative choice in case-control-based genome wide association studies. PloS One (2021) 16(7):e0254947. doi: 10.1371/journal.pone.0254947
19. Scott RA, Lagou V, Welch RP, Wheeler E, Montasser ME, Luan J, et al. Large-Scale association analyses identify new loci influencing glycemic traits and provide insight into the underlying biological pathways. Nat Genet (2012) 44(9):991–1005. doi: 10.1038/ng.2385
20. Morris AP, Voight BF, Teslovich TM, Ferreira T, Segrè AV, Steinthorsdottir V, et al. Large-Scale association analysis provides insights into the genetic architecture and pathophysiology of type 2 diabetes. Nat Genet (2012) 44(9):981–90. doi: 10.1038/ng.2383
21. Mahajan A, Go MJ, Zhang W, Below JE, Gaulton KJ, Ferreira T, et al. Genome-wide trans-ancestry meta-analysis provides insight into the genetic architecture of type 2 diabetes susceptibility. Nat Genet (2014) 46(3):234–44. doi: 10.1038/ng.2897
22. Scott RA, Scott LJ, Mägi R, Marullo L, Gaulton KJ, Kaakinen M, et al. An expanded genome-wide association study of type 2 diabetes in europeans. Diabetes (2017) 66(11):2888–902. doi: 10.2337/db16-1253
23. Bien SA, Pankow JS, Haessler J, Lu Y, Pankratz N, Rohde RR, et al. Transethnic insight into the genetics of glycaemic traits: fine-mapping results from the population architecture using genomics and epidemiology (PAGE) consortium. Diabetologia. (2017) 60(12):2384–98. doi: 10.1007/s00125-017-4405-1
24. Chen J, Spracklen CN, Marenne G, Varshney A, Corbin LJ, Luan J, et al. The trans-ancestral genomic architecture of glycemic traits. Nat Genet (2021) 53(6):840–60. doi: 10.1038/s41588-021-00852-9
25. Sabiha B, Bhatti A, Fan KH, John P, Aslam MM, Ali J, et al. Assessment of genetic risk of type 2 diabetes among pakistanis based on GWAS-implicated loci. Gene. (2021) 783:145563. doi: 10.1016/j.gene.2021.145563
26. Cho YM, Kim TH, Lim S, Choi SH, Shin HD, Lee HK, et al. Type 2 diabetes-associated genetic variants discovered in the recent genome-wide association studies are related to gestational diabetes mellitus in the Korean population. Diabetologia. (2009) 52(2):253–61. doi: 10.1007/s00125-008-1196-4
27. Fuchsberger C, Flannick J, Teslovich T, Mahajan A, Agarwala V, Gaulton K, et al. The genetic architecture of type 2 diabetes. Nature (2016) 536(7614):41–7. doi: 10.1038/nature18642
28. Kleinberger JW, Maloney KA, Pollin TI. The genetic architecture of diabetes in pregnancy: Implications for clinical practice. Am J Perinatol. (2016) 33(13):1319–26. doi: 10.1055/s-0036-1592078
29. Rosta K, Al-Aissa Z, Hadarits O, Harreiter J, Nádasdi Á, Kelemen F, et al. Association study with 77 SNPs confirms the robust role for the rs10830963/G of MTNR1B variant and identifies two novel associations in gestational diabetes mellitus development. PloS One (2017) 12(1):e0169781. doi: 10.1371/journal.pone.0169781
30. Guo F, Long W, Zhou W, Zhang B, Liu J, Yu B. FTO, GCKR, CDKAL1 and CDKN2A/B gene polymorphisms and the risk of gestational diabetes mellitus: a meta-analysis. Arch Gynecol Obstet. (2018) 298(4):705–15. doi: 10.1007/s00404-018-4857-7
31. Lin Z, Wang Y, Zhang B, Jin Z. Association of type 2 diabetes susceptible genes GCKR, SLC30A8, and FTO polymorphisms with gestational diabetes mellitus risk: a meta-analysis. Endocrine (2018) 62:34–45. doi: 10.1007/s12020-018-1651-z
32. Bai Y, Tang L, Li L, Li L. The roles of ADIPOQ rs266729 and MTNR1B rs10830963 polymorphisms in patients with gestational diabetes mellitus: A meta-analysis. Gene. (2020) 730:144302. doi: 10.1016/j.gene.2019.144302
33. Dalfrà MG, Burlina S, Del Vescovo GG, Lapolla A. Genetics and epigenetics: New insight on gestational diabetes mellitus. Front Endocrinol (Lausanne). (2020) 11:602477. doi: 10.3389/fendo.2020.602477
34. Benny P, Ahn HJ, Burlingame J, Lee MJ, Miller C, Chen J, et al. Genetic risk factors associated with gestational diabetes in a multi-ethnic population. PloS One (2021) 16(12):e0261137. doi: 10.1371/journal.pone.0261137
35. Prasad RB, Groop L. Genetics of type 2 diabetes-pitfalls and possibilities. Genes (Basel). (2015) 6(1):87–123. doi: 10.3390/genes6010087
36. Powe CE, Nodzenski M, Talbot O, Allard C, Briggs C, Leya MV, et al. Genetic determinants of glycemic traits and the risk of gestational diabetes mellitus. Diabetes. (2018) 67(12):2703–9. doi: 10.2337/db18-0203
37. Tan YX, Hu SM, You YP, Yang GL, Wang W. Replication of previous genome-wide association studies of HKDC1, BACE2, SLC16A11 and TMEM163 SNPs in a gestational diabetes mellitus case-control sample from han Chinese population. Diabetes Metab Syndr Obes (2019) 12:983–9. doi: 10.2147/DMSO.S207019
38. Kawai VK, Levinson RT, Adefurin A, Kurnik D, Collier SP, Conway D, et al. A genetic risk score that includes common type 2 diabetes risk variants is associated with gestational diabetes. Clin Endocrinol (Oxf). (2017) 87(2):149–55. doi: 10.1111/cen.13356
39. Sakamoto S, Miyaji T, Hiasa M, Ichikawa R, Uematsu A, Iwatsuki K, et al. Impairment of vesicular ATP release affects glucose metabolism and increases insulin sensitivity. Sci Rep (2014) 4:6689. doi: 10.1038/srep06689
40. Moriyama Y, Hiasa M, Sakamoto S, Omote H, Nomura M. Vesicular nucleotide transporter (VNUT): appearance of an actress on the stage of purinergic signaling. Purinergic Signal (2017) 13(3):387–404. doi: 10.1007/s11302-017-9568-1
41. Hazra A, Kraft P, Lazarus R, Chen C, Chanock SJ, Jacques P. Genome-wide significant predictors of metabolites in the one-carbon metabolism pathway. Hum Mol Genet (2009) 18(23):4677–87. doi: 10.1093/hmg/ddp428
42. Böger CA, Chen MH, Tin A, Olden M, Köttgen A, de Boer IH, et al. CUBN is a gene locus for albuminuria. J Am Soc Nephrol. (2011) 22(3):555–70. doi: 10.1681/ASN.2010060598
43. Ahluwalia TS, Schulz CA, Waage J, Skaaby T, Sandholm N, van Zuydam N, et al. A novel rare CUBN variant and three additional genes identified in europeans with and without diabetes: results from an exome-wide association study of albuminuria. Diabetologia. (2019) 62(2):292–305. doi: 10.1007/s00125-018-4783-z
44. Tsekmekidou X, Tsetsos F, Koufakis T, Karras SN, Georgitsi M, Papanas N, et al. Association between CUBN gene variants, type 2 diabetes and vitamin d concentrations in an elderly Greek population. J Steroid Biochem Mol Biol (2020) 198:105549. doi: 10.1016/j.jsbmb.2019.105549
45. Barbosa PR, Stabler SP, Machado AL, Braga RC, Hirata RD, Hirata MH, et al. Association between decreased vitamin levels and MTHFR, MTR and MTRR gene polymorphisms as determinants for elevated total homocysteine concentrations in pregnant women. Eur J Clin Nutr (2008) 62(8):1010–21. doi: 10.1038/sj.ejcn.1602810
46. Wang Y, Nie M, Li W, Ping F, Hu Y, Ma L, et al. Association of six single nucleotide polymorphisms with gestational diabetes mellitus in a Chinese population. PloS One (2011) 6(11):e26953. doi: 10.1371/journal.pone.0026953
47. Anghebem-Oliveira MI, Martins BR, Alberton D, Ramos EAS, Picheth G, Rego FGM. Type 2 diabetes-associated genetic variants of FTO, LEPR, PPARg, and TCF7L2 in gestational diabetes in a Brazilian population. Arch Endocrinol Metab (2017) 61(3):238–48. doi: 10.1590/2359-3997000000258
48. Kasuga Y, Hata K, Tajima A, Ochiai D, Saisho Y, Matsumoto T, et al. Association of common polymorphisms with gestational diabetes mellitus in Japanese women: A case-control study. Endocr J (2017) 64(4):463–75. doi: 10.1507/endocrj.EJ16-0431
49. Shen Y, Jia Y, Li Y, Gu X, Wan G, Zhang P, et al. Genetic determinants of gestational diabetes mellitus: a case-control study in two independent populations. Acta Diabetol (2020) 57(7):843–52. doi: 10.1007/s00592-020-01485-w
Keywords: genetic risk variants, genetic polymorphisms, gestational diabetes mellitus, single nucleotide polymorphisms, SNPs, Mediterranean diet, nutritional intervention
Citation: Ramos-Levi A, Barabash A, Valerio J, García de la Torre N, Mendizabal L, Zulueta M, de Miguel MP, Diaz A, Duran A, Familiar C, Jimenez I, del Valle L, Melero V, Moraga I, Herraiz MA, Torrejon MJ, Arregi M, Simón L, Rubio MA and Calle-Pascual AL (2022) Genetic variants for prediction of gestational diabetes mellitus and modulation of susceptibility by a nutritional intervention based on a Mediterranean diet. Front. Endocrinol. 13:1036088. doi: 10.3389/fendo.2022.1036088
Received: 03 September 2022; Accepted: 20 September 2022;
Published: 13 October 2022.
Edited by:
Sen Li, Beijing University of Chinese Medicine, ChinaReviewed by:
Lin Han, The Affiliated Hospital of Qingdao University, ChinaLixin Guo, Beijing Hospital, Peking University, China
Copyright © 2022 Ramos-Levi, Barabash, Valerio, García de la Torre, Mendizabal, Zulueta, de Miguel, Diaz, Duran, Familiar, Jimenez, del Valle, Melero, Moraga, Herraiz, Torrejon, Arregi, Simón, Rubio and Calle-Pascual. This is an open-access article distributed under the terms of the Creative Commons Attribution License (CC BY). The use, distribution or reproduction in other forums is permitted, provided the original author(s) and the copyright owner(s) are credited and that the original publication in this journal is cited, in accordance with accepted academic practice. No use, distribution or reproduction is permitted which does not comply with these terms.
*Correspondence: Alfonso L. Calle-Pascual, YWNhbGxlcGFzY3VhbEBob3RtYWlsLmNvbQ==; Nuria García de la Torre, bnVyaWFsb2JvQGhvdG1haWwuY29t
†These authors have contributed equally to this work and share first authorship