 Xinyuan Zhang
 Bingjie Qiu
 Zhizhong Gong3
 Xiaosi Chen
 Yanhong Wang
- 1Beijing Tongren Eye Center, Beijing Tongren Hospital, Capital Medical University, Beijing, China
- 2Beijing Retinal and Choroidal Vascular Disorders Study Group, Beijing, China
- 3Division of Medical Affairs, Beijing Hospital of Traditional Chinese Medicine, Capital Medical University, Beijing, China
- 4Department of Epidemiology and Biostatistics, Institute of Basic Medical Sciences Chinese Academy of Medical Sciences & School of Basic Medicine Peking Union Medical College, Beijing, China
Lipid dyshomeostasis has been implicated in the pathogenesis of various retinal and choroidal vascular diseases. This study aims to investigate whether apolipoprotein (apo) mediated differential regulation of lipid metabolism contributes to the phenotypes of polypoidal choroidal vasculopathy (PCV) and neovascular age-related macular degeneration (nAMD). This study involved 148 subjects including 53 patients with PCV, 44 patients with nAMD, and 51 age-, sex-matched subjects with normal fundus controls. Routine blood biochemistry profile was evaluated. Apolipoproteins was estimated by Luminex technology. After controlling for age, gender, body mass index, duration of hypertension and type 2 diabetes mellitus, apoB/non-high density lipoprotein cholesterol (HDL-C) (p=0.015) was an independent risk factor for nAMD, apoB was an independent risk factor for PCV(p=0.011), compared with control. Low-density lipoprotein cholesterol (LDL-C) was significantly higher in patients with PCV when compared with nAMD (p=0.037). Furthermore, apoB/non-HDL, LDL-C, triglycerides and were significantly correlated with the pathogenesis of subgroups of PCV and nAMD. We concluded that lipid profiles and apos are differential regulated in PCV, nAMD and their subtypes, indicating different pathogenicity contributed to the different phenotypes of PCV and nAMD. Non-pachy PCV shares pathological similarities with nAMD, which is highly correlated with age-related atherosclerosis.
Introduction
Age-related macular degeneration (AMD) is a major and irreversible blindness in elderly people worldwide (1, 2). Polypoidal choroidal vasculopathy (PCV), which is considered a distinct subtype of neovascular AMD (nAMD), is more prevalent in Asia population than Caucasians although it was first reported by Dr. Yannuzzi in US in the 1990s (3, 4). Both PCV and nAMD are multifactorial disorders and share a variety of characteristics in phenotype, risk factors, natural history, and treatment strategies (5). Recently, several genetic and epigenetic studies raised the hypothesis that PCV is a genetic disorder, AMD-related gene polymorphisms such as ARMS2 A69S and CFH Y402H (6) have been found associated with PCV. On the other hand, the disparity in response to intravitreal anti-VEGF drugs between nAMD and PCV has also received extensive attention. Although the natural history, clinical features, pathological and genetic correlation of the two diseases has been intensively studied (5, 7–9), the pathogenic similarities and differences between PCV and nAMD remain largely unknown.
Dysregulated lipid metabolism has been implicated in the pathogenesis of PCV and nAMD. Lipoproteins are soluble lipid protein complexes that are formed by the interactions between apolipoproteins (apos, amphipathic proteins) and lipids (10). Abnormal expression of genes of lipid metabolism and the reverse cholesterol transport (RCT) pathway, such as Cholesterol Ester Transfer Protein (CETP), Hepatic Lipase (LIPC), ATP-binding Cassette Transporter A1 (ABCA1) and Apolipoprotein E (APOE), has been reported in patients with PCV and nAMD (11–13). Furthermore, dysregulated lipoproteins [triglycerides (TG), total cholesterol (TC), high-density lipoprotein- cholesterol (HDL-C) and low-density lipoprotein (LDL-C)] and apolipoproteins have been reported in both PCV and nAMD (12, 14, 15); however, results from existing studies are controversial and the connections remain elusive (15, 16).
The differential regulation mechanism and the interactions between apos and lipid profiles remain uncertain. Our previous studies have shown that abnormal plasma levels of apolipoproteins and lipid profiles are correlated with variety of retinal vascular disorders including diabetic retinopathy (17–19). It is interesting to determine if apolipoprotein-mediated differential regulation of lipid metabolism is a pathological cause of the clinical phenotypes of nAMD and PCV. In this study, we aim to determine the differential serum levels of lipoproteins, apoproteins and their ratios, and to determine their associations with the pathogenesis of PCV and nAMD.
Materials and Methods
Study Subjects
The study subjects were selected from our Retinal and Choroidal Study Cohort (RCSC), a prospective cohort from year of 2016 to 2022 in Beijing Tongren Eye Center. This cohort comprises patients with PCV, nAMD, pachychoroid pigment epitheliopathy, pachychoroid neovasculopathy, focal choroidal excavation, peripapillary pachychoroid syndrome pachydrusen and age-, sex-, duration of the systemic disorders (hypertension and diabetes mellitus) matched controlled subjects (with normal fundus in both eyes). This study was approved by the institutional review board of Beijing Tongren Hospital and adhered to the tenets of the Declaration of Helsinki. All participants signed informed consent form approved by the Ethics Committee of Beijing Tongren Hospital, Capital Medical University before participation.
This nested case-control study compromised 148 subjects, including 53 patients with PCV, 44 patients with nAMD and 51 age-, sex- matched healthy controls from RCSC as prescribed above.
The inclusion criteria were: 1) naïve PCV and nAMD not treated with anti-vascular endothelial growth factor (VEGF) at least within 1 year 2) No history of lipid-lowering medications. PCV was diagnosed by the fundus examination, fundus color photography, Swept Source optical coherent tomography (SS-OCT) and further confirmed by indocyanine green angiography (ICGA) according to EVEREST study report 2, modified EVEREST criteria (19–21) and the 2020 Asia-pacific eye image association PCV expert consensus of the working group (22). nAMD was diagnosed according to the “Expert consensus on macular degeneration” published in 2019 by Spaide et al. (23).
Exclusion criteria included those with 1) complicated with other fundus diseases such as macular hole, diabetic retinopathy, metastatic carcinoma, melanoma and others 2) history of serious systemic diseases including stroke and myocardial infarction within 6 months or not be able to tolerate eye examination 4) patients with history of metabolic disorders or on lipid lowering therapy. 5) subjects with one eye diagnosed with PCV and the other eye diagnosed with nAMD were also excluded.
Normal fundus control was defined as: 1) normal fundus in both eyes were evaluated by fundus ophthalmoscopy and OCT configuration 2) history of serious systemic diseases including stroke and myocardial infarction within 6 months or not be able to tolerate eye examination 3) patients with history of metabolic disorders or on lipid lowering therapy was excluded 4) subjects (with normal fundus in both eyes) with other systemic disorders were matched with the study groups when enrolled.
Subgroup Grouping Criteria
The enrolled patients with PCV and nAMD were further categorized to the pachy-PCV/nAMD group or the non-pachy nAMD group respectively, according to the likelihood ratio test results determined in the same large cohort as we described previously (24). After controlling for age and diopter, the diagnostic cut off value range of pachy-choroid among 20-29 years old was 320-330 μm [likelihood ratio (LR): 1.17]; among 40-59 years old was 330-340μm (LR: 1.07); among 60 to 79 years old was 250-275 μm (LR: 1.07) and ≥ 80 years old was 200-225 μm (LR: 1.00).
Eye Examination
The best-corrected visual acuity (BCVA), slit-lamp microscopic examination (SL-IE Slit Lamp Microscope, Topcon Co., Ltd, Tokyo, Japan), non-contact intraocular pressure (TX20 Automatic Non-contact Tonometer, Canon Co., Ltd, Tokyo, Japan), fundus photography (CR-1 non-mydriatic Fundus Camera, Canon Co., Ltd), OCT, fluorescent angiography and indocyanine green angiography (ICGA) were performed for all the participants. nAMD and PCV were diagnosed by OCT and indocyanine green angiography (ICGA) according to EVEREST study report 2, modified EVEREST criteria (20, 21) and the 2020 Asia-pacific eye image association PCV expert consensus of the working group (22).
Lipoprotein Profiling and Routine Biochemical Examination
All participants underwent a standardized assessment of other risk factors including age, gender, duration of diabetes, duration of hypertension (HBP) and body mass index (BMI). The serum levels of TC, TG, LDL-C and HDL-C were tested by routine biochemical examination.
50 μL of serum was utilized to determine the level of apolipoproteins (A-I, A-II, B, C-II, C-III, E) determined by Luminex technology (Luminex 200™ liquid chip detector, Millipore, Boston, Massachusetts, USA), according to the manufacturer’s instructions.
Non-HDL-C, LDL/HDL, (TC-HDL)/HD, log (TG/HDL), apoA-I/apoA-II, apoB/non-HDL-C, apoB/apoA-I, apoC-III/apoC-II/and apo E/apoC-II ratios were also calculated.
Determination of the Cutoff Value for apoA-I/apoA-II, apoB/non-HDL-C, apoB/apoA-I, apoC-III/apoC-II/and apoE/apoC-II Ratios by Receiver Operating Characteristic Curve
The cut off values for the ratios of apoA-I/apoA-II, apoB/non-HDL-C, apoB/apoA-I, ApoC-III/apoC-II, apo E/apoC-II, LDL/HDL, (TC- HDL)/HDL and log (TG/HDL) were determined by ROC curve. The indicators with high sensitivity and specificity (with maximum Youden index) were selected as the cut off values on ROC curve. The control group as stated above in 2.1. The cut off value of the apoB/non-HDL-C ratio was 0.43 [Area under curve (AUC): 0.62, sensitivity= 0.68, specificity=0.60], the apoB/apoA-I ratio was 1.77 (AUC: 0.544, sensitivity = 0.16, specificity= 0.94) in patients with PCV, the cut off value for the apoB/non-HDL-C ratio was 0.45 (AUC:0.71, sensitivity = 0.78, specificity = 0.63) in patients with nAMD. The ratio values (apoA-I/apoA-II, ApoC-III/apoC-II and apo E/apoC-II) with lower sensitivity (AUC< 0.50, sensitivity and specificity <0.5) were not considered in this study.
Sample Size Determination
Sample size was calculated by the Power Analysis and Sample Size software (PASS 2022, NCSS LLC, Utah, USA) based on our pilot study result. According to the pilot study results, the mean value of LDL-C (which required maximum numbers among all the biochemical parameters) in the study group was 3.32 ± 0.79, in the control group was 3.08 ± 0.87, the minimum number per arm (sample size) was 36 subjects to detect the difference between the four groups with the designed power (1- beta= 90%) at 95% confidence level (alpha=0.05) as we previously described [32]. We increased the sample size to above 40 to in each group considering the variability (even in normal controls) of apos.
Statistical Analysis
SPSS software (SPSS, Inc. 25.0, Chicago, IL, USA) was utilized for the statistical analysis. Baseline parameters including the age and gender of participants, duration of diabetes and HBP, BMI, TG, TC, HDL-C, LDL-C, the serum levels of apolipoproteins, LDL/HDL, (TC- HDL)/HDL, log (TG/HDL), the ApoB/ApoA-I ratio and the ApoB/Non-HDL ratio were described by means ± standard deviation (mean ± SD). One-way analysis of variance (ANOVA) or the Kruskal–Wallis test was applied according to the data distribution for the group comparisons. ANOVA or the univariate logistic regression was performed to assess the association between the serum levels of lipids, apolipoproteins and the ratios of lipoproteins and apolipoproteins between different groups. Multivariate logistic regression models were applied to evaluate the effects of serum lipids or apolipoproteins among PCV, nAMD and normal control groups. The Odds ratio for group comparison was analyzed using the normal control as the reference, OR > 1 means the variable is an independent risk factor for the study group, OR < 1 means the variable is an independent protective factor for the disease. When the disease sub-group was used as the reference, OR > 1 means that higher level of the independent variable was found in the study group, whereas an OR < 1 means the higher level of the independent variable was in the reference group (25). Statistical significance was defined as p<0.05.
Results
Baseline Demographic and Clinical Characteristics
A total of 148 subjects (84 males and 64 females, aged 51-94 years old) including 53 patients with PCV (aged 54-81 yrs, 67.49 ± 7.67 yrs), 44 patients with nAMD (aged 51-94 yrs, 71.30 ± 9.46 yrs) and age-, gender-, duration of hypertension and type 2 diabetes mellitus matched 51 subjects with normal fundus in both eyes (aged 51-78 yrs, 66.04 ± 7.91 yrs) were recruited from the outpatient clinic of Beijing Tongren Hospital from September 2016 to September 2021 (Table 1).
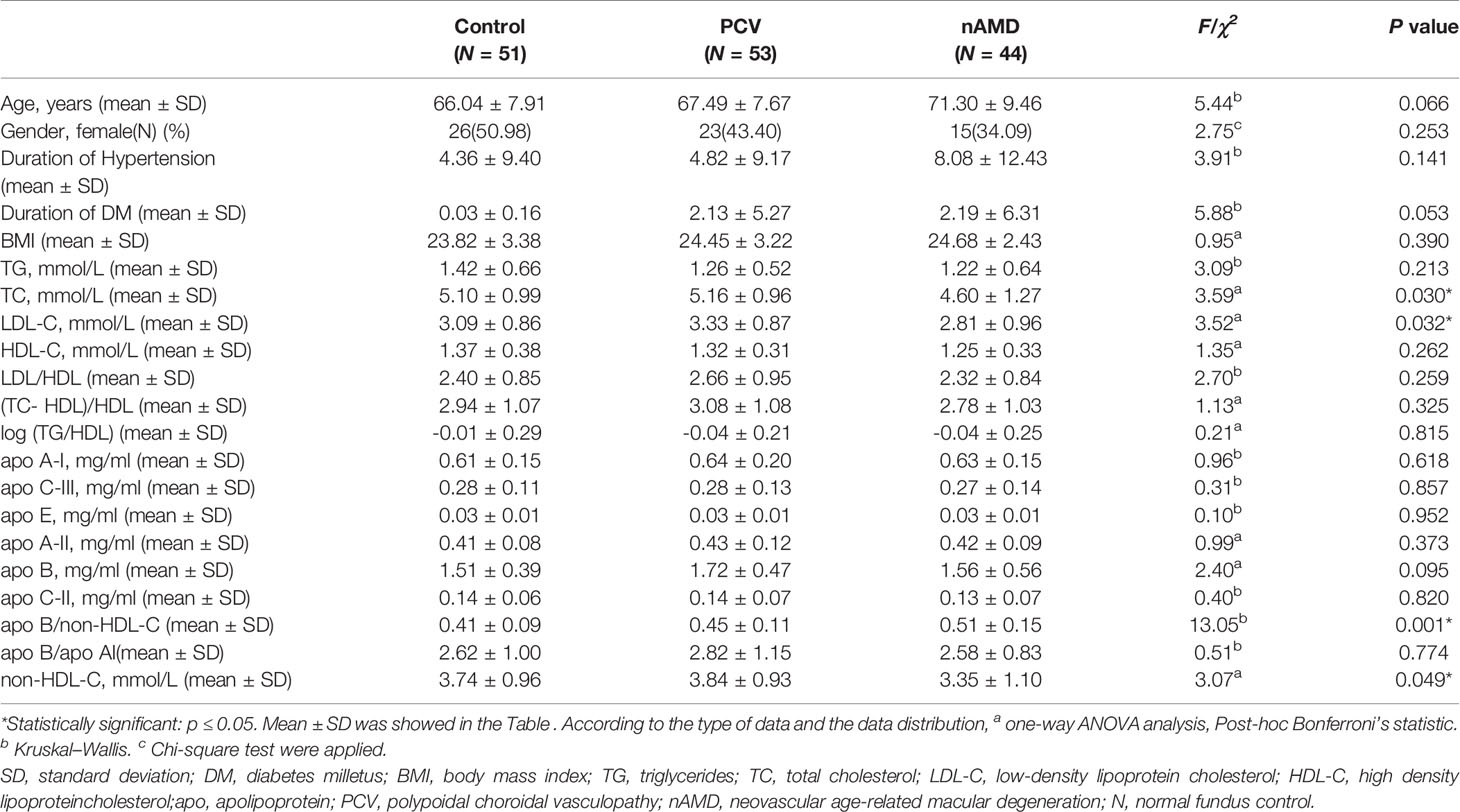
Table 1 Baseline demographic characteristics and biochemical parameters in subjects with PCV, nAMD and control.
There were no statistically significant differences in age or gender between the PCV, nAMD and control groups (page=0.066, p gender=0.253). No statistically significance difference was found in the duration of DM, HBP and BMI among the PCV, nAMD and healthy control groups (p duration of DM =0.053, p duration of HBP =0.141, p BMI =0.390). Furthermore, serum level of TC, LDL, apoB/non-HDL, non-HDL-C was significant differences among the three groups (p TC=0.030, p LDL-C=0.032, p apoB/non-HDL-C=0.001, p non-HDL-C=0.049) by one-way ANOVA analysis or Kruskal–Wallis test (Table 1).
Comparison of the PCV Group and nAMD Group by Univariate Logistic Regression Analysis
Univariate logistic regression model showed that in comparison with healthy controls, apoB was an independent risk factors for PCV with statistical difference (OR 3.31, 95% CI 1.23-8.92, p=0.018) (Table 2).
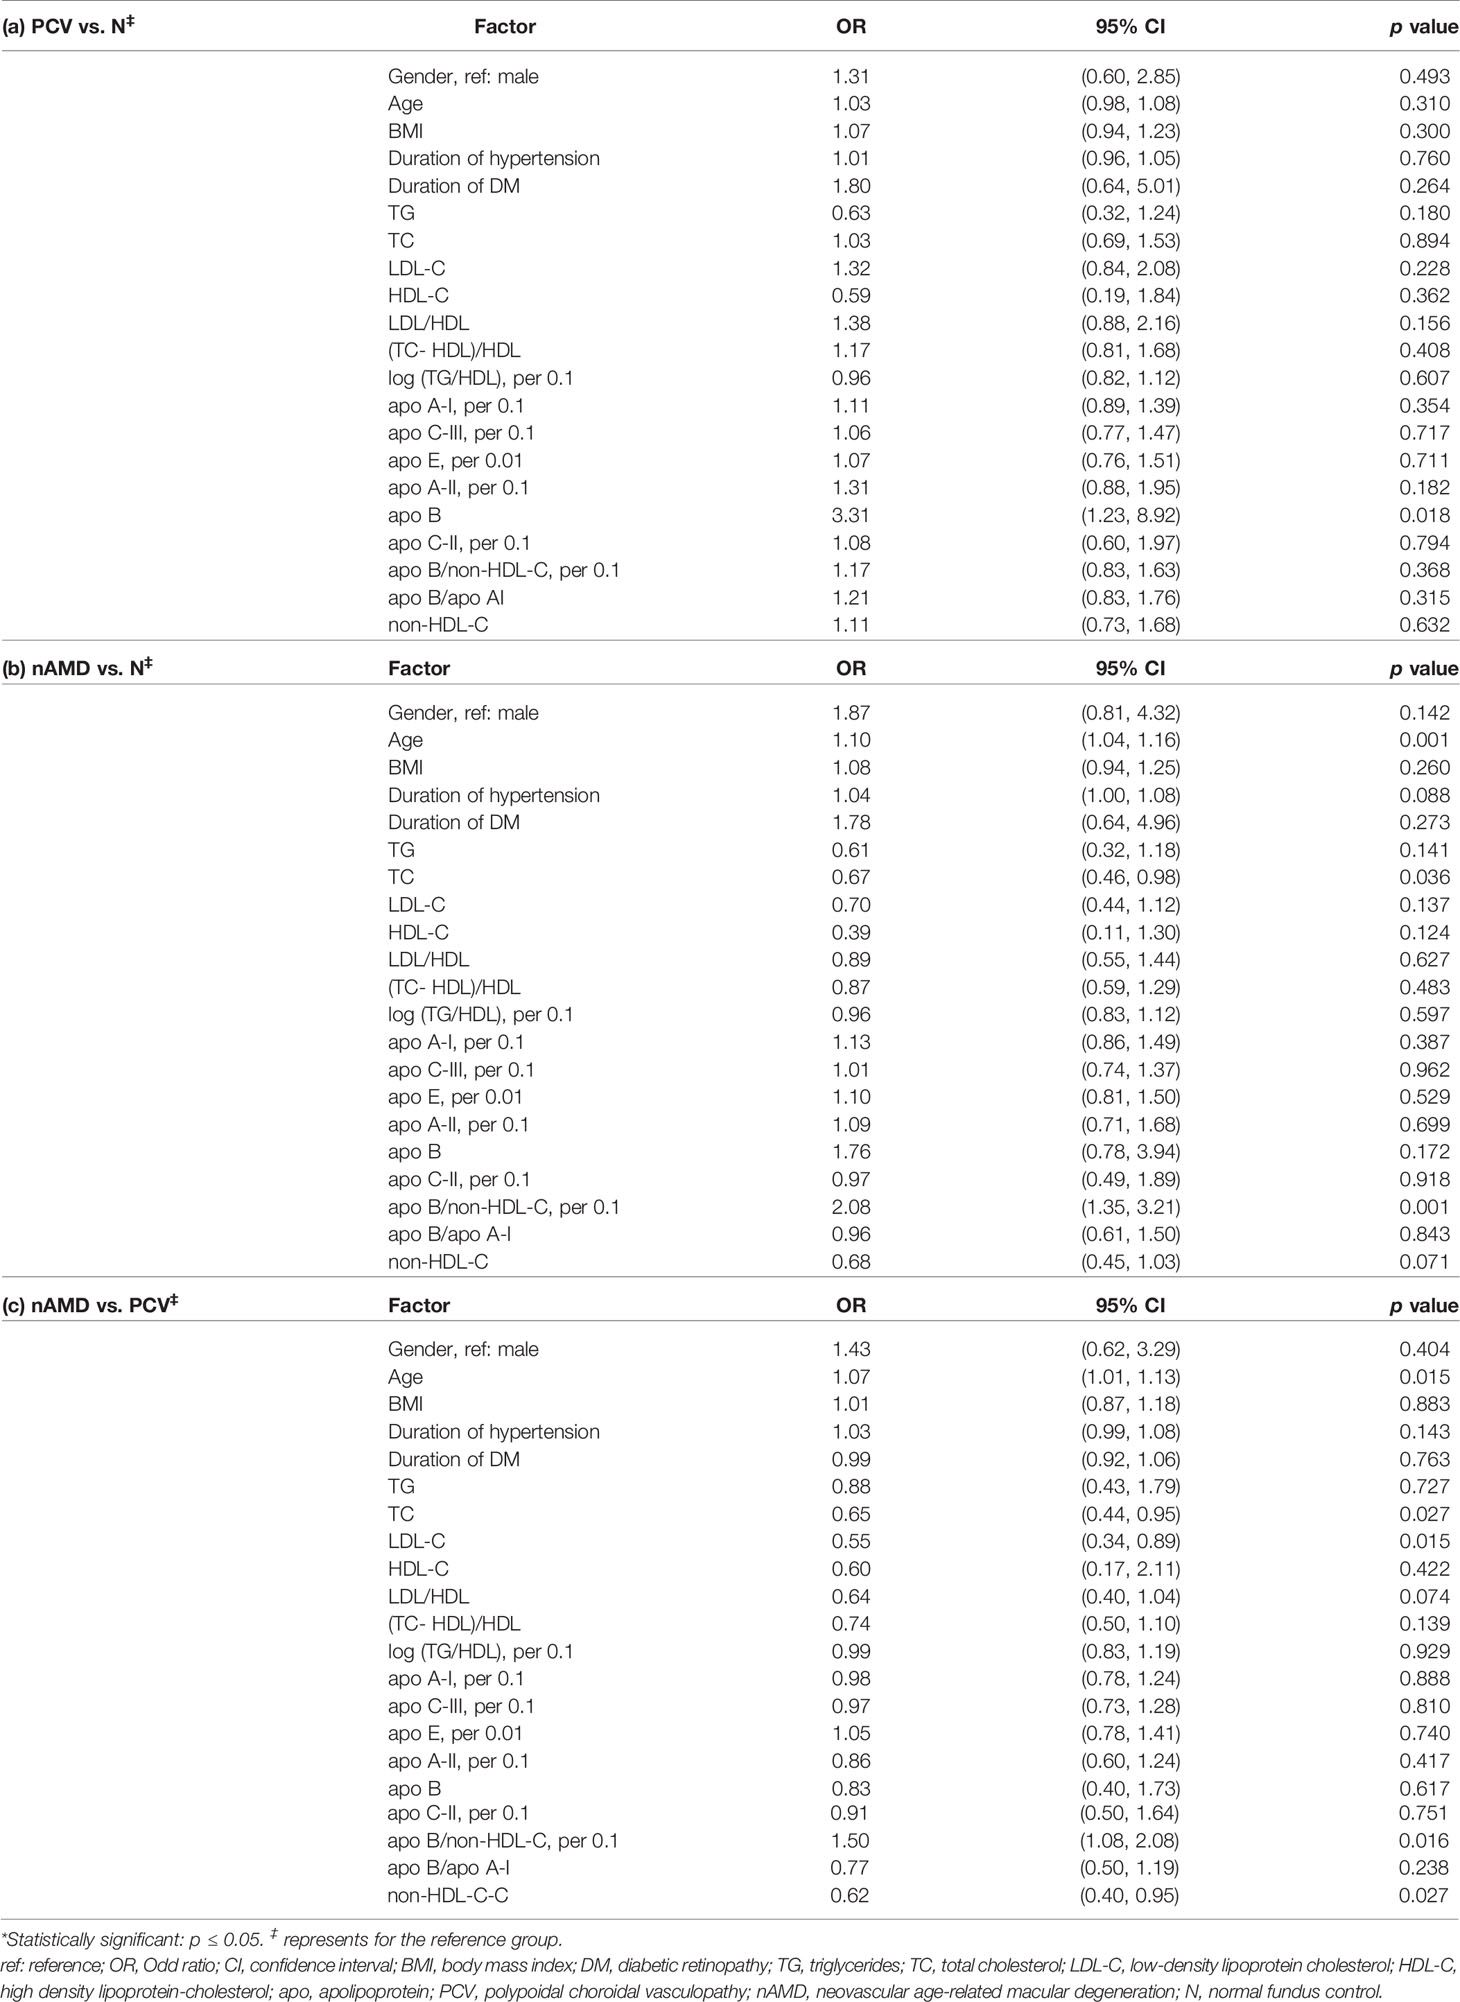
Table 2 Comparisons of the variables between PCV, nAMD and control groups by univariate logistic regression analysis.
Compared with healthy controls, univariate logistic regression analysis showed that age (OR=1.10, 95%CI 1.04-1.16, p=0.001), apo-B/non-HDL-C (per 0.1) were independent risk factors for nAMD (OR=2.08, 95% CI 1.35-3.21, p=0.001). Interestingly, TC was found to have a protective effect for patients with nAMD with statistical significance (OR=0.67, 95% CI 0.46-0.98, p=0.036) (Table 2).
In comparison with nAMD, univariable logistic regression analysis showed that the serum levels of TC, LDL-C and non-HDL-C were significantly higher and associated with increased risk for PCV (ORTC= 0.65, 95% CI 0.44-0.95, p=0.027, OR LDL-C =0.55, 95% CI 0.34-0.89, p=0.015, OR non-HDL-C 0.62 95% CI 0.40-0.95, p=0.027, respectively). In addition, age was significantly older in patients with nAMD patients compared with that with PCV patients (OR=1.07, 95% CI 1.01-1.13, p=0.015) and apo-B/non-HDL-C (per 0.1) were independent risk factors for nAMD compared to PCV patients (OR=1.50, 95% CI 1.08-2.08, p=0.016) (Table 2).
Comparisons of the Subgroups of PCV and nAMD by Univariable Logistic Regression Analysis
To further explore the correlations of the serum levels of apolipoproteins and lipid profiles with PCV and nAMD, patients with PCV and nAMD were sub-grouped to pachy (eyes with pachychoroid) and non-pachy groups according to the criteria as we described previously. Serum levels of TG were significantly lower in the pachy-PCV patients when compared with healthy controls (ORTG 0.21, 95% CI 0.06-0.80, p=0.022). The univariate logistic regression analysis indicated that serum levels of apoA-II (per 0.1mg/dl) and Apo-B were significantly higher in patients with non-pachy PCV (OR apoA-II 1.76, 95% CI 1.08-2.86, p=0.024; OR Apo-B 5.74, 95% CI 1.72-19.12, p=0.004 respectively) (Table 3).
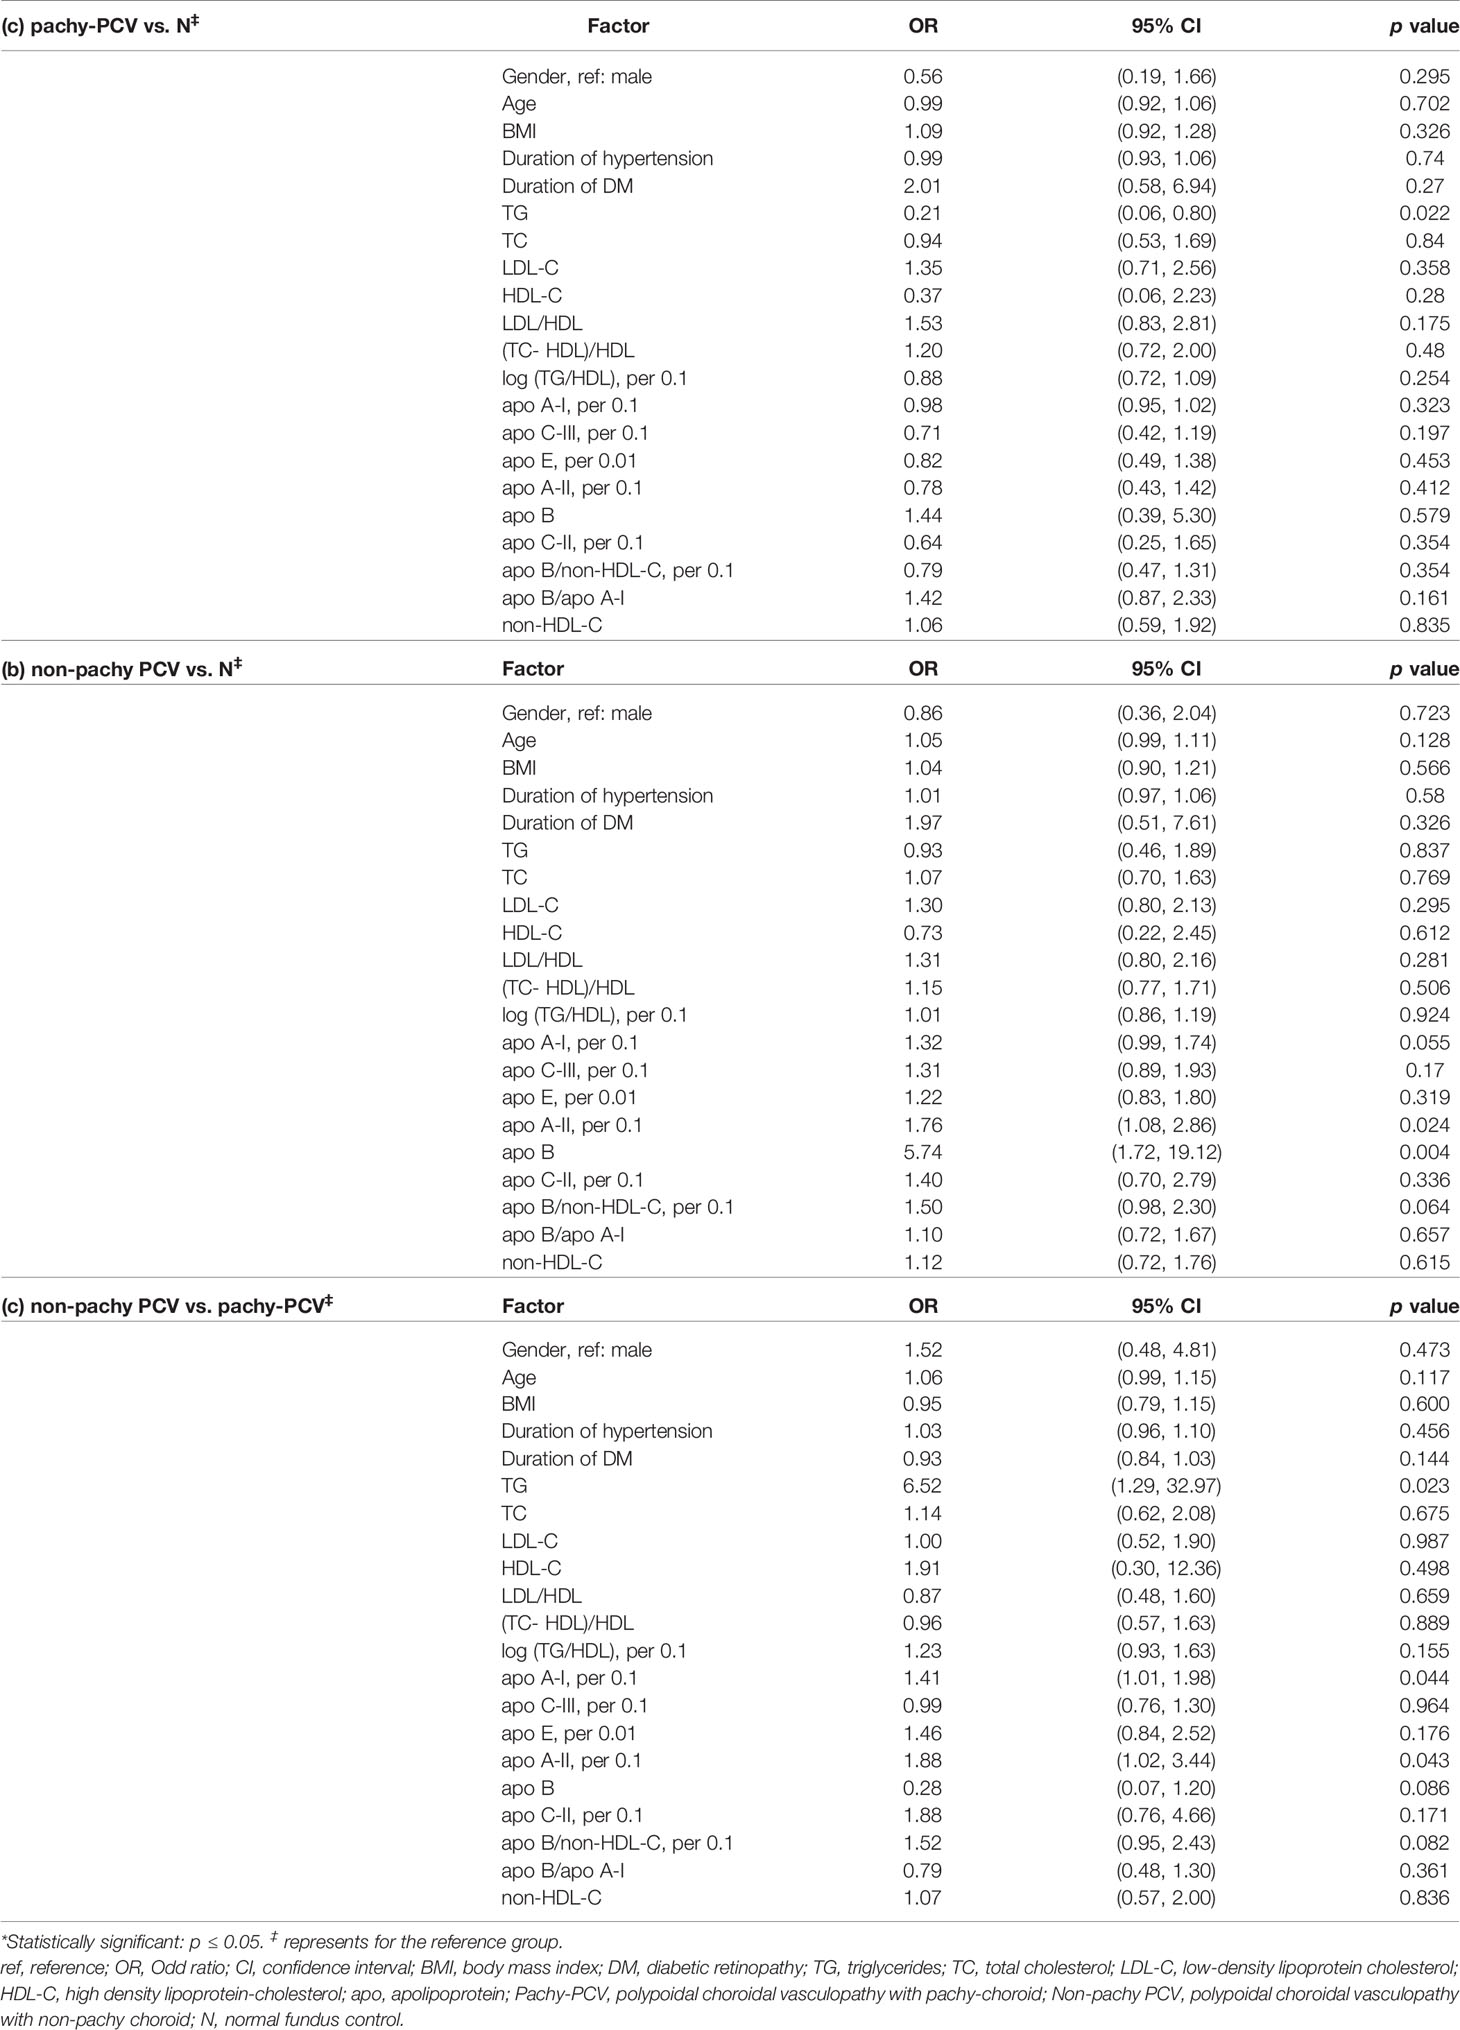
Table 3 Comparisons of the variables between the sub-groups (pachy and non-pachy) of PCV and control group by univariate logistic regression analysis.
The serum levels of TG, apoA-I (per 0.1mg/dl) and apoA-II (per 0.1mg/dl) were significantly higher in non-pachy PCV than those in pachy-PCV (OR TG 6.52, 95% CI 1.29-32.97, p=0.023; OR apoA-I1.41, 95% CI 1.01-1.98, p=0.044; OR apoA-II 1.88, 95% CI 1.02-3.44, p=0.043, respectively) (Table 3).
Compared to the healthy control group, the level of TG, TC, LDL-C and non-HDL-C were significantly lower in the pachy-nAMD group (OR TG 0.10, 95% CI 0.02-0.61, p=0.013; OR TC 0.38, 95% CI 0.18-0.81, p=0.012; OR LDL-C 0.40, 95% CI 0.17-0.97, p=0.044; OR non-HDL-C 0.35, 95% CI 0.15-0.82, p=0.015, respectively). Additionally, the apo-B/non-HDL-C ratio (per 0.1) was significantly higher in the pachy-nAMD group than that in the healthy control group (OR apo-B/non-HDL-C 2.25, 95% CI 1.21-4.19, p=0.011) (Table 4). Age and apo-B/non-HDL-C ratio (per 0.1) were also significantly higher in the non-pachy nAMD group than that in the healthy control group (OR age 1.09, 95% CI 1.03-1.16, p=0.004; OR apo-B/non-HDL-C 2.06, 95% CI 1.29-3.27, p=0.002, respectively) (Table 4). In comparison with the pachy-nAMD group, TG was significantly higher in the non-pachy nAMD group (OR TG 8.85, 95% CI 1.22-64.32, p=0.031) (Table 4).
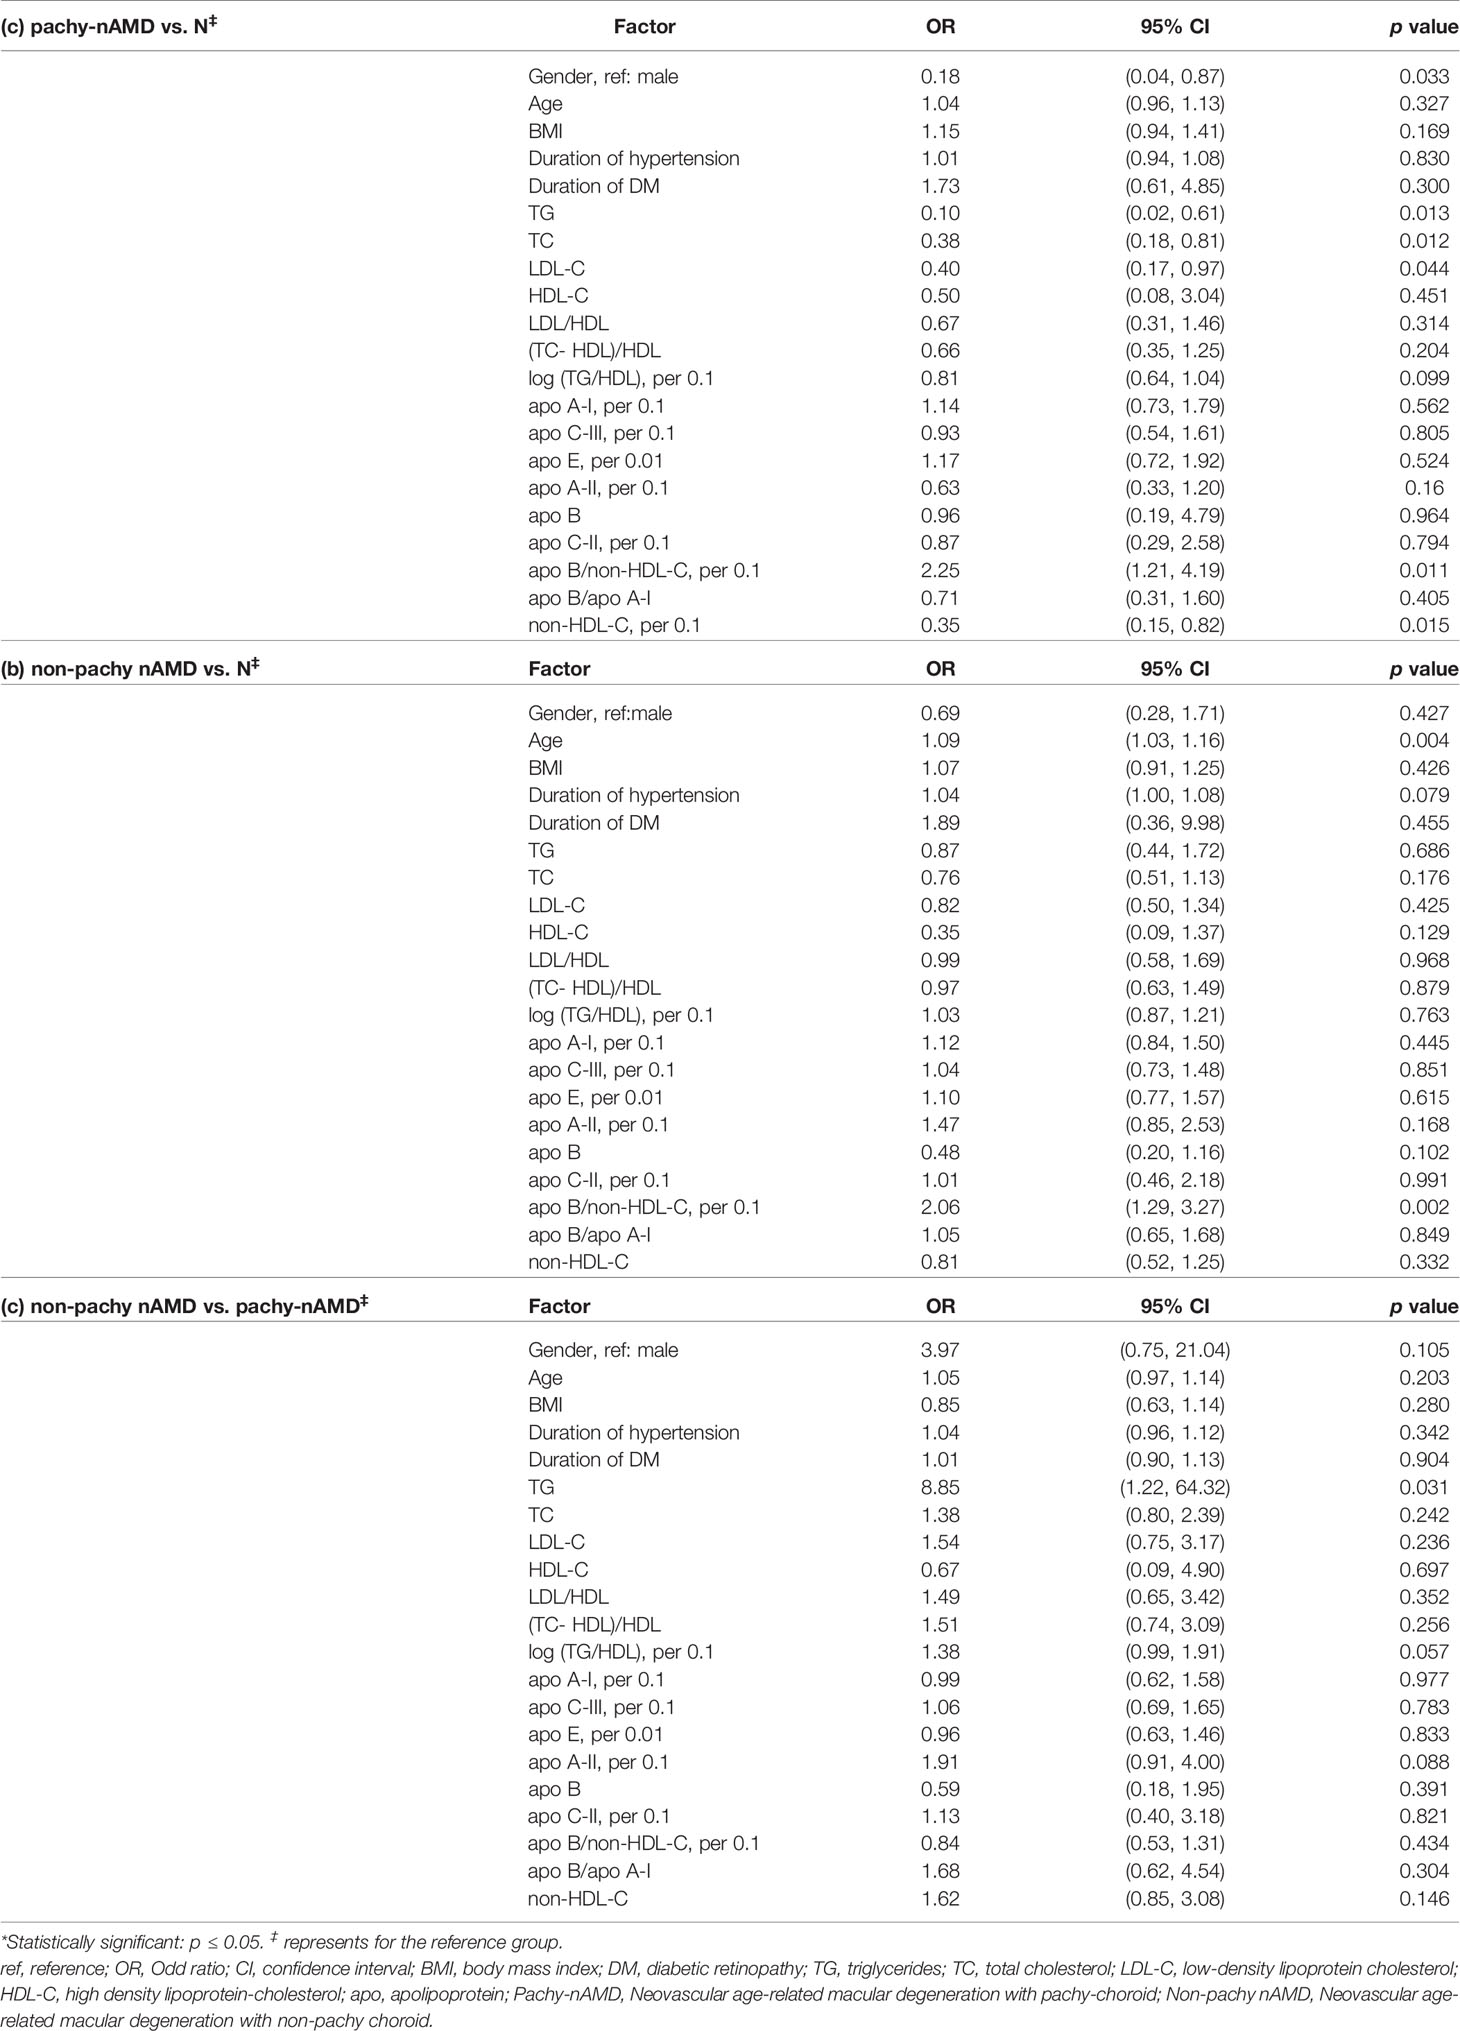
Table 4 Comparisons of the variables between the sub-groups (pachy- and nonpachy-) of nAMD and control groups by univariate logistic regression analysis.
Comparisons in the Lipid Profiles and Apolipoproteins Between PCV and nAMD by Multivariable Logistic Regression Analysis
After adjusting for age, gender, BMI and duration of HBP, the results suggested that apo-B was an independent risk factors for PCV when compared to normal control (OR Apo-B 4.06, 95% CI 1.38-11.96, p=0.011) (Table 5). The analysis also showed that the apo-B/non-HDL-C ratio (per 0.1) was an independent risk factor for nAMD, which is consistent with the univariate logistic analysis (OR 1.80, 95% CI 1.12-2.90, p=0.015) (Table 5).
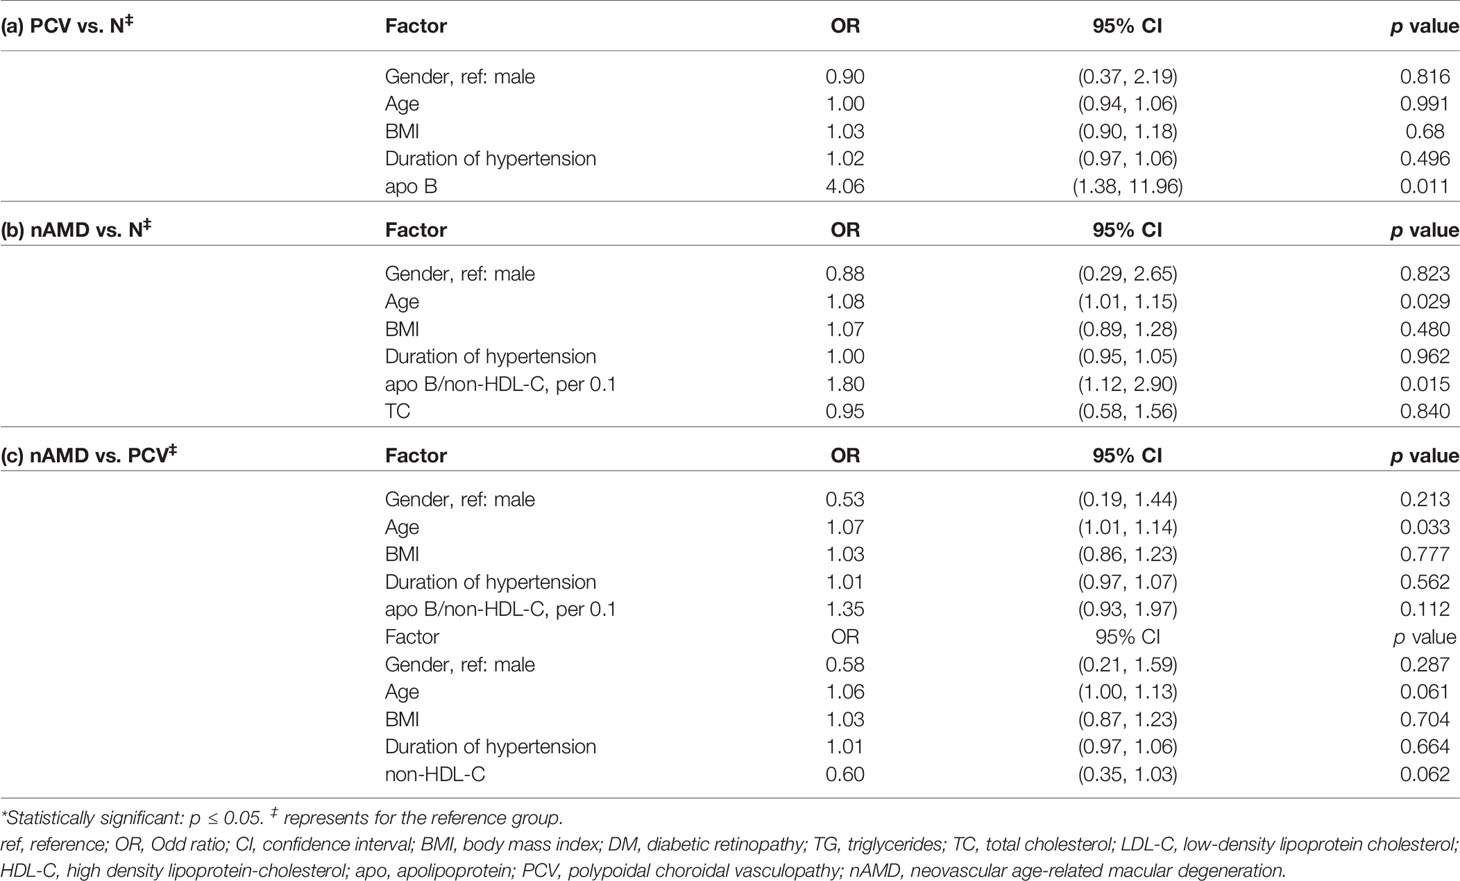
Table 5 Comparisons in the lipid profiles and apolipoproteins between PCV, nAMD and control by multivariable logistic regression analysis.
The results indicated that age is a risk factor specifically for nAMD compared with PCV (OR age 1.07, 95% CI 1.01-1.14, p=0.033) (Table 5).
Comparisons in the Lipid Profiles and Apolipoproteins Between Subgroups of PCV and nAMD by Multivariable Logistic Regression Analysis
To identify specific lipid metabolic dysfunction biomarkers, after adjusting for age, gender, BMI and duration of HBP, we compared nAMD and PCV, pachy and non-pachy PCV and nAMD by multivariate logistic regression analysis.
LDL-C was found to be a specific risk factor for patients with pachy-PCV, whereas lower level of TG was found in non-pachy PCV patients (OR LDL-C 3.44, 95% CI 1.13-10.47, p=0.030; OR TG 0.04, 95% CI 0.00-0.37, p=0.005, respectively) (Table 6). Furthermore, significantly increased levels of apoA-II (per 0.1mg/dl) and apoB were associated with increased risk of non-pachy PCV (OR OR apoA-II 1.94, 95% CI 1.03-3.68, p=0.042; OR aopB 6.20, 95% CI 1.37-28.02, p=0.018, respectively) (Table 6). In addition, higher level of apo-B/non-HDL-C (per 0.1) was associated with higher risk for non-pachy PCV in comparison with pachy-PCV (OR apo-B/non-HDL-C 2.64, 95% CI 1.05-6.59, p=0.038) (Table 6).
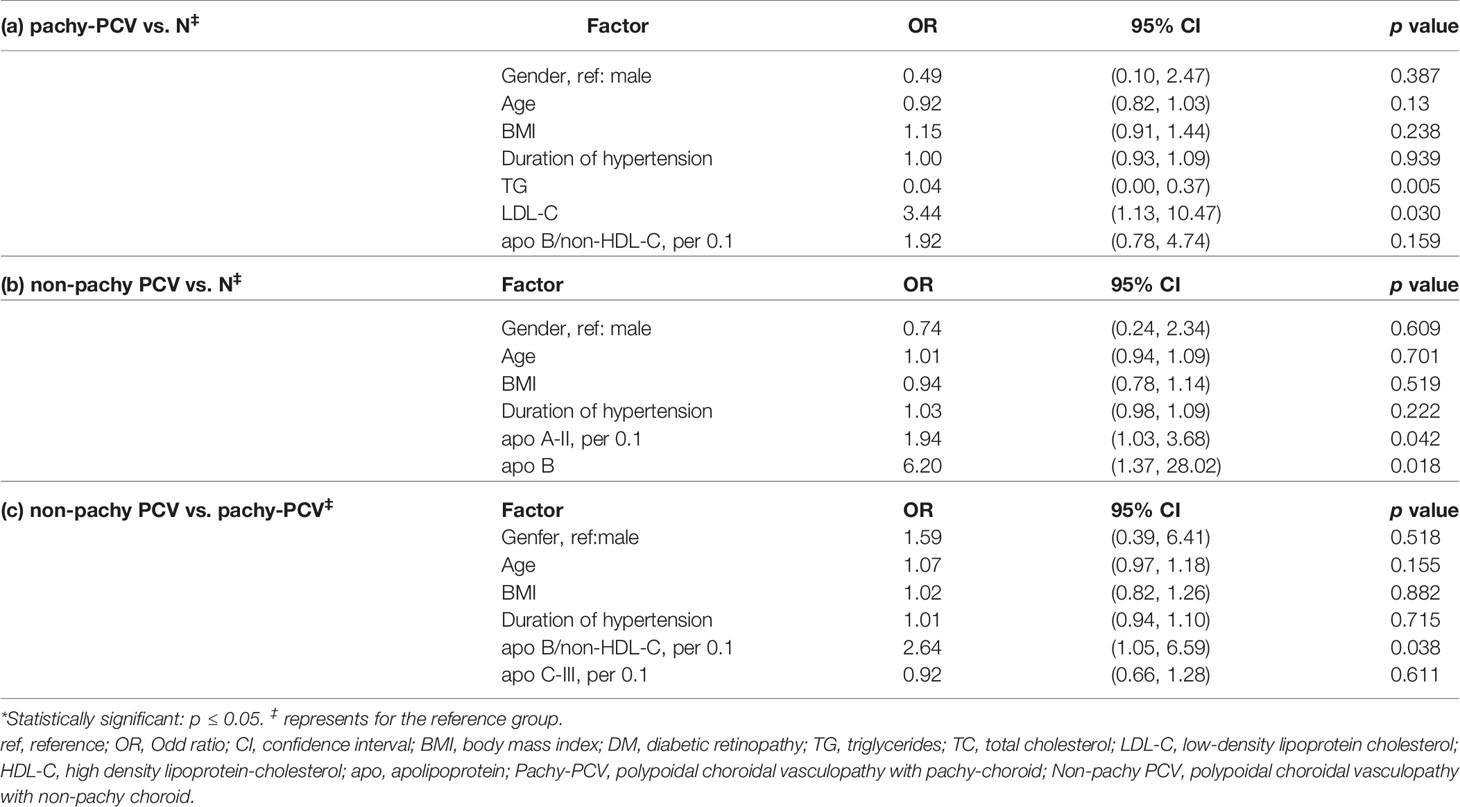
Table 6 Comparisons in the lipid profiles and apolipoproteins between the subgroups of PCV (pachy- and nonpachy-) and control by multivariable logistic regression analysis.
Compared with healthy controls, age and the apo-B/non-HDL-C ratio (per 0.1) were strong risk factors for pachy-nAMD (OR age 1.22, 95% CI 1.01-1.47, p=0.036; OR apo-B/non-HDL-C 2.78, 95% CI 1.16-6.68, p=0.022, respectively) (Table 7). The apo-B/non-HDL-C ratio (per 0.1) was specific risk factor for non-pachy nAMD (OR apo-B/non-HDL-C 1.76, 95% CI 1.08-2.87, p=0.023) (Table 7). The serum levels of apoproteins showed no differences between pachy-nAMD and non-pachy nAMD patients (Table 7).
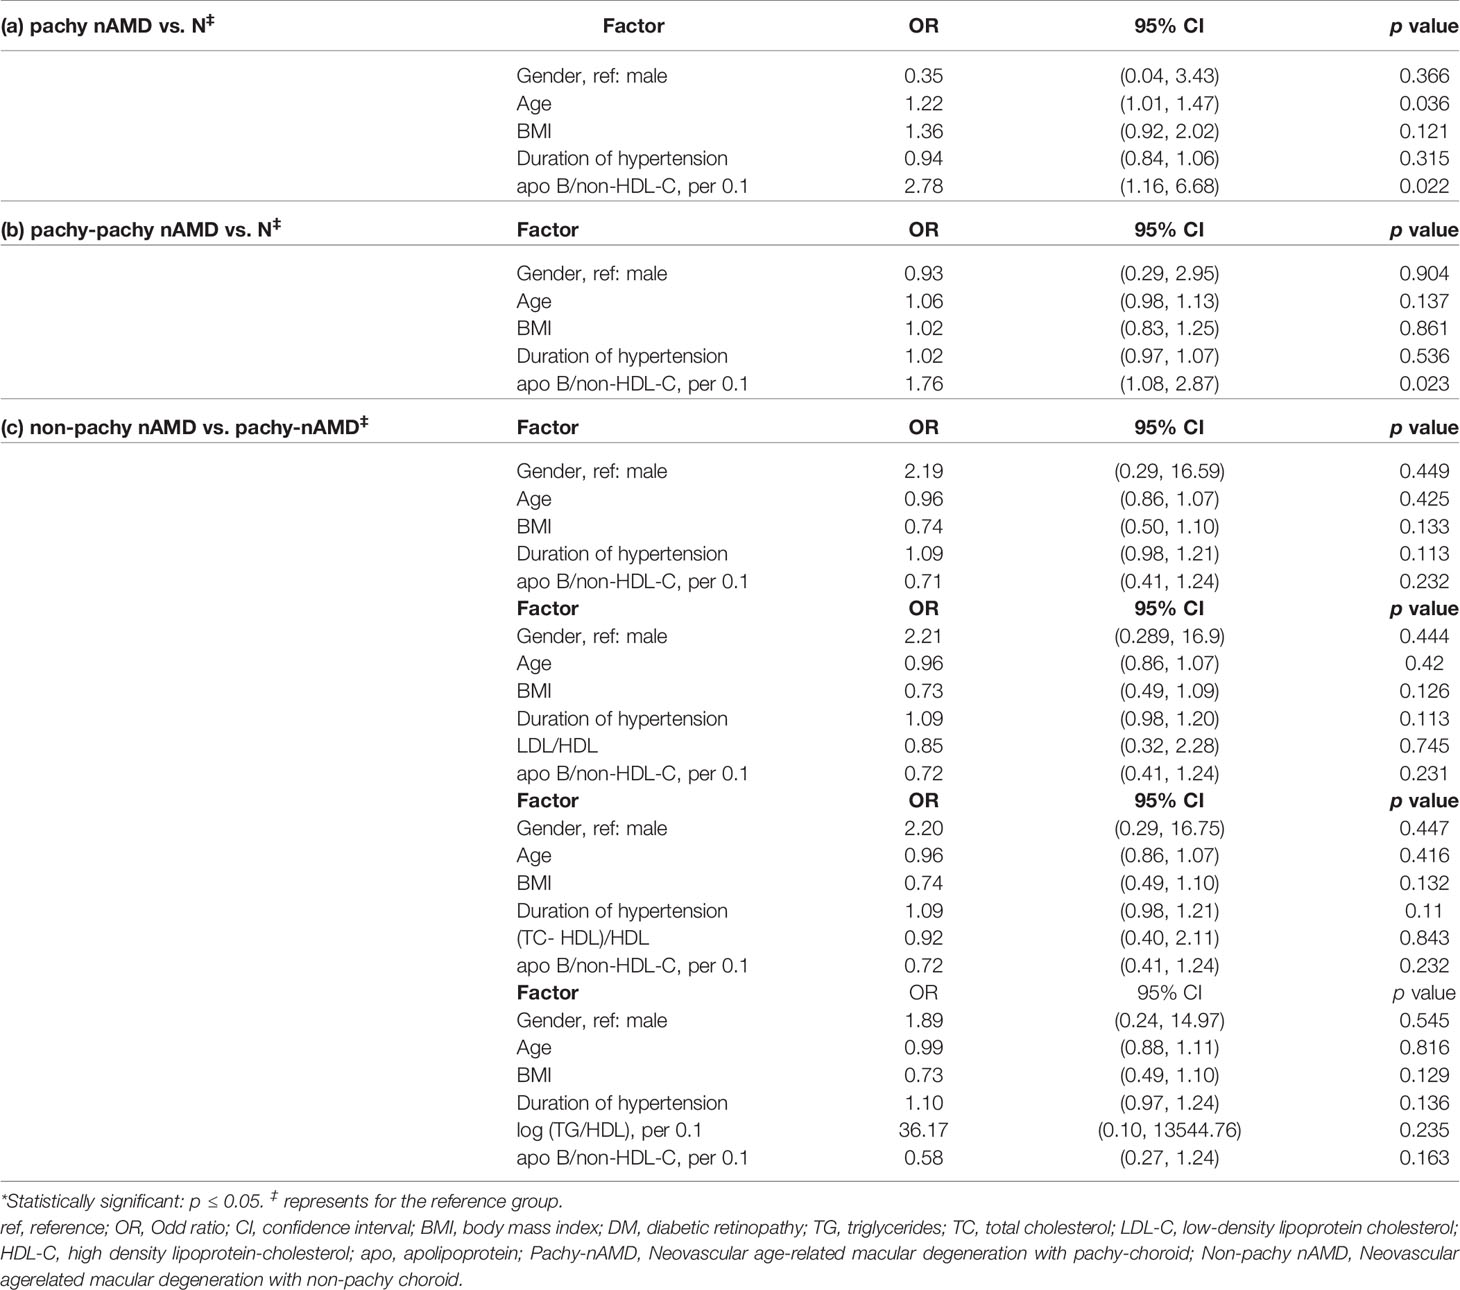
Table 7 Comparisons in the lipid profiles and apolipoproteins between the subgroups of nAMD (pachy- and nonpachy-) and control by multivariable logistic regression analysis.
Discussion
In this study, we found that the apoB/non-HDL-C ratio was an independent risk factor for nAMD, whereas apoB was an independent risk factor for PCV. In addition, age was a specific risk factor for nAMD compared with PCV. In the subgroup analysis for PCV and nAMD, it was found that apoB/non-HDL was an independent risk factor for both pachy- and non-pachy nAMD compared with control. apoB/non-HDL-C was also an independent risk factor for non-pachy PCV, indicating that non-pachy PCV shares pathological similarities with nAMD. LDL-C was an independent risk factor for pachy-PCV. These results above indicated differential regulated lipid profiles and apolipoproteins contributed to the phenotypes of PCV and nAMD.
Increasing evidence indicates that dysfunction of lipid metabolism plays a vital role in the pathogenesis of PCV and nAMD. The reverse cholesterol transport pathway regulated by ABCA1 gene has been implicated in the development of choroidal neovascularization (26) and basal laminal deposits in mice on high-fat diets (27, 28). Genetic studies demonstrated that genetic variants associated with high-density lipoprotein (HDL) pathway, such as LIPC, CETP and APOE, are associated with the pathogenesis of nAMD or PCV (12, 29).
In this study, we determined the differential levels of apolipoproteins in plasma, lipid profiles and their ratios, and reported the associations of apolipoprotein-mediated lipoproteins formation with PCV and nAMD. ApoB, especially apoB-100 is involved in lipid metabolism and is the main component of lipoproteins. ApoB provides structural integrity to lipoproteins and shields the water-repellent lipids at its center. Compared with LDL-C, apoB level has been shown to be a better indicator for cardiovascular disease (30). In this study, we found that apoB and LDL-C were independent risk factors for PCV, indicating PCV is a lipid dysfunction associated disease.
As we reported previously (31), the ratios of apolipoproteins or lipoproteins reflect two or three parameters respectively, and serve as better indicators to mirror the metabolic and clinical interactions between lipid fractions. In the current study, we have showed that apoB/non-HDL-C was an independent risk factor for nAMD, pachy-nAMD, non-pachy nAMD, and non-pachy PCV, after adjusting for age, sex, duration of hypertension, BMI, and lipoproteins by multivariable logistic analysis. ApoB-100 binds one VLDL, LDL and lipoprotein (a) (Lpa) to form the lipoprotein particle. Each apoB can only bind one atherosclerotic lipoprotein particle (VLDL, LDL-C, Lpa), thus the serum level of apoB represents the level of atherosclerotic lipoprotein particles. However, the quality of cholesterol carried by apoB varied greatly due to the cholesterol LDL particles (rich or deplete LDL particles) (30). On the other hand, non-HDL-C is the arithmetic sum of cholesterol in VLDL and LDL particles, equivalent to all atherosclerotic cholesterol in lipoproteins (30). ApoB and non-HDL-C have mirror effects on each other, because apoB represents all the atherogenic particles and non-HDL-C represents all the atherogenic cholesterol. Higher level of apoB/non-HDL-C implies that there are more cholesterol-deplete atherosclerotic lipoprotein particles, lower ratio of apoB/non-HDL-C indicated there are more cholesterol-rich atherosclerotic lipoprotein particles. The INTERHEART study have shown that the risk of cardiovascular disease was lower when serum level of apoB was less than non-HDL-C (cholesterol-rich in ApoB particles) (25). Other studies showed that the cholesterol-deplete apoB is also associated with obesity, blood glucose disorders and cardiovascular diseases. We therefore hypothesized that atherosclerosis caused by cholesterol deficiency may play a role in the pathogenesis of pachy-nAMD, non-pachy nAMD, and non-pachy PCV, indicating that non-pachy PCV shares pathological similarities with nAMD, which is highly correlated with age-related atherosclerosis.
We found that apoB/non-HDL-C was a distinct biomarker for nAMD and non-pachy PCV, indicating that 1) non-pachy PCV may share pathological similarity with nAMD 2)nAMD and non-PCV closely correlated with age-related atherosclerosis. A biomarker was defined as a “characteristic that is objectively measured and evaluated as an indication of normal biological processes, pathogenic processes, or pharmacologic responses to a therapeutic intervention” by the Biomarker Definition Working Group, supported by the U.S. National Institute of Health (32). A biomarker can be diagnostic, monitoring, safety, and susceptibility/risk biomarkers based on its main clinical applications (33). Serum cytokines including IL-1α, IL-1β, IL-4, IL-5, IL-10, IL-13, and IL-17 were found in patients with AMD, supporting that inflammation contributes to the pathogenesis of AMD. Furthermore, IK-17 and TNF-α are indicators for good responder to anti-VEGF therapy in patients with AMD (34). Serum lipid profile (forty-one discriminating metabolites) identified by mass spectrometry, especially the distinct lipid metabolism activating factor was found to be a distinct indicator for PCV (11). Differently expressed mRNAs including ENSG00000249572, miRNA has-miR-20a-5p in peripheral blood mononuclear cells found were to be predictors for good and poor responders to anti-VEGF therapy in patients with nAMD (35). Furthermore, OCT and OCT angiography characteristics have been used as biomarkers for diagnosis and treatment on PCV and nAMD (36). The height of the pigment epithelium detachment (PED) and reflectivity of the content of the PED may predict polypoidal lesions closure (36). Re-examining the baseline scans for an inverted U-shaped elevation in anti-VEGF resistant cases was helpful for detecting polypoidal lesions closure (33). These cellular, molecular and imaging biomarkers have not only deepened our understanding the pathogenesis of PCV and nAMD, but also provide insight to find novel therapeutic targets.
As another risk factor for atherosclerosis, TG was found to play a significant protective role in pachy-PCV, which was supported by a meta-analysis (included 9 studies). The results showed that increased TG level of 1 mmol/L would significantly reduce the risk of AMD (relative risk, 0.91; 95% CI, 0.87 to 0.94; I2 = 2.6%; p = 0.42) (37). Several other studies also reported that lower TG level in AMD patients (in comparison with normal control), representing a reverse association between TG and cardiovascular diseases (16, 38).TGs are main from of lipid ester and the main constituent of body fat, containing glycerol and three fatty acids. The underlying mechanism of its protective effects on AMD or PCV merits further in vivo or in vitro studies.
A limitation of this study is that it was a nested case-control study with relatively small sample size. Therefore, further longitudinal follow-up studies of large cohorts are warranted to gain insight into the underlying pathological mechanisms and the causal relationship between apos and PCV/nAMD. Furthermore, as this study only included the subjects without lipid lowering therapy, the subjects with severe hyperglycemia may also be excluded, this group of patients may have distinct phenotype of nAMD or PCV, it is interesting to investigate the correlations between the plasma lipid biomarkers for these patients. Furthermore, although we have demonstrated the difference of the dysregulated apolipoproteins and lipid profile in PCV and nAMD, the present study should also merit consideration in interpreting the findings, which need to be further validated with well-designed, prospective, large cohort clinical studies. Nevertheless, this study provides a basis for future studies in PCV and nAMD subtypes on molecular mechanisms related to lipid metabolism.
In summary, to our knowledge, this is the first study to investigate the associations between the dysfunction of lipid metabolism and the phenotypes of PCV, nAMD, pachy- and non-pachy PCV and nAMD. Our results indicated that different regulatory mechanisms of lipid metabolism are associated with distinct phenotypes of PCV and nAMD. Differentially regulated apolipoproteins and lipid profiles could be used as novel biomarkers for PCV and nAMD.
Data Availability Statement
The original contributions presented in the study are included in the article/supplementary material. Further inquiries can be directed to the corresponding authors.
Ethics Statement
The studies involving human participants were reviewed and approved by Ethics Committee of Beijing Tongren Hospital, Capital Medical University. The patients/participants provided their written informed consent to participate in this study.
Author Contributions
Conceptualization, XZ; methodology, XZ and BQ; formal analysis, XZ and BQ; investigation, XZ and BQ; Statistical analysis: XZ, BQ, ZG, YW. writing—review and editing, XZ and BQ; funding acquisition, XZ subjects enrolment: BQ; YN; XC. All authors contributed to the article and approved the submitted version.
Funding
This work was supported by the National Natural Science Foundation of China [Grant 81570850 and 82070988] and the Ministry of Science and Technology Foundation of China [Grant 2016YFC1305604].
Conflict of Interest
The authors declare that the research was conducted in the absence of any commercial or financial relationships that could be construed as a potential conflict of interest.
Publisher’s Note
All claims expressed in this article are solely those of the authors and do not necessarily represent those of their affiliated organizations, or those of the publisher, the editors and the reviewers. Any product that may be evaluated in this article, or claim that may be made by its manufacturer, is not guaranteed or endorsed by the publisher.
Acknowledgments
This work is supported by the National Natural Science Foundation of China [Grant 81570850 and 82070988] and the Ministry of Science and Technology Foundation of China [Grant 2016YFC1305604].
Abbreviations
ABCA1, ATP-binding cassette transporter A1; Apo, apolipoproteins; ApoA, apolipoprotein A; ApoB, apolipoprotein B; ApoC, apolipoprotein C; ApoE, apolipoprotein E; AUC, area under curve; BCVA, best-corrected visual acuity; BMI, body mass index; CETP, cholesterol ester transfer protein; HBP, hypertension; HDL-C, high-density lipoprotein; ICGA, indocyanine green angiography; IQR, interquartile range; LDL-C, low-density lipoprotein; LIPC, hepatic lipase; Lpa, lipoprotein(a); LR, likelihood ratio; nAMD, neovascular age-related macular degeneration; Non-pachy nAMD, nAMD with non-pachy choroid; Non-pachy PCV, PCV with non-pachy choroid; OCT, optical coherence tomography; OR, Odd ratio; Pachy-nAMD, nAMD with pachy-choroid; Pachy-PCV, PCV with pachy-choroid; PCV, Polypoidal choroidal vasculopathy; PED, pigment epithelium detachment; RCT: reverse cholesterol transport pathway; ROC, receiver operating characteristic; SFCT, Subfoveal choroidal thickness; TC, total cholesterol; TG, Triglycerides.
References
1. Wong WL, Su X, Li X, Cheung CM, Klein R, Cheng CY, et al. Global Prevalence of Age-Related Macular Degeneration and Disease Burden Projection for 2020 and 2040: A Systematic Review and Meta-Analysis. Lancet Global Health (2014) 2:e106–16. doi: 10.1016/s2214-109x(13)70145-1
2. Resnikoff S, Pascolini D, Etya'ale D, Kocur I, Pararajasegaram R, Pokharel GP, et al. Global Data on Visual Impairment in the Year 2002. Bull World Health Organ (2004) 82:844–51.
3. Lim LS, Mitchell P, Seddon JM, Holz FG, Wong TY. Age-Related Macular Degeneration. Lancet (2012) 379:1728–38. doi: 10.1016/s0140-6736(12)60282-7
4. Chen P-J, Chen S-N. Clinical Characteristics of Exudative Age-Related Macular Degeneration in Taiwan. Taiwan J Ophthalmol (2012) 2:127–30. doi: 10.1016/j.tjo.2012.10.002
5. Wong CW, Yanagi Y, Lee WK, Ogura Y, Yeo I, Wong TY, et al. Age-Related Macular Degeneration and Polypoidal Choroidal Vasculopathy in Asians. Prog Retin Eye Res (2016) 53:107–39. doi: 10.1016/j.preteyeres.2016.04.002
6. Zhang X, Sivaprasad S. Drusen and Pachydrusen: The Definition, Pathogenesis, and Clinical Significance. Eye (London England) (2021) 35:121–33. doi: 10.1038/s41433-020-01265-4
7. Tso MOM, Suarez MJ, Eberhart CG. Pathologic Study of Early Manifestations of Polypoidal Choroidal Vasculopathy and Pathogenesis of Choroidal Neo-Vascularization. Am J Ophthalmol Case Rep (2018) 11:176–80. doi: 10.1016/j.ajoc.2017.10.012
8. Yannuzzi LA, Ciardella A, Spaide RF, Rabb M, Freund KB, Orlock DA. The Expanding Clinical Spectrum of Idiopathic Polypoidal Choroidal Vasculopathy. Arch Ophthalmol (Chicago Ill 1960) (1997) 62: 478–85, 115. doi: 10.1001/archopht.1997.01100150480005
9. Yanagisawa S, Kondo N, Miki A, Matsumiya W, Kusuhara S, Tsukahara Y, et al. Difference Between Age-Related Macular Degeneration and Polypoidal Choroidal Vasculopathy in the Hereditary Contribution of the A69S Variant of the Age-Related Maculopathy Susceptibility 2 Gene (ARMS2). Mol Vision (2011) 17:3574–82.
10. Ding M, Rexrode KM. A Review of Lipidomics of Cardiovascular Disease Highlights the Importance of Isolating Lipoproteins. Metabolites (2020) 10:163. doi: 10.3390/metabo10040163
11. Li M, Zhang X, Liao N, Ye B, Peng Y, Ji Y, et al. Analysis of the Serum Lipid Profile in Polypoidal Choroidal Vasculopathy. Sci Rep (2016) 6:38342. doi: 10.1038/srep38342
12. Xu N, Xu H, Zhao M, Xu Y, Huang L. Associations of Systemic, Serum Lipid and Lipoprotein Metabolic Pathway Gene Variations With Polypoidal Choroidal Vasculopathy in China. PloS One (2019) 14:e0226763. doi: 10.1371/journal.pone.0226763
13. Klaver CC, Kliffen M, van Duijn CM, Hofman A, Cruts M, Grobbee DE, et al. Genetic Association of Apolipoprotein E With Age-Related Macular Degeneration. Am J Hum Genet (1998) 63:200–6. doi: 10.1086/301901
14. Nowak M, Swietochowska E, Marek B, Szapska B, Wielkoszynski T, Kos-Kudla B, et al. Changes in Lipid Metabolism in Women With Age-Related Macular Degeneration. Clin Exp Med (2005) 4:183–7. doi: 10.1007/s10238-004-0054-z
15. Han X, Ong JS, Hewitt AW, Gharahkhani P, MacGregor S. The Effects of Eight Serum Lipid Biomarkers on Age-Related Macular Degeneration Risk: A Mendelian Randomization Study. Int J Epidemiol (2021) 50:325–36. doi: 10.1093/ije/dyaa178
16. Kersten E, Paun CC, Schellevis RL, Hoyng CB, Delcourt C, Lengyel I, et al. Systemic and Ocular Fluid Compounds as Potential Biomarkers in Age-Related Macular Degeneration. Survey Ophthalmol (2018) 63:9–39. doi: 10.1016/j.survophthal.2017.05.003
17. Zhang X, Qiu B, Wang Q, Sivaprasad S, Wang Y, Zhao L, et al. Dysregulated Serum Lipid Metabolism Promotes the Occurrence and Development of Diabetic Retinopathy Associated With Upregulated Circulating Levels of VEGF-A, VEGF-D, and PlGF. Front Med (2021) 8:779413. doi: 10.3389/fmed.2021.779413
18. Zhang X, Wang K, Zhu L, Wang Q. Reverse Cholesterol Transport Pathway and Cholesterol Efflux in Diabetic Retinopathy. J Diabetes Res (2021) 2021:8746114. doi: 10.1155/2021/8746114
19. Wang K, Zhang X, Nie Y. Effects of Dyslipidemia on Retinal Micro-Vasculopathy and Retinal Neuron Degeneration in Patients With Diabetic. Chin J Of Ophthalmologic Med (Electronic Edition) (2020) 10:212–28. doi: 10.3877/cma.j.issn.2095-2007.2020.04.004
20. Tan CS, Ngo WK, Chen JP, Tan NW, Lim TH, Group ES. EVEREST Study Report 2: Imaging and Grading Protocol, and Baseline Characteristics of a Randomised Controlled Trial of Polypoidal Choroidal Vasculopathy. Br J Ophthalmol (2015) 99:624–8. doi: 10.1136/bjophthalmol-2014-305674
21. Cheung CMG, Laude A, Wong W, Mathur R, Chan CM, Wong E, et al. Improved Specificity of Polypoidal Choroidal Vasculopathy Diagnosis Using a Modified Everest Criteria. Retina-the J Retinal Vitreous Dis (2015) 35:1375–80. doi: 10.1097/iae.0000000000000482
22. Cheung CMG, Lai TYY, Teo K, Ruamviboonsuk P, Chen SJ, Kim JE, et al. Polypoidal Choroidal Vasculopathy: Consensus Nomenclature and Non-Indocyanine Green Angiograph Diagnostic Criteria From the Asia-Pacific Ocular Imaging Society PCV Workgroup. Ophthalmology (2021) 128:443–52. doi: 10.1016/j.ophtha.2020.08.006
23. Spaide RF, Jaffe GJ, Sarraf D, Freund KB, Sadda SR, Staurenghi G, et al. Consensus Nomenclature for Reporting Neovascular Age-Related Macular Degeneration Data: Consensus on Neovascular Age-Related Macular Degeneration Nomenclature Study Group. Ophthalmology (2020) 127:616–36. doi: 10.1016/j.ophtha.2019.11.004
24. Zhang X, Qiu B, Wang Y, Li Z, Zeng Y, Chen X, et al. Distribution Characteristics of Choroidal Thickness in Normal Population and the Diagnostic Cut Off Value of Pachychoroid. Chin J Exp Ophthalmol (2022) 40:548–55. doi: 10.3760/cma.j.cn115989-20220401-00127
25. Sniderman AD, Islam S, Yusuf S, McQueen MJ. Discordance Analysis of Apolipoprotein B and non-High Density Lipoprotein Cholesterol as Markers of Cardiovascular Risk in the INTERHEART Study. Atherosclerosis (2012) 225:444–9. doi: 10.1016/j.atherosclerosis.2012.08.039
26. Sene A, Khan AA, Cox D, Nakamura RE, Santeford A, Kim BM, et al. Impaired Cholesterol Efflux in Senescent Macrophages Promotes Age-Related Macular Degeneration. Cell Metab (2013) 17:549–61. doi: 10.1016/j.cmet.2013.03.009
27. Dithmar S, Sharara NA, Curcio CA, Le NA, Zhang Y, Brown S, et al. Murine High-Fat Diet and Laser Photochemical Model of Basal Deposits in Bruch Membrane. Arch Ophthalmol (Chicago Ill 1960) (2001) 119:1643–9. doi: 10.1001/archopht.119.11.1643
28. Sallo FB, Bereczki E, Csont T, Luthert PJ, Munro P, Ferdinandy P, et al. Bruch's Membrane Changes in Transgenic Mice Overexpressing the Human Biglycan and Apolipoprotein B-100 Genes. Exp Eye Res (2009) 89:178–86. doi: 10.1016/j.exer.2009.03.006
29. Liu K, Chen LJ, Lai TY, Tam PO, Ho M, Chiang SW, et al. Genes in the High-Density Lipoprotein Metabolic Pathway in Age-Related Macular Degeneration and Polypoidal Choroidal Vasculopathy. Ophthalmology (2014) 121:911–6. doi: 10.1016/j.ophtha.2013.10.042
30. de Nijs T, Sniderman A, de Graaf J. ApoB Versus Non-HDL-Cholesterol: Diagnosis and Cardiovascular Risk Management. Crit Rev Clin Lab Sci (2013) 50:163–71. doi: 10.3109/10408363.2013.847897
31. Nie Y, Chen X, Zhang X, Gong H, Zhu M, Qiu B, et al. Plasma Apolipoproteins and Their Ratios as Novel Biomarkers for Type 2 Diabetes Mellitus and Diabetic Retinopathy. Front Endocrinol (2022).
32. Group. BDW. Biomarkers and Surrogate Endpoints: Preferred Definitions and Conceptual Framework. Clin Pharmacol Ther (2001) 69:89–95. doi: 10.1067/mcp.2001.113989
33. García-Gutiérrez MS, Navarrete F, Sala F, Gasparyan A, Austrich-Olivares A, Manzanares J. Biomarkers in Psychiatry: Concept, Definition, Types and Relevance to the Clinical Reality. Front Psychiatry (2020) 11:432. doi: 10.3389/fpsyt.2020.00432
34. Nassar K, Grisanti S, Elfar E, Lüke J, Lüke M, Grisanti S. Serum Cytokines as Biomarkers for Age-Related Macular Degeneration. Graefe's Arch Clin Exp Ophthalmol = Albrecht von Graefes Archiv fur klinische und experimentelle Ophthalmologie (2015) 253:699–704. doi: 10.1007/s00417-014-2738-8
35. Oca AI, Pérez-Sala Á, Pariente A, Ochoa R, Velilla S, Peláez R, et al. Predictive Biomarkers of Age-Related Macular Degeneration Response to Anti-VEGF Treatment. J Pers Med (2021) 11(12):1329. doi: 10.3390/jpm11121329
36. Fenner BJ, Cheung CMG, Sim SS, Lee WK, Staurenghi G, Lai TYY, et al. Evolving Treatment Paradigms for PCV. Eye (London England) (2022) 36:257–65. doi: 10.1038/s41433-021-01688-7
37. Wang Y, Wang M, Zhang X, Zhang Q, Nie J, Zhang M, et al. The Association Between the Lipids Levels in Blood and Risk of Age-Related Macular Degeneration. Nutrients (2016) 8:663. doi: 10.3390/nu8100663
Keywords: polypoidal choroidal vasculopathy, neovascular age-related macular degeneration, serum lipid profiles, apolipoproteins, regulatory mechanisms
Citation: Zhang X, Qiu B, Gong Z, Chen X, Wang Y and Nie Y (2022) Differentially Regulated Apolipoproteins and Lipid Profiles as Novel Biomarkers for Polypoidal Choroidal Vasculopathy and Neovascular Age-Related Macular Degeneration. Front. Endocrinol. 13:946327. doi: 10.3389/fendo.2022.946327
Received: 17 May 2022; Accepted: 03 June 2022;
Published: 19 July 2022.
Edited by:
Lvzhen Huang, Peking University People’s Hospital, ChinaReviewed by:
Iat Fan Lai, Kiang Wu Hospital, Macau, Macao SAR, ChinaJia-Horung Hung, National Cheng Kung University Hospital, Taiwan
Xiaomeng Wang, Duke-NUS Medical School, Singapore
Copyright © 2022 Zhang, Qiu, Gong, Chen, Wang and Nie. This is an open-access article distributed under the terms of the Creative Commons Attribution License (CC BY). The use, distribution or reproduction in other forums is permitted, provided the original author(s) and the copyright owner(s) are credited and that the original publication in this journal is cited, in accordance with accepted academic practice. No use, distribution or reproduction is permitted which does not comply with these terms.
*Correspondence: Xinyuan Zhang, bW16eHkyMDEwQDE2My5jb20=
†These authors share first authorship