 Chunyan Lei
 Jinyue Gu1,2†
 Meixia Zhang
- 1Department of Ophthalmology, West China Hospital, Sichuan University, Chengdu, China
- 2Research Laboratory of Macular Disease, West China Hospital, Sichuan University, Chengdu, China
- 3Department of Ophthalmology, Zigong First People’s Hospital, Zigong, China
Background: Numerous studies have demonstrated that retinal chronic inflammation plays a critical role in the pathogenesis of diabetic macular edema (DME). However, studies about the association between peripheral complete blood count, an inexpensive and easily measurable laboratory index, and DME are limited.
Research design and methods: The current study was a hospital-based, cross-sectional study. The participants were inpatients with type 2 diabetes who underwent vitrectomy for PDR, and the contralateral eyes in these PDR patients meeting the criteria were included in the study. Central macular thickness (CMT) was measured automatically and the DME was characterized as CMT ≥ 300 μm.
Results: A total of 239 PDR participants were enrolled. The average age was 55.46 ± 10.08 years old, and the average CMT was 284.23 ± 122.09 μm. In the fully adjusted model, for CMT, the results revealed a significantly negative association between CMT and both white blood cell (WBC) count and neutrophil count (β = −11.95, 95% CI: −22.08, −1.82; p = 0.0218; β = −14.96, 95% CI: −28.02, −1.90; p = 0.0259, respectively); for DME, the results showed an inverse association between DME and WBC count, monocyte count, and eosinophil count (OR = 0.75, 95% CI: 0.59, 0.95; p = 0.0153; OR = 0.07, 95% CI: 0.00, 0.92; p = 0.0431; OR = 0.03, 95% CI: 0.00, 0.88; p = 0.0420, respectively).
Conclusions: In conclusion, our results suggest that WBC and its subtypes in circulation may play an important role in the pathogenesis of DME in PDR patients.
Introduction
Among the working-age population in developed countries, diabetic retinopathy (DR) is the leading cause of visual impairment (1). Proliferative DR (PDR) is the most advanced stage of DR and is characterized by neovascularization and proliferative membrane formation, which can cause vitreous hemorrhage and tractional retinal detachment, leading to progressive vision loss (2–5). Diabetic macular edema (DME) is caused by the accumulation of intra-retinal fluid due to the breakdown of blood–retinal barrier, resulting in inflammatory changes and retinal thickening (6). DME as a sight-threatening complication can occur at any stage of DR; the prevalence of DME is related to the duration of diabetes mellitus (DM) duration and the severity of DR. PDR and DME frequently co-occur, with the prevalence of DME ranging from 30% to 72.6% in patients with PDR (7, 8).
Previous studies have shown that DM and its microvascular complications are associated with chronic inflammation (9–11). These findings suggested an interaction between inflammation and the pathogenesis of DR. Substantial evidence indicates that retinal inflammation plays a crucial role in the pathogenesis of DME (12), which is well illustrated by current treatment of DME, including intravitreal injection of anti-vascular endothelial growth factor (VEGF) drugs (13, 14) and anti-inflammatory therapy (Ozurdex, triamcinolone acetonide, etc.) (15, 16). The complete blood count is an affordable and readily available test; white blood cell (WBC, also known as leukocyte) and its subtypes are considered to be the biomarkers of inflammatory response, as their activation results in the synthesis of inflammatory cytokines. Recently, increasing concern has been demanded regarding WBC and its subtypes and its relations in several ocular inflammatory conditions such as uveitis (17–19), DR (20–22), and DME (23–25). All these inflammation indexes derived by peripheral complete blood count parameters including the neutrophil-to-lymphocyte ratio (NLR) (24, 26) and systemic immune-inflammation index (SII, calculated as platelet count*neutrophil count/lymphocyte count) (24, 27) have been investigated as potential biomarkers for predicting or guiding treatment in DME.
The risk factors for DME have been extensively explored, including DM duration (28), hypertension (29, 30), glycosylated hemoglobin (HbA1c) levels (31–33), and other factors (29). Numerous studies have demonstrated that retinal chronic inflammation plays a critical role in the pathogenesis of DME. However, whether WBC in circulation is related to DME in PDR patients is still unknown and there have been limited reports in the literature investigating risk factors for DME in patients with PDR. Therefore, we aimed to employ an inexpensive and effective method to study the potential relationship between peripheral blood biomarkers and DME in PDR patients with type 2 DM by blood cell count or blood cell count-derived index.
Materials and methods
Study population
The current study was a hospital-based, cross-sectional study. The study protocol followed the principles of the Declaration of Helsinki and the trial was ethically approved by the West China Hospital of Sichuan University (2020-834). The data were anonymous; therefore, the requirement for informed consent was waived. The participants were inpatients with type 2 diabetes who underwent vitrectomy for PDR at the Ophthalmology Department of West China Hospital of Sichuan University from May 2020 to February 2022, and the contralateral eyes in these PDR patients meeting the criteria were included in the study.
Inclusion criteria were as follows: (1) the contralateral PDR-graded eyes of inpatients undergoing vitrectomy for PDR with clear refractive media and no history of vitrectomy; (2) fasting blood glucose lower than 8 mmol/L; blood glucose < 11 mmol/L 2 h after three meals; consistent blood glucose levels for at least 7 days; and (3) no missing peripheral complete blood count parameters and central macular thickness (CMT). Exclusion criteria were as follows: (1) refractive error exceeding ± 6.00 diopters, or an axial length of more than 26.50 mm; (2) acquired immune deficiency syndrome, syphilis, or leukemia; (3) type 1 diabetes; and (4) neovascular glaucoma or iris neovascularization, retinal vein occlusion, retinal artery occlusion, uveitis, age-related macular degeneration, paracentral acute middle maculopathy, ocular trauma, endophthalmitis, and vitreomacular interface abnormalities, such as vitreomacular traction and epiretinal membrane.
Laboratory variables
For all relevant laboratory tests, all participants underwent a forearm venous puncture for peripheral overnight fasting blood (fasting for at least 8 h) extraction and were sent to the central laboratory for measurement in 2 h. Complete blood counts were obtained using an automated hematology analyzer (Japan Sysmex company’s automatic XN-9000/XN-9100/XN3100 five-classification blood cell analyzer) for detection. Complete blood count parameters were as follows: red blood count (RBC), hemoglobin, platelet count, and WBC and its subtypes including neutrophil, lymphocyte, monocyte, eosinophil, and basophil. In addition to complete blood counts themselves, we also used indicators generated by parameters in whole blood cells such as NLR, platelet-to-lymphocyte ratio (PLR), lymphocyte-to-monocyte ratio (LMR), and SII; the aforementioned indicators have been investigated as potential risk markers in several clinical conditions. Fasting laboratory values included serum lipid profile, fasting blood glucose, preoperative HbA1c, serum creatinine, and estimated glomerular filtration rate (eGFR).
Optical coherence tomography imaging
All participants underwent comprehensive ocular examinations on admission (on the same day), including visual acuity, intraocular pressure, axial length, slit-lamp examination, and enhanced depth imaging-optical coherence tomography (OCT). The OCT examination was conducted after pupil dilation with compound tropicamide eye drops (Mydrin-P; Santen, Osaka, Japan). The standardized OCT scans were obtained using spectral-domain (SD) OCT (Heidelberg Engineering; Heidelberg, Germany) by horizontal/vertical scans and carried out by experienced technicians in the afternoon. The CMT centered on the fovea was measured automatically. CMT was defined as the vertical distance from the macular inner limiting membrane to the retinal pigment epithelium. The measurements were performed independently by two experienced physicians blinded to patients’ clinical data, and the average of all measurements was used for the final statistical analysis.
Patients with CMT measured as ≥300 μm could perform intravitreal anti-VEGF inhibitors or steroid injections (34). Therefore, in the current study, the DME was characterized as CMT ≥ 300 μm.
Other variables
The relevant baseline characteristics that were important in the management of hospitalized patients with PDR were retrieved from the electronic medical record system. Demographic information included age, sex, and educational level. The educational level was grouped into less than 12th grade, high school, and college or above. Hypertension history was defined as physician diagnosis or the use of antihypertensive medications. DM was defined as physician diagnosis or the use of insulin/diabetic tablets. Relevant medical history included the duration of diabetes, hypertension, chronic kidney disease, stroke, and heart disease. The degree of panretinal photocoagulation (PRP) in the contralateral eyes of patients with PDR and the history of anti-VEGF treatment were collected. The degree of PRP was grouped into three categories, none, partial, and whole, according to the scope of the laser. All of the above data were obtained from the medical conditions that were self-reported by participants. Systemic medication history was extracted, including oral glucose-lowering drugs, insulin treatment, and oral antihypertensive drugs. Physical characteristics were extracted for the initial presentation, including height, weight, and systolic and diastolic blood pressure. The body mass index (BMI) was calculated as the weight (kilogram) divided by the height (meter) squared.
Statistical analysis
Demographic characteristics and findings were summarized using descriptive statistics. Continuous variables were summarized as means ± standard deviation, and the categorical variables were summarized as frequencies and percentages. We compared the data distribution of each covariate between two groups with or without DME using the t-test (normal distribution) or Kruskal–Wallis rank-sum test (non-normal distribution) for continuous variables and χ2 tests for categorical data. Multivariate linear regression analysis was used to detect the independent association of complete blood count parameters with CMT, and logistic regression analysis was used to detect the independent association of complete blood count parameters with DME.
We selected candidate confounders based on their associations with the outcomes of interest or a change in effect estimate of greater than 10% (35). Statistical analyses were performed using R software, version 3.4.3 (http://www.R-project.org/, The R Foundation) and Empower Stats (http://www.empowerstats.com; X&Y Solutions Inc., Boston, MA). A two-sided p < 0.05 was considered to be statistically significant.
Results
Baseline characteristics of participants
A total of 239 participants with PDR were enrolled in the final analysis. The average age of the participants was 55.46 ± 10.08 years old, and 58.16% of them were men. The average CMT was 284.23 ± 122.09 μm and the average axial length was 23.18 ± 0.98 mm. Except for BMI, visual acuity (logMAR), WBC count, neutrophil count, monocyte count, direct bilirubin, and anti-VEGF therapy, there was no statistical difference in other variables between the two groups. Baseline characteristics of participants are shown in Table 1.
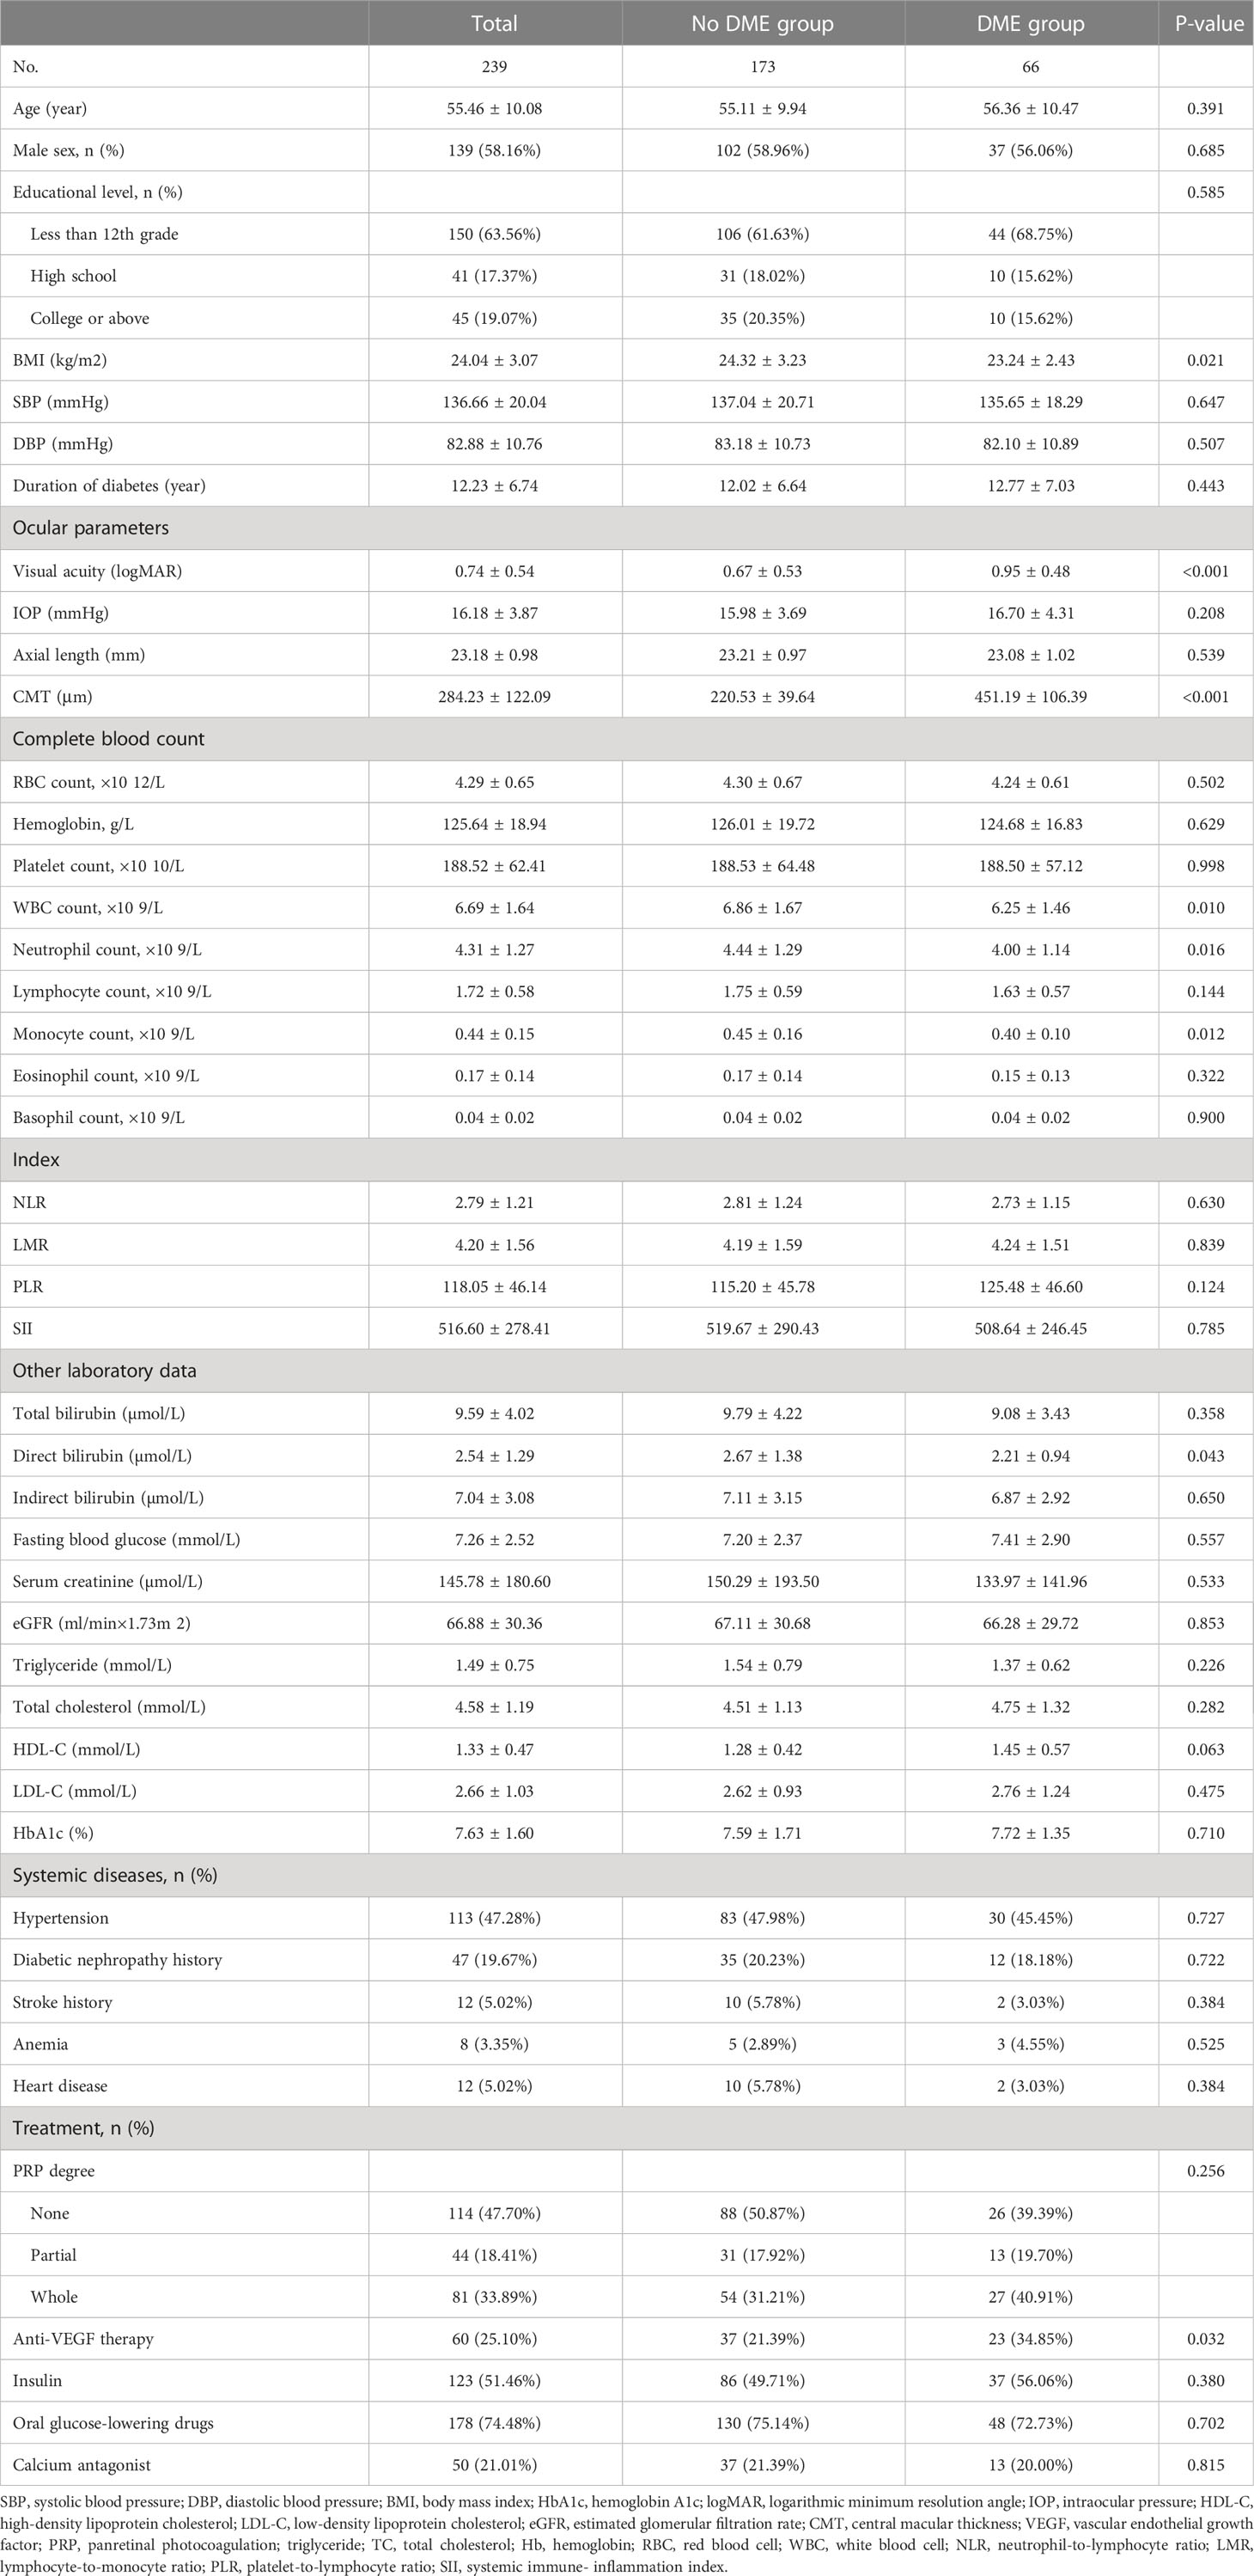
Table 1 Baseline characteristics of participants.
Univariate analysis
As for CMT, univariate analysis results showed a significant negative correlation between WBC count, neutrophil count, and CMT in participants (β = −12.04, 95% CI: −21.42, −2.67; p = 0.0124; β = −17.68, 95% CI: −29.82, −5.54; p = 0.0047, respectively). Apart from the factors aforementioned, no other complete blood count parameters were found to be associated with CMT. There was a statistically significant difference in CMT by BMI, visual acuity, and anti-VEGF therapy.
As for DME, univariate analysis results revealed a significant inversely association between WBC count, neutrophil count, monocyte count, and DME in PDR participants (OR = 0.78, 95% CI: 0.64, 0.94; p = 0.0108; OR = 0.74, 95% CI: 0.58, 0.95; p = 0.0179; OR = 0.06, 0.57, 95% CI: 0.01, 0.57; p = 0.0139, respectively). Apart from the factors mentioned above, no other complete blood count parameters were found to be associated with DME. In addition, there was a statistically significant association between BMI, direct bilirubin, visual acuity, anti-VEGF therapy, and DME in PDR participants. The results of univariate analysis are listed in Table 2.

Table 2 The results of univariate analysis.
The relationship between complete blood count parameters and both CMT and DME in patients with PDR
We used multivariate linear regression models to assess the relationship between complete blood count parameters and CMT and logistic regression analysis to detect the association between complete blood count parameters and DME in PDR patients (Table 3). Three adjusted models are shown in Table 3.
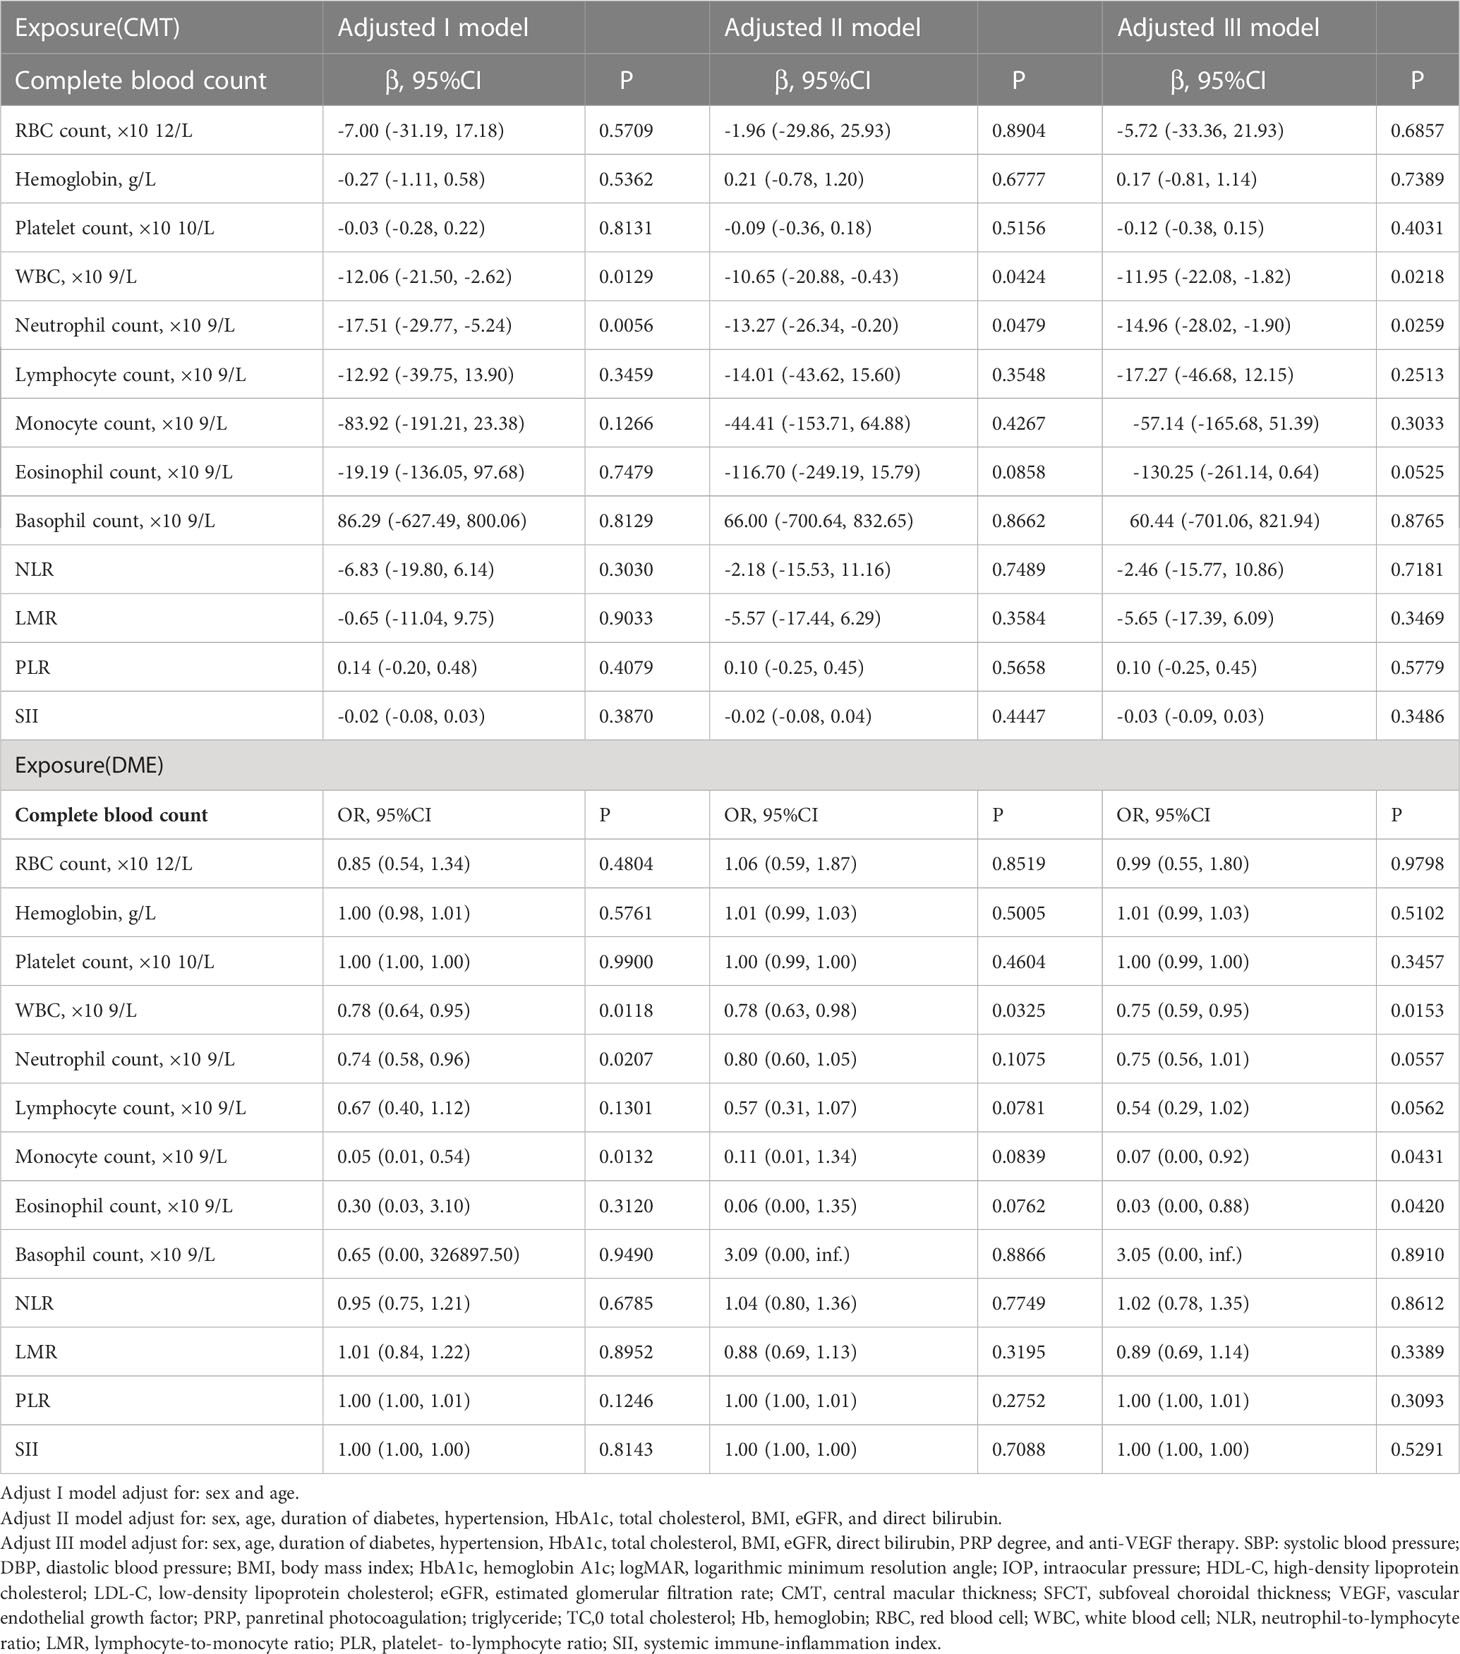
Table 3 Relationship between complete blood count parameters and central macular thickness/diabetic macular edema in Chinese patients with proliferative diabetic retinopathy in different models.
For CMT, in adjusted model I (adjusted age and sex), CMT was significantly associated with WBC count and neutrophil count (β = −12.06, 95% CI: −21.50, −2.62; p = 0.0129; β = −17.51, 95% CI: −29.77, −5.24; p = 0.0056, respectively). In adjusted model II (adjusted sex, age, duration of diabetes, hypertension, HbA1c, total cholesterol, BMI, eGFR, and direct bilirubin), the results revealed a significantly negative association between CMT and both WBC count and neutrophil count (β = −10.65, 95% CI: −20.88, −0.43; p = 0.0424; β = −13.27, 95% CI: −26.34, −0.20; p = 0.0479, respectively). Furthermore, in adjusted model III (adjusted sex, age, duration of diabetes, hypertension, HbA1c, total cholesterol, BMI, eGFR, direct bilirubin, PRP degree, and anti-VEGF therapy), the results were consistent (β = −11.95, 95% CI: −22.08, −1.82; p = 0.0218; β = −14.96, 95% CI: −28.02, −1.90; p = 0.0259, respectively). Apart from the factors aforementioned, no other complete blood count parameters were found to be associated with CMT.
For DME, in adjusted model I (adjusted age and sex), DME was inversely associated with WBC count, neutrophil count, and monocyte count (OR = 0.78, 95% CI: 0.64, 0.95; p = 0.0118; OR = 0.74, 95% CI: 0.58, 0.96; p = 0.0207; OR = 0.05, 95% CI: 0.01, 0.54; p = 0.0132, respectively). In adjusted model II (adjusted sex, age, duration of diabetes, hypertension, HbA1c, total cholesterol, BMI, eGFR, and direct bilirubin), the results revealed a significant association between DME and WBC count (OR = 0.78, 95% CI: 0.63, 0.98; p = 0.0325). Furthermore, in adjusted model III (adjusted sex, age, duration of diabetes, hypertension, HbA1c, total cholesterol, BMI, eGFR, direct bilirubin, PRP degree, and anti-VEGF therapy), the results revealed an inverse association between DME and WBC count, monocyte count, eosinophil count (OR = 0.75, 95% CI: 0.59, 0.95; p = 0.0153; OR= 0.07, 95% CI: 0.00, 0.92; p = 0.0431; OR= 0.03, 95% CI: 0.00, 0.88; p = 0.0420, respectively). Apart from the factors aforementioned, no other complete blood count parameters were found to be associated with DME.
The relationship between inflammation indexes and both CMT and DME in PDR patients
In the present study, all the inflammation indexes derived by peripheral complete blood count parameters including NLR, PLR, LMR, and SII were not associated with CMT/DME. The results are shown in Table 3.
Discussion
The results of the present study provide evidence that lower physiological peripheral WBC levels were associated with increased CMT as well as odds of DME in Chinese patients with PDR. However, WBC subtypes associated with DME as well as CMT are inconsistent, and some indicators are cutoff values. CMT was associated with the neutrophil count, while eosinophil count showed a cutoff value. DME was correlated with monocyte and eosinophil counts, while neutrophil and lymphocyte counts showed a cutoff value. All other laboratory parameters in complete blood count did not reach statistical significance. Taken together, our results indicated that the peripheral WBC concentrations as well as some of its subtypes, even at normal concentrations in the physiological range, might play a crucial role in the pathogenesis of DME in Chinese PDR patients. As far as we know, this is the first study targeting the association between peripheral complete blood count parameters and CMT as well as in patients with PDR.
WBC subtypes include neutrophil, monocyte, lymphocyte, eosinophil, and basophil, and their total numbers make up the WBC count. Neutrophils have previously been implicated in the pathogenesis of DR (20, 36), and their ability to kill microvascular endothelial cells in vitro may be related to retinal capillary degeneration observed in diabetes (20, 37). Recently, Lessieur and collaborators (38) confirmed that neutrophil-derived proteases contribute to the pathogenesis of early DR. In short, neutrophils seem to be positively correlated with DR. Few studies have explored the relationship between neutrophils and DME in PDR patients. Contrary to our expectations, our results showed that neutrophils were negatively associated with CMT, while the relationship between neutrophil counts and DME showed a cutoff value.
For peripheral blood monocytes, our results demonstrated that DME was inversely correlated with monocytes. Wan et al. (21) demonstrated that in diabetic adults, decreased peripheral blood monocyte levels are associated with increased odds of DR after adjusting for potential confounders. They suggested that the attraction and influx of monocytes into the retina by adhering to the outer surface of retinal capillaries and disrupting the blood–retinal barrier may reduce the level of monocytes in the peripheral blood (39, 40). For peripheral blood lymphocytes, Zhu et al. (23) found the inverse relationship between and DME, indicating that for patients suffering from severe DR, lymphocyte percentage may be an important diagnostic tool for detecting the onset and progress of DME. Our results showed a critical association between DME and lymphocyte counts, but no association between CMT and lymphocyte counts. Therefore, at present, we are unable to make a firm conclusion about the relationship between DME and lymphocytes, which needs to increase the sample size for further exploration. In the present study, eosinophils were reversely associated with DME and critically related to CMT. While basophils had no relationship with CMT and DME.
Compelling evidence suggests that the elevated physiological WBC count is associated with the presence and severity of DR (41–44) as well as DME (45). A cross-sectional study of 3,776 Chinese diabetic patients by Tong et al. (41) showed that WBC counts within the normal range had a positive correlation with DR. Moradi et al. (42) found that the increase of WBC count in the physiological range was also related to the presence of DR. A study (45) aiming to investigate potential associations between peripheral blood biomarkers and morphological features of retinal imaging in DME patients revealed that the presence of hyperreflective foci on SD-OCT was found to be associated with significantly elevated WBC count. The previous work (46) demonstrated that adherent leukocytes are temporally and spatially associated with retinal endothelial cell damage and death within 1 week of streptozotocin-induced experimental diabetes in rats. Taken together, even within the normal physiological range, leukocytosis appears to be associated with a high incidence of DR and DME. However, the aforementioned results are different from our study. In the current study, we found that lower physiological serum WBC levels were associated with increased CMT as well as the odds of DME in Chinese patients with PDR.
In general, our results suggested that WBC and some subtypes with lower physiological levels have an association with increased CMT as well as increased odds of DME, which is different from other studies. The following reasons might account for this: First, differences in study populations can lead to inconsistent results. The previously studied population included DME patients from all stages of DR. In the present study, all Chinese PDR patients were comparable in their DR stages. Under the unified classification of diabetes and DR staging, it is more reasonable to study the relationship of WBC and its subtypes with CMT and DME. Second, PDR is characterized by neovascularization and proliferative membrane formation. WBCs may enter the retina through the compromised blood–retinal barrier, such as neovascularization. Compared to patients without DME, PDR patients with DME have more severe damage to the blood–retinal barrier, which may lead to an increase in WBCs in the bloodstream entering the eye, leading to a decrease in WBCs and all subtypes in circulation. Last, the sample size or statistical sensitivity to indicators may be responsible for the results between different subtypes and DME as well as CMT.
Increasing evidence has shown that inflammation indexes derived by peripheral complete blood count parameters are associated with DME (24–27). Elbeyli and collaborators (27) revealed that the SII may be a diagnostic biomarker for identifying DME to improve the risk stratification and management of patients with non-PDR. Özata Gündoğdu et al. (24) confirmed that NLR and SII levels were significantly higher in DME with serous macular detachment. There have been limited reports in the literature comparing CMT and DME with LMR and PLR and we have not found any evidence of the association between CMT as well as DME and LMR as well as PLR. In the current study, we failed to find any association between inflammatory indexes and DR as well as DME in Chinese patients with PDR, which is inconsistent with previous studies. We believe that the following were the reasons: First, our study population is PDR patients with type 2 diabetes requiring PPV surgery, which is inconsistent with other studies. Second, the classification of DME is mainly carried out by CMT. Although it reflects some characteristics of DME to a certain extent, it is not classified in detail and accurately. Because the sample of subjects in the previous study was smaller than ours and we could control for almost all possible risk factors for DME, we believe the association between inflammatory indexes and CMT as well as DME has not been established and that inflammatory indexes should not be used as a target for DME monitoring in Chinese PDR patients.
Our study has some advantages. First, we investigated the relationship between not only CMT, but also a dichotomous variable (DME) defined by CMT, and complete blood count, which is useful for assessing the robustness of data analysis. Second, this was a hospital-based cross-sectional study and therefore prone to potential confounding. However, we used strict statistical adjustments to minimize the effect of residual confounders. Last, the results of the present study provide new ideas for studying the relationship between CMT/DME and WBC as well as its subtypes. As biomarkers for the progression of DME in PDR patients, their clinical significance deserves further study.
However, the current study has some limitations. First, the study design was cross-sectional; thus, the causal relationship between CMT as well as DME and WBC as well as its subtypes cannot be determined. These findings should be interpreted with caution, and further longitudinal studies are required. Second, we just used the CMT to define DME, without a more detailed classification. The relationship between both WBC and its subtypes and different types of DME is unclear and needs further study. Moreover, since the study population was all Chinese PDR patients, the generalization of the results may be limited. Despite these limitations, we believe our study is valuable in that we analyzed many clinical and laboratory parameters in PDR subjects and showed a novel clinical risk factor for DME. More well-designed prospective longitudinal studies are necessary to confirm our findings and to further define the role of serum WBC and its subtypes in Chinese patients with PDR.
Conclusions
In conclusion, this clinical study demonstrated that lower physiological WBC levels are associated with increased CMT as well as the odds of DME in Chinese patients with PDR. Our results suggest that WBC and its subtypes in circulation may play an important role in the pathogenesis of DME in PDR patients.
Data availability statement
The raw data supporting the conclusions of this article will be made available by the authors, without undue reservation.
Ethics statement
The study protocol followed the principles of the Declaration of Helsinki and the trial was ethically approved by the West China Hospital of Sichuan University (2020-834). Written informed consent for participation was not required for this study in accordance with the national legislation and the institutional requirements. The data were anonymous and informed consent was waived by the approving Institutional Review Board because of the retrospective nature of the study.
Author contributions
Conceptualization: CL and MZ. Data collection: JG and KZ. Formal analysis: CL. Validation: JG and LL. Supervision: MZ. Writing—original draft: CL and JG. Writing—review and editing: CL and MZ. All authors contributed to the article and approved the submitted version.
Funding
This work was supported by the 1.3.5 project for disciplines of excellence, West China Hospital, Sichuan University (ZYJC21025), and Sichuan Provincial Science and Technology Support Project (no. 2021ZYD0110). These funding organizations had no role in the design or conduction of this research.
Conflict of interest
The authors declare that the research was conducted in the absence of any commercial or financial relationships that could be construed as a potential conflict of interest.
Publisher’s note
All claims expressed in this article are solely those of the authors and do not necessarily represent those of their affiliated organizations, or those of the publisher, the editors and the reviewers. Any product that may be evaluated in this article, or claim that may be made by its manufacturer, is not guaranteed or endorsed by the publisher.
Abbreviations
DR, Diabetic retinopathy; PDR, Proliferative diabetic retinopathy; DME, Diabetic macular edema; DM, Diabetes mellitus; VEGF, Vascular endothelial growth factor; WBC, White blood cell; NLR, Neutrophil-to-lymphocyte ratio; SII, Systemic immune-inflammation index; HbA1c, Glycosylated hemoglobin; CMT, Central macular thickness; PLR, Platelet-to-lymphocyte ratio; LMR, Lymphocyte-to-monocyte ratio; eGFR, Estimated glomerular filtration rate; OCT, Optical coherence tomography; SD, Spectral domain; PRP, Panretinal photocoagulation; BMI, Body mass index.
References
1. Kocur I, Resnikoff S. Visual impairment and blindness in Europe and their prevention. Br J Ophthalmol (2002) 86(7):716–22. doi: 10.1136/bjo.86.7.716
2. Wu L, Fernandez-Loaiza P, Sauma J, Hernandez-Bogantes E, Masis M. Classification of diabetic retinopathy and diabetic macular edema. World J Diabetes (2013) 4(6):290–4. doi: 10.4239/wjd.v4.i6.290
3. Yau JW, Rogers SL, Kawasaki R, Lamoureux EL, Kowalski JW, Bek T, et al. Global prevalence and major risk factors of diabetic retinopathy. Diabetes Care (2012) 35(3):556–64. doi: 10.2337/dc11-1909
4. Cheung N, Mitchell P, Wong TY. Diabetic retinopathy. Lancet (2010) 376(9735):124–36. doi: 10.1016/S0140-6736(09)62124-3
6. Tan GS, Cheung N, Simo R, Cheung GC, Wong TY. Diabetic macular oedema. Lancet Diabetes Endocrinol (2017) 5(2):143–55. doi: 10.1016/S2213-8587(16)30052-3
7. Rush RB, Del Valle Penella A, Reinauer RM, Rush SW, Bastar PG. Internal limiting membrane peeling during vitrectomy for diabetic vitreous hemorrhage: a randomized clinical trial. Retina (2021) 41(5):1118–26. doi: 10.1097/IAE.0000000000002976
8. Acan D, Calan M, Er D, Arkan T, Kocak N, Bayraktar F, et al. The prevalence and systemic risk factors of diabetic macular edema: a cross-sectional study from Turkey. BMC Ophthalmol (2018) 18(1):91. doi: 10.1186/s12886-018-0753-y
9. Fujita T, Hemmi S, Kajiwara M, Yabuki M, Fuke Y, Satomura A, et al. Complement-mediated chronic inflammation is associated with diabetic microvascular complication. Diabetes Metab Res Rev (2013) 29(3):220–6. doi: 10.1002/dmrr.2380
10. Grossmann V, Schmitt VH, Zeller T, Panova-Noeva M, Schulz A, Laubert-Reh D, et al. Profile of the immune and inflammatory response in individuals with prediabetes and type 2 diabetes. Diabetes Care (2015) 38(7):1356–64. doi: 10.2337/dc14-3008
11. Pitsavos C, Tampourlou M, Panagiotakos DB, Skoumas Y, Chrysohoou C, Nomikos T, et al. Association between low-grade systemic inflammation and type 2 diabetes mellitus among men and women from the ATTICA study. Rev Diabetes Stud (2007) 4(2):98–104. doi: 10.1900/RDS.2007.4.98
12. Forrester JV, Kuffova L, Delibegovic M. The role of inflammation in diabetic retinopathy. Front Immunol (2020) 11:583687. doi: 10.3389/fimmu.2020.583687
13. Shao Y, Wang M, Zhu Y, Li X, Liu J. Association of metformin treatment with enhanced effect of anti-VEGF agents in diabetic macular edema patients. Acta Diabetol (2022) 59(4):553–9. doi: 10.1007/s00592-021-01833-4
14. Matsunaga DR, Salabati M, Obeid A, Wibbelsman TD, Wu C, Mahmoudzadeh R, et al. Outcomes of eyes with diabetic macular edema that are lost to follow-up after anti-vascular endothelial growth factor therapy. Am J Ophthalmol (2022) 233:1–7. doi: 10.1016/j.ajo.2021.06.028
15. Yuan Q, Liu Y, Xu H, Gao Y, Qin L, Gou Y, et al. Efficacy and safety of single-dose dexamethasone implantation for patients with persistent diabetic macular edema: a systematic review and meta-analysis. Graefes Arch Clin Exp Ophthalmol (2022) 260(2):405–13. doi: 10.1007/s00417-021-05369-9
16. Duphare C, Desai K, Gupta P, Patel BC. Diabetic macular edema. Treasure Island (FL: StatPearls Publishing LLC (2022).
17. Shadmanfar S, Masoumi M, Davatchi F, Shahram F, Akhlaghi M, Faezi ST, et al. Correlation of clinical signs and symptoms of behçet's disease with platelet-to-lymphocyte ratio (PLR) and neutrophil-to-lymphocyte ratio (NLR). Immunol Res (2021) 69(4):363–71. doi: 10.1007/s12026-021-09194-4
18. Yildiz Balci S, Turan-Vural E, Turkyilmaz O, Esen F, Aksaray S, et al. Complete blood count parameters and neutrophil-to-lymphocyte ratio values as markers for differentiation between systemic infectious and non-infectious uveitis. Int Ophthalmol (2020) 40(11):3033–41. doi: 10.1007/s10792-020-01487-1
19. Yildiz Balci S, Kose AO, Yildiz MB, Ozcaliskan S. Systemic inflammatory biomarkers in patients with fuchs' uveitis syndrome: Neutrophil/Lymphocyte ratio and Platelet/Lymphocyte ratio. J Coll Physicians Surg Pak (2020) 30(7):722–5. doi: 10.29271/jcpsp.2020.07.722
20. Woo SJ, Ahn SJ, Ahn J, Park KH, Lee K. Elevated systemic neutrophil count in diabetic retinopathy and diabetes: a hospital-based cross-sectional study of 30,793 Korean subjects. Invest Ophthalmol Vis Sci (2011) 52(10):7697–703. doi: 10.1167/iovs.11-7784
21. Wan H, Cai Y, Wang Y, Fang S, Chen C, Chen Y, et al. The unique association between the level of peripheral blood monocytes and the prevalence of diabetic retinopathy: a cross-sectional study. J Transl Med (2020) 18(1):248. doi: 10.1186/s12967-020-02422-9
22. Obasanmi G, Lois N, Armstrong D, Lavery NJ, Hombrebueno JR, Lynch A, et al. Circulating leukocyte alterations and the Development/Progression of diabetic retinopathy in type 1 diabetic patients - a pilot study. Curr Eye Res (2020) 45(9):1144–54. doi: 10.1080/02713683.2020.1718165
23. Zhu Y, Cai Q, Li P, Zhou Y, Xu M, Song Y. The relationship between peripheral blood inflammatory markers and diabetic macular edema in patients with severe diabetic retinopathy. Ann Palliat Med (2022) 11(3):984–92. doi: 10.21037/apm-22-102
24. Özata Gündoğdu K, Doğan E, Çelik E, Alagöz G. Serum inflammatory marker levels in serous macular detachment secondary to diabetic macular edema. Eur J Ophthalmol (2022) 32:11206721221083465. doi: 10.1177/11206721221083465
25. Ilhan C, Citirik M, Uzel MM, Kiziltoprak H, Tekin K. The usefulness of systemic inflammatory markers as diagnostic indicators of the pathogenesis of diabetic macular edema. Arq Bras Oftalmol (2020) 83(4):299–304. doi: 10.5935/0004-2749.20200051
26. Yalinbas Yeter D, Eroglu S, Sariakcali B, Bozali E, Vural Ozec A, Erdogan H. The usefulness of monocyte-to-High density lipoprotein and neutrophil-to-Lymphocyte ratio in diabetic macular edema prediction and early anti-VEGF treatment response. Ocul Immunol Inflammation (2021) 30:1–6. doi: 10.1080/09273948.2020.1849739
27. Elbeyli A, Kurtul BE, Ozcan SC, Ozarslan Ozcan D. The diagnostic value of systemic immune-inflammation index in diabetic macular oedema. Clin Exp Optom (2021) 105:1–5. doi: 10.1080/08164622.2021.1994337
28. Liu LY, Dong FT, Li H. [Relationship between the classification of diabetic macular edema and its related factors]. Zhongguo Yi Xue Ke Xue Yuan Xue Bao (2007) 29(6):797–802.
29. Lee SJ, Choi MG. Association of manganese superoxide dismutase gene polymorphism (V16A) with diabetic macular edema in Korean type 2 diabetic patients. Metabolism (2006) 55(12):1681–8. doi: 10.1016/j.metabol.2006.08.011
30. Aroca PR, Salvat M, Fernandez J, Mendez I. Risk factors for diffuse and focal macular edema. J Diabetes Complicat (2004) 18(4):211–5. doi: 10.1016/S1056-8727(03)00038-2
31. Park S, Rhee SY, Jeong SJ, Kim K, Chon S, Yu SY, et al. Features of long-standing Korean type 2 diabetes mellitus patients with diabetic retinopathy: a study based on standardized clinical data. Diabetes Metab J (2017) 41(5):393–404. doi: 10.4093/dmj.2017.41.5.393
32. Martin-Merino E, Fortuny J, Rivero-Ferrer E, Lind M, Garcia-Rodriguez LA. Risk factors for diabetic macular oedema in type 2 diabetes: a case-control study in a united kingdom primary care setting. Prim Care Diabetes (2017) 11(3):288–96. doi: 10.1016/j.pcd.2017.03.002
33. Ylinen P, Laine I, Lindholm JM, Tuuminen R. Poor glycemic control as a risk factor for pseudophakic cystoid macular edema in patients with diabetes. J Cataract Refract Surg (2017) 43(11):1376–82. doi: 10.1016/j.jcrs.2017.07.035
34. Massin P, Bandello F, Garweg JG, Hansen LL, Harding SP, Larsen M. Safety and efficacy of ranibizumab in diabetic macular edema (RESOLVE study): a 12-month, randomized, controlled, double-masked, multicenter phase II study. Diabetes Care (2010) 33(11):2399–405. doi: 10.2337/dc10-0493
35. Jaddoe VW, de Jonge LL, Hofman A, Franco OH, Steegers EA, Gaillard R, et al. First trimester fetal growth restriction and cardiovascular risk factors in school age children: population based cohort study. BMJ (2014) 348:g14. doi: 10.1136/bmj.g14
36. Kim SY, Johnson MA, McLeod DS, Alexander T, Hansen BC, Lutty GA, et al. Neutrophils are associated with capillary closure in spontaneously diabetic monkey retinas. Diabetes (2005) 54(5):1534–42. doi: 10.2337/diabetes.54.5.1534
37. Smedly LA, Tonnesen MG, Sandhaus RA, Haslett C, Guthrie LA, Johnston RB Jr, et al. Neutrophil-mediated injury to endothelial cells. enhancement by endotoxin and essential role of neutrophil elastase. J Clin Invest (1986) 77(4):1233–43. doi: 10.1172/JCI112426
38. Lessieur EM, Liu H, Saadane A, Du Y, Tang J, Kiser J, et al. Neutrophil-derived proteases contribute to the pathogenesis of early diabetic retinopathy. Invest Ophthalmol Vis Sci (2021) 62(13):7. doi: 10.1167/iovs.62.13.7
39. Rangasamy S, McGuire PG, Franco Nitta C, Monickaraj F, Oruganti SR, Das A. Chemokine mediated monocyte trafficking into the retina: role of inflammation in alteration of the blood-retinal barrier in diabetic retinopathy. PloS One (2014) 9(10):e108508. doi: 10.1371/journal.pone.0108508
40. Benhar I, Reemst K, Kalchenko V, Schwartz M. The retinal pigment epithelium as a gateway for monocyte trafficking into the eye. EMBO J (2016) 35(11):1219–35. doi: 10.15252/embj.201694202
41. Tong PC, Lee KF, So WY, Ng MH, Chan WB, Lo MK, et al. White blood cell count is associated with macro- and microvascular complications in chinese patients with type 2 diabetes. Diabetes Care (2004) 27(1):216–22. doi: 10.2337/diacare.27.1.216
42. Moradi S, Kerman SR, Rohani F, Salari F. Association between diabetes complications and leukocyte counts in Iranian patients. J Inflammation Res (2012) 5:7–11. doi: 10.2147/JIR.S26917
43. Miyamoto K, Ogura Y. Pathogenetic potential of leukocytes in diabetic retinopathy. Semin Ophthalmol (1999) 14(4):233–9. doi: 10.3109/08820539909069542
44. Miyamoto K, Khosrof S, Bursell SE, Rohan R, Murata T, Clermont AC, et al. Prevention of leukostasis and vascular leakage in streptozotocin-induced diabetic retinopathy via intercellular adhesion molecule-1 inhibition. Proc Natl Acad Sci U.S.A. (1999) 96(19):10836–41. doi: 10.1073/pnas.96.19.10836
45. Dimitriou E, Sergentanis TN, Lambadiari V, Theodossiadis G, Theodossiadis P, Chatziralli I, et al. Correlation between imaging morphological findings and laboratory biomarkers in patients with diabetic macular edema. J Diabetes Res (2021) 2021:6426003. doi: 10.1155/2021/6426003
Keywords: diabetic macular edema, proliferative diabetic retinopathy, peripheral complete blood count, inflammation, white blood cell (WBC)
Citation: Lei C, Gu J, Liu L, Zhang K and Zhang M (2023) The correlation between peripheral complete blood count parameters and diabetic macular edema in proliferative diabetic retinopathy patients: a cross-sectional study. Front. Endocrinol. 14:1190239. doi: 10.3389/fendo.2023.1190239
Received: 20 March 2023; Accepted: 30 June 2023;
Published: 19 July 2023.
Edited by:
Åke Sjöholm, Gävle Hospital, SwedenReviewed by:
Haiyan Wang, Shaanxi Eye Hospital, ChinaEmbong Zunaina, Universiti Sains Malaysia, Malaysia
Copyright © 2023 Lei, Gu, Liu, Zhang and Zhang. This is an open-access article distributed under the terms of the Creative Commons Attribution License (CC BY). The use, distribution or reproduction in other forums is permitted, provided the original author(s) and the copyright owner(s) are credited and that the original publication in this journal is cited, in accordance with accepted academic practice. No use, distribution or reproduction is permitted which does not comply with these terms.
*Correspondence: Meixia Zhang, emhhbmdtZWl4aWFAc2N1LmVkdS5jbg==
†These authors have contributed equally to this work
‡ORCID: Meixia Zhang, orcid.org/0000-0002-2633-6819