 Nikolai Lebedev
 Sarah M. Strycharz-Glaven
 Leonard M. Tender
- Center for Biomolecular Science and Engineering, US Naval Research Laboratory, Washington, DC, USA
Atomic force microscopy and confocal resonance Raman microscopy (CRRM) of single-cells were used to study the transition of anode-grown Geobacter sulfurreducens biofilms from lag phase (initial period of low current) to exponential phase (subsequent period of rapidly increasing current). Results reveal that lag phase biofilms consist of lone cells and tightly packed single-cell thick clusters crisscrossed with extracellular linear structures that appears to be comprised of nodules approximately 20 nm in diameter aligned end to end. By early exponential phase, cell clusters expand laterally and a second layer of closely packed cells begins to form on top of the first. Abundance of c-type cytochromes (c-Cyt) is threefold greater in two-cell thick regions than in one-cell thick regions. The results indicate that early biofilm growth involves two transformations. The first is from lone cells to two-dimensionally associated cells during lag phase when current remains low. This is accompanied by formation of extracellular linear structures. The second is from two- to three-dimensionally associated cells during early exponential phase when current begins to increase rapidly. This is accompanied by a dramatic increase in c-Cyt abundance.
Introduction
Anode-grown Geobacter sulfurreducens biofilms attract significant attention because they are considered as model bio-electrochemical systems (BES) in which microorganisms are used to catalyze desirable electrode reactions such as oxidation of organic matter in wastewater for power generation (Richter et al., 2009; Katuri et al., 2010; Marsili et al., 2010; Rollefson et al., 2011; Tender, 2011; Bond et al., 2012; Hasan et al., 2012; Katuri et al., 2012; Snider et al., 2012; Strycharz-Glaven and Tender, 2012a; Zhu et al., 2012; Lebedev et al., 2014). All cells in an anode-grown G. sulfurreducens biofilm, which can grow to more than 20 cells thick, appear to be catalytically active, coupling acetate oxidation with transport of their respired electrons to the underlying anode resulting in current (Franks et al., 2010). It is not clear how electron transport occurs through a G. sulfurreducens biofilm to the underlying electrode surface (referred to here as extracellular electron transport, EET) (Bond et al., 2012; Strycharz-Glaven and Tender, 2012b). G. sulfurreducens cells possess an abundance of c-type cytochromes (c-Cyt) on their outer membrane, in secreted extracellular polymeric substances (EPS) and along pili (extracellular protein filaments) (Bond et al., 2012), and substantial data implicate c-Cyt as playing pivotal roles as redox cofactors in EET (Liu et al., 2011; Millo et al., 2011; Bond et al., 2012; Liu and Bond, 2012; Pirbadian and El-Naggar, 2012; Strycharz-Glaven and Tender, 2012b; Virdis et al., 2012; Robuschi et al., 2013; Lebedev et al., 2014).
When G. sulfurreducens is grown on an anode (an electrode poised at a sufficiently positive potential to act as a metabolic electron acceptor for G. sulfurreducens), the resulting biofilm exhibits distinct growth phases, analogous to cells grown in batch reactors, when current is monitored over time (Marsili et al., 2010; Strycharz-Glaven and Tender, 2012a; Hall et al., 2014) (Figure S1 in Supplementary Material). Here, current, which is proportional to the rate of electron transfer to the anode by the biofilm, scales linearly with biomass accumulation on the electrode surface (Marsili et al., 2008). The exception is lag phase, when biomass accumulation occurs at a faster rate than the rate at which current increases (Marsili et al., 2008). Most investigations of anode-grown G. sulfurreducens biofilms have focused on stationary phase biofilms – those that have achieved a maximum steady state current and biomass (Dalton et al., 1990; Forster et al., 2004; Liu et al., 2011; Millo et al., 2011; Liu and Bond, 2012; Virdis et al., 2012; Robuschi et al., 2013; Lebedev et al., 2014). In the present work, we focus attention on early biofilm growth, specifically the transition from lag phase to early exponential phase as EET begins to develop, in order to advance understanding of the underlying mechanisms of EET. We analyze biofilm structure by topological and phase AFM and local abundance of c-Cyt by Confocal Resonance Raman Microscopy (CRRM). The key observation is that during lag phase, lone cells proliferate, forming closely packed one-cell thick clusters that cover as much as 25–30% of the electrode surface area without resulting in appreciable current. It is only after a second cell layer begins to form on top of the first that current begins to rapidly increase. The ability to perform CRRM of single cells demonstrated here enables relative quantification of local abundance of c-Cyt at each step, which indicates that lone cells and one-cell thick biofilm regions have a similar local abundance of c-Cyt, whereas two-cell thick biofilm regions have a disproportionately greater local abundance of c-Cyt. Moreover, the onset of rapidly increasing current during early exponential phase corresponds with onset of formation of the second cell layer. At this stage of biofilm growth, cells comprising the second layer constitute a small fraction of the total number of cells in the biofilm, suggesting that they play a disproportionate role in current generation. It also supports the proposition that c-Cyt, which are higher in local abundance in the two-cell thick regions than in the one-cell thick regions, play an important role in EET from cells that are not in direct contact with the electrode. In addition, phase AFM reveals previously unreported extracellular linear structures crisscrossing cell clusters that appears to be comprised of nodules approximately 20 nm in diameter aligned end to end. If such nodules are redox active, their close alignment could allow intra-nodule electron transfer.
Results
Figure 1 depicts optical microscopy of a typical G. sulfurreducens biofilm grown on a gold electrode during lag phase. Lag phase biofilms examined here achieved a relatively steady current density (j) of 1.5–6 μA/cm2 and exhibited voltammetry consistent with lag phase G. sulfurreducens biofilms (Glaven and Tender, 2012) (Figure S2 in Supplementary Material) before being removed from their electrochemical reactor for analysis. In the case of Figure 1 (j = 6 μA/cm2), the biofilm occupied approximately 1–2% of the electrode surface (Figure S4 in Supplementary Material) and consisted of dispersed lone cells and dispersed cell clusters typically numbering <100 cells. It is presumed that lone cells are cells from the inoculum that are attached to the electrode surface, and that cell clusters result from proliferation of attached cells.
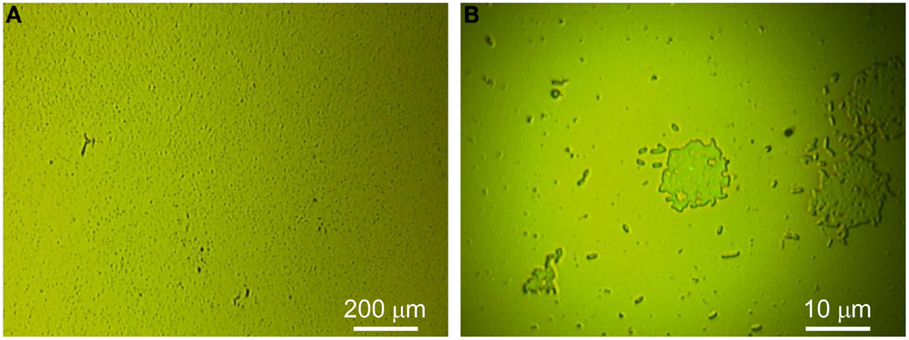
Figure 1. Lag phase biofilm. (A,B) Optical microscopy with 5× and 100× objectives.
Topographical AFM imaging (alternative current amplitude modulation mode, Figures 2A–C) indicates that lone cells are of normal size (approximately 1 μm long × 0.4 μm width) and shape, oriented lengthwise along the electrode surface, and surrounded by a relatively thick cell wall possibly reflecting EPS (Figure 2C). Figure 2D depicts a phase AFM image corresponding to the topographical AFM image depicted in Figure 2C, providing greater lateral resolution including granularity of the underlying gold electrode (Garcia and Perez, 2002).
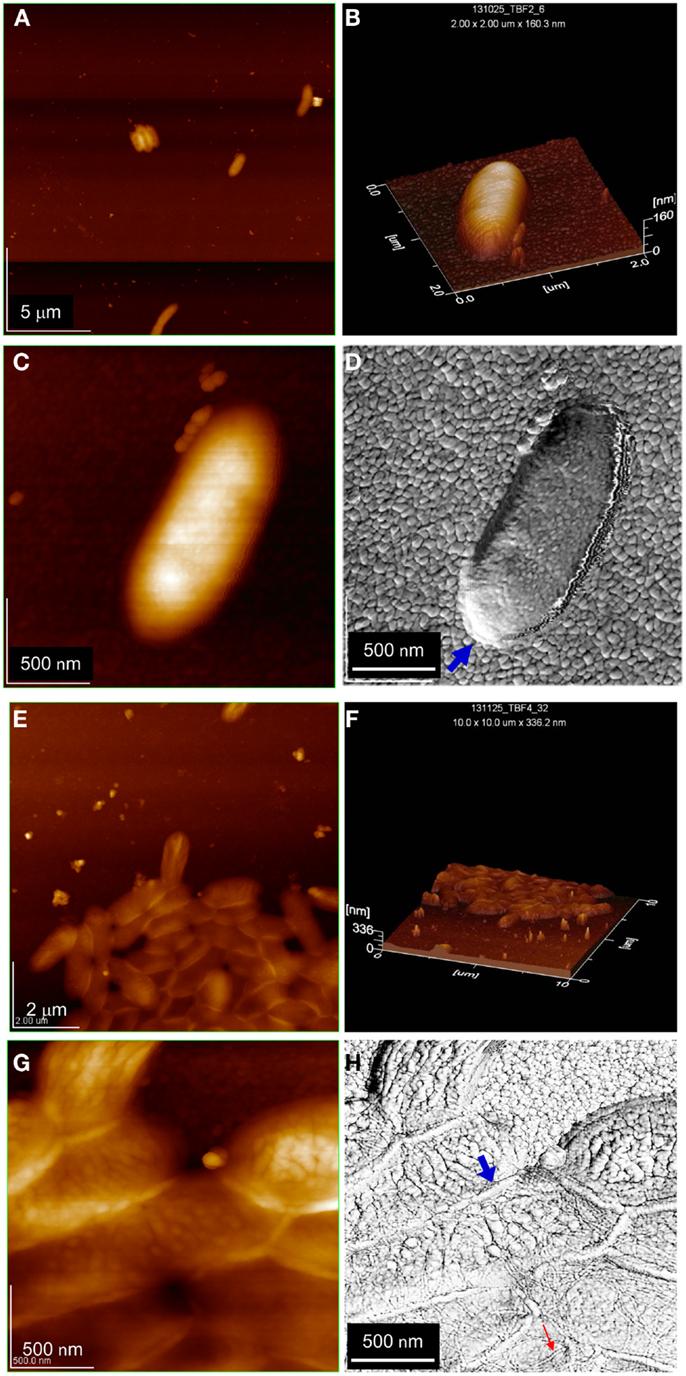
Figure 2. AFM images of lag phase biofilm depicted in Figure 1. (A) Topographical image of individual cells and a small cluster at low resolution. (B) Three-dimensional topographical image of an individual cell. (C,D) Topographical and corresponding phase image of an individual cell at high resolution. (E,F) Topographical image and three-dimensional topographical image of larger cell cluster at low resolution. (G,H) Topographical and corresponding phase image of larger cell cluster at high resolution. Small red arrows in (H) point to example linear structures (many more can be seen in the image). Large blue arrows in (D,H) point to outer cell membrane.
Figures 2E–G depict topographical AFM images of cell clusters in the same lag phase biofilm as above. Cell clusters are tightly packed and one-cell thick (approximately 0.4 μm). Figure 2H depicts a phase AFM image corresponding to Figure 2G. The higher lateral resolution of phase AFM (Garcia and Perez, 2002) reveals linear structures that are approximately 20 nm in diameter and up to multiple microns in length crisscrossing the cell cluster. These structures are of unknown identity, were always observed by phase AFM for cell clusters, not observed for lone cells (e.g., Figure 2D), and not observed extending laterally from cell clusters onto the electrode surface. At this time, we are unable to determine if they are solid (i.e., filaments) or hollow (i.e., vesicles).
Figure 3A depicts a higher resolution phase AFM image of multiple linear structures. Each appears to be comprised of nodules aligned edge to edge that are approximately 20 nm in diameter. Figure 3B depicts a topological profile along a single structure indicating approximately 20 nm center-to-center spacing between nodules.
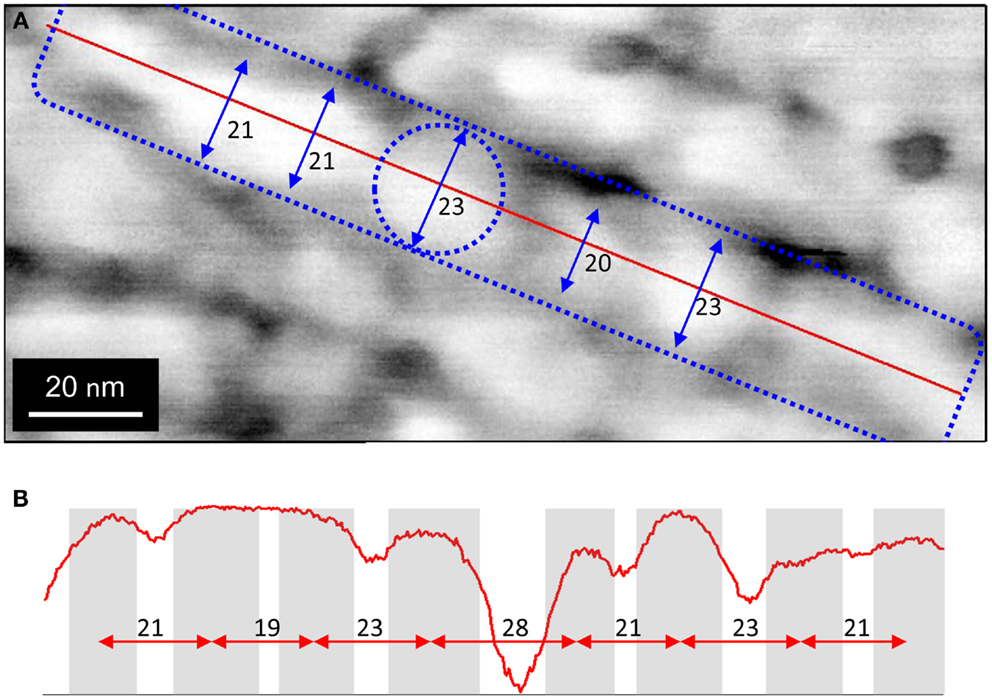
Figure 3. Phase AFM image of biofilm region containing multiple parallel linear structures at high resolution. (A) Blue dashed rectangle indicates segment of one filament. Blue dashed circle indicates one nodule comprising the filament. Blue arrows indicate diameters of adjacent nodules. (B) Phase AFM topological image representing profile along red line in (A), indicting that nodules are aligned end to end.
Figure 4 depicts CRRM spectra of lone cells and of clustered cells of the same G. sulfurreducens lag phase biofilm, which are typical for c-Cyt (Lebedev et al., 2014). CRRM spectra of single G. sulfurreducens cells have not been previously reported and result here from precise laser alignment and use of a high magnification (100×) short focal length objective. The measurement has a nominal spatial resolution adequate to detect c-Cyt of lone G. sulfurreducens cells (clearly depicted in Figure 5B). In cell clusters, however, owing to tight packing of cells, spectra more than likely represent contributions from more than one cell owing to the 2 μm lateral spatial resolution of the measurement (indicated by Figure 5B). As such, the apparent 50% higher local abundance of c-Cyt of cell clusters vs. lone cells indicated by relative intensities of their spectra is expected to be lower on a per cell basis. Although they may have been present, c-Cyt were not detected on bare regions of the electrode (i.e., regions not covered by cells).
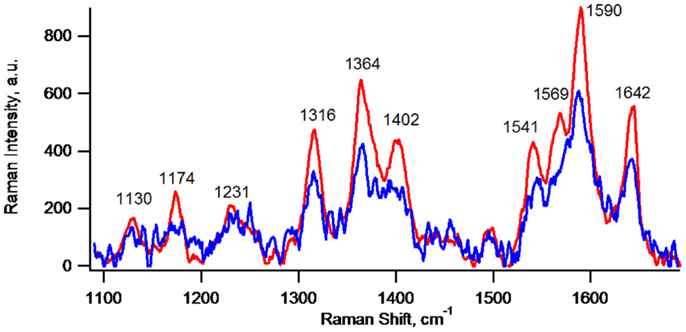
Figure 4. Confocal resonance Raman spectra of lone cells (blue, average of spectra of seven lone cells) and of clustered cells (red, average of spectra of seven different regions of a cell cluster) of the same G. sulfurreducens lag phase biofilm depicted in Figures 1–3.
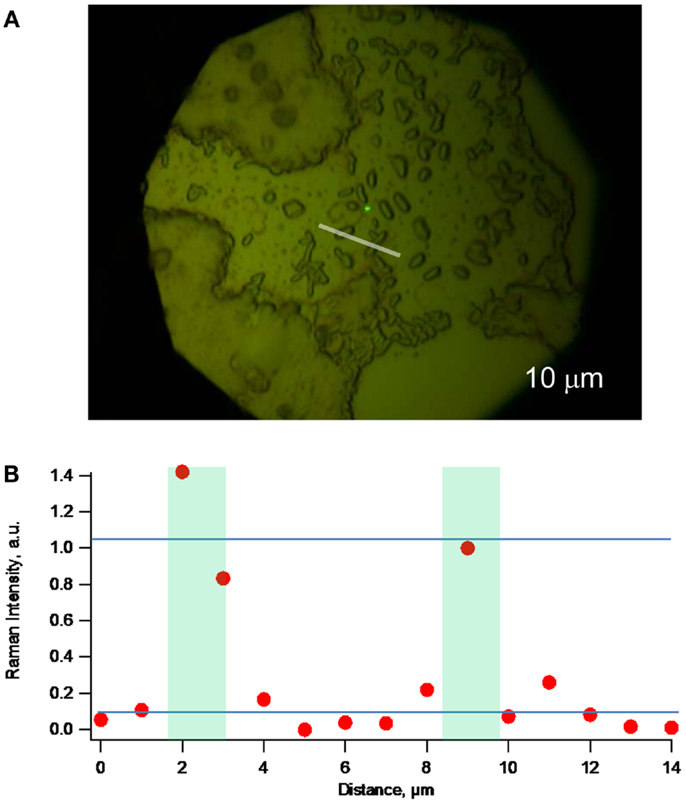
Figure 5. (A) Optical microscopy (with 100× objective) of a different lag phase biofilm. (B) Raman topographical image created by obtaining spectra at 1 μm increments along the white line indicated in (A) and plotting intensity of the 1588 cm−1 peak vs. distance along the line, demonstrating ability to detect c-type cytochromes of lone G. sulfurreducens cells.
Figure 5A depicts optical microscopy of a different lag phase biofilm than the one depicted in Figure 4. Figure 5B depicts a resonance Raman topographical image created by obtaining spectra at 1 μm increments along the white line indicated in Figure 5A that transects two lone cells, and plotting intensity of the 1588 cm−1 peak vs. distance along the line, further demonstrating ability to detect c-Cyt from single cells. Figure 5B does, however, indicate lateral spatial resolution of not <2 μm.
Figures 6A,B depict optical microscopy of two G. sulfurreducens biofilms grown on gold electrodes to early exponential phase. At this stage of biofilm development, current density began to increase rapidly, achieving 15 μA/cm2 and the biofilm exhibited voltammetry consistent with an early exponential phase biofilm (Strycharz-Glaven and Tender, 2012a) (Figure S2 in Supplementary Material). By this stage, cells clusters had expanded considerably, occupying 25–35% of the electrode surface. Despite this expansion, cell clusters remain predominately one-cell thick. A second smaller cell layer is observed on top and in the center of some clusters (indicated by white arrows).
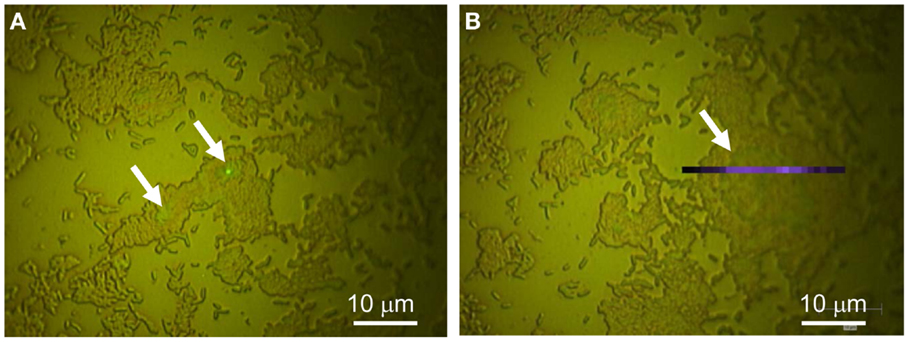
Figure 6. Exponential phase biofilm. (A,B) optical microscopy (100×) of different areas of the same biofilm. White arrows indicate where a second layer of cells has begun to form.
Figures 7A–C depict topographical AFM images of cell clusters in the same exponential phase biofilm as above. In the case of one-cell thick regions, the biofilm height is approximately 0.40 μm during lag phase. In the case of two-cell thick regions, the biofilm height increases by approximately 0.24 μm, indicating that the second cell layer is tightly associated with the first.
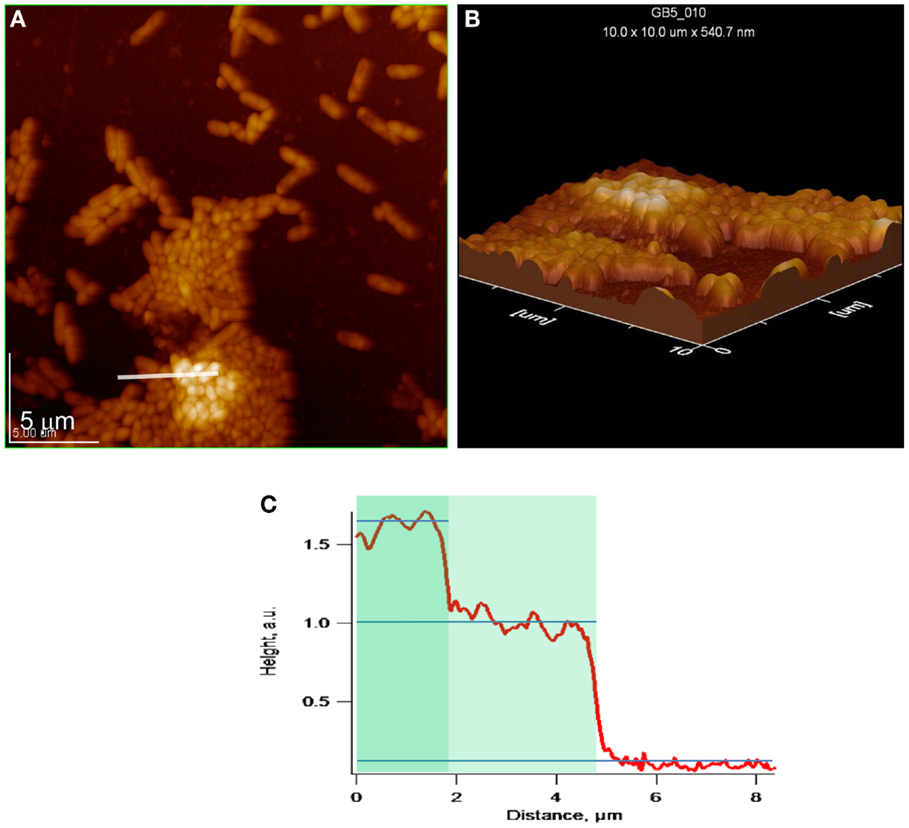
Figure 7. Exponential phase biofilm. (A,B) Topographical and 3D AFM images of cell cluster. White line indicates location of topographical profile, (C) topographical profile that includes bare gold and one- and two-cell thick regions of a cell cluster.
Figure 8A depicts normalized resonance Raman spectra (normalized to the 1365 cm−1 band) obtained for one- and two-cell thick biofilm regions residing along the line indicated in Figure 6B. Figure 8B depicts a resonance Raman topographical image created by obtaining spectra at 1 μm increments along the line indicated in Figure 6B that spans gold, a one-cell thick region, a two-cell thick region, and a one-cell thick region, and plotting intensities of representative cytochrome Raman spectral peaks vs. distance along the line. The specific peaks used were 1365 and 1377 cm−1 [previously modeled to be sensitive to heme oxidation state (Lebedev et al., 2014)] and 1315, 1589, 1642 cm−1 [previously modeled to be insensitive to heme oxidation state (Lebedev et al., 2014)]. Figure 8B indicates that the local c-Cyt abundance in the two-cell thick regions is threefold greater than in the one-cell thick regions based on intensities of the spectral peaks. In the case of one-cell thick regions, the intensities at locations 4 and 20 μm were used to minimize negative contributions by neighboring bare gold regions and positive contributions by neighboring two-cell thick regions due to the 2 μm spatial resolution of the measurement indicated by Figure 5B. Because the vertical resolution is assumed to be significantly greater than the thickness of the individual cell layers, it is not possible to determine if c-Cyt are concentrated vertically (e.g., in the first or second cell layer).
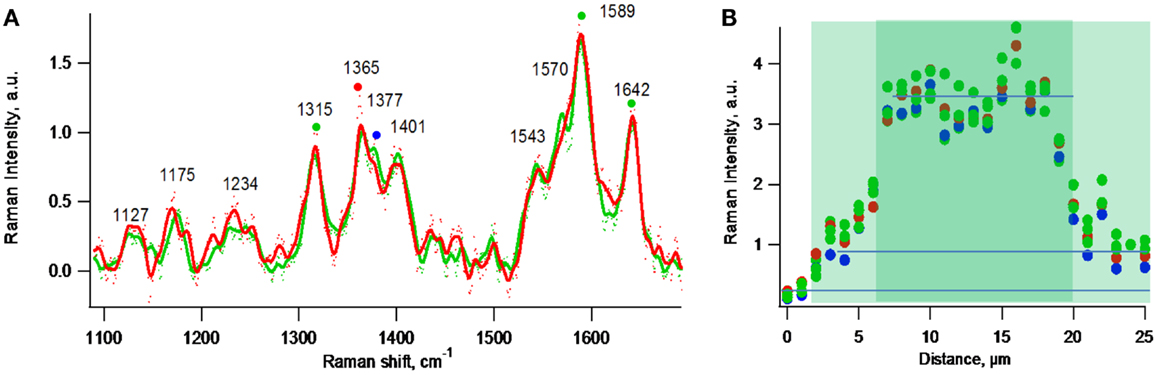
Figure 8. Exponential phase biofilm. (A) Normalized at 1365 cm−1 resonance Raman spectra of representative one-cell thick region (red) and a two-cell thick region (green). (B) Intensity profile of Raman peaks marked by colored dots in (A) along the purple line indicated in Figure 6B.
Discussion
Taken together, the results described above suggest that the following processes occur early in biofilm development. During lag phase, when current and the rate of change of current are low, attached cells proliferate and form one-cell thick clusters on the electrode surface. Cell clustering is accompanied by formation of extracellular linear structures that crisscross the cells. The abundance of c-Cyt is low for both lone and clustered cells but readily detectable by CRRM. Upon transition to early exponential phase, when current begins to rapidly increase, a second layer of cells begins to appear on top of the first, accompanied by a pronounced increase in local abundance of c-Cyt. We have performed the same measurements on multiple lag phase and early exponential phase biofilms. In the case of the lag phase biofilms, while the electrode coverage can be as high as 25–30%, the current remains low, as does the abundance of c-Cyt. It is only in early exponential phase when current begins to increase that we observe the higher local abundance of c-Cyt and only in two-cell thick regions.
There is considerable discussion concerning the role of c-Cyt in EET (Busalmen et al., 2008; Liu et al., 2011; Strycharz-Glaven et al., 2011; Bond et al., 2012; Liu and Bond, 2012; Strycharz-Glaven and Tender, 2012b; Robuschi et al., 2013; Lebedev et al., 2014). The results presented here provide the first experimental evidence linking onset of increased local expression of c-Cyt within a growing G. sulfurreducens biofilm with onset of formation of the first portion of the biofilm that is not in direct contact with the electrode surface (i.e., the second cell layer) and with onset of current generation. The increased local abundance of c-Cyt appears to be localized to developing two-cell thick biofilm regions, suggesting that c-Cyt play a pivotal role in EET from cells in the second layer through the first layer to the electrode surface.
There is also considerable discussion concerning the role of filaments (i.e., pili or nanowires) in EET (El-Naggar et al., 2008, 2010; Cologgi et al., 2011; Strycharz-Glaven et al., 2011; Veazey et al., 2011; Bond et al., 2012; Feliciano et al., 2012; Pfeffer et al., 2012; Pirbadian and El-Naggar, 2012; Strycharz-Glaven and Tender, 2012b; El-Naggar and Finkel, 2013; Leung et al., 2013). The linear structures observed here by phase AFM indicates that they comprise nodules that are approximately 20 nm in diameter aligned end to end. If these nodules are redox active (e.g., comprise or contain multi-heme cytochromes), their closeness could enable inter-nodule lateral electron transport.
Materials and Methods
Geobacter Cultivation
Geobacter sulfurreducens strain DL1 (ATCC#51573) was maintained under anaerobic conditions (N2:CO2, 80:20%) with ultrapure (18 GΩ) water-based growth medium containing fumarate (40 mM) and acetate (10 mM) using previously described methods (El-Naggar et al., 2010; Leung et al., 2013). The medium contains per liter: 2.5 g sodium bicarbonate (NaHCO3), 0.1 g potassium chloride (KCl), 0.25 g ammonium chloride (NH4Cl), 0.6 g sodium phosphate dibasic (NaH2PO4), 10 ml DL vitamin mixture, and 10 ml DL mineral mixture (El-Naggar et al., 2010). Cysteine (10 μM) is added as a reductant.
Electrochemical Analysis
All electrochemical experiments were performed in single-chamber electrochemical reactors adapting previously described methods (Strycharz et al., 2011; Strycharz-Glaven et al., 2011, 2013; Snider et al., 2012) (250 ml volume) with a 1 cm × 2.5 cm gold on glass working electrode (gold thickness 100 nm vapor deposited on the top of 5 nm chromium adhesion layer), graphite rod (0.6 cm diameter, approximately 6 cm length) as the counter electrode, and Ag/AgCl reference electrode. Working electrodes and reference electrodes were sterilized by soaking in a freshly prepared 10% bleach solution for 20 min using a freshly opened container of bleach, followed by rinsing in sterile deionized water for 20 min. Counter electrodes were sterilized in partially assembled cells by autoclaving.
Electrochemical reactors were inoculated with late log-phase G. sulfurreducens strain DL1 [2% (v/v) inoculum, O.D. 0.4–0.6]. Single-chamber electrochemical cells were filled (approximately 175 ml) with ultrapure (18 GΩ) water-based growth medium (0.1 M total salt) in the presence of acetate (10 mM) as the electron donor. The working electrode was held at 0.300 V vs. Ag/AgCl (approximately 0.500 V vs. SHE) and served as the electron acceptor. Reactors were continuously stirred with a magnetic stirrer set at approximately 3 rotations/s and maintained at 30°C with a recirculating water bath. Reactors were continuously purged with N2:CO2 (80:20%) to maintain anaerobic conditions. Cyclic voltammetry was recorded prior to inoculation and immediately before removing the working electrode for AFM and Raman biofilm analyses with the following parameters: Einitial = 0.300 V vs. Ag/AgCl (approximately 0.500 V vs. SHE), Evertex = −0.800 V vs. Ag/AgCl (approximately −0.600 V vs. SHE), and Efinal = 0.300 V vs. Ag/AgCl at 0.002 V/s (Richter et al., 2009; Rollefson et al., 2011).
Spatially Resolved Confocal Resonant Raman Microscopy
For Raman microscopic analysis, anodes with G. sulfurreducens biofilms were removed from the electrochemical reactors, gently dipped in salt-free media (above) and exposed to air but not intentionally dried (the biofilms remained moist throughout the measurements). It has been previously shown that in the case of mixed community biofilms enriched in G. sulfurreducens, such treatment does not kill the cells but keeps them alive and electrochemically active, as evidenced by the continuation of current when returned to the electrochemical reactor (Virdis et al., 2012). For this reason, it is assumed that the ex situ analyses performed here are similar to the native state of the biofilms just before they were removed from their electrochemical reactors. It is important to note the following. Owing to the low strength innocula used here, the fact that the innocula were electron acceptor limited making planktonic growth in the electrochemical reactors not possible, the fact that the electrochemical reactors were stirred, and the fact that G. sulfurreducens is not known to loosely associate with electrodes [i.e., engage in electron EET resulting in current without adhering (Marsili et al., 2010)], it is concluded that gently dipping the electrodes in salt-free media before the ex situ analyses negligibly altered the biofilms. Moreover, as controls, we performed analyses without dipping the biofilms in salt-free media and observed qualitatively the same results but with salt precipitated on the biofilms.
Raman spectra were collected with a Renishaw inVia Raman microscope (Hoffman Estates, IL, USA) with 100×/0.90 objective and 514 nm laser light enabling resonant excitation in the cytochrome Q-band (oriented in plane of the porphyrin ring). The excitation energy was kept below 0.03 mW (measured) and each spectrum was recorded at a different sample point. Up to 10 similar spectra were averaged to improve the signal-to-noise ratio. The low excitation energy allows for excluding optical artifacts within the sample and for reproducible spectral measurements. As an example, in the case of Figure 8B we did not observe any changes in Raman spectra while performing 10 repetitive scans. The total measurement time of the Raman spectroscopic experiment depicted in Figure 8B was 10–12 min.
The resonance Raman topographical image (Figure 7B) was generated by collecting spectra in 1 μm increments along the biofilm surface. Spectra were collected in autofocus mode and the laser beam was manually focused on the biofilm surface for each spectra to exclude effects of fluctuation in biofilm thickness. The spectral data processing and presentation were done with IgorPRO data analysis software (WaveMetrics, Portland, OR, USA).
Atomic Force Microscopy
Samples for AFM analyses were prepared the same way as for Raman analyses. The AFM experiments were performed with JSPM-5200 microscope (JEOL-USA, Peabody, MA, USA) in alternative current amplitude and phase modes allowing for avoiding sample alteration by AFM tips and increasing image spatial resolution. The experiments were performed in air at 22°C with the samples prepared the same way as for Raman measurements. Tap-300 AFM probes (BudgetSensors, Sofia, Bulgaria) were used with a force constant 40 N/m, at an oscillation frequency of approximately 320 kHz (Q-factor of approximately 562), and at scan rate of approximately 3 μm/s using a 1.20–1.60 Hz feedback filter. The phase modulation analysis was performed at a phase shift of approximately −72°. Control measurements performed at high resolution AFM shows no sample damage before and after experiments. Image processing was done with JEOL SPM software. The same software was used to determine cell coverage of electrode surfaces.
Conflict of Interest Statement
The authors declare that the research was conducted in the absence of any commercial or financial relationships that could be construed as a potential conflict of interest.
Acknowledgments
Funding provided by the Office of Naval Research (award numbers N0001412WX20447 and N0001414WX20009) and the Naval Research Laboratory.
Supplementary Material
The Supplementary Material for this article can be found online at http://www.frontiersin.org/Journal/10.3389/fenrg.2014.00034/abstract
References
Bond, D. R., Strycharz-Glaven, S. M., Tender, L. M., and Torres, C. I. (2012). On electron transport through Geobacter biofilms. ChemSusChem 5, 1099–1105. doi:10.1002/cssc.201100748
Busalmen, J. P., Esteve-Nunez, A., Berna, A., and Feliu, J. M. (2008). c-Type cytochromes wire electricity-producing bacteria to electrodes. Angew. Chem. Int. Ed. 47, 4874–4877. doi:10.1002/anie.200801310
Cologgi, D. L., Lampa-Pastirk, S., Speers, A. M., Kelly, S. D., and Reguera, G. (2011). Extracellular reduction of uranium via Geobacter conductive pili as a protective cellular mechanism. Proc. Natl. Acad. Sci. U.S.A. 108, 15248–15252. doi:10.1073/pnas.1108616108
Dalton, E. F., Surridge, N. A., Jernigan, J. C., Wilbourn, K. O., Facci, J. S., and Murray, R. W. (1990). Charge transport in electroactive polymers consisting of fixed molecular redox sites. Chem. Phys. 141, 143–157. doi:10.1016/0301-0104(90)80026-T
El-Naggar, M., Gorby, Y., Xia, W., and Nealson, K. H. (2008). The molecular density of states in bacterial nanowires. Biophys. J. 95, L10–L12. doi:10.1529/biophysj.108.134411
El-Naggar, M. Y., Wanger, G., Leung, K. M., Yuzvinsky, T. D., Southam, G., Yang, J., et al. (2010). Electrical transport along bacterial nanowires from Shewanella oneidensis MR-1. Proc. Natl. Acad. Sci. U.S.A. 107, 18127–18131. doi:10.1073/pnas.1004880107
Feliciano, G. T., da Silva, A. J. R., Reguera, G., and Artacho, E. (2012). Molecular and electronic structure of the peptide subunit of Geobacter sulfurreducens conductive phi from first principles. J. Phys. Chem. A 116, 8023–8030. doi:10.1021/jp302232p
Forster, R. J., Walsh, D. A., Mano, N., Mao, F., and Heller, A. (2004). Modulating the redox properties of an osmium-containing metallopolymer through the supporting electrolyte and cross-linking. Langmuir 20, 862–868. doi:10.1021/la035229h
Franks, A. E., Nevin, K. P., Glaven, R. H., and Lovley, D. R. (2010). Microtoming coupled to microarray analysis to evaluate the spatial metabolic status of Geobacter sulfurreducens biofilms. ISME J. 4, 509–519. doi:10.1038/ismej.2009.137
Garcia, R., and Perez, R. (2002). Dynamic atomic force microscopy methods. Surf. Sci. Rep. 47, 197–301.
Glaven, S., and Tender, L. (2012). Use of cyclic voltammetry to evaluate mechanism of catalytic activity of Geobacter sulfurreducens biofilm modified electrodes during biofilm growth. Abstr. Pap. Am. Chem. 243, 15467–15472.
Hall, B. G., Acar, H., Nandipati, A., and Barlow, M. (2014). Growth rates made easy. Mol. Biol. Evol. 31, 232–238. doi:10.1093/molbev/mst187
Hasan, K., Patil, S. A., Leech, D., Hagerhall, C., and Gorton, L. (2012). Electrochemical communication between microbial cells and electrodes via osmium redox systems. Biochem. Soc. Trans. 40, 1330–1335. doi:10.1042/BST20120120
Katuri, K. P., Kavanagh, P., Rengaraj, S., and Leech, D. (2010). Geobacter sulfurreducens biofilms developed under different growth conditions on glassy carbon electrodes: insights using cyclic voltammetry. Chem. Commun. 46, 4758–4760. doi:10.1039/c003342a
Katuri, K. P., Rengaraj, S., Kavanagh, P., O’Flaherty, V., and Leech, D., Charge transport through Geobacter sulfurreducens biofilms grown on graphite rods. Langmuir (2012) 28, 7904–7913. doi:10.1021/la2047036
Lebedev, N., Strycharz-Glaven, S. M., and Tender, L. M. (2014). Spatially resolved confocal resonant Raman microscopic analysis of anode-grown Geobacter sulfurreducens biofilms. Chemphyschem 15, 320–327. doi:10.1002/cphc.201300984
Leung, K. M., Wanger, G., El-Naggar, M. Y., Gorby, Y., Southam, G., Lau, W. M., et al. (2013). Shewanella oneidensis MR-1 bacterial nanowires exhibit p-type, tunable electronic behavior. Nano Lett. 13, 2407–2411. doi:10.1021/nl400237p
Liu, Y., and Bond, D. R. (2012). Long-distance electron transfer by G. sulfurreducens biofilms results in accumulation of reduced c-type cytochromes. ChemSusChem 5, 1047–1053. doi:10.1002/cssc.201100734
Liu, Y., Kim, H., Franklin, R. R., and Bond, D. R. (2011). Linking spectral and electrochemical analysis to monitor c-type cytochrome redox status in living Geobacter sulfurreducens biofilms. Chemphyschem 12, 2235–2241. doi:10.1002/cphc.201100246
Marsili, E., Rollefson, J. B., Baron, D. B., Hozalski, R. M., and Bond, D. R. (2008). Microbial biofilm voltammetry: direct electrochemical characterization of catalytic electrode-attached biofilms. Appl. Environ. Microbiol. 74, 7329–7337. doi:10.1128/AEM.00177-08
Marsili, E., Sun, J., and Bond, D. R. (2010). Voltammetry and growth physiology of Geobacter sulfurreducens biofilms as a function of growth stage and imposed electrode potential. Electroanalysis 22, 865–874. doi:10.1002/elan.200800007
Millo, D., Harnisch, F., Patil, S. A., Ly, H. K., Schroder, U., and Hildebrandt, P. (2011). In situ spectroelectrochemical investigation of electrocatalytic microbial biofilms by surface-enhanced resonance Raman spectroscopy. Angew. Chem. Int. Ed. 50, 2625–2627. doi:10.1002/anie.201006046
Pfeffer, C., Larsen, S., Song, J., Dong, M., Besenbacher, F., Meyer, R. L., et al. (2012). Filamentous bacteria transport electrons over centimetre distances. Nature 491, 218–221. doi:10.1038/nature11586
Pirbadian, S., and El-Naggar, M. Y. (2012). Multistep hopping and extracellular charge transfer in microbial redox chains. Phys. Chem. Chem. Phys. 14, 13802–13808. doi:10.1039/c2cp41185g
Richter, H., Nevin, K. P., Jia, H., Lowy, D. A., Lovley, D. R., and Tender, L. M. (2009). Cyclic voltammetry of biofilms of wild type and mutant Geobacter sulfurreducens on fuel cell anodes indicates possible roles of OmcB, OmcZ, type IV pili, and protons in extracellular electron transfer. Energy Environ. Sci. 2, 506–516. doi:10.1039/b816647a
Robuschi, L., Pablo Tomba, J., Schrott, G. D., Sebastian Bonanni, P., Mariela Desimone, P., and Pablo Busalmen, J. (2013). Spectroscopic slicing to reveal internal redox gradients in electricity-producing biofilms. Angew Chem. Int. Ed. 52, 925–928. doi:10.1002/anie.201205440
Rollefson, J. B., Stephen, C. S., Tien, M., and Bond, D. R. (2011). Identification of an extracellular polysaccharide network essential for cytochrome anchoring and biofilm formation in Geobacter sulfurreducens. J. Bacteriol. 193, 1023–1033. doi:10.1128/JB.01092-10
Snider, R. M., Strycharz-Glaven, S. M., Tsoi, S. D., Erickson, J. S., and Tender, L. M. (2012). Long-range electron transport in Geobacter sulfurreducens biofilms is redox gradient-driven. Proc. Natl. Acad. Sci. U.S.A. 109, 15467–15472.
Strycharz, S. M., Malanoski, A. P., Snider, R. M., Yi, H., Lovley, D. R., and Tender, L. M. (2011). Application of cyclic voltammetry to investigate enhanced catalytic current generation by biofilm-modified anodes of Geobacter sulfurreducens strain DL1 vs. variant strain KN400. Energy Environ. Sci. 4, 896–913. doi:10.1039/c0ee00260g
Strycharz-Glaven, S. M., Glaven, R. H., Wang, Z., Zhou, J., Vora, G. J., and Tender, L. M. (2013). Electrochemical investigation of a microbial solar cell reveals a nonphotosynthetic biocathode catalyst. Appl. Environ. Microbiol. 79, 3933–3942. doi:10.1128/AEM.00431-13
Strycharz-Glaven, S. M., Snider, R. M., Guiseppi-Elie, A., and Tender, L. M. (2011). On the electrical conductivity of microbial nanowires and biofilms. Energy Environ. Sci. 4, 4366–4379. doi:10.1039/c1ee01753e
Strycharz-Glaven, S. M., and Tender, L. M. (2012a). Study of the mechanism of catalytic activity of G. sulfurreducens biofilm anodes during biofilm growth. ChemSusChem 5, 1106–1118. doi:10.1002/cssc.201100737
Strycharz-Glaven, S. M., and Tender, L. M. (2012b). Reply to the ‘Comment on “On electrical conductivity of microbial nanowires and biofilms”’ by N. S. Malvankar, M. T. Tuominen and D. R. Lovley, Energy Environ. Sci., 2012, 5. Energy Environ. Sci. 5, 6250–6255. doi:10.1039/c2ee03056j
Tender, L. M. (2011). From mud to microbial electrode catalysts and conductive nanomaterials. MRS Bull. 36, 800–805. doi:10.1557/mrs.2011.237
Veazey, J., Reguera, G., and Tessmer, S. (2011). Electronic properties of conductive pili of the metal-reducing bacterium Geobacter sulfurreducens probed by scanning tunneling microscopy. Phys. Rev. E 84, 049907. doi:10.1103/PhysRevE.84.060901
Virdis, B., Harnisch, F., Batstone, D. J., Rabaey, K., and Donose, B. C. (2012). Non-invasive characterization of electrochemically active microbial biofilms using confocal Raman microscopy. Energy Environ. Sci. 5, 7017–7024. doi:10.1039/c2ee03374g
Keywords: bioelectrochemical systems, microbial electrochemistry, electromicrobiology, Raman microscopy, AFM
Citation: Lebedev N, Strycharz-Glaven SM and Tender LM (2014) High resolution AFM and single-cell resonance Raman spectroscopy of Geobacter sulfurreducens biofilms early in growth. Front. Energy Res. 2:34. doi: 10.3389/fenrg.2014.00034
Received: 23 June 2014; Accepted: 05 August 2014;
Published online: 21 August 2014.
Edited by:
Uwe Schröder, Technische Universität Braunschweig, GermanyReviewed by:
Linda Christine DeVeaux, South Dakota School of Mines and Technology, USAShou-Nian Ding, Southeast University, China
Copyright: © 2014 Lebedev, Strycharz-Glaven and Tender. This is an open-access article distributed under the terms of the Creative Commons Attribution License (CC BY). The use, distribution or reproduction in other forums is permitted, provided the original author(s) or licensor are credited and that the original publication in this journal is cited, in accordance with accepted academic practice. No use, distribution or reproduction is permitted which does not comply with these terms.
*Correspondence: Nikolai Lebedev and Leonard M. Tender, 4555 Overlook Avenue, SW, Washington, DC, USA e-mail:bmlrb2xhaS5sZWJlZGV2QG5ybC5uYXZ5Lm1pbA==;bGVvbmFyZC50ZW5kZXJAbnJsLm5hdnkubWls