 Kumar Biswajit Debnath
 Monjur Mourshed
- School of Engineering, Cardiff University, Cardiff, United Kingdom
Emerging economies with rapidly growing population and energy demand, own some of the most expensive power plants in the world. We hypothesized that corruption has a relationship with the capital cost of power plants in developing countries such as Bangladesh. For this study, we analyzed the capital cost of 61 operational and planned power plants in Bangladesh. Initial comparison study revealed that the mean capital cost of a power plant in Bangladesh is twice than that of the global average. Then, the statistical analysis revealed a significant correlation between corruption and the cost of power plants, indicating that higher corruption leads to greater capital cost. The high up-front cost can be a significant burden on the economy, at present and in the future, as most are financed through international loans with extended repayment terms. There is, therefore, an urgent need for the review of the procurement and due diligence process of establishing power plants, and for the implementation of a more transparent system to mitigate adverse effects of corruption on megaprojects.
Introduction
Bangladesh is the world’s eighth most populous country of 161 million people with annual population and GDP growth rates of 1.2 and 6.6%, respectively (WB, 2016). While the population grew linearly, electricity consumption per capita increased exponentially since 1970, as shown in Figures 1A,G. The GDP-electricity elasticity of the country exhibits a strong linear relationship (R2 = 0.989); electricity consumption increased by 4.15 kWh/capita for every US$ increase in GDP/capita in 1971–2011 (Figure 2). Moreover, past research indicates a unidirectional causal relationship is running from electricity consumption to investment and economic growth in Bangladesh—implying that over time, increasing electricity consumption results in higher economic growth (Masuduzzaman, 2012). Therefore, the government aimed toward giving access to electricity all households by 2021 (BPDB, 2015). The causal relationship between economic growth and electricity consumption illustrated in Figure 2 and available literature suggested that, as more people get access to electricity, the demand of electric power may increase significantly as Bangladesh aims at transition from a lower-middle-income to a middle-income country by 2021 (MoF, 2011) and developed by 2040 (Jalil and Islam, 2010; FE, 2015). The required additional economic growth is expected to result from the expansion and development of the energy-intensive manufacturing and service sectors (Nath, 2012; ILO and IILS, 2013; ADB, 2016).
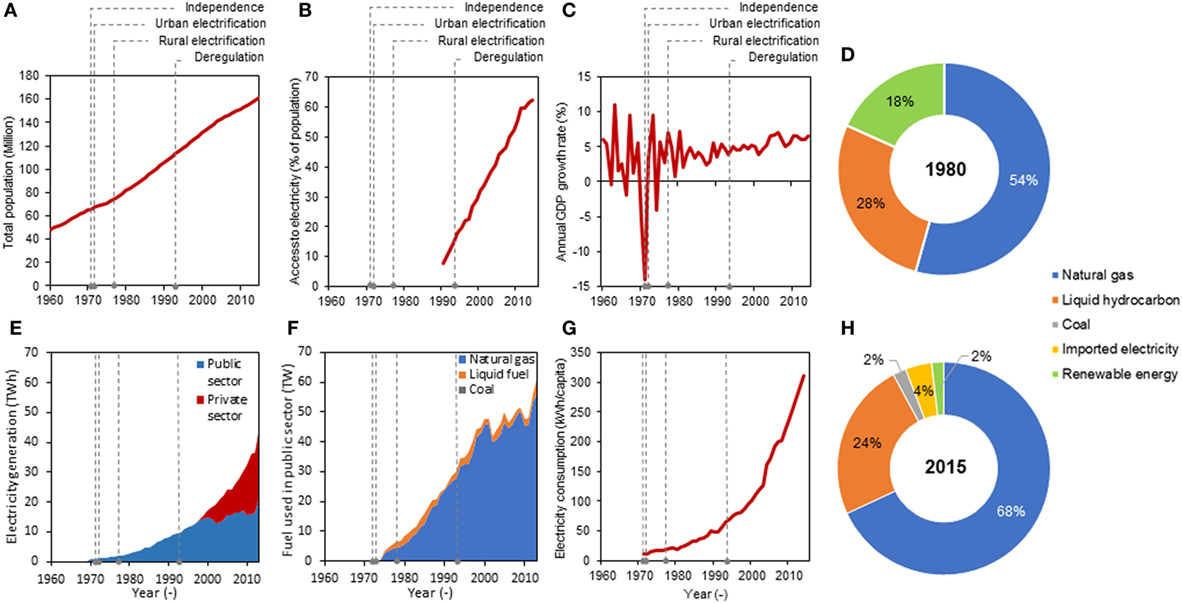
Figure 1. (A) Population of Bangladesh (1960–2015); (B) access to electricity (1970–2015); (C) annual GDP growth (1960–2015); (D,H) fuel types for electricity generation in 1980 and 2015. The total installed capacity was 438 and 12,504.37 MW, respectively, in 1980 and 2015 (28.5 times increase in 35 years); (E) electricity generation in Bangladesh (1970–2013); (F) fuel use for electricity generation (1970–2013); (G) electricity consumption per capita (1971–2014). The dotted lines in the figures illustrate the key historical events, which influenced the electricity sector of Bangladesh.
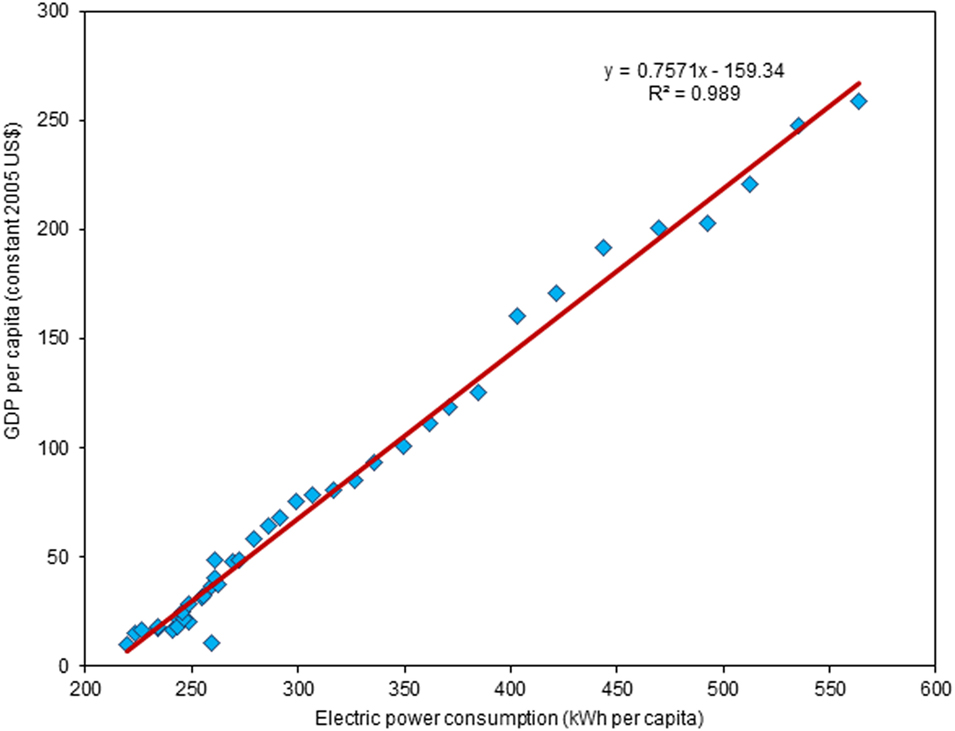
Figure 2. GDP per capita vs. electric power consumption for Bangladesh (1971–2011) (WB, 2016).
The power sector in Bangladesh underwent several significant restructurings since its humble beginning at the turn of the twentieth century. Electricity was provided only to the wealthy residents in the capital with small power plants (Omprasad, 2016) but gradually shifted its focus toward serving essential businesses and industries by 1947 (Ebinger, 2011). Post-independence evolution of the power sector is illustrated in Figure 1, which commenced with the establishment of Bangladesh Power Development Board (BPDB) and Rural Electrification Board in 1972 and 1977, to foster economic development in urban and rural areas, respectively (BREB, 2016; BPDB, 2017). In light of increasing demand in divisional cities and the need for interconnection, East and West zones were connected by a 230 kV transmission line in 1982 (Ebinger, 2011). Despite the expansion of the grid, most of the population did not have access to uninterrupted electricity supply (Figure 1B). Moreover, only 62.4% of the population has access to grid electricity in 2014 (WB, 2016).
National Energy Policy 1994 paved the way for deregulation to encourage broader participation in power generation (Ebinger, 2011). Publicly owned Rural Power Company Limited was set up as the first independent power producer (IPP) in the same year (Mourshed, 2013). Privately owned IPPs started operation in 1997, under the build-own-operate model of public–private partnership. The effects of increased generation can be seen in the economic growth in the subsequent decades. The average GDP growth rate of 3.8% in the 1980s rose to 4.8, 5.6, and 6.2% by 1990s, 2000s, and mid-2010s, respectively (Figure 1C). Further deregulation allowed the establishment of rental power plants (RPPs) on 3- and 15-year contracts to meet the peak demand (Figure 1E) (MoF, 2009).
Most RPPs are oil based that relies on imported petroleum as Bangladesh has insufficient oil reserve. By increasing oil dependency (Mujeri et al., 2014), the energy sector was exposed to the volatile international oil market (Mourshed, 2013). Energy sector subsidies have escalated because of growing import prices for fuels to encounter the accelerated energy demand (Mujeri et al., 2014). Moreover, the lack of adequate governance acted as an incentive for corruption to grow in the energy sector of Bangladesh (Ahmed, 2011; Khan and Rasheduzzman, 2013; Khatun and Ahamad, 2013). Public sector generation capacity has increased exponentially between 1970 and 1997. The growth in the public sector slowed down when the private sector began supplementing generation in 1997 (Figures 1E,F). Majority of the increase since 1997 came from the private sector, and the trend is projected to continue toward an installed capacity of 33.7 GW by 2030 (JICA and TEPCO, 2011) from 13.7 GW in 2017 (BPDB, 2017).
In the case of fuel types, increased oil-based RPPs have changed the generation fuel mix within 5 years of their expansion. Figure 1H illustrates that 80% of the installed capacity in 2010 was based on natural gas (hereafter gas only), which reduced to 68% in 2015 (MoF, 2010). Although the increase in oil-based generation was suggested as short-term quick-fix to meet the burgeoning growth in demand for electricity, the overall direction of generation fuel mix is sub-optimal. The Power Sector Master Plan 2010 (PSMP2010) focuses on coal-based generation increase to a fuel mix of coal–gas–others (50–25–25%) in 2030 (JICA and TEPCO, 2011), which is a significant departure from the mix of gas–liquid fuel–renewables (54–28–8%) in 1980 (Figure 1D). Although the number of privately owned power plants are five times in number than that of public ones, public sectors have 1.66 times greater installed capacity than that of the private counterpart (BPDB, 2017). Most of the public generation capacity in Bangladesh is divided into four subsidiaries such as Ashuganj Power Station Company Limited, Electricity Generation Company of Bangladesh, North-West Power Generation Company Limited, and West Zone Power Distribution Company Limited. BPDB is the sole purchaser of the generated electricity, which is then transmitted via the Power Grid Company of Bangladesh Limited (PGCB) and distributed by state-owned area-based distribution companies. At present, bulk generation is centralized and mostly fossil fuel based. However, there are decentralized renewable power generation projects such as mini-grid, solar home systems (SHS), have been operational and under development for off-grid rural and remote areas. The government has targeted to generate 10% of the total electricity from renewable resources by 2021 (IDCOL, 2017). Although, IDCOL is aiming toward total SHS installed capacity of 200 MW by 2021, and installing 50 solar mini-grid by 2018 (IDCOL, 2017), the cumulative capacity of the off-grid generation will contribute very little to the electricity supply. Bangladesh takes a considerable amount of loans from national and international funding bodies for establishing power plants. Therefore, they would need to borrow a significant amount of loan to construct the substantial number of stations to achieve a 20 GW of additional installed capacity by 2030 than that of 2017 (JICA and TEPCO, 2011; BPDB, 2017). With considerable capital costs involved and previous evidence of corruption in the energy sector (Ruth, 2002; Khan and Rasheduzzman, 2013) as well as in public procurement (Mahmood, 2010), the utilization of massive amount of money can prove to be a significant concern in Bangladesh.
There have been different studies on the relationship between corruption and cost of big public projects. Study on Italian high-speed railways megaprojects demonstrated that corruption worsens both cost and temporal performance (Locatelli et al., 2017). This study also identified the project contexts such as the discretionary power of officials, economic rents of policy/decision makers and weak institutions would make a country ideal for corruption. Another study demonstrated that capital cost of IPPs selected without competitive bidding was 44–56% higher than that of with competitive bidding in developing countries including Bangladesh (Phadke, 2009). However, only two projects with competitive bidding (4.87% of the total projects analyzed) were considered in the case of Bangladesh. Therefore, the result was generic for developing countries, and the conclusion was not robust for Bangladesh. In another research, the Malaysian context was analyzed to find the reasons behind corruption were an abuse of power, opportunity and moral compromise within the government officials (Othman et al., 2014). Also, different studies suggest that the ongoing corruption can be controlled via random and regular supervision, severe punishment and prosecution of corrupt personnel, and anti-corruption awareness development (Zou, 2006; De Chiara and Livio, 2017). Although the literature suggests that government personals are mostly responsible for active corruption by asking bribes, the private sector can also contribute by acting as passive corruption through approaching bureaucrats by offering bribes (Capasso and Santoro, 2017). However, there is a gap in the literature regarding studies on cost evolution of energy sector in developing economies such as Bangladesh, and their relation to corruption, due to the lack of political transparency and data. There are two objectives of this research. Initially, to investigate the capital cost of establishing various power plants in Bangladesh and compare with other countries, regions and world, to find any differences. Furthermore, to understand the reason behind the differences, we hypothesized that corruption might have influenced the capital cost of power plants in Bangladesh. The correlation between the capital cost of the power plants and Corruption Perceptions Index (CPI) of Bangladesh was examined to test the hypothesis.
Methodology
The study was conducted in three stages. First, annual (BPDB, 2008, 2009, 2010, 2011, 2012, 2013, 2014, 2015; KPCL, 2014), project (APSCL, 2015a,b; CPGCBL, 2015; EGCBL, 2015) and financial aid reports (IDCOL, 2015; WB, 2017) from national bodies and international organizations were reviewed to develop a capital cost database of power plants in Bangladesh. Capital cost refers to all the expenses incurred before a plant becomes operational and comprises the cost associated with the acquisition of land; permits and legal matters; plant equipment and construction; financing; and the commissioning of the plant. Independent scrutiny of public expenditure does not feature strongly in Bangladesh’s governance structure. Hence, the total capital cost or the breakdown of the capital cost of all the operational power plants is not publicly available. There were 100 public power plants in January 2016, of which 96 were operational (BPDB, 2017). We collected primary data such as installed capacity, commissioning year, fuel and owner of 165 units from 113 public and private operational Bangladeshi power plants in January 2016. The number of public and private owned units were 80 (6,968 MW) and 85 (5,566 MW), respectively. Among the operational units, 95 utilize gas, and 7 are dual-fuel type, of which four can use gas and heavy fuel oil (HFO). The rest of the three dual-fuel plants utilize high-speed diesel (HSD) and gas. Moreover, only HFO and HSD based units were 32 and 23, respectively. Two units were coal-based, and five units were hydroelectric. Also, there was a 500 MW interconnection with India in Khulna. Due to data constraints, the capital cost of 61 fossils (gas, coal and petroleum) and renewable (nuclear, hydro, the wind, and solar) power plants in Bangladesh commissioned since 1962 and planned up to 2030, were collected (Table 1). Of the 61 plants, 34 are operational, and 27 are under construction, repair or future planned. The study had to test the hypothesis with lower data constrain and bias generated by it because of unavailability of cost data. The government has started to provide cost data since 2007 through the annual reports (BPDB, 2017). With more data and transparency in the future, the studies regarding cost can be improved to make the power plants more cost-effective.
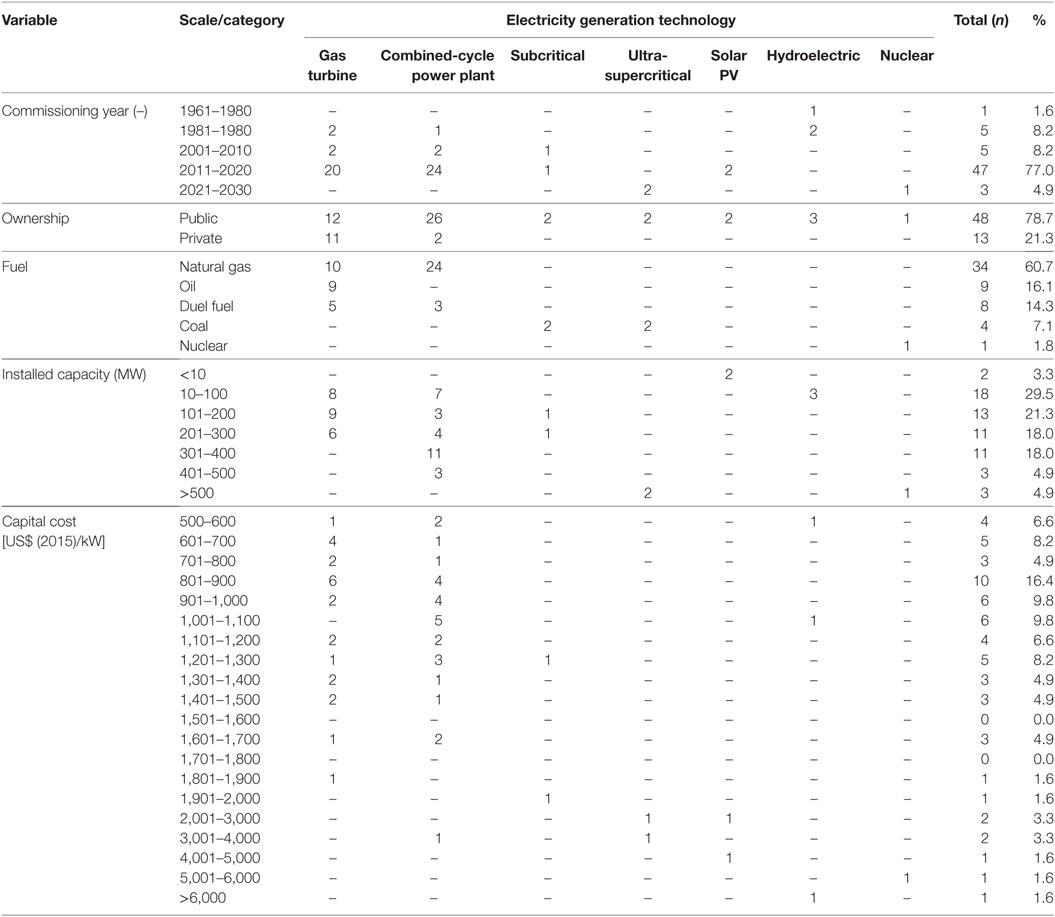
Table 1. Background information on the cost data.
Among the analyzed 61 power plant units, gas, HFO/HSD/duel fuel, coal, nuclear, and renewable based were 34, 17, 4, 1, and 5, respectively. Moreover, 48 are public, and 13 are privately operated. All the future and under-construction power plants are government owned. Among the eight analyzed duel fuel power plant units, two utilize HFO and gas, of which one is public, and one is privately owned. Six duel fuel power plant units use HSD and gas, of which one is private, and five are publicly owned. There are only nine HFO based power plant units, of which two are planned for future and rest of them are operational. All the HFO based functional power plants are privately owned. In the case of coal-based power plants units, only two are functional, and three are planned for future, and all of them are publicly owned. Similarly, all the renewable power plants are government owned, of which one is the Kaptai hydroelectric plant (five units) and two small solar energy plants. The only planned nuclear power plant (Rooppur 1 and 2) would be publicly owned too. Three phases (Units 1 and 2; Unit 3; Units 4 and 5) of Kaptai hydroelectric power plant was considered separately because three stages had different cost individually. Among the coal power generation technologies, domestic coal-fueled subcritical plants were built in Barapukuria. Moreover, two new ultra-supercritical plants are under construction which would operate with imported coal. Cost per installed capacity in kilowatts (kW) in a specific year of construction of the power plant was calculated and converted to the US dollar (USD) equivalent using the currency exchange rate with Bangladeshi Taka (BDT) on December 31 of the same year, obtained from Bangladesh Bank (BB, 2016). In cases where a power plant is going to be built after 2015, the cost was converted to 2015 USD using BDT to USD exchange rate on December 31, 2015. Then, the historical cost data were converted using Consumer Price Index (Coinnews, 2016) of 2015 USD so that all cost can be compared on the 2015 USD basis.
Second, country- and region-wise capital costs of power plants for the same technology used in Bangladesh were collected from the International Energy Agency’s (IEA’s) World Energy Investment Outlook 2014 (IEA, 2014) for USA, Japan, Russia, China, India, Brazil, Europe, the Middle East, and Africa. There were three data points for all the countries for 2012, 2020, and 2035. Data for Sri Lanka were collected from “Long-Term Generation Expansion Planning Studies 2015–2034” for 2015 (Samarasekara and Silva, 2015). In the case of USA, further data on cost and performance of power generation technologies were collected from National Renewable Energy Laboratory (NREL) to augment the IEA data (NREL, 2012). There were 10 data points for the cost data from NREL for 2008, 2010, 2015, 2020, 2025, 2030, 2035, 2040, 2045, and 2050. Also, CPI score between 1995 and 2016 was collected from Transparency International (TI, 2017a,b).
Third, the average cost of power plants in Bangladesh was compared with that of the identified countries, regions and the world using 2015 as a base year. The evolution of cost was also analyzed for both public and private sectors in Bangladesh. Pearson’s test was conducted at normalized capital cost and CPI score to examine the effect of corruption on power plant capital cost in Bangladesh. CPI data are available only from 1995, which reduced the sample size down to 42 for the correlation study. Among the collected cost data, power plants commissioned from 2004 to 2016 were considered. There were no cost data available for any power plants established between 1995 and 2003. There were also some cost data for power plants built before 1995. As the CPI started in 1995, the cost data before that were not considered for the correlation study. As the sample size is less than 50, Shapiro–Wilk and Kolmogorov–Smirnov tests of normality were conducted (Ghasemi and Zahediasl, 2012), and Table 2 indicated that the distribution of interval data was normal, supporting the selection of Pearson’s test.
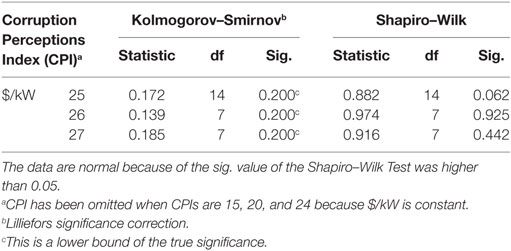
Table 2. Test of normality.
Discussion
Power generation technology is the critical factor for the variation in the capital cost. For this study, initially, capital cost of various public and private power plants in Bangladesh with varied technologies such as gas turbines (GTs) and combined-cycle power plant (CCPP); subcritical and ultra-supercritical plants; hydroelectric; nuclear and solar PV plants were compared with the world average, to find out the cost difference. When the cost of GT and steam turbines (ST) are compared, public power plants (hereafter plants) in Bangladesh are found to be approximately 2.2 times more expensive than that of the world mean (Figure 3A). The cost of public GTs is even higher, around 1.5 times than the private plants in Bangladesh. In the case of CCPP, public plants’ mean is 1.2 and 1.7 times more expensive than that of the world mean and the private plants’ mean, respectively (Table 3).
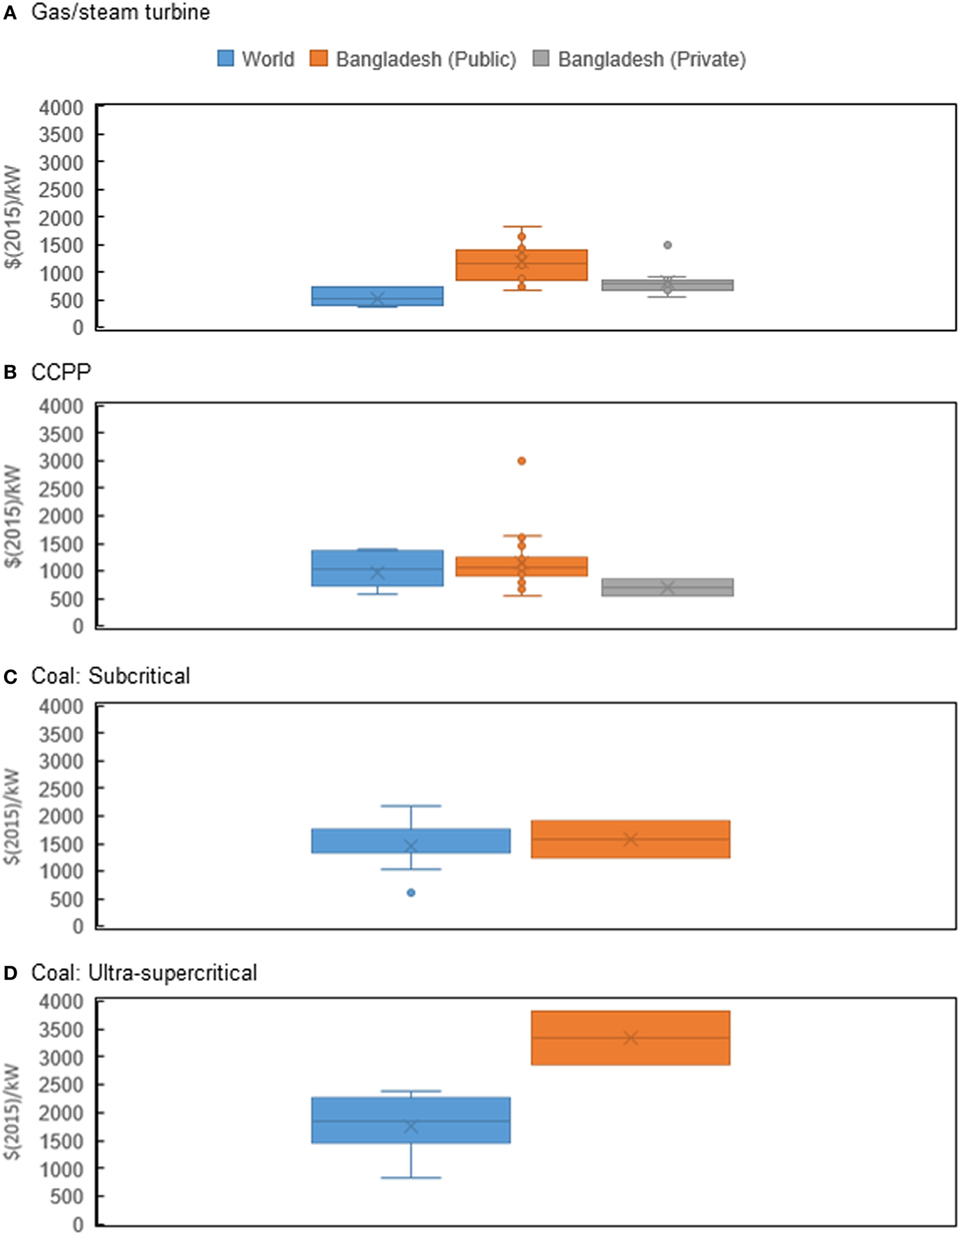
Figure 3. Capital cost comparison among fossil fueled power plants from the world with Bangladesh. In the case of gas turbine/steam turbine and combined-cycle power plant (CCPP). Bangladeshi public power plant’s mean capital cost is higher than that of the mean of private and world counterparts. Surprisingly, private power plant’s mean capital cost was lower than the world mean for CCPP. Subcritical coal plant means capital cost is slightly higher than that of global mean. However, ultra-supercritical mean capital cost of Bangladesh would be significantly greater than the world mean. (A) Gas/steam turbine. (B) CCPP. (C) Coal: subcritical. (D) Coal: ultra-supercritical.
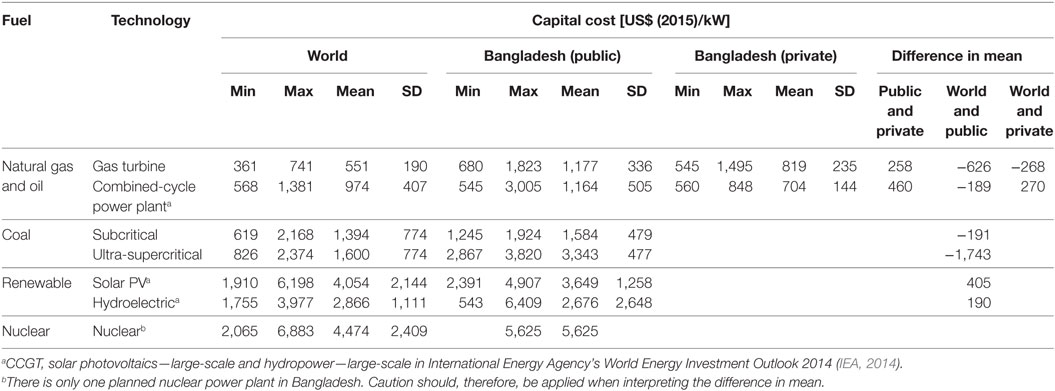
Table 3. The capital cost of power generation plants in the World and Bangladesh. Power plants in Bangladesh are further disaggregated into public and private. Historical and projected costs are rounded to the nearest US$ (2015).
The private CCPP with an average cost of $540/kW, where publicly owned ones ranged from $853 to 3,005/kW (Figure 3B). Moreover, future planned public CCPP cost range from $554 to 1,612/kW. Therefore, public CCPP in Bangladesh can be built with as low-cost as China ($568/kW between 2012 and 2020) to 19% greater than that of the highest cost of USA ($1,358/kW between 2015 and 2020). The difference between lowest and highest capital cost of CCPP (going to be commissioned in 2017) is $1,058/kW, the equivalent of constructing almost two CCPP plants in China. Cost difference can happen depending on the installed capacity. From long-term generation expansion planning study of Sri Lanka, two separate CCPP cost difference was $202/kW depending on the installed capacity. The capital cost of CCPP-Auto Diesel of 144 and 288 MW was $853 and $1,055/kW, respectively in Sri Lanka (Samarasekara and Silva, 2015), which means higher installed capacity may reduce cost. However, in the case of Bangladesh, Siddhirganj 335 MW and Bibiana (South) 383 MW CCPP plant would cost $1,612 and $873/kW, respectively (operational by 2017). Though Bibiana (South) has 48 MW higher installed capacity than that of the Siddhirganj, it would cost approximately half. On the other hand in the private sector, Meghnaghat 450 MW CCPP (Unit 2) was constructed with $560/kW in 2014.
Figures 3C,D compare the cost of coal power plants. The subcritical coal plant, capital cost range from $1,245 to $1,923/kW, which is higher than the expense of the USA in the upper bound, and Africa in lower bound. However, the cost of the proposed ultra-supercritical power plant is going to be highest compared with the rest of the world (Figure 3D).
In the case of renewable energy, Bangladesh has been utilizing hydroelectricity from Kaptai power plant since 1962, making it the oldest active power plant in Bangladesh with a capital cost of $6,408/kW for Units 1 and 2, and parts of Unit 3. Capital cost reduced with the construction of Unit 3 in 1982, from $6,408 to $543/kW (Figure 4B). Unit 3 was partially built during the construction of Units 1 and 2 in 1962, which reduced the capital cost of completion of Unit 3 in 1982. However, the capital cost for Units 4 and 5 was $1,075/kW, which was constructed in 1988. Units 4 and 5 were constructed in an already established infrastructure with facilities such as dam, reservoir during the construction of Units 1–3. Therefore, Units 4 and 5 had higher capital cost than that of Unit 3. While comparing the capital cost of Bangladeshi hydroelectric plants with the world, the cost reported for other countries were suggested for the construction of new plants.
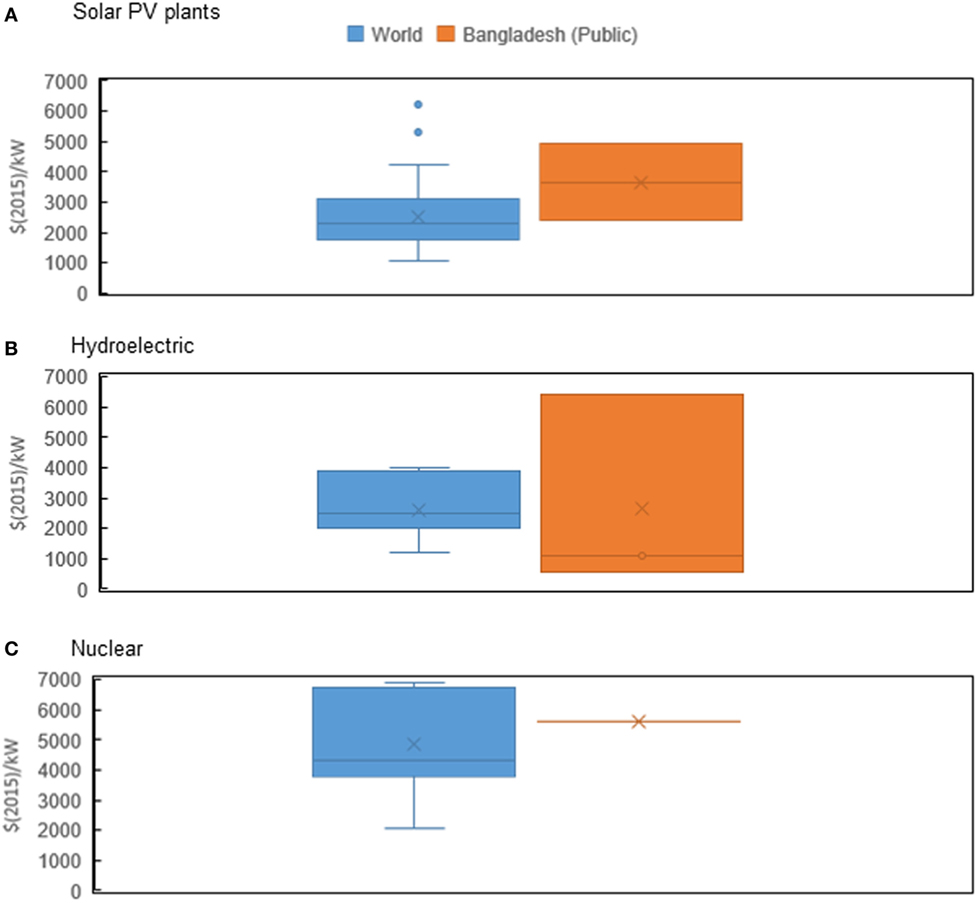
Figure 4. Capital cost comparison among nuclear and renewable power plants from different country regions with Bangladesh. In the case of solar PV plants, mean capital cost of Bangladesh is lower than the world mean. However, the installed capacity is only 12 MW. Mean capital cost for hydroelectric plants is also lower than that of global mean capital cost. The reason behind this lower cost is the later units were in the same plant side, which reduced the ancillary cost. For nuclear, only one plant is going to be built in Bangladesh by 2030, and its cost would be significantly higher than that of the world mean capital cost. (A) Solar PV plants. (B) Hydroelectric. (C) Nuclear.
Currently, Bangladesh has small-scale SHS in households, but no significant commercial, operational project. Two large solar PV plants are going to be constructed in 2016–2017 with an installed capacity of 5 and 7 MW costing $4,906 and $2,391/kW, respectively (Figure 4A). Despite the continuing descending trend in cost, one is costing higher than that of the highest in the world for that year. Also, it is not clear why the difference in cost would be $2,515/kW for just 2 MW, almost two times more than the cost of establishing similar technology power plant in China in 2020.
In the case of nuclear power plants, the planned power plant in Bangladesh would be established with the assistance from Russia in 2024–2025. However, the capital cost would be 1.45 times than that of Russia and almost equivalent to Japan (Figure 4C).
Although power plants cost more in Bangladesh, the public plants are significantly more expensive than the private ones, indicating that there may as well be other factors related to public sector governance in play (Table 3). Further studies may reveal other factors such as political instability, inefficient project management leading to construction delays and eventual increase in cost. However, the deep-rooted and widespread corruption culture could have a higher impact on the capital cost of the power plants, which needs further investigation with more data.
Cost Evolution
The cost evolution in Bangladeshi public and private plants do not follow the same trend. The cost of most of the power generation technology in the world reduces with time (Neij, 2008). However, in the Bangladeshi public plants, the cost appears to be increasing (Figure 5). Among the operational power plants, GT, ST and CCPP have been generating the most of electricity in Bangladesh in the last three decades in both public and private sectors. For the cost evolution analysis, the relatively new or less utilized technologies (subcritical, ultra-supercritical, and hydro) are not considered. Solar PV and nuclear are new technologies compared with CCPP or GT in Bangladesh. The capital cost trend of CCPP is following a second order polynomial and augmenting after 2010. In the case of the similar technology, the private sector is showing a linear descending trend with only two data points. Establishing cost of public GT/ST trend is third order polynomial and increasing after 2014. However, private power plants with similar technology, demonstrating a second order polynomial trend with a reduction in cost.
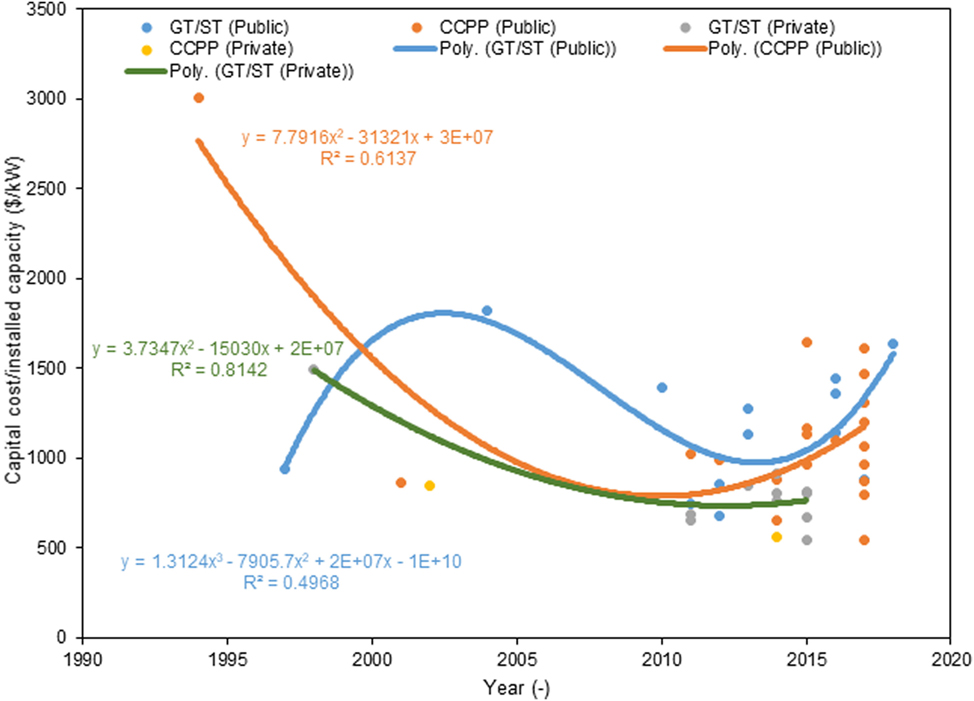
Figure 5. Cost evolution of different power generation technologies. In the case of coal, one subcritical power plants and two future ultra-supercritical ones not sufficient to see the cost evolution. For hydroelectric, solar PV, and nuclear, the power plant numbers are insufficient for analysis of learning rate or cost evolution. Under these circumstances, highly utilized technologies such as gas turbine engine and combined-cycle power plant (CCPP) for public and private power plants were analyzed for cost evolution.
Independent-samples t-test was conducted to compare the capital cost in public and private owned power plants. The cost of GT/ST and CCPP technologies were considered for the tests. In the case of GT/ST, there was a significant difference in the capital cost of public (M = 1,226.09, SD = 360.62) and private (M = 751.68, SD = 108.80) owned power plants; t(11.97) = 4.16, p = 0.001. These results suggest that GT/ST power plant ownership depending on being public and private influences its capital cost. The test results suggest that public power plants have higher capital cost. In the case of CCPP, there was not a significant difference in the capital cost of public (M = 1,075.33, SD = 263.21) and private (M = 704, SD = 203.60) owned power plants; t(19) = 1.92, p = 0.070. These results suggest that CCPP power plant ownership depending on being public and private does not influence its capital cost. However, the private CCPP power plants number was only two. With more data points in the future, this analysis may be improved.
Corruption
Several reports and articles suggested that there has been significant evidence of corruption in electricity generation projects and operations, as well as in distribution system in Bangladesh (Ruth, 2002; Hossain and Tamim, 2005/2006; Kenny, 2007; Khan, 2007; D’Costa, 2012; IBP, 2012; Khan and Rasheduzzman, 2013; TIB, 2016). The measurement of corruption is complicated as it depends on complex variables (Galtung, 2006). Therefore, no single source or polling method has yet been developed that can provide a convincing methodology (Lambsdorff, 2006). Transparency International started CPI score for different countries in 1995 to put the issue of corruption on the international policy agenda (TI, 2017a,b). For this study, CPI score for Bangladesh was adopted to be analyzed with the capital cost of power plants in the same year to examine the effect of corruption on cost evolution. Before 2012, CPI scores were ranked 0–10. However, the scale was amended in 2012 to the range of 0–100, to demonstrate the better effect of corruption on the economy of a country (TI, 2012). The CPI scores before 2012 were converted to 0–100 scale by multiplying 10 with the scores to compare the data from 2004 to 2016. Higher CPI score is interpreted as lower corruption, which may result in reduced capital cost and vice versa (Figures 6A,B). Only 42 public and private power plants (among studied 61) cost data, which were built within 2004–2016, were found and analyzed in this correlation study. The cost data scarcity worked as a limitation in rendering a detailed relationship. With increased data available in the future, the correlation may improve. Independent-samples t-test was conducted to compare the capital cost in public and private owned power plants. There was a significant difference in the capital cost of public (M = 1,156.20, SD = 332.40) and private (M = 734.26, SD = 118.29) owned power plants; t(40) = 4.09, p = 0.000. These results suggest that being public and private owned influences its capital cost. The test results suggest that public power plants have higher capital cost.
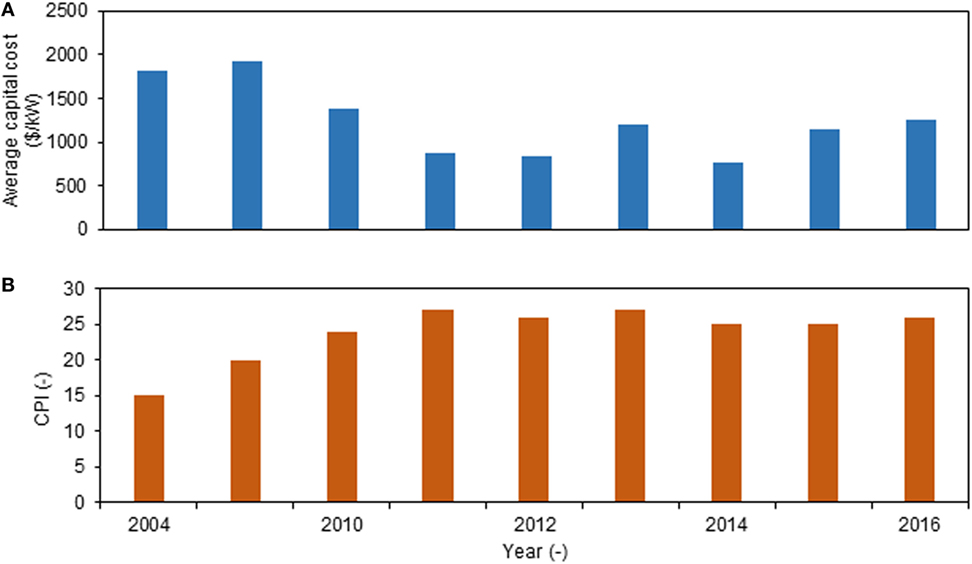
Figure 6. (A) Average capital cost (2004–2016) and (B) Corruption Perceptions Index (CPI) score (2004–2016). Chart (B) is demonstrating that CPI is not gradually reducing. Moreover, the average capital cost of power plants is related to the change of CPI score. Here, higher CPI score means lower corruption.
To assess the relationship between the CPI score and the capital cost of power plants in Bangladesh, Pearson’s test for normally distributed interval data was conducted. There was a negative correlation between the two variables, r = −0.477, n = 42, p = 0.001 (Table 4). Figure 7 summarizes the results and demonstrated that corruption in Bangladesh is negatively related to a capital cost of power plants with R2 = 0.32 for annual CPI scores. Overall, there was a strong, negative correlation between corruption and capital cost of power plants. Decreases in corruption (increase in annual CPI score) were correlated with decreased capital cost of power plants. Corruption is a continual socioeconomic phenomenon traversing through years from megaproject construction and operation. CPI score represents an annual performance of a country. Whereas the power plant megaproject constructions usually go on for 2–7 years (GoB, 2015). Furthermore to the Pearson’s correlation test between annual CPI score and capital costs, additional correlation study was undertaken in this research to explore the relationship of the cost with biannual, triannual and quadrennial average CPI scores. The main objective of the study was to examine the correlation between different temporal CPI scores and capital costs. Table 4 summarizes the results. Figure 7 illustrated that the correlation R2 value was better between the biannual CPI score and capital cost. However, the Pearson’s correlation test showed that the best relationship was between the annual CPI scores and capital costs as the p-value was the lowest (Table 4).

Table 4. Pearson correlation test between Corruption Perceptions Index (CPI) score and capital cost per installed capacity of power plants in Bangladesh.
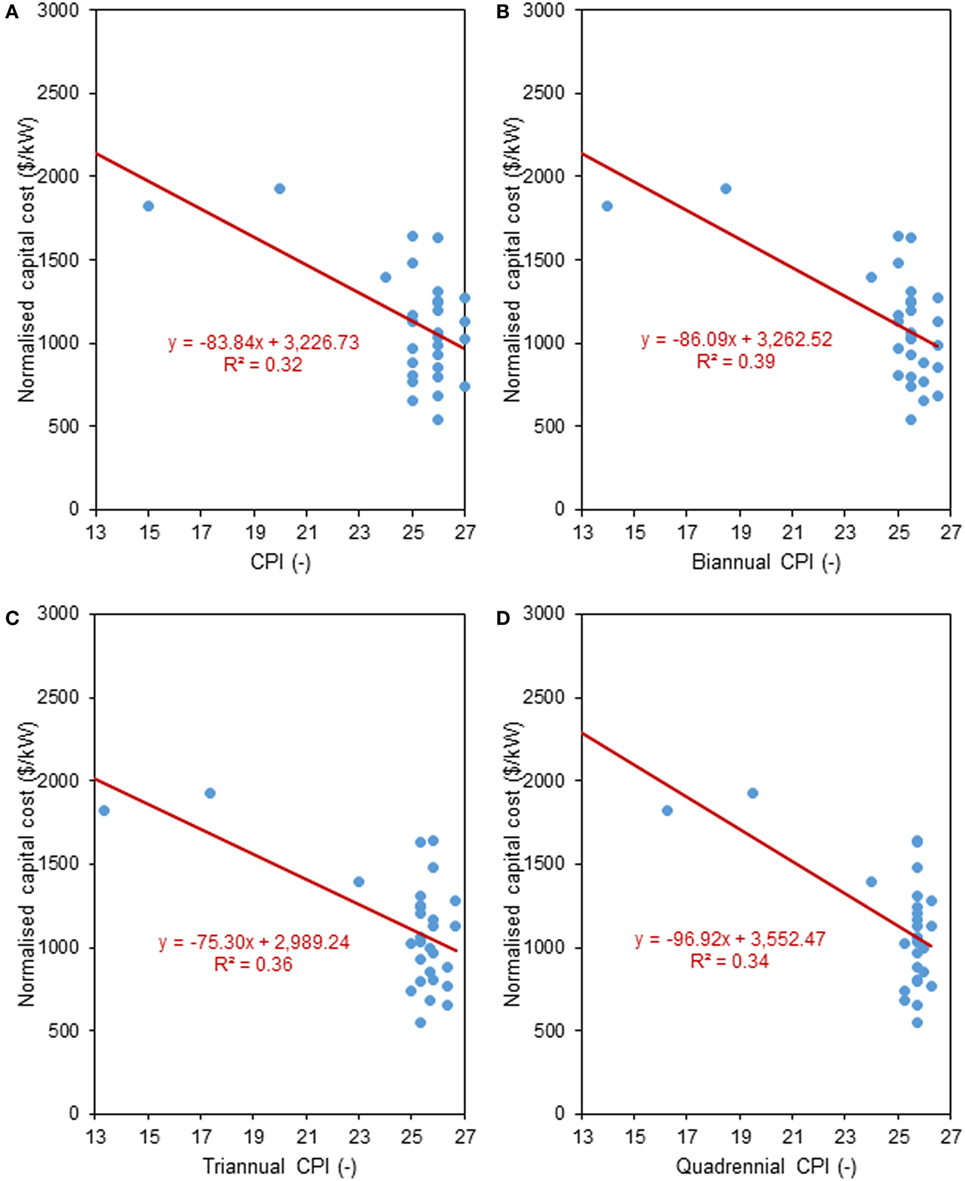
Figure 7. Corruption vs. capital cost analysis for Bangladeshi power plants: (A) normalized capital cost vs. average annual Corruption Perceptions Index (CPI) scores, (B) normalized capital cost vs. average biannual CPI scores, (C) normalized capital cost vs. average triannual CPI scores, and (D) normalized capital cost vs. average quadrennial CPI scores.
The upper and lower limits of cost reduction per CPI score increase were $116.94 and $45.47/kW, respectively. In some cases, the capital cost of public plants was two times higher than that of the private ones for the similar technology and time frame. Therefore, Bangladesh can reduce their cost of establishing power plants by reducing corruption. The power plant projects are expensive, and the government takes 66–94% (GoB, 2015) of the total cost of loans from banks and aid organizations such as World Bank, Asian Development Bank. Higher capital cost means a more significant loan from funding bodies, which the government has to repay in the future from the revenues. Larger repayment can put pressure on the economy and people.
One of the reasons behind this significant corruption was the lack of governance in the energy sector. Implementing “Quick Enhancement of Electricity and Energy Supply (Special Provisions) Act, 2010” enabled the government and responsible departments with authority to take rapid energy development initiatives while bypassing the 2006 public procurement law, with easy and quick procurement procedure for investing in the energy sector outside the bar of jurisdiction of the court (GoB, 2016). Laws such as “Quick Enhancement of Electricity and Energy Supply (Special Provisions) Act, 2010” raised significant concern regarding transparency allowing enhanced scope for corruption among the donors (Choudhury et al., 2010). The findings of this study suggest that the corruption may have influenced the higher cost of power plants in the past and increased after the implementation of the special provisions act (2010).
Conclusion
As a rapidly developing economy, Bangladesh has been establishing and will continue to build more power plants to support the growing demand for electricity. Literature suggested that there is a lack of research on the cost analysis of the rapidly growing energy sector in Bangladesh; partially because of the data inadequacy and lack of transparency in the government. Initially, a cost database was compiled from different resources for this study. For analyzing the cost of installing power plants in Bangladesh, the cost (public and private) data were compared with the world. The results demonstrated an intriguing aspect of a rapidly developing economy. Most of the public plants showed higher capital cost compared with the world average. Also, the cost of similar power generation technologies in private and public sector has a significant difference in Bangladesh. On top of the higher capital cost, the cost evolution demonstrated that cost of establishing public power plants is augmenting with time, whereas its opposite in private sector as well as in the world. In the case of expanding cost, this study showed a significant correlation between corruption and higher cost of power plants. Higher corruption may increase the cost of a power plant in a developing context such as Bangladesh.
This study renders the opportunity to focus on the amendable condition of corruption within the governmental system to reduce the cost of establishing public power plants in Bangladesh. The government should implement more transparent and supervised system for establishing power plants to reduce the adverse influences of corruption on the megaprojects. Otherwise, there is a possibility the expensive power plants would become into “white elephant” projects (Lewis and Williams, 1985; Ross and Staw, 1993), where the output is smaller than that of investment. The higher cost would impose an additional burden on the future economy.
Author Contributions
KD collected the data. KD and MM analyzed and interpreted the data and wrote the paper.
Conflict of Interest Statement
The authors declare that the research was conducted in the absence of any commercial or financial relationships that could be construed as a potential conflict of interest.
References
Ahmed, Z. (2011). Electricity crisis of Bangladesh: result of organizational inefficiency? Energy Environ. Res. 1, 12. doi: 10.5539/eer.v1n1p12
APSCL. (2015a). Ashuganj Power Station Company LTD. Available at: http://www.apscl.com/home/plant_status
APSCL. (2015b). Power Generation Development Plan-2012. Ashuganj: Ashuganj Power Station Company LTD.
BB. (2016). Exchange Rate of Taka. Available at: https://www.bb.org.bd/econdata/exchangerate.php
BPDB. (2017). Available at: http://www.bpdb.gov.bd/bpdb/
BREB. (2016). History of Rural Electrification in Bangladesh. Available at: http://www.reb.gov.bd/index.php/2-reb
Capasso, S., and Santoro, L. (2017). Active and passive corruption: theory and evidence. Eur. J. Polit. Econ. doi:10.1016/j.ejpoleco.2017.05.004
Choudhury, S. R., Ali, M., Shamsuddin, A. K. M., Karim, Z., Mazumder, M. A. M., Islam, A. B. M. A., et al. (2010). Evaluation of the Implementation of the Paris Declaration, Phase – II, Country Evaluation Bangladesh. Dhaka, Bangladesh: Natural Resources Planners Ltd.
Coinnews. (2016). Consumer Price Index Data from 1913 to 2016. Available at: http://www.usinflationcalculator.com/inflation/consumer-price-index-and-annual-percent-changes-from-1913-to-2008/
CPGCBL. (2015). Coal Power Generation Company Bangladesh Limited. Available at: http://www.cpgcbl.gov.bd/?page_id=73
De Chiara, A., and Livio, L. (2017). The threat of corruption and the optimal supervisory task. J. Econ. Behav. Organ. 133, 172–186. doi:10.1016/j.jebo.2016.11.006
Ebinger, C. K. (2011). Energy and Security in South Asia: Cooperation Or Conflict? s.l.: Brookings Institution Press.
EGCBL. (2015). Electricity Generation Company of Bangladesh Limited. Available at: http://www.egcb.com.bd/welcome/plant_details/1
FE. (2015). Bangladesh to be developed country by 2040. Available at: http://today.thefinancialexpress.com.bd/public/?date=21-06-2015 [cited June 21, 2015].
Galtung, F. (2006). Measuring the immeasurable: boundaries and functions of (macro) corruption indices. Meas. Corrupt. 101, 101–130.
Ghasemi, A., and Zahediasl, S. (2012). Normality tests for statistical analysis: a guide for non-statisticians. Int. J. Endocrinol. Metab. 10, 486. doi:10.5812/ijem.3505
GoB. (2015). Annual Report 2015. Dhaka: Power Division, Ministry of Power, Energy and Mineral Resources (MPEMR).
GoB. (2016). Quick Enhancement of Electricity and Energy Supply (Special Provisions) Act, 2010. Dhaka: Ministry of Power, Energy & Mineral Resources, Government of the People’s Republic of Bangladesh.
Hossain, I., and Tamim, M. (2005/2006). Energy and Sustainable Development in Bangladesh. s.l.: HELIO International.
IBP. (2012). Bangladesh Country Study Guide: Strategic Information and Developments. USA: International Business Publications.
IDCOL. (2015). Annual Environmental and Social Compliance Audit: 108 MW Power Project at Kolagaon. Chittagong, Bangladesh: Infrastructure Development Company Limited (IDCOL).
IDCOL. (2017). Renewable Energy. Available at: http://idcol.org/home/penergy
IEA. (2014). Assumed Investment Costs, Operation and Maintenance Costs and Efficiencies in the IEA World Energy Investment Outlook 2014. s.l.: International Energy Agency.
ILO, IILS. (2013). Bangladesh: Seeking Better Employment Conditions for Better Socioeconomic Outcomes. Geneva, Switzerland: ILO.
Jalil, M. A., and Islam, M. S. (2010). Towards a long-term development vision for Bangladesh: some socioeconomic and legal aspects. Asian Cult. Hist. 2, 58. doi:10.5539/ach.v2n2p58
JICA, TEPCO. (2011). The Study for Master Plan on Coal Power Development in the People’s Republic of Bangladesh, Power System Master Plan 2010. s.l.: Energy and Meneral Resources, Ministry of Power, People’s Republic of Bangladesh.
Kenny, C. (2007). Infrastructure Governance and Corruption: Where Next? s.l.: World Bank Publications.
Khan, M. Z. H., and Rasheduzzman, M. (2013). Performance of the Power Sector of Bangladesh: Governance Failures and Remedial Measures. s.l.: Transparency International Bangladesh.
Khan, S. (2007). Honesty = Success, Dishonesty = Failure An Overview of Power Sector Unbundling in Bangladesh (1996–2006), Vol. 2. Dhaka: The Daily Star.
Khatun, F., and Ahamad, M. (2013). FDI in the Energy and Power Sector and Economic Growth in Bangladesh. s.l.: CPD-CMI Working Paper Series.
Lambsdorff, J. G. (2006). Measuring corruption – the validity and precision of subjective indicators (CPI). Meas. Corrupt. 81, 81–99.
Lewis, J., and Williams, A. (1985). The Sines Project: Portugal’s growth centre or white elephant? Town Plan. Rev. 56, 339. doi:10.3828/tpr.56.3.t57q91u885076373
Locatelli, G., Mariani, G., Sainati, T., and Greco, M. (2017). Corruption in public projects and megaprojects: there is an elephant in the room! Int. J. Project Manage. 35, 252–268. doi:10.1016/j.ijproman.2016.09.010
Mahmood, S. A. I. (2010). Public procurement and corruption in Bangladesh confronting the challenges and opportunities. J. Publ. Admin. Policy Res. 2, 103–111.
Masuduzzaman, M. (2012). Electricity consumption and economic growth in Bangladesh: co-integration and causality analysis. Glob. J. Manage. Business Res. 12, 47–56.
MoF. (2009). Invigorating Investment Initiative through Public Private Partnership: A Position Paper. Dhaka, Bangladesh: Ministry of Finance, Government of Bangladesh.
MoF. (2010). Towards Revamping Power and Energy Sector: A Road Map. Dhaka: Bangladesh: Ministry of Finance, Government of Bangladesh.
MoF. (2011). Power and Energy Sector Road Map: An Update. Dhaka: Bangladesh: Government of Bangladesh.
Mourshed, M. (2013). Pitfalls of oil-based expansion of electricity generation in a developing context. Energy Strat. Rev. 1, 205–210. doi:10.1016/j.esr.2012.08.001
Mujeri, M. K., Chowdhury, T. T., and Shahana, S. (2014). Energy Sector in Bangladesh: An Agenda for Reforms. Ontario, Canada: International Institute for Sustainable Development.
Nath, N. C. (2012). Manufacturing Sector of Bangladesh-Growth, Structure and Strategies for Future Development. s.l. Bangladesh Economic Association (BEA). Available at: http://bea-bd.org/site/images/pdf/47.pdf
Neij, L. (2008). Cost development of future technologies for power generation – a study based on experience curves and complementary bottom-up assessments. Energy Policy 36, 2200–2211. doi:10.1016/j.enpol.2008.02.029
NREL. (2012). Cost and Performance Data for Power Generation Technologies. s.l.: National Renewable Energy Laboratory.
Omprasad, G. (2016). Structure, growth and associated problems in Bangladesh power sector: a glance into the PreReform period. Ind. J. Appl. Res. 6, 753–754.
Othman, Z., Shafie, R., and Hamid, F. Z. A. (2014). Corruption-Why do they do it? Proc. Soc. Behav. Sci. 164, 248–257. doi:10.1016/j.sbspro.2014.11.074
Phadke, A. (2009). How many Enrons? Mark-ups in the stated capital cost of independent power producers’(IPPs’) power projects in developing countries. Energy 34, 1917–1924. doi:10.1016/j.energy.2009.07.043
Ross, J., and Staw, B. M. (1993). Organizational escalation and exit: lessons from the Shoreham nuclear power plant. Acad. Manage. J.36, 701–732. doi:10.2307/256756
Ruth, M. (2002). Corruption and the Energy Sector. Washington, DC: Management Systems International.
Samarasekara, M. B., and Silva, M. T. D. (2015). Long Term Generation Expansion Planning Studies 2015–2034. Colombo: Ceylon Electricity Board, Sri Lanka.
TI. (2012). Corruption Perceptions Index (CPI). Available at: https://www.transparency.org/
TI. (2017a). Corruption Perceptions Index: Overview. Available at: https://www.transparency.org/research/cpi/overview
TI. (2017b). Corruption Perceptions Index: Overview. Available at: https://www.transparency.org/research/cpi
TIB. (2016). Anti-Corruption Agency Strengthening Initiative: Assessment of the Bangladesh Anti-Corruption Agency 2016. s.l.: Transparency International Bangaldesh.
WB. (2016). World Data Bank. Available at: http://data.worldbank.org/
WB. (2017). Siddhirganj Power Project. Available at: http://projects.worldbank.org/P095965/siddhirganj-peaking-power-project?lang=en&tab=documents&subTab=projectDocuments
Keywords: corruption, power plant, energy sector, capital cost, developing context
Citation: Debnath KB and Mourshed M (2018) Corruption Significantly Increases the Capital Cost of Power Plants in Developing Contexts. Front. Energy Res. 6:8. doi: 10.3389/fenrg.2018.00008
Received: 11 September 2017; Accepted: 14 February 2018;
Published: 08 March 2018
Edited by:
Sonia Yeh, Chalmers University of Technology, SwedenReviewed by:
Peter Burgherr, Paul Scherrer Institut (PSI), SwitzerlandConstantinos Taliotis, Royal Institute of Technology, Sweden
Copyright: © 2018 Debnath and Mourshed. This is an open-access article distributed under the terms of the Creative Commons Attribution License (CC BY). The use, distribution or reproduction in other forums is permitted, provided the original author(s) and the copyright owner are credited and that the original publication in this journal is cited, in accordance with accepted academic practice. No use, distribution or reproduction is permitted which does not comply with these terms.
*Correspondence: Kumar Biswajit Debnath, ZGVibmF0aGtAY2FyZGlmZi5hYy51aw==