 Pavlo Bohutskyi1*
 Troy A. Keller2
 Duc Phan3
 Markeshia L. Parris2Mengyuan Li2Lakesha Richardson2
 Anatoliy M. Kopachevsky4,5,6
- 1Pacific Northwest National Laboratory, Biological Sciences Division, Richland, WA, United States
- 2Department of Earth and Space Sciences, Columbus State University, Columbus, GA, United States
- 3Department of Civil and Environmental Engineering, The University of Texas at San Antonio, San Antonio, TX, United States
- 4Department of Water Supply and Sanitary Engineering, Academy of Construction and Architecture of V.I. Vernadsky Crimean Federal University, Simferopol, Republic of Crimea
- 5Water Technologies Research and Production Company, Simferopol, Republic of Crimea
- 6Water of the Crimea State Unitary Enterprise of the Republic of Crimea, Simferopol, Republic of Crimea
Wastewater algal treatment systems show improved economic viability and enhanced energy return on investment if integrated with biofuel production. One option is to anaerobically digest the algae to generate bio-methane. This method is appropriate for relatively low lipid filamentous algae typical of turf scrubbers®. However, an unbalanced algal biomass composition (e.g. carbon-to-nitrogen ratio, C/N) and the resistance of algae to biodegradation can limit biomass conversion into bio-methane. To evaluate options to enhance bio-methane production, an indigenous assembly of macro-algae was established and cultivated in CO2-infused secondary wastewater effluent, then harvested and either anaerobically digested using pretreatments or co-digested with sewage sludge. Results were used to develop methane production kinetic models and perform an anaerobic digestion (AD) system energy balance analysis to assess the feasibility of pretreatment and co-digestion for a scaled process. Floways were dominated by Ulothrix and Oedogonium algae and had periphyton biomass production rates that averaged 3.7 ± 0.4 g VS m−2 d−1 (±1 SD) during the initial 7-day colonization period. Biomass increased by 62% in the second half of the 14-day experiment. Ultimate methane yield from harvested biomass was improved relative to controls (306 ± 13 mL gVS−1) through thermal pretreatment by 15%, dilute acid by 5%, dilute alkali by 17%, and acid- and alkali-assisted thermochemical pretreatments by 23 and 27%, respectively. However, all pretreatment methods undermined the energy balance parameters including Net Energy Ratio (NER) and Net Energy Efficiency (NEE) due to the heat required for thermal pretreatments and the electricity needed to produce chemical reagents. In contrast, co-digestion of algal biomass with sewage sludge synergistically enhanced methane generation, yielding up to 401±3 mL gVS−1 at an algae-to-sludge ratio of 20% to 80%. Co-digestion with sludge also strongly improved AD system energy balance. NER and NEE increased from 2.8 and 73% for algae alone to 4.3 and 81% for a 20% to 80% algae-to-sludge mix, respectively. Moreover, the Net Energy Recovery during co-digestion reached 39% compared to 26 and 33% when algae or sewage sludge were processed as single-substrates. Thus, co-digestion of algae with sewage sludge serves as an attractive option for maximizing energy gain from AD of biomass harvested from filamentous algal treatment systems.
Introduction
Nutrient over-enrichment has resulted in the impairment of more than 189,000 km of rivers and 6,800 km2 of freshwater in the US (EPA, 2018). These nutrients cause eutrophication and contribute to the rise in harmful freshwater algal blooms (Heisler et al., 2008). Economic costs associated with freshwater eutrophication alone already exceed $2 billion per year for the US economy (Dodds et al., 2009). Because wastewater effluent contributes substantially to the release of nutrient pollution into aquatic ecosystems (Carey and Migliaccio, 2009), advanced treatment technologies have been developed that can reduce nutrient pollution from wastewater effluent (Leo et al., 2011). However, only 32% of US wastewater treatment facilities use advanced nutrient removal technologies (EPA, 2013) due to their high capital and operation costs.
Treatment technologies using algae to remove nutrients from wastewater hold promise as a more sustainable alternative to traditional wastewater treatment (Park et al., 2011; Bohutskyi et al., 2015b, 2016b). While there are numerous methods for growing algae in wastewater (Prajapati et al., 2013), filamentous algal treatment systems are easy to harvest and dewater, operate under a broad range of environmental conditions, reduce nutrients to low concentrations, and produce large quantities of renewable biomass (Adey et al., 2011; Bohutskyi et al., 2016a). Indeed, algal turf scrubbers® can be used to treat aquatic ecosystems, contaminated groundwater, municipal sewage, and industrial/agricultural wastewater (Adey et al., 2011; Bohutskyi et al., 2016a).
Generally speaking, algal treatment systems show improved economic viability (Zamalloa et al., 2011) and enhanced energy return on investment (Zaimes and Khanna, 2013) when the algal biomass is converted to valuable products or biofuel (Tang et al., 2015). One practical approach is anaerobic digestion (AD) of the algae to generate bio-methane (Bohutskyi and Bouwer, 2013; Bohutskyi et al., 2018b). For filamentous algae, typical of turf scrubbers, AD may be preferred to the extraction of lipids for biodiesel considering low lipid composition of macro-algae (Bohutskyi et al., 2016a). Because AD methane production can be inhibited by the unbalanced carbon-to-nitrogen (C/N) ratios and the resistance of algal cell walls to degradation (Prajapati et al., 2013), realistic and energy-effective methods for enhanced bio-digestion filamentous algae are needed to realize the full potential of coupled turf scrubber-biogas systems (Adey et al., 2011).
One option for improving algal bio-digestion is to pretreat algae using chemical, mechanical, or thermal processes (Bohutskyi and Bouwer, 2013). The effectiveness of these approaches depends on the pretreatment applied and on the biomass characteristics of the processed algal species (Bohutskyi et al., 2014). Alternatively, production of bio-methane can be improved through co-digestion with other types of low-cost co-substrates, which may include lignocellulosic residues (Bohutskyi et al., 2018a) or sewage sludge (Bohutskyi et al., 2019) available at wastewater treatment sites. Because pretreatment and co-digestion can require additional energy and increased volume of the digesters, these processes could decrease the net energy output, net energy ratio (NER) and other energy balance parameters of AD. These additional “costs” can reduce the economic attractiveness of the entire process. While pretreatment and co-digestion efficiency are typically evaluated using the final bio-methane yield, the assessment of their effects on the kinetics of methane production and AD system energy balance parameters is essential for evaluating the feasibility of scaling up the entire wastewater-algae-methane process.
Currently, wastewater treatment facilities in the U.S. and Puerto Rico use anaerobic digestion to treat half of the wastewater-derived sewage sludge for beneficial uses (Seiple et al., 2017). These wastewater treatment facilities have a pre-existing infrastructure for co-digestion of the filamentous algae with sewage sludge. Moreover, most of the existing digesters are not loaded to their full capacity (Pennington, 2018). Thus, the U.S. currently has a significant number of the treatment facilities capable of coupling filamentous algal treatment systems with anaerobic co-digestion. This study seeks to address a critical research and engineering challenge—namely, to evaluate the impact of various pretreatment methods and co-digestion with sewage sludge on the methane production potential from filamentous algae grown in wastewater for tertiary nutrient removal. These data were then used to develop methane production kinetic models and to compare the AD system energy balance parameters including net energy output, volume- and mass-specific energy output, net energy ratio (NER), net energy efficiency (NEE), and net energy recovery (NERec).
Materials and Methods
Algae Cultivation and Biomass Harvesting
Algae were cultivated in a pilot-scale, recirculating filamentous algal treatment system (Keller and Husted, 2015) operated outdoors at the South Columbus Water Resources Facility (Columbus Water Works, Inc., 32.41N, 84.97W) from Oct 10 to Oct 24, 2014. This treatment facility processes the municipal wastewater for Columbus and Fort Benning (Georgia, USA), serving a combined population of more than 200,000 residents. The region exists in a temperate climatic zone, defined as humid subtropical (Peel et al., 2007).
The recirculating filamentous algal treatment system used to grow the algae for these measurements was composed of a constant-head feeder tank (180 L), 8 vinyl floways (3 m long ×10 cm wide ×1 cm water depth) and a sump (560 L) (Figure 1). The system was filled with secondarily treated wastewater from a clarifier before it was neutralized or chlorinated. Algae were grown on 47 mm circular glass fiber filters (1 um) attached to clay tiles (Figure 1).
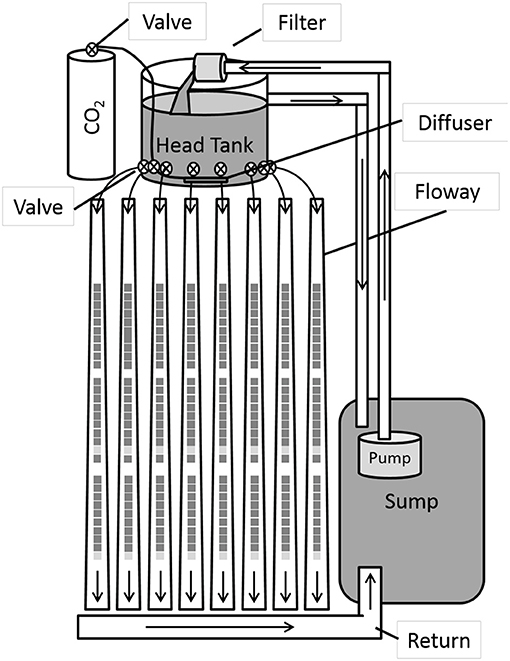
Figure 1. Recirculating wastewater treatment system used to grow filamentous algae. Water was delivered from the constant pressure head tank to each floway before draining to the sump. Floways were made from vinyl gutters (3 m long ×10 cm wide) and lined with unglazed clay tiles (gray squares). Arrows indicate direction of water flow. Food grade carbon dioxide was infused into the head tank during daylight hours to stimulate algal productivity. Reproduced from Keller and Husted (2015), with permission from the copyright holders, IWA Publishing.
Food-grade compressed carbon dioxide (100%) was infused into the head tank during daylight hours to prevent pH spikes (Mulbry et al., 2008). Gas delivery rates were set to ensure sump water pH remained below 8.0 during times of peak algal productivity. To characterize environmental conditions during the experiment, data on insolation, discharge, and nutrient dynamics were also collected. The modeled light incidence (DHI) was estimated using the National Renewable Energy Laboratory's Physical Solar Model (PSM v3, accessed 6/21/2018). Discharge, volume per unit time (mL/s), was calculated after collecting effluent from each floway for 15–30 s and measuring volume/unit time. Nutrient dynamics in the filamentous algal treatment system were characterized prior to, during (day 7) and after the end of the 14-day experiment. Water samples were collected from each sump, chilled on ice, and analyzed for phosphate (US EPA 365.3), nitrate (US EPA 300A), and ammonia (US EPA 350.3) at the Columbus Water Works, Inc. water quality laboratory.
To quantify algal chlorophyll and total biomass, two randomly selected tiles were collected from each floway to measure chlorophyll a (CHL) and volatile solids (VS) on days 7 and 14. Algal samples were transported on ice and stored frozen until analysis. To characterize the biogas production potential, all the algal biomass remaining in each floway was collected, partially dewatered, and transported on ice. At the lab, samples were stored and shipped frozen (−20°C) for AD experiments.
To characterize changes in productivity over the course of the experiment, the volatile solids productivity rates (g/m2/day) were calculated and compared for day 7 and 14 using a paired t-test and JASP Version 0.9.1 software (JASP-Team, 2018). Paired t-test was used because each flume was sampled twice (i.e., day 7 and 14). Nutrient removal rates were calculated as loss of nutrient mass (g) from the beginning to the end of the experiment per unit growing area (i.e., 2.4 m2) per day (i.e., 14).
Biomass Feedstock
Thawed samples of filamentous algal biomass were homogenized for 10 min using an Oster® 10-Speed blender equipped with a 25 mm radius blade at 27,000 rpm (A.J. Oster Corp., Warwick, CT, USA). Homogenized algal biomass was diluted to ~3% dry weight slurry and stored at 4°C prior to analysis (<48 h). Raw sewage sludge, representing a mix of primary and secondary sludge, was collected at the Back River Wastewater Treatment Plant. This facility processes domestic wastewater derived from nearly 1.3 million residents in Baltimore City and County (USA). It was sampled from the input to the anaerobic digester, stored at 4°C and used as a co-substrate for co-digestion experiments.
Pretreatment and Co-digestion of Algal Biomass
Alkaline and Acid Treatments
To characterize the effectiveness of alkaline and acid pretreatments, a known amount of either 50% NaOH or 37% HCl was added to 120 mL of ~3 % dry weight (dw) algal biomass slurry. This slurry had a final concentration of 10 g L−1 of the reagent (NaOH or HCl). The samples were mixed carefully and transferred into 60 ml bottles for either thermal or room temperature pretreatment. After ambient temperature samples were incubated for 2 h at room temperature (22°C), the pH of the remaining solution was measured and neutralized to 7.2 ± 0.1 using either 37% HCl or 50% NaOH. Neutralized samples were used in biomethane potential tests.
Thermal and Thermochemical Treatment
Thermal and thermochemical pretreated samples were autoclaved at 121°C, 10 bar for 30 min and cooled to ambient temperature (~1 h). Samples were neutralized to pH 7.2 ± 0.1 prior to their use in biomethane potential assays.
Co-digestion of Algal Biomass With Sewage Sludge
The effect of co-digestion of algal biomass with sewage sludge was evaluated by digesting mixes of algae and sludge at different ratios. The algae-to-sewage sludge ratios are presented based on biomass volatile solids. Nine algae (A)-to-sludge (S) ratios were tested: A100%:S0%, A90%:S10%, A80%:S20%, A65%:S35%, A50%:S50%, A35%:S65%, A20%:S80%, A10%:S90%, and A0%:S100%.
Biomethane Potential Testing and Theoretical Methane Production
The biomethane potential (BMP) test procedure was adapted from Owen et al. (1979) with minor modification as described previously (Bohutskyi et al., 2014). In all experiments, the total dose of substrate and inoculum in the final anaerobic medium equaled 2 gVS L−1. All samples were analyzed in triplicate to estimate sample mean and standard deviation. The maximum theoretical yield of methane was estimated using a modified Buswell Equation (1) (Buswell and Mueller, 1952):
where: x = (4c+h−2o−3n)/8 and y = (4c−h−2o+3n)/4
Biogas and Methane Production Kinetic Models
In the current study, four kinetic models were compared for their accuracy in describing biogas and methane production dynamics including 1st-order rate (Equation 2), pseudo-parallel, 1st-order rate (Equation 3), modified Gompertz (Equation 4), and transference function (Equation 5).
where Ym and Yth.m are the ultimate and theoretical maximum cumulative biogas or methane yields (mL gVS−1), respectively; k, kbd and krs are the 1st-order rate constants (day−1) for algal biomass, readily biodegradable fractions and resistant fractions, respectively; Pbd and Prs are the fractions of the biodegradable and resistant fractions of the algal biomass, where Prs = 1 − Pbd; K is the specific rate constant (mL gVS−1 d−1); λ is the lag phase time constant (day); and ti is incubation time (day).
Model parameters were estimated using MS Excel's built-in optimization tool (i.e., Solver) by minimizing the root mean square deviations (RMSD, see Table S1 of Supplementary Information for details). The agreement between the measured or model-predicted values was evaluated by comparing the RMSD and the coefficient of determination R2.
Synergistic Effects of Co-digestion
The synergy in methane yield from co-digestion of wastewater algae with sewage sludge was estimated using the following Equation 6:
where: Yexper.co−digestion is the experimentally measured biogas or methane production from co-digested samples; Yexper.algae and Yexper.SS are experimentally measured biogas or methane production from the digestion of algae and sewage sludge as single-substrates; and Falgae and Fsewagesludge are fractions of algae and sewage sludge substrates used in the co-digestion experiment. Positive values of Esynergy indicate the cdigestion improved methane production whereas negative values indicate inhibition.
Estimation of AD System Energy Balance Parameters
AD process kinetic models were used to evaluate the impact of algal biomass pretreatment and co-digestion with sewage sludge on the energy balance of a full-scale completely-mixed continuous AD system (CSTR AD). Models were constructed using the methodology described earlier (Bohutskyi et al., 2018a), with modifications accounting for additional energy input for pretreatment. Briefly, the model assesses CSTR AD performance assuming the processing of 25 wet metric tons of algal biomass per day (details in Table S1). The generated biogas was utilized onsite using a boiler and a combined heat-and-power unit (CHP). The equations used for calculation of selected energy balance parameters are the following:
where EProduction is the energy produced from burning the biogas in a boiler (for heat) and CHP (for heat and electricity); EInput is the input of energy (as heat and electricity) required to operate the biomass pretreatment system, AD bioreator and CHP unit; mVS is the digested feedstock in metric tons of volatile solids (organic matter); VAD is the volume of AD bioreactor, m3; and HHVbiomass is the high heating value (calorific) of processed biomass. Energy balance parameters were calculated in watts for heat energy, electrical energy, and combined heat + electrical energy.
The AD system total energy input and production were calculated as follows:
The heat input was estimated as heat for biomass preheating, heat losses through AD walls and heat required for the production of the chemical reagents used for pretreatment:
where: m is the wet mass of processed biomass (ton); γ is the specific heat of the biomass (4.19 kJ kg−1 °C−1); Ta and Td are the ambient and digestion temperatures of the biomass (10°C and 35°C, respectively); ki is the heat transfer coefficient (W m−2 °C−1); Ai is the area of the digester surface (walls, bottom or cover), (m2); d is the dose of chemical reagent (1%); and p is the power for production of chemical reagent (200 kW ton−1) (Worrell et al., 2000; Scheme, 2010).
The electricity input was calculated as follows:
where: is the electricity for biomass pumping in and out of the digester (head losses); is the electricity for biomass mixing (3.8 W per m3 of digester) (Lue-Hing, 1998); is the electricity for biomass circulation for heating (2.4 W m−3); is the other electricity consumption (e.g. lighting, automation), (3.6 W m−3); is the electricity for operation of the CHP unit (74 W per m3 of methane) (Naegele et al., 2012); and is the electricity for production of chemical reagent (1,500 kW ton−1) (Worrell et al., 2000; Scheme, 2010).
The AD system total energy production was calculated using the following equation:
Both heat and electrical energy productions were calculated based on the biogas and methane production at various digester HRT times (from 3 to 45 days) using one of the models (Table 2) with the highest fitting accuracy as follows:
where: is the production of heat using boiler and is the production of heat using CHP.
where: 0.05 and 0.9 account for 5% of the produced biogas utilized in the boiler (90% in CHP, and the remaining 5% of produced biogas is flared); YCSTR is the methane production in the CSTR AD system which was estimated using the most appropriate model (Equations 2–5), (m−3); ξ is the methane lower calorific value (36.6 MJ m−3); and are the energy conversion efficiency for heat in boiler, for heat and electricity in CHP unit (85, 55, and 30%, respectively).
The biogas and methane production in the CSTR AD system for various HRTs were estimated using the most accurate kinetic model and CSTR residence time distribution by applying the segregation model described by Fogler (2016):
where: YCSTR is the estimated biogas or methane production in CSTR AD system; Ymodel(t) is the kinetic equation of biogas or methane production (Equations 2–5); and E(t) is the residence time distribution function.
The residence time distribution function for the CSTR bioreactor (Fogler, 2016) is calculated as follows:
where: τ is the bioreactor hydraulic residence time (days) and t is the solid residence time for a selected portion of biomass (days).
The final equations for the estimation of the CSTR AD biogas and methane production (mL gVS−1) are shown in Equation 23 (uses analytical solution) for the 1st-order kinetic model and in Equation 24 for other kinetic models (calculated by numerical integration using trapezoidal rule). The detailed calculations are shown in Table S2 of Supplementary Information.
Analytical Techniques
Algal Cultivation
Temperature and pH were recorded twice per hour using a calibrated YSI 6920-V2 multi-parameter water quality sonde submerged in the sump. Insolation was estimated using the National Renewable Energy Laboratory Physical Solar Model v3 model (DHI field). DHI models solar radiation on a horizontal surface received from the sky excluding the solar disk. Soluble phosphate (filtered, 0.45 μm) and total phosphorus (digested) in wastewater were measured using the ammonium molybdate-antimony potassium tartrate colorimetric method based on US EPA Method 365.3 (Murphy and Riley, 1962). Ammonia was determined using a calibrated ion selective probe following US EPA Method 350.3 (Thomas and Booth, 1973) while nitrate (filtered, 0.45 μm) was measured using ion chromatography following US EPA method 300.0A (Pfaff, 1993). Alkalinity was determined using an acid titration following Standard Methods SM 2320B (Eaton et al., 2005).
Algal Biomass and Pigment Analysis
To characterize the algal portion of the biomass, chlorophyll-a samples were analyzed using a modified US EPA Method 150.1 (EPA, 1991). Samples were vacuum filtered onto glass fiber filters (1 μm) before being extracted using 90% acetone buffered with magnesium carbonate. Samples were extracted in a dark freezer for 48 h prior to analysis using a Hach DR 2700™ spectrophotometer. Samples were acidified and re-analyzed with the spectrophotometer to correct for phaeophytin before calculating chlorophyll-a using equations described in EPA Method 150.1 (EPA, 1991).
To estimate total volatile solids, algal biomass was transferred to pre-weighed aluminum trays and oven-dried (105°C) until a constant mass (>24 h). Volatile solids were calculated as the dry mass change after ignition at 550°C following US EPA Method 340.2 (EPA, 1993).
Prior to the biogas and methane potential (BMP) tests, algal biomass was assayed for total solids (TS), and volatile solids (VS) according to Standard Methods (Eaton et al., 2005). Total lipid content was assessed using the classical Bligh and Dyer method (Bligh and Dyer, 1959). The carbohydrate content was achieved by subtracting the lipid, protein, and ash contents from the total dry weight of the sample (Zhang et al., 2017a). CHN elemental composition of lyophilized algal biomass was determined by Micro Analysis, Inc. (Wilmington, DE) with a %CHN Analyzer.
Results and Discussion
Cultivation and Composition of Filamentous Algal Biomass
Environmental conditions varied during the course of the algal growth period. Daytime light intensity averaged 100 W m−2 h−1 and showed a coefficient of variation of 0.6. Temperature and pH showed periodic daily fluctuations (Figure 2A). The temperature peaked in the afternoons (maximums: 24–31°C) and sagged in the mornings (minimums: 13–23°C). Unlike temperature, pH peaked during nighttime hours after carbon dioxide infusions had ceased (pH < 8). The daily minimum pH values (i.e., 5.7–6.7) were documented in the afternoon after carbon dioxide had been continuously infused for more than 6 h (~14:00). Discharges were adjusted to minimize variation among floways (129 ± 4 cm3 s−1, mean ± 1SD).
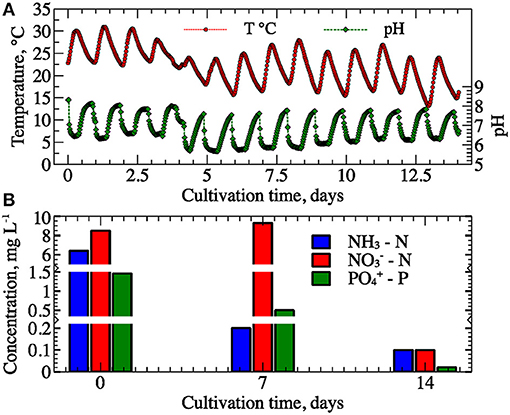
Figure 2. Semi-hourly (A) temperature and pH and daily (B) nutrient concentrations in the filamentous algal treatment systems sumps.
Thick mats of green algae, dominated by filaments of Ulothrix and Oedogonium, developed during the 2-week growing period. Benthic diatoms were also present. Periphyton productivity ranged from 1.06 to 4.22 g VS m−2 d−1. Daily algal productivity increased 62% from day 7 to 14 (paired t-test, p < 0.001) and averaged 3.7 ± 0.4 g VS m−2 d−1 during the experimental period. Final chlorophyll-a (corrected) in the floways ranged from 120 to 285 mg m−2. Daily chlorophyll-a (corrected) productivity averaged 16.3 ± 0.4 mg m−2 d−1. The metabolic activity of the de novo assembled polyculture of filamentous algae was likely responsible for the near-complete removal of nutrients from the wastewater (Figure 2B). Removal rates of phosphate (0.033 g m−2 d−1), nitrate (0.19 g m−2 d−1), and ammonia (0.14 g m−2 d−1) were low given the relatively low initial concentrations of the floways. These nutrient removal rates were comparable to the values reported for algal turf scrubber® systems (Bohutskyi et al., 2016a), but lower than the values observed in high rate algal ponds (Park and Craggs, 2010; Gutiérrez et al., 2016) and vertical-algal-biofilm enhanced raceway ponds (Zhang et al., 2018c). In the initial portion of the experiment, nitrate concentrations increased while ammonia concentrations declined. This pattern suggests that the biofilm supported nitrifying bacteria. Similar evidence for nitrification and potentially denitrification processes have been reported for biofilm and planktonic algal-bacteria communities assembled during wastewater treatment (Bohutskyi et al., 2015b, 2018b; Zhang et al., 2018b).
The biomass productivity observed in this study was lower than the productivities reported for high-rate algal ponds (HRAP) or for algal turf scrubbers™ (ATS). Mean planktonic algal productivities in HRAPs have been reported to be 30–54 during winter and 150–200 mg Chl-a m−2 d−1 during summer (Sutherland et al., 2014). Productivity measured as volatile solids has been reported to be 15–25 g biomass VS m−2 d−1 (Park and Craggs, 2010; Gutiérrez et al., 2016). Biomass productivities observed in ATS populated by periphytic algal communities varies widely, ranging from 1 to 20 g VS m−2 d−1 (Kebede-Westhead et al., 2006; Mulbry et al., 2008; Bohutskyi et al., 2016a), and observed productivities are strongly regulated by nitrogen and phosphorus loading rates (Craggs et al., 1996b; Kebede-Westhead et al., 2006; Mulbry et al., 2008). The lower biomass productivity observed in this study may be partially explained by the fact that the experiments were started de novo and, thus, had no previously established algae to support prolific production of biomass. Additionally, the high productivities observed in previous studies were obtained in single pass ATS that processed wastewater containing elevated concentrations of nitrogen and phosphorus (Craggs et al., 1996a,b). In this study, the recirculating ATS was operated as a batch reactor where nutrient concentrations declined over time, providing >98.5% removal of nitrogen and phosphorus (Figure 2B). Indeed, similar biomass productivities have been reported when using comparable nutrient loads in previous investigations (Keller and Husted, 2015).
The biochemical composition of harvested algal biomass and sewage sludge (SS) showed relatively low variability among samples (Table 1). These results suggest that there existed high stability and consistency of the periphyton community composition. Volatile solids (i.e., organic fraction) represented more than 90% of the dry mass, indicating that the periphyton has high potential for conversion into biofuels or bioproducts. The ~8% ash content is considerably lower than the >30% ash content reported for periphyton biomass cultivated in a filamentous algal treatment system dominated by Rhizoclonium and Cladophora (Ehimen et al., 2013; Bohutskyi et al., 2016a). While carbohydrates were not measured directly, they likely represented the major biochemical constituent in the periphyton biomass (~40%). If true, anaerobic digestion appears to represent a viable option for the conversion of this low-cost wastewater-grown algae into bio-methane. In contrast, crude lipids composed <20% of the dry mass, and thus this biomass had low applicability as a feedstock for biodiesel production.
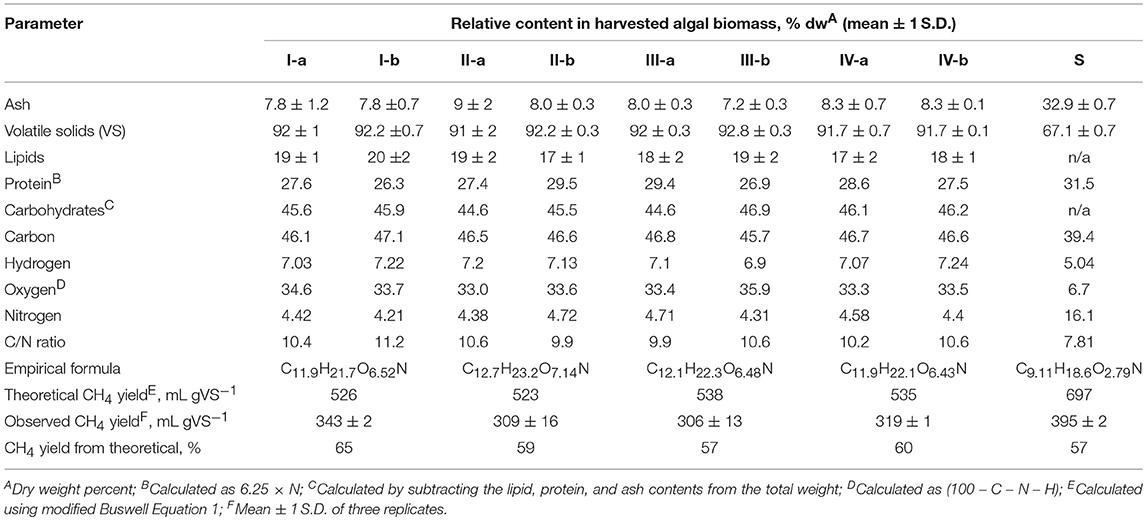
Table 1. Biochemical composition of filamentous algal biomass (I-IV) and sewage sludge (S), and its effect on theoretical and observed ultimate methane yields from biomass as mono-substrates.
Biodegradability and Methane Yield From Filamentous Algal Biomass and Sewage Sludge as Single-Substrates
To evaluate digestibility, algal biomass from different floways was assessed for biogas and methane production (Figure 3). The consistent composition of the biomass resulted in relatively similar ultimate biogas and methane yields among samples. Yields varied only ~12% with maximum values of 559 ± 8 and 343 ± 2 mL gVS−1 for biogas and methane yield, respectively. More than 85% of the gas produced was generated during the first 20 days of incubation and reflected the high biodegradability of the harvested algae. Indeed, the yields observed in this study are significantly higher than the methane yield of about 160–200 mL gVS−1 reported earlier for periphyton biomass, represented mostly by green filamentous alga Rhizoclonium (Ehimen et al., 2013), Hydrodictyon reticulatum (Lee et al., 2014) or polyculture of Cladophora sp., Rhizoclonium sp., Melosira sp., Hydrodictyon sp., and Spirogyra sp. (Bohutskyi et al., 2016a). However, similarly high methane yields (350–480 mL gVS−1) have been reported for batch anaerobic digestion of mix of Ulva, Cladophora, and Chaetomorpha (Hansson, 1983). It appears that the algal species diversity and their associated biochemical composition strongly influence biomass biodegradability and methane production, which can vary more than 2-fold.
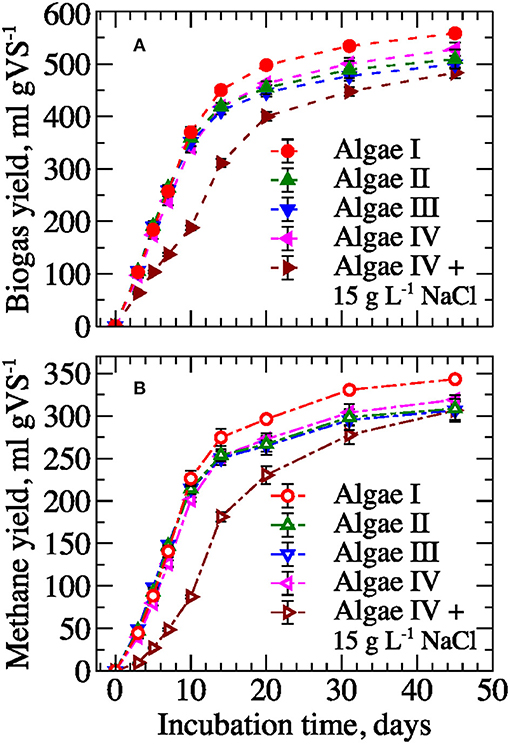
Figure 3. Specific biogas (A) and methane (B) yields from filamentous algal biomass (mean ± 1 S.D. of three replicates).
Observed methane yields ranged from 57 to 65% of their theoretical maximums (Table 1), with the highest yield for sample I. The superior biodegradability of this sample may be related to its slightly higher lipid and lower protein contents. This result is consistent with earlier studies showing that lipids have a high energy density, and their digestion yields more methane compared to proteins or carbohydrates (Bohutskyi and Bouwer, 2013; Bohutskyi et al., 2015a, 2016a). Other studies have confirmed that proteins contribute to the recalcitrant fraction in complex biomass (Bougrier et al., 2007; Park and Li, 2012). The fact that nearly 40% of algal biomass is not bioprocessed into methane (theoretical vs. observed yields) indicates that pretreatment of the biomass has the potential to improve gas production during anaerobic digestion.
Pretreatment of Filamentous Algal Biomass to Improve Methane Yield
While initial AD tests indicated that this wastewater-grown filamentous algae biomass was well-suited for anaerobic digestion, the methane production was still limited to ~60% of its theoretical maximum. Therefore, various biomass pretreatment methods including thermal, dilute acid, dilute alkali, combined acid and thermal, and combined alkali and thermal were assessed for their potential to enhance methane ultimate yield and production rate.
Dilute acid pretreatment resulted in no statistically significant change in ultimate gas yield (~5% increase after 45 days of digestion, Figure 4). In contrast, biomass pretreatment with dilute alkali improved ultimate gas yield by about 17%. Comparable improvement of nearly 15% was observed after thermal pretreatment without chemicals. However, combined thermal and chemical pretreatments showed the greatest boost in methane yields−23 and 27% for acid and alkali, respectively.
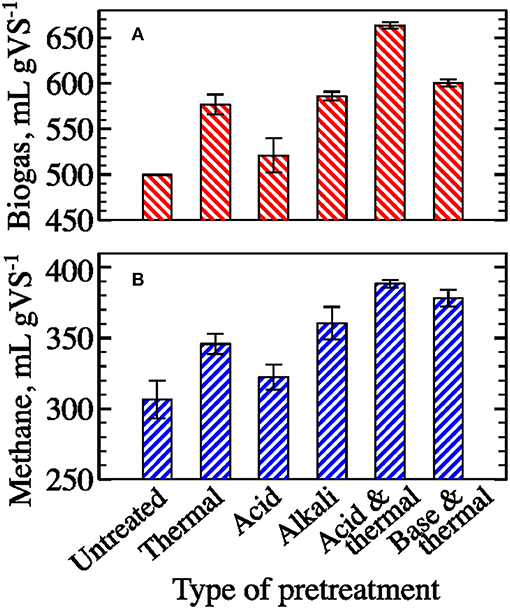
Figure 4. Effect of pretreatment on ultimate specific biogas (A) and methane (B) yields from filamentous algal biomass (mean ± 1 S.D. of three replicates).
To quantify the effect of pretreatment methane and biogas production rates as well as to identify the most appropriate kinetic model, the biogas and methane data were fit using 1st-order rate, pseudo-parallel 1st-order rate, modified Gompertz, and transference function models (Figure 5 and Figure S1, respectively). While all assessed methane and biogas production models demonstrated strong agreement with experimental data for untreated biomass (R2 > 0.981 for all), the modified Gompertz model provided a slightly better fit for biogas production across pretreatments (R2 > 0.988 for all). Kinetic coefficients for all assayed models are summarized in Table 2. Based on the best performing Gompertz model, the thermochemical pretreatment with acid had the strongest favorable effect on methane production rate by boosting the specific rate constant by almost 50%. However, both thermochemical pretreatments delayed the onset of biogas and methane production (from 0.8 to >6 days according to the modified Gompertz model, Table 2). Relative to the untreated control, all types of pretreatment led to increased gas yield after day 31 of incubation; however, the initial gas production (during the first 15 days) dropped by 20–80% for all pretreatments except thermal (Figure 6).
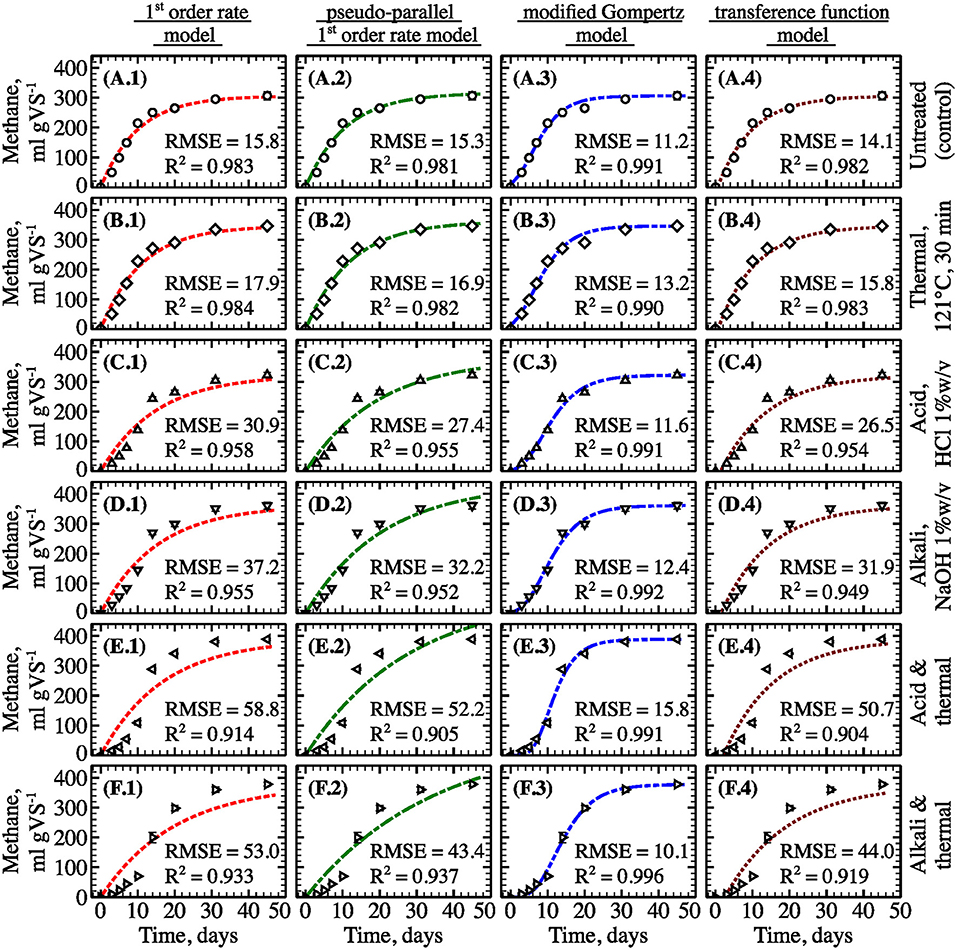
Figure 5. Experimental and predicted specific methane yield from untreated filamentous algal biomass (A) and biomass pretreated using thermal (B), acid (C), alkali (D), thermochemical with acid (E) and thermochemical with alkali (F) methods (points—experimental data; lines—model fit, type of the model is specified on top; pretreatment conditions are specified on the right; error bars represent 1 S.D. for three replicates).
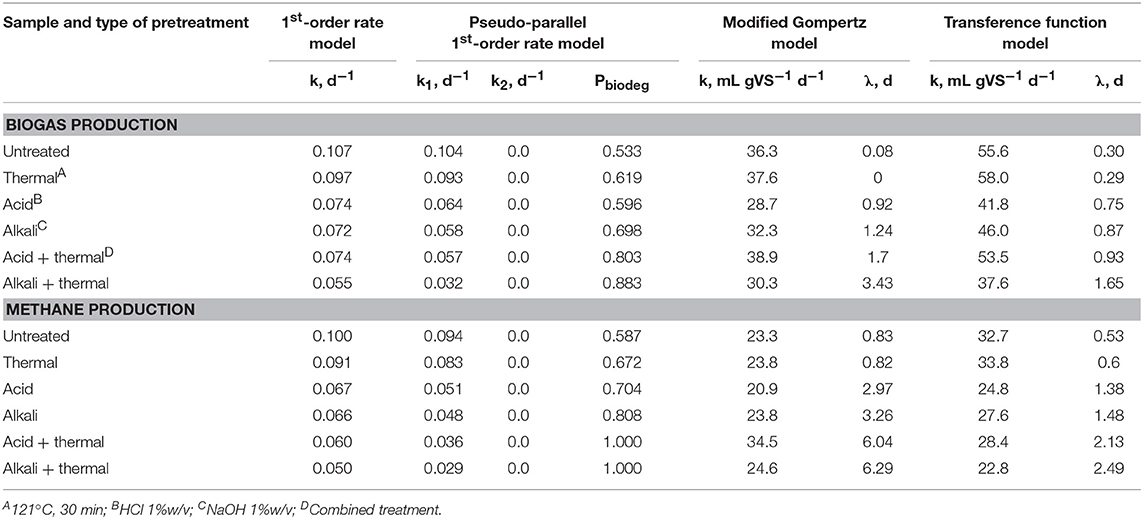
Table 2. Effect of algae pretreatment on biogas and methane production kinetic parameters.
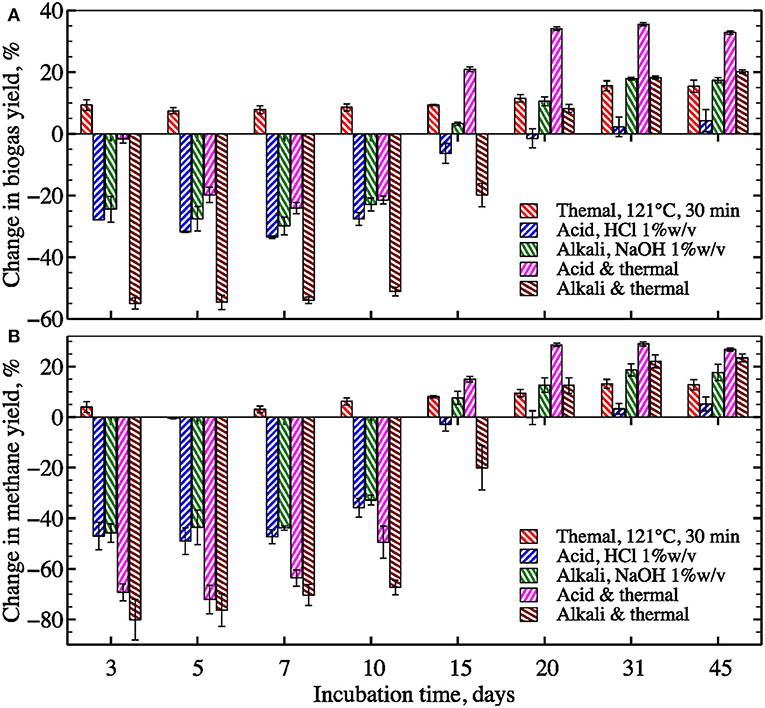
Figure 6. Impact of pretreatment on biogas (A) and methane (B) yields compared to untreated algae at different incubation periods (error bars 1 S.D. for three replicates).
The lag-phase (i.e., delay in gas production) was nearly two times longer for methane compared to biogas production (Table 2; Figure 6). Methanogenic archaea are typically found to be the most sensitive members of the anaerobic microbial community involved in the AD process (Garcia et al., 2000; Hori et al., 2006). Also, biomass treated with alkali and alkali-assisted thermal pretreatments showed longer lag-phase or greater inhibition than acid and acid-assisted thermal pretreatments, respectively. Sodium cations could be responsible for the observed time delays. The concentration of Na+ (~0.25 M) added into the alkali pretreated samples was ~20% higher than the Na+ added to the acid pretreated samples for pH neutralization (~0.2 M). Similar Na+ concentrations have been reported to inhibit methanogenic ruminal and AD cultures (Zhou et al., 2011; Zhang et al., 2017b). In addition, comparable inhibition in gas production was also observed in the control sample supplied with 15 g L−1 of NaCl or ~0.25 M of Na+ (see Figure 3), which provided additional evidence supporting the hypothesis that Na+ was responsible for methanogenesis inhibition. Sodium inhibition can be addressed through adaptation of the methanogenic community to high Na+ content or through an application of alternative alkali reagents such as KOH, Ca(OH)2, and Mg(OH)2. However, a systematic investigation would be required to identify the optimal alkali type and pretreatment conditions, since they have been reported to be substrate- and reagent-specific (Neyens, 2003; Monlau et al., 2012; Zhang et al., 2018a).
Sodium toxicity cannot be the only explanation for the methane inhibition observed in these experiments because the lag-phase after thermochemical pretreatment with NaOH was nearly 2-fold longer than the NaOH-treated samples without thermal pretreatment. One additional contributing factor could be that the inhibition of methanogens by pretreatment generated fatty acids that cause a reduction in pH. Short and long chain fatty acids, as well as soluble proteins and sugars (that can be promptly fermented to fatty acids by acidogenic anaerobic bacteria), are abundant products of biomass thermochemical hydrolysis (Samson and Leduy, 1983; Wilson and Novak, 2009; Fdez.-Güelfo et al., 2011). In addition, high temperature can promote conversion of readily biodegradable compounds into refractory and even toxic products, but this transformation only becomes significant at temperatures above 175°C (Stuckey and Mccarty, 1984).
Co-digestion Algal Biomass With Sewage Sludge
To evaluate the efficacy of co-digestion as an alternative to pretreatments for improving AD processes, biogas and methane yields were measured for samples of algal biomass mixed with different proportions of sewage sludge (Figure 7). Compared to filamentous algae, sewage sludge has a higher energy density and theoretical and observed methane production when digested as a single-substrate (Table 1). Sludge addition boosted biogas and methane production when mixed with filamentous algae biomass. Final gas yields increased concomitantly with increasing sewage sludge fraction and peaked at a ratio of A20%:S80% (i.e., 617 ± 2 mL biogas per gVS−1 and 401 ± 3 mL methane per gVS−1). The maximum yield at A20%:S80% mix indicates the presence of synergistic effects on gas production from co-digestion of algal biomass with sewage sludge (Figure 8). Interestingly, the mixtures containing 50–20% of algae with 50–80% of sewage sludge showed the greatest synergy during the initial period of fermentation (i.e., 3–10 days). In contrast, the mixtures of 90–80% of algae with 10–20% of sewage sludge had negative synergies during the first week. However, the synergy values equalized after ~15 days of digestion to 7–12% for biogas and to 3–8% for methane for all algae-to-sewage sludge ratios. These results are consistent with other published studies that have reported relatively small improvements in methane production associated with co-digestion of algal biomass with food waste or cellulose (Zhen et al., 2016; Bohutskyi et al., 2018a). Mixing algae with sludge in the AD slightly elevated the carbon-to-nitrogen ratio (C/N) and somewhat shifted it toward the optimal C/N ratios of 20–30 (Yen and Brune, 2007; Calicioglu and Demirer, 2017). While an improvement in the C/N ratio may have contributed to the observed synergy in gas production (Figures 7, 8), this shift in C/N was likely too minor to explain the synergies measured. Characterizing the fundamental mechanisms that cause synergistic effects of co-digestion is an important avenue of future research.
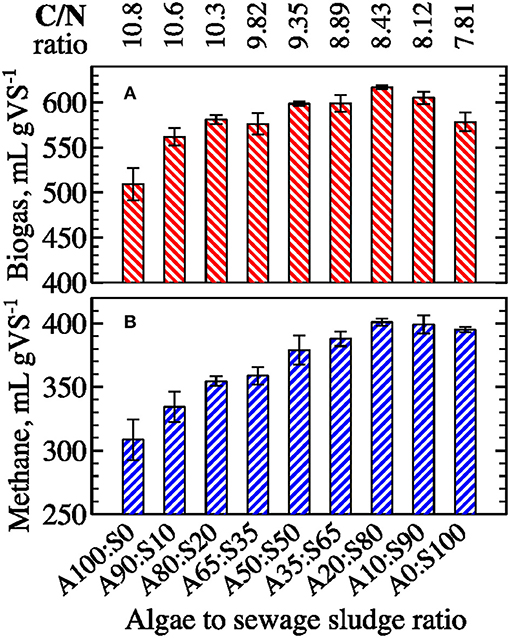
Figure 7. Effect of algal co-digestion with sewage sludge (percent of Algae to percent of Sludge in the mixture) on ultimate specific biogas (A) and methane (B) yields (error bars represent 1 S.D. for three replicates).
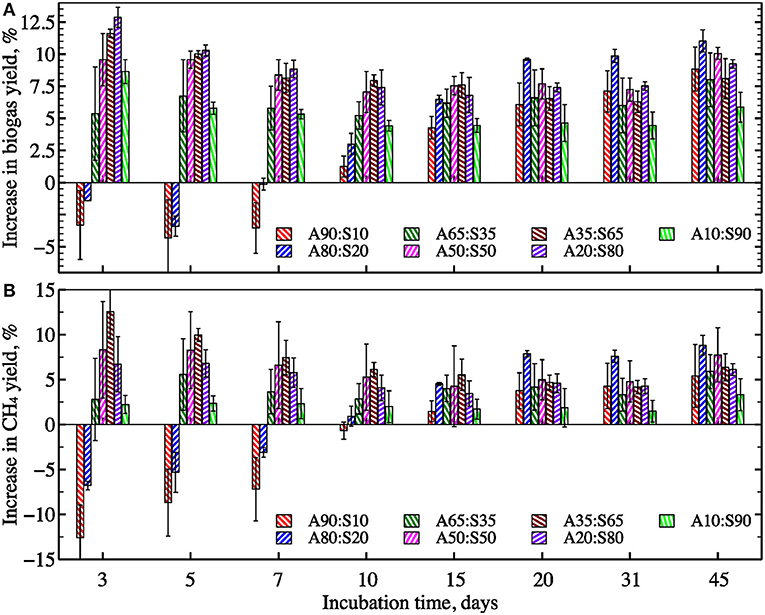
Figure 8. The average synergy effect on biogas (A) and methane (B) yields from algae co-digested at different VS ratios with sewage sludge (see Equation 8) (error bars represent 1 S.D. for three replicates).
To identify the most appropriate kinetics model, methane and biogas production over time were analyzed using the four models described previously (Figure 9 and Figure S2). In general, all models showed a relatively tight fit to the observed data (R2 ≥ 0.941 for all). The modified Gompertz model provided a slightly better fit for samples with a high fraction of algal biomass (e.g., 80–100%). In contrast, the other models described experimental data better for sewage sludge as single-substrate and samples with fractions of algae from 10 to 50%. The kinetic coefficients for all assayed models are summarized in Table 3. Generally, models showed that gas production rate constants increased concomitantly with increasing sewage sludge fraction in the feedstock mixture. However, based on the pseudo-parallel 1st-order rate model estimation, the biodegradable fraction reached a maximum value at A80%:S20%, indicating that co-digestion improved biomass biodegradation in the mix. This result could be partially explained by the increased diversity and enhanced enzymatic machinery of the AD microbial community. These microbes may best utilize the complex substrates associated with the combination of algae and sludge biomass. Indeed, studies have demonstrated a strong connection between the substrate composition, matrix complexity, C/N ratio, and microbial community structure and lytic activity (Hernández and Hobbie, 2010; Regueiro et al., 2012; Ziganshin et al., 2013;Li et al., 2015).
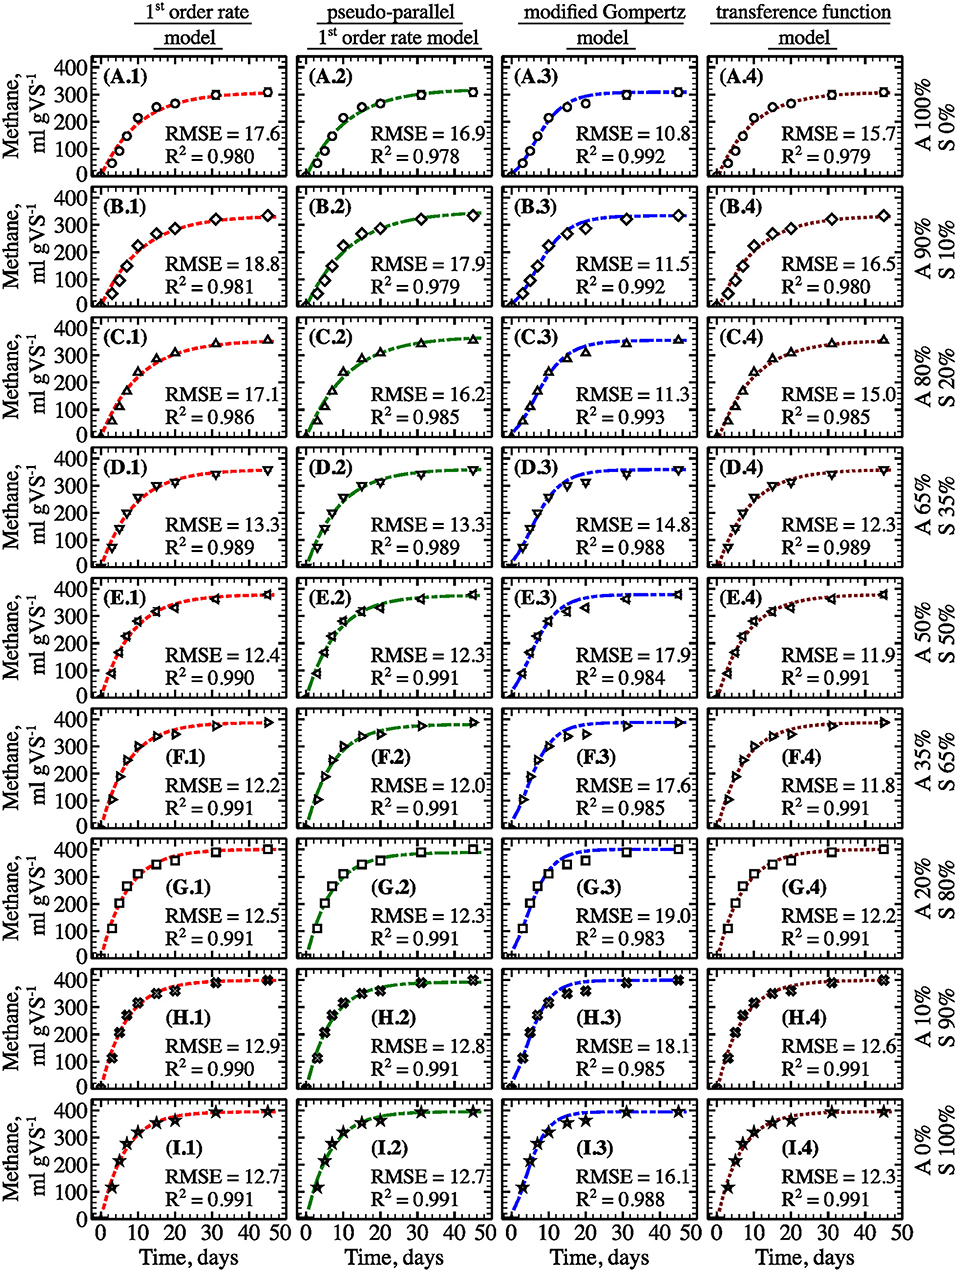
Figure 9. Experimental and predicted specific methane yield from filamentous algal biomass as a single-substrate (A), algae co-digested in different ratios with sewage sludge (B–H) and sewage sludge as a single-substrate (I) (points—experimental data; lines—model fit, type of the model is specified on top; algae (“A”) to sewage sludge (“S”) ratio are shown on the right; error bars represent 1 S.D. for three replicates).
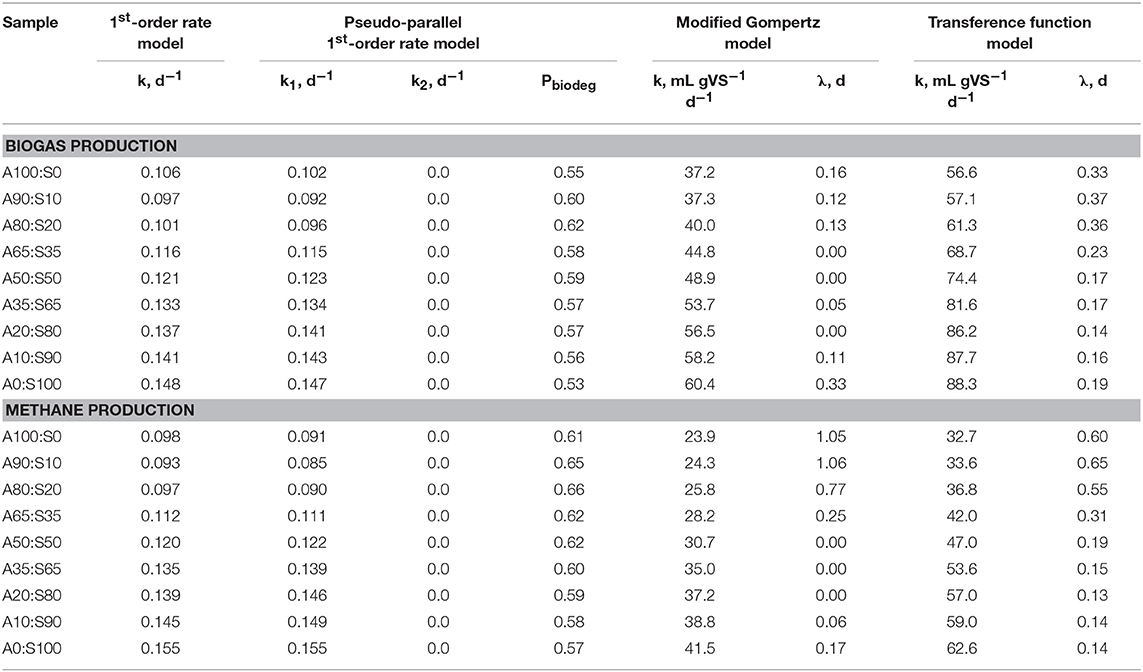
Table 3. Effect of algae co-digestion with sewage sludge on biogas and methane production kinetic parameters.
Effect of Pretreatment vs. Co-digestion on AD System Energy Balance
While pretreatment and co-digestion enhanced ultimate methane yields, their implementation requires additional energy inputs for AD system operation. The magnitude of this additional energy requirement could exceed the relatively moderate gain in energy production due to the enhanced methane yields. Thus, to more fully compare pretreatment and co-digestion, these options were evaluated in terms of their effect on the energy balance parameters assuming an operational scale AD system that processes 25 wet metric tons per day of wastewater-grown filamentous algal biomass (other major parameters of assessed AD system are shown in Table S3).
Effect of Algae Pretreatment on Energy Balance
Generally speaking, all algal pretreatment techniques impaired energy balance (Figure 10). The heat energy output increased slightly only for alkali-pretreated algal biomass (up to 10%) at long HRTs above 30 days (Figure 10A.1). All other pretreatments resulted in reduced heat energy outputs compared to untreated algae. These results can be attributed to the high heat requirements for thermal pretreatments and the negative effects of thermochemical pretreatments on methane yield during the initial 20 days of fermentation (Figure 6). The highest electrical energy output was observed for thermally pretreated biomass that showed a 5–10% improvement over the untreated algal biomass controls (Figure 10A.2). In contrast, chemical and thermochemical treatments reduced electrical energy output by up to 20–50%. Such dramatic reductions were caused by the high amount of electrical energy required for the production of alkali and acid using industrial electrolysis (Worrell et al., 2000; Scheme, 2010). The trends for total energy output (i.e., combined heat and electricity, Figure 10A.3) were somewhat consistent with the results for heat energy. However, none of the pretreatments tested improved total energy output compared to untreated algal biomass despite improvements in ultimate methane production (Figure 4). Similar findings were observed for volume-specific (Figure 10B) and mass-specific (Figure 10C) energy outputs. All pretreatment strategies caused a reduction in specific energy outputs compared to untreated biomass. Total volume- and mass-specific energy outputs from untreated algae reached maximum values of 0.25 MW m−3 at an HRT of 10 days (Figure 10B.3) and 1.5 MW ton VS−1 at an HRT of 45 days (Figure 10C.3), respectively. The highest energy outputs from pretreated algae were only 0.16 MW m−3 (thermal and alkali treatment, HRT 14 days) and 1.3–1.45 MW ton VS−1 (same, HRT 45 days).
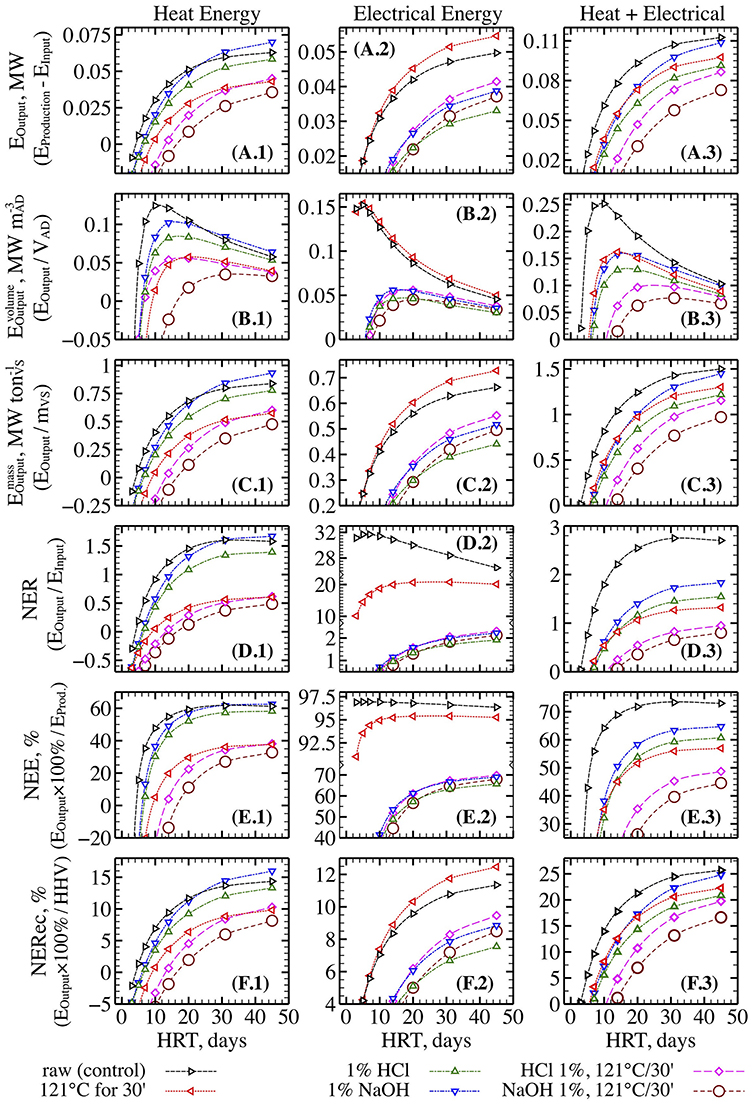
Figure 10. Effect of different types of pretreatment on AD system energy balance parameters including energy output (A), reactor volume-specific energy output (B), feedstock mass-specific energy output (C), Net Energy Ratio (D), Net Energy Efficiency (E), and Net Energy Recovery (F) (heat energy left panels, electrical energy central panels, and combined heat and electrical energy right panels).
The highest Net Energy Ratio (NER) and Net Energy Efficiency (NEE) for combined heat and electricity were observed for untreated algal biomass, which achieved maximum values of 2.8 and 73% at HRT of 45 days, respectively (Figures 10D.3,E.3). NER and NEE for thermally and chemically pretreated biomass were under 1.8 and 65%, respectively. Moreover, NER for thermochemically pretreated biomass dropped below 1. Similarly, the highest NERec of up to 26% was observed for untreated algae compared to 25% for alkali treatment, 22% for thermal, and 20% or less for other methods. It is worth noting that these estimates indicate that only about a quarter of energy in the algal biomass higher heating value (HHV) was recovered as usable heat and electricity in the best-case scenario.
Effect of Co-digestion With Sewage Sludge on Energy Balance
The energy balance modeled for an AD system processing filamentous algal biomass co-digested with sewage sludge is shown in Figure 11. The algal biomass, as a sole substrate, was found to be less advantageous than sewage sludge (SS) alone. Sludge is substantially richer energetically than algae, with theoretical and observed methane yields (~30% higher, Table 1). As a consequence, the total energy and volume-specific/mass-specific energy outputs from SS as a single-substrate were nearly 1.5- to 2-fold greater than from algae as a single-substrate (Figures 11A–C). This finding is true even though the same amount of biomass was fed into the AD system in terms of volatile solids (VS). Co-digestion of algal biomass with sewage sludge boosted the total energy output from 0.11 MW (algae only) up to 1.7 MW at algae-to-SS ratios of 10% to 90%. However, in this case, the fixed amount of algal biomass was complemented with an increasing amount of sludge in order to raise the sludge fraction in the mix from 0 to 90%. Therefore, the gain in energy output was mostly due to the addition of more substrate into the digester. In contrast, the volume-specific energy output reached 0.53 MW m−3 when SS was 80% of the mix and remained nearly constant when the sludge fraction was increased to 90% (0.54 MW m−3) and 100% SS (0.56 MW m−3, Figure 11B). Moreover, the mass-specific energy outputs at 80 and 90% SS were slightly higher than the output from digestion of 100% SS (Figure 11C). The favorable effects of co-digestion were even more prominent on NER and NEE, with highest values of 4.3 and 81%, respectively, observed at algae-to-sludge ratios of 20%:80% and 10%:90% (Figures 11D,E). At these ratios, the NERec reached ~39%, which compares favorably to digesting SS as a single-substrate (33%, Figure 11F).
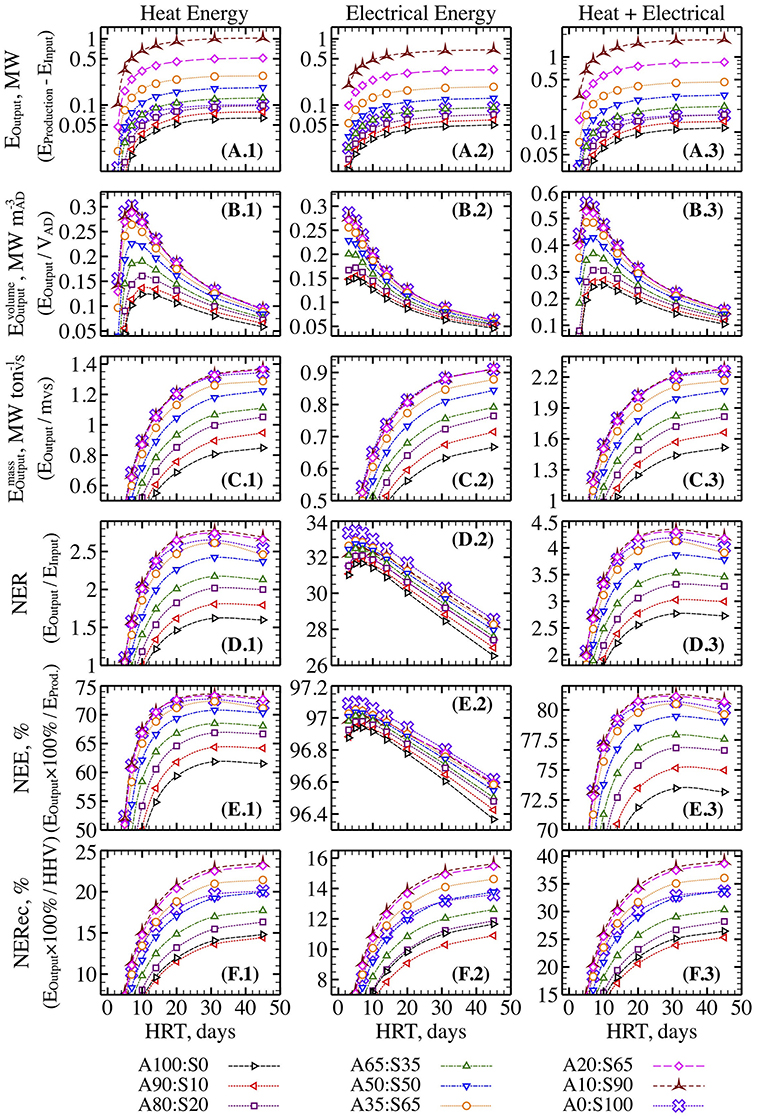
Figure 11. (A–F) Effect of algae to sewage sludge co-digestion ratio on AD system energy balance.
The data presented in Figures 10, 11 underscore the importance of energy balance analysis when comparing approaches for biomass pretreatment and co-digestion. A similar conclusion on the significance of energetic and economic evaluation of pretreatment technologies was reported for lignocellulosic biomass (Croce et al., 2016). While pretreatment methods enhanced ultimate methane yields by 5–27% (Figure 4), they had negative effects on AD system energy balance parameters. Such unexpected results may be explained in part by the following factors. First, the application of thermal pretreatment and chemicals, such as NaOH and HCl, substantially increase the energy input required for operation of the AD system. These energy requirements are the result of a direct demand for heat energy and for indirect energy required for the production of the pretreatment reagents. Both NaOH and HCl are typically synthesized industrially using energy-intensive brine electrolysis (Worrell et al., 2000; Scheme, 2010). Second, reagents, such as sodium, can cause inhibition of methanogenesis and extend the lag-phase in methane production (Figure 3). Finally, the methane yield from untreated algal biomass (300–340 mL gVS−1) observed in this study is higher than the yields reported for wastewater-grown algal biomass (130–250 mL gVS−1) in other studies (Kinnunen et al., 2014; Passos et al., 2014; Wang and Park, 2015; Bohutskyi et al., 2016a). Pretreatment of poorly biodegradable algal biomass typically leads to a 60–70% gain in methane production (Passos et al., 2013, 2014, 2015) and, therefore, may result in larger relative improvements in energy balance parameters. On the other hand, the examination of the energy balance demonstrates how relatively small synergistic effects observed for methane yield as the result of co-digestion (Figure 7) are translated into relatively substantial advancement of the AD system energy efficiency parameters.
Counterintuitively, the addition of less energy-dense algal biomass to sewage sludge did not compromise energy production and other energy balance parameters, rather it led to enhanced Net Energy Ratio, Efficiency, and Recovery in a scaled AD system. These findings highlight that co-digestion may be a more advantageous approach than chemical, thermal or thermochemical pretreatments for improving AD system energy balance when processing relatively biodegradable biomass.
Conclusions
Natural polycultures of benthic algae can be utilized to remove wastewater nutrients and their resulting biomass can serve as an affordable feedstock for bioenergy. While biomass pretreatment methods and co-digestion are often suggested as an effective means for improving algal biodegradation for enhanced bio-methane production, they should be applied with caution due to their high requirement for additional energy inputs. The current study demonstrates the importance of evaluating the energetic ramifications of pretreatment biomass prior to anaerobic digestion. The results show that in some cases thermal, chemical, and thermochemical pretreatments may have either negative or no effects on energy balance despite enhancing the ultimate methane production from algal biomass. In contrast, co-digestion of algal biomass with sewage sludge (or other waste biomass) merits additional attention as a potentially viable method for improving the methane yields from algal biomass anaerobic digestion. Synergistic effects from co-digestion on methane production can lead to relatively small improvements in ultimate methane production but still result in substantially improved energy balance parameters when modeled for full-scale anaerobic digestion systems.
Author Contributions
PB and TK obtained funding, developed the concepts, and designed the experiments. TK, DP, MP, ML, and LR collected and assembled the data. PB, TK, and AK analyzed and interpreted the data. PB and TK drafted and revised the article to improve its important intellectual content.
Funding
US EPA P3 grant (EPA-SU-83571101) provided funding for growing filamentous algae in wastewater. William Kent, Manager of Environmental Services at Columbus Water Works, Inc., provided logistical support for our research activities, analysis of water samples, and access to wastewater. The manuscript preparation was supported by the U.S. DOE under Contract No. DE-AC05-76L01830 at the Pacific Northwest National Laboratory and by the Office of Energy Efficiency and Renewable Energy through the Bioenergy Technologies (BETO) sponsored analysis research at PNNL. While the presented research has been supported by the United States Government or any agency thereof, the views and opinions of the authors expressed herein do not necessarily state or reflect those of the United States Government or any agency thereof. Neither the United States Government nor any agency thereof, nor any of their employees, makes any warranty, expressed or implied, or assumes any legal liability or responsibility for the accuracy, completeness, or usefulness of any information, apparatus, product, or process disclosed, or represents that its use would not infringe privately owned rights.
Conflict of Interest Statement
The authors declare that the research was conducted in the absence of any commercial or financial relationships that could be construed as a potential conflict of interest.
Supplementary Material
The Supplementary Material for this article can be found online at: https://www.frontiersin.org/articles/10.3389/fenrg.2019.00047/full#supplementary-material
References
Adey, W. H., Kangas, P. C., and Mulbry, W. (2011). Algal turf scrubbing: cleaning surface waters with solar energy while producing a biofuel. Bioscience 61, 434–441. doi: 10.1525/bio.2011.61.6.5
Bligh, E. G., and Dyer, W. J. (1959). A rapid method of total lipid extraction and purification. Can. J. Biochem. Physiol. 37, 911–917. doi: 10.1139/y59-099
Bohutskyi, P., Betenbaugh, M. J., and Bouwer, E. J. (2014). The effects of alternative pretreatment strategies on anaerobic digestion and methane production from different algal strains. Bioresour. Technol. 155, 366–372. doi: 10.1016/j.biortech.2013.12.095
Bohutskyi, P., and Bouwer, E. (2013). “Biogas production from algae and cyanobacteria through anaerobic digestion: a review, analysis, and research needs,” in Advanced Biofuels and Bioproducts, ed J. W. Lee (New York, NY: Springer), 873–975. doi: 10.1007/978-1-4614-3348-4_36
Bohutskyi, P., Chow, S., Ketter, B., Fung Shek, C., Yacar, D., Tang, Y., et al. (2016a). Phytoremediation of agriculture runoff by filamentous algae poly-culture for biomethane production, and nutrient recovery for secondary cultivation of lipid generating microalgae. Bioresour. Technol. 222, 294–308. doi: 10.1016/j.biortech.2016.10.013
Bohutskyi, P., Ketter, B., Chow, S., Adams, K. J., Betenbaugh, M. J., Allnutt, F. C. T., et al. (2015a). Anaerobic digestion of lipid-extracted Auxenochlorella protothecoides biomass for methane generation and nutrient recovery. Bioresour. Technol. 183, 229–239. doi: 10.1016/j.biortech.2015.02.012
Bohutskyi, P., Kligerman, D. C., Byers, N., Nasr, L. K., Cua, C., Chow, S., et al. (2016b). Effects of inoculum size, light intensity, and dose of anaerobic digestion centrate on growth and productivity of Chlorella and Scenedesmus microalgae and their poly-culture in primary and secondary wastewater. Algal Res. 19, 278–290. doi: 10.1016/j.algal.2016.09.010
Bohutskyi, P., Liu, K., Nasr, L. K., Byers, N., Rosenberg, J. N., Oyler, G. A., et al. (2015b). Bioprospecting of microalgae for integrated biomass production and phytoremediation of unsterilized wastewater and anaerobic digestion centrate. Appl. Microbiol. Biotechnol. 99, 6139–6154. doi: 10.1007/s00253-015-6603-4
Bohutskyi, P., Phan, D., Kopachevsky, A. M., Chow, S., Bouwer, E. J., and Betenbaugh, M. J. (2018a). Synergistic co-digestion of wastewater grown algae-bacteria polyculture biomass and cellulose to optimize carbon-to-nitrogen ratio and application of kinetic models to predict anaerobic digestion energy balance. Bioresour. Technol. 269, 210–220. doi: 10.1016/j.biortech.2018.08.085
Bohutskyi, P., Phan, D., Spierling, R. E., Kopachevsky, A. M., Bouwer, E. J., Lundquist, T. J., et al. (2019). Production of lipid-containing algal-bacterial polyculture in wastewater and biomethanation of lipid extracted residues: enhancing methane yield through hydrothermal pretreatment and relieving solvent toxicity through co-digestion. Sci. Total Environ. 653, 1377–1394. doi: 10.1016/j.scitotenv.2018.11.026
Bohutskyi, P., Spierling, R. E., Phan, D., Kopachevsky, A. M., Tang, Y., Betenbaugh, M. J., et al. (2018b). Bioenergy from wastewater resources: nutrient removal, productivity and settleability of indigenous algal-bacteria polyculture, and effect of biomass composition variability on methane production kinetics and anaerobic digestion energy balance. Algal Res. 36, 217–228. doi: 10.1016/j.algal.2018.10.020
Bougrier, C., Delgenès, J. P., and Carrère, H. (2007). Impacts of thermal pre-treatments on the semi-continuous anaerobic digestion of waste activated sludge. Biochem. Eng. J. 34, 20–27. doi: 10.1016/j.bej.2006.11.013
Buswell, A. M., and Mueller, H. F. (1952). Mechanism of methane fermentation. Ind. Eng. Chem. 44, 550–552. doi: 10.1021/ie50507a033
Calicioglu, O., and Demirer, G. N. (2017). Carbon-to-nitrogen and substrate-to-inoculum ratio adjustments can improve co-digestion performance of microalgal biomass obtained from domestic wastewater treatment. Environ. Technol. 40, 614–624. doi: 10.1080/09593330.2017.1398784
Carey, R. O., and Migliaccio, K. W. (2009). Contribution of wastewater treatment plant effluents to nutrient dynamics in aquatic systems: a review. Environ. Manag. 44, 205–217. doi: 10.1007/s00267-009-9309-5
Craggs, R. J., Adey, W. H., Jenson, K. R., Stjohn, M. S., Green, F. B., and Oswald, W. J. (1996a). Phosphorus removal from wastewater using an algal turf scrubber. Water Sci. Technol. 33, 191–198. doi: 10.2166/wst.1996.0138
Craggs, R. J., Adey, W. H., Jessup, B. K., and Oswald, W. J. (1996b). A controlled stream mesocosm for tertiary treatment of sewage. Ecol. Eng. 6, 149–169. doi: 10.1016/0925-8574(95)00056-9
Croce, S., Wei, Q., D'imporzano, G., Dong, R., and Adani, F. (2016). Anaerobic digestion of straw and corn stover: the effect of biological process optimization and pre-treatment on total bio-methane yield and energy performance. Biotechnol. Adv. 34, 1289–1304. doi: 10.1016/j.biotechadv.2016.09.004
Dodds, W. K., Bouska, W. W., Eitzmann, J. L., Pilger, T. J., Pitts, K. L., Riley, A. J., et al. (2009). Eutrophication of US freshwaters: analysis of potential economic damages. Environ. Sci. Technol. 43, 12–19. doi: 10.1021/es801217q
Eaton, A. D., Clesceri, L. S., Rice, E. W., and Greenberg, A. E. (2005). Standard Methods for the Examination of Water and Wastewater. Washington, DC: APHA.
Ehimen, E. A., Holm-Nielsen, J. B., Poulsen, M., and Boelsmand, J. E. (2013). Influence of different pre-treatment routes on the anaerobic digestion of a filamentous algae. Renew. Energy 50, 476–480. doi: 10.1016/j.renene.2012.06.064
EPA (1991). ESS Method 150.1: Chlorophyll - Spectrophotometric. Madison, WI: Environmental Sciences Section.
EPA (1993). ESS Method 340.2: Total Suspended Solids, Mass Balance (Dried at 103-105C) Volatile Suspended Solids (Ignited at 550C). Madison, WI: Inorganic Chemistry Unit.
EPA (2018). National Summary of State Information. Available online at: https://ofmpub.epa.gov/waters10/attains_nation_cy.control#total_assessed_waters (accessed July 1, 2018).
Fdez.-Güelfo, L. A., Álvarez-Gallego, C., Sales, D., and Romero, L. I. (2011). The use of thermochemical and biological pretreatments to enhance organic matter hydrolysis and solubilization from organic fraction of municipal solid waste (OFMSW). Chem. Eng. J. 168, 249–254. doi: 10.1016/j.cej.2010.12.074
Fogler, H. S. (2016). “Predicting conversion directly from the residence time distribution,” in Elements of Chemical Reaction Engineering, 5th Edn (Boston, MA: Prentice Hall), 807–844.
Garcia, J.-L., Patel, B. K. C., and Ollivier, B. (2000). Taxonomic, phylogenetic, and ecological diversity of Methanogenic Archaea. Anaerobe 6, 205–226. doi: 10.1006/anae.2000.0345
Gutiérrez, R., Ferrer, I., González-Molina, A., Salvadó, H., García, J., and Uggetti, E. (2016). Microalgae recycling improves biomass recovery from wastewater treatment high rate algal ponds. Water Res. 106, 539–549. doi: 10.1016/j.watres.2016.10.039
Hansson, G. (1983). Methane production from marine, green macro-algae. Resour. Conserv. 8, 185–194. doi: 10.1016/0166-3097(83)90024-X
Heisler, J., Glibert, P. M., Burkholder, J. M., Anderson, D. M., Cochlan, W., Dennison, W. C., et al. (2008). Eutrophication and harmful algal blooms: a scientific consensus. Harmful Algae 8, 3–13. doi: 10.1016/j.hal.2008.08.006
Hernández, D. L., and Hobbie, S. E. (2010). The effects of substrate composition, quantity, and diversity on microbial activity. Plant Soil 335, 397–411. doi: 10.1007/s11104-010-0428-9
Hori, T., Haruta, S., Ueno, Y., Ishii, M., and Igarashi, Y. (2006). Dynamic transition of a methanogenic population in response to the concentration of volatile fatty acids in a thermophilic anaerobic digester. Appl. Environ. Microbiol. 72, 1623–1630. doi: 10.1128/AEM.72.2.1623-1630.2006
Kebede-Westhead, E., Pizarro, C., and Mulbry, W. W. (2006). Treatment of swine manure effluent using freshwater algae: production, nutrient recovery, and elemental composition of algal biomass at four effluent loading rates. J. Appl. Phycol. 18, 41–46. doi: 10.1007/s10811-005-9012-8
Keller, T. A., and Husted, E. M. (2015). Dewatering as a non-toxic control of nuisance midge larvae in algal wastewater treatment floways. Water Sci. Technol. 71, 9–14. doi: 10.2166/wst.2014.442
Kinnunen, V., Craggs, R., and Rintala, J. (2014). Influence of temperature and pretreatments on the anaerobic digestion of wastewater grown microalgae in a laboratory-scale accumulating-volume reactor. Water Res. 57, 247–257. doi: 10.1016/j.watres.2014.03.043
Lee, K., Chantrasakdakul, P., Kim, D., Kong, M., and Park, K. Y. (2014). Ultrasound pretreatment of filamentous algal biomass for enhanced biogas production. Waste Manag. 34, 1035–1040. doi: 10.1016/j.wasman.2013.10.012
Leo, C. P., Chai, W. K., Mohammad, A. W., Qi, Y., Hoedley, A. F. A., and Chai, S. P. (2011). Phosphorus removal using nanofiltration membranes. Water Sci. Technol. 64, 199–205. doi: 10.2166/wst.2011.598
Li, J., Rui, J., Yao, M., Zhang, S., Yan, X., Wang, Y., et al. (2015). Substrate type and free ammonia determine bacterial community structure in full-scale mesophilic anaerobic digesters treating cattle or swine manure. Front. Microbiol. 6:1337. doi: 10.3389/fmicb.2015.01337
Lue-Hing, C. (1998). Municipal Sewage Sludge Management: A Reference Text on Processing, Utilization and Disposal, 2nd Edn. Boca Raton, FL: Taylor & Francis Inc.; CRC Press Inc.
Monlau, F., Barakat, A., Steyer, J. P., and Carrere, H. (2012). Comparison of seven types of thermo-chemical pretreatments on the structural features and anaerobic digestion of sunflower stalks. Bioresour. Technol. 120, 241–247. doi: 10.1016/j.biortech.2012.06.040
Mulbry, W., Kondrad, S., Pizarro, C., and Kebede-Westhead, E. (2008). Treatment of dairy manure effluent using freshwater algae: algal productivity and recovery of manure nutrients using pilot-scale algal turf scrubbers. Bioresour. Technol. 99, 8137–8142. doi: 10.1016/j.biortech.2008.03.073
Murphy, J., and Riley, J. P. (1962). A modified single solution method for the determination of phosphate in natural waters. Anal. Chim. Acta 27, 31–36. doi: 10.1016/S0003-2670(00)88444-5
Naegele, H.-J., Lemmer, A., Oechsner, H., and Jungbluth, T. (2012). Electric energy consumption of the full scale research biogas plant “Unterer Lindenhof”: results of longterm and full detail measurements. Energies 5, 5198–5214. doi: 10.3390/en5125198
Neyens, E. (2003). Alkaline thermal sludge hydrolysis. J. Hazard. Mater. 97, 295–314. doi: 10.1016/S0304-3894(02)00286-8
Owen, W. F., Stuckey, D. C., Healy, J. B., Young, L. Y., and Mccarty, P. L. (1979). Bioassay for monitoring biochemical methane potential and anaerobic toxicity. Water Res. 13, 485–492. doi: 10.1016/0043-1354(79)90043-5
Park, J. B. K., and Craggs, R. J. (2010). Wastewater treatment and algal production in high rate algal ponds with carbon dioxide addition. Water Sci. Technol. 61, 633–639. doi: 10.2166/wst.2010.951
Park, J. B. K., Craggs, R. J., and Shilton, A. N. (2011). Wastewater treatment high rate algal ponds for biofuel production. Bioresour. Technol. 102, 35–42. doi: 10.1016/j.biortech.2010.06.158
Park, S., and Li, Y. (2012). Evaluation of methane production and macronutrient degradation in the anaerobic co-digestion of algae biomass residue and lipid waste. Bioresour. Technol. 111, 42–48. doi: 10.1016/j.biortech.2012.01.160
Passos, F., Carretero, J., and Ferrer, I. (2015). Comparing pretreatment methods for improving microalgae anaerobic digestion: thermal, hydrothermal, microwave and ultrasound. Chem. Eng. J. 279, 667–672. doi: 10.1016/j.cej.2015.05.065
Passos, F., Hernández-Mariné, M., García, J., and Ferrer, I. (2014). Long-term anaerobic digestion of microalgae grown in HRAP for wastewater treatment. Effect of microwave pretreatment. Water Res. 49, 351–359. doi: 10.1016/j.watres.2013.10.013
Passos, F., Solé, M., García, J., and Ferrer, I. (2013). Biogas production from microalgae grown in wastewater: effect of microwave pretreatment. Appl. Energy 108, 168–175. doi: 10.1016/j.apenergy.2013.02.042
Peel, M. C., Finlayson, B. L., and Mcmahon, T. A. (2007). Updated world map of the Köppen-Geiger climate classification. Hydrol. Earth Syst. Sci. 4, 439–473. doi: 10.5194/hessd-4-439-2007
Pennington, M. (2018). Anaerobic Digestion Facilities Processing Food Waste in the United States in 2015. Survey Results. EPA.
Pfaff, J. D. (1993). Determination of Inorganic Anions by Ion Chromatography. Cincinnati, OH: Environmental Monitoring Systems Laboratory, US Environmental Protection Agency.
Prajapati, S. K., Kaushik, P., Malik, A., and Vijay, V. K. (2013). Phycoremediation coupled production of algal biomass, harvesting and anaerobic digestion: possibilities and challenges. Biotechnol. Adv. 31, 1408–1425. doi: 10.1016/j.biotechadv.2013.06.005
Regueiro, L., Veiga, P., Figueroa, M., Alonso-Gutierrez, J., Stams, A. J. M., Lema, J. M., et al. (2012). Relationship between microbial activity and microbial community structure in six full-scale anaerobic digesters. Microbiol. Res. 167, 581–589. doi: 10.1016/j.micres.2012.06.002
Samson, R., and Leduy, A. (1983). Influence of mechanical and thermochemical pretreatments on anaerobic digestion of Spirulina maxima algal biomass. Biotechnol. Lett. 5, 671–676. doi: 10.1007/BF01386360
Scheme, E. E. T. (2010). The European Chlor-Alkali Industry: an Electricity Intensive Sector Exposed to Carbon Leakage. Brussels: Euro Chlor. Available online at: http://www.eurochlor.org/media/9385/3-2-the_european_chlor-alkali_industry_-_an_electricity_intensive_sector_exposed_to_carbon_leakage.pdf (accessed May 10, 2019).
Seiple, T. E., Coleman, A. M., and Skaggs, R. L. (2017). Municipal wastewater sludge as a sustainable bioresource in the United States. J. Environ. Manag. 197, 673–680. doi: 10.1016/j.jenvman.2017.04.032
Stuckey, D. C., and Mccarty, P. L. (1984). The effect of thermal pretreatment on the anaerobic biodegradability and toxicity of waste activated sludge. Water Res. 18, 1343–1353. doi: 10.1016/0043-1354(84)90002-2
Sutherland, D. L., Turnbull, M. H., and Craggs, R. J. (2014). Increased pond depth improves algal productivity and nutrient removal in wastewater treatment high rate algal ponds. Water Res. 53, 271–281. doi: 10.1016/j.watres.2014.01.025
Tang, Y., Rosenberg, J. N., Bohutskyi, P., Yu, G., Betenbaugh, M. J., and Wang, F. (2015). Microalgae as a feedstock for biofuel precursors and value-added products: green fuels and golden opportunities. Bio Resour. 11, 2850–2885. doi: 10.15376/biores.11.1.Tang
Thomas, R. F., and Booth, R. L. (1973). Selective electrode measurement of ammonia in water and wastes. Environ. Sci. Technol. 7, 523–526. doi: 10.1021/es60078a006
Wang, M., and Park, C. (2015). Investigation of anaerobic digestion of Chlorella sp. and Micractinium sp. grown in high-nitrogen wastewater and their co-digestion with waste activated sludge. Biomass Bioenergy 80, 30–37. doi: 10.1016/j.biombioe.2015.04.028
Wilson, C. A., and Novak, J. T. (2009). Hydrolysis of macromolecular components of primary and secondary wastewater sludge by thermal hydrolytic pretreatment. Water Res. 43, 4489–4498. doi: 10.1016/j.watres.2009.07.022
Worrell, E., Phylipsen, D., Einstein, D., and Martin, N. (2000). Energy Use and Energy Intensity of the US Chemical Industry. Technical Report, Lawrence Berkeley National Lab; Sponsoring Org.; Environmental Protection Agency (Berkeley, CA).
Yen, H., and Brune, D. (2007). Anaerobic co-digestion of algal sludge and waste paper to produce methane. Bioresour. Technol. 98, 130–134. doi: 10.1016/j.biortech.2005.11.010
Zaimes, G. G., and Khanna, V. (2013). Microalgal biomass production pathways: evaluation of life cycle environmental impacts. Biotechnol. Biofuels 6:88. doi: 10.1186/1754-6834-6-88
Zamalloa, C., Vulsteke, E., Albrecht, J., and Verstraete, W. (2011). The techno-economic potential of renewable energy through the anaerobic digestion of microalgae. Bioresour. Technol. 102, 1149–1158. doi: 10.1016/j.biortech.2010.09.017
Zhang, H., Ning, Z., Khalid, H., Zhang, R., Liu, G., and Chen, C. (2018a). Enhancement of methane production from Cotton Stalk using different pretreatment techniques. Sci. Rep. 8:3463. doi: 10.1038/s41598-018-21413-x
Zhang, Q., Li, X., Guo, D., Ye, T., Xiong, M., Zhu, L., et al. (2018b). Operation of a vertical algal biofilm enhanced raceway pond for nutrient removal and microalgae-based byproducts production under different wastewater loadings. Bioresour. Technol. 253, 323–332. doi: 10.1016/j.biortech.2018.01.014
Zhang, Q., Liu, C., Li, Y., Yu, Z., Chen, Z., Ye, T., et al. (2017a). Cultivation of algal biofilm using different lignocellulosic materials as carriers. Biotechnol. Biofuels 10:115. doi: 10.1186/s13068-017-0799-8
Zhang, Q., Yu, Z., Zhu, L., Ye, T., Zuo, J., Li, X., et al. (2018c). Vertical-algal-biofilm enhanced raceway pond for cost-effective wastewater treatment and value-added products production. Water Res. 139, 144–157. doi: 10.1016/j.watres.2018.03.076
Zhang, Y., Li, L., Kong, X., Zhen, F., Wang, Z., Sun, Y., et al. (2017b). Inhibition effect of sodium concentrations on the anaerobic digestion performance of sargassum species. Energy Fuels 31, 7101–7109. doi: 10.1021/acs.energyfuels.7b00557
Zhen, G., Lu, X., Kobayashi, T., Kumar, G., and Xu, K. (2016). Anaerobic co-digestion on improving methane production from mixed microalgae (Scenedesmus sp., Chlorella sp.) and food waste: kinetic modeling and synergistic impact evaluation. Chem. Eng. J. 299, 332–341. doi: 10.1016/j.cej.2016.04.118
Zhou, Z., Meng, Q., and Yu, Z. (2011). Effects of methanogenic inhibitors on methane production and abundances of methanogens and cellulolytic bacteria in in vitro ruminal cultures. Appl. Environ. Microbiol. 77, 2634–2639. doi: 10.1128/AEM.02779-10
Keywords: filamentous algal treatment systems, indigenous algal polyculture, algal biomass pretreatment, algae co-digestion with sewage sludge, methane production models, scaled digester energy balance analysis
Citation: Bohutskyi P, Keller TA, Phan D, Parris ML, Li M, Richardson L and Kopachevsky AM (2019) Co-digestion of Wastewater-Grown Filamentous Algae With Sewage Sludge Improves Biomethane Production and Energy Balance Compared to Thermal, Chemical, or Thermochemical Pretreatments. Front. Energy Res. 7:47. doi: 10.3389/fenrg.2019.00047
Received: 08 November 2018; Accepted: 29 April 2019;
Published: 12 June 2019.
Edited by:
Liandong Zhu, Wuhan University, ChinaReviewed by:
Ben J. Stuart, Old Dominion University, United StatesVivekanand Vivekanand, Malaviya National Institute of Technology, Jaipur, India
Qi Zhang, Nanchang University, China
Copyright © 2019 Bohutskyi, Keller, Phan, Parris, Li, Richardson and Kopachevsky. This is an open-access article distributed under the terms of the Creative Commons Attribution License (CC BY). The use, distribution or reproduction in other forums is permitted, provided the original author(s) and the copyright owner(s) are credited and that the original publication in this journal is cited, in accordance with accepted academic practice. No use, distribution or reproduction is permitted which does not comply with these terms.
*Correspondence: Pavlo Bohutskyi, cGF2bG8uYm9odXRza3lpQHBubmwuZ292; Ym9odXRza3lpQGdtYWlsLmNvbQ==