 Bastien Bornand1*
 Luc Girardin1
 Francesca Belfiore1
 Jean-Loup Robineau1
 Stéphane Bottallo2
 François Maréchal1
- 1Industrial Process and Energy Systems Engineering (IPESE-EPFL), École Polytechnique Fédérale de Lausanne, Lausanne, Switzerland
- 2Operations Department–Energy Sector, Geneva University Hospitals (HUG), Geneva, Switzerland
Industrial process integration based on mixed integer linear programming has been used for decades to design and improve industrial processes. The technique has later been extended to solve multi-period and multi-scale problems for the design of urban energy systems. Assistance is indeed required for the elaboration of coordinated investment scheduling strategies to promote renewable and efficient urban energy infrastructure shaping the future energy context for the next decades. Major energy consumers, such as hospital complexes, airports, or educational campuses can act as a driving force for the development of renewable energy cities by attracting profitable large-scale energy networks and infrastructure. The proposed methodology generates optimal alternatives for the replacement, in a long-term perspective, of the various energy supply units and systems considering the evolution of the energy demand and the availability of the energy resources. Energy integration techniques are coupled to a parametric multi-objective optimization routine to select and size the energy equipment with both financial profitability and CO2 emission reduction as objectives. The originality of the developed method lies in the integration of a multi-period mixed integer linear programming formulation to generate long-term investment planning scenarios. The method has been demonstrated on a complex of eight hospitals totaling 466,000 m2 and an operating budget of 1.85 billion USD per year. The energy integration of new centralized and decentralized equipment has been evaluated on a monthly basis over four periods until the year 2035. The results show that among the four scenarios identified, the most optimistic alternative allows to decrease the final energy consumption of about 36%, cut the CO2 emissions by a half, multiply the renewable energy share by a factor 3.5 while reducing the annual total cost by 24%. This scenario considers mainly the integration of a very low temperature district heating with decentralized heat pumps to satisfy the heat requirements below 75°C, as well as heat recovery systems and the refurbishment of about 33% of the building stock.
1. Introduction
Buildings are the largest end-use sector accounting for around 40% of the total final energy consumption in Europe (Gynther et al., 2015) and 36% in the world (IEA, 2018). According to the International Renewable Energy Agency, the share of clean district energy systems for building heat demand is projected to more than double by 2050 with a significant increase by 70% of the electricity demand in the sector (IRENA, 2018). The decarbonization of the energy resources employed would indeed require a large-scale electrification of the thermal utilities, combined with investments in efficient renewable technologies. Furthermore, increasing the 1–2% buildings’ turnover (IEA, 2018) would unlock the powerful potential of buildings’ retrofit to reduce energy consumption and pollutant emissions (Ascone et al., 2016). However, despite the recognized potential of the building sector within the energy system, there has been slow progress in renewable energy uptake in heating and cooling (Murdock et al., 2019).
To achieve effective energy transition toward renewable energy systems, the decision-making process needs to be tied to a long-term planning cycle integrating the life cycle of buildings and building systems (ASTM International, 2017). The crucial point here is that the selection of investment scheduling strategies shaping the energy future of the community for at least the next 25–50 years (ASHRAE, 2003). However, as the use of energy-efficient equipment and renewable energy technologies requires a higher initial investment than ordinary equipment and longer payback time (Wang et al., 2016), the commitment to long-term investment is disfavored by the current context of low-energy prices. This is especially true for those sectors in which the energy expenses represent only a minor share of the overall operating cost (e.g., in the hospital sector, they constitute less than 1%). In the perspective of refurbishment of the building stock and integration of new renewable energy sources, there is therefore a need for stepwise approaches and tools that allow to
• convince decision-makers to invest in the energy transition through coordinated selection and replacement of energy systems and equipment and
• conciliate operational constraints and energy performance actions through planning and coordination between the property master plana and the state energy targets.
A starting point to establish renewable energy strategies is the development of synergies between major consumers and the surrounding districts. As full economical actors, major consumers are indeed acting as potential profitable magnets of urban-scale projects, since they could also be seen as “major energy suppliers.”
Healthcare facilities are considered major energy consumers due to their combined need of reliable electricity and thermal energy to satisfy heating, cooling, air conditioning, lighting, and the use of medical and nonmedical equipment (Franco et al., 2017). Moreover, with respect to conventional buildings, these entities are subject to higher hygienic standards and stricter control of air temperature. Indeed, zones such as operating rooms require low temperature to ensure the comfort of personnel, specifically the surgeon (Hakim et al., 2018), while a higher air temperature [i.e., between 20 and 24°C according to international standards (Teke and Timur, 2014)] is required to assure the comfort of patients due to the lower metabolic rates caused by their physical inactivity (Franco et al., 2017).
Hospital districts represent a heterogeneous and complete case study in the aim of developing integrated energy planning methods. Researchers show that hospitals constitute the highest energy consumption per unit of floor area in the building sector (Buonomano et al., 2014; Ascone et al., 2016), with a share of approximately 6% of total energy consumption in the utility buildings sector (Franco et al., 2017). The large landscape of activities, combined with high hygienic standards and energy supply reliability prescriptions, are heavy constraints in the scope of large-scale and long-term energy optimization (Ascone et al., 2016). Moreover, the intrinsic nature of hospital activities, ubiquitous and unstoppable, further complicates the problems, making the research of the optimal operational scheduling a challenging task. On the other hand, there is a lack of data regarding measured and estimated energy consumption in hospital buildings (Buonomano et al., 2014), and databases must be enhanced.
The current work contributes to the long-term needs characterization, heat recovery potential, and resource availability assessment of major energy consumers, with the final goal of improving their integration within the urban sector, optimizing the mesh of energy flows at the district scale and properly scheduling the investments. The proposed method has been applied to the University Hospital of Geneva (HUG), which is a primary actor for the energy strategy of the surrounding district, as it is subject to important architectural morphing plan within the future 20 years (Figures 1 and 2).
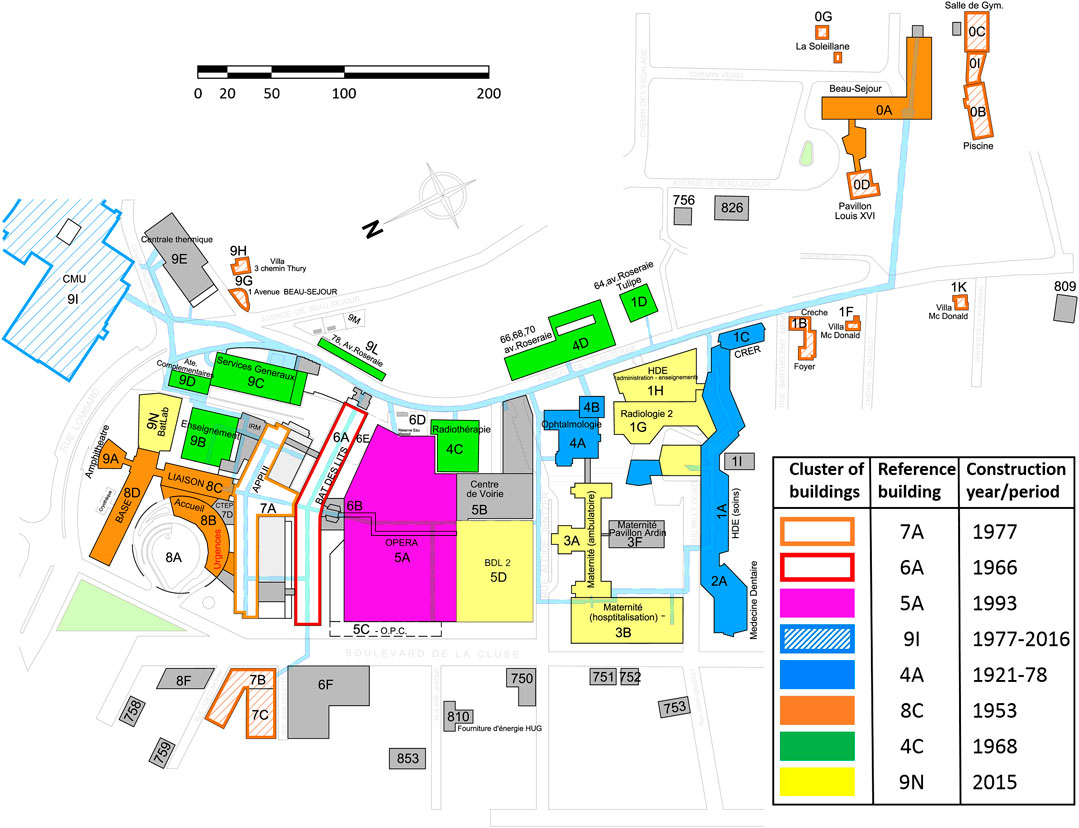
FIGURE 1. Major energy consumer with clusters of buildings and respective reference building (source: HUG, Cluse-Roseraie hospital district).
This case study fits the legal definition of major energy consumerb given by the state’s law on energy (Republic and Canton of Geneva, 2010; Republic and Canton of Geneva, 2012), which also prescribes energy consumption standards and energy performance actions to be conducted adopting an exergy-based approach (Favrat et al., 2008).
2. State of the Art
2.1. Energy Integration for Urban Energy Planning
Energy integration approaches based on pinch analysis and mathematical programming have been extensively developed in the last decades (Liew et al., 2016; Liew et al., 2017). Mixed-integer linear programming (MILP) formulations using time slices have become a common method for the design and optimization of urban multi-energy systems integrating variable energy supply and demand, district heating and cooling (DHC) networks, centralized/decentralized heat and power plants (Weber, 2008), and thermal storage (Rager, 2015). The computational complexity of solving multi-period heat cascades on a yearly basis in heterogeneous urban zones, mixing existing, new, and refurbished buildings, has been addressed using spatial and temporal data reduction techniques (Fazlollahi, 2014). Energy integration methods and tools, such as OsmoseLua (Yoo et al., 2015), have proven to be flexible enough to integrate complex energy conversion systems in cities (Suciu et al., 2018b). Attempt to use these techniques for long-term coordinated regional energy planning from the heat perspective up to horizon 2,100 has shown that long-term trends, such as cost and emission, can be accurately estimated using monthly time steps (Girardin et al., 2015).
However, meeting sustainability target in cities through energy planning is a complex task (Cajot et al., 2017) which not only relies on the use of sophisticated tools but also requires the analysis of combination of solutions in a framework that allows to better identify perspectives and integrate conflicting objectives while considering multiple geographical and temporal scales (Cajot and Schüler, 2019).
This study looks further ahead in the practical application by integrating, in a long-term perspective, intermittent renewable resources to satisfy both heating and cooling requirements. Moreover, clustering techniques and graphical representation are exploited to identify a limited number of long-term investment scenarios from a large set of generated alternative solutions.
2.2. Energy Integration in Hospital(s)
To the best of the authors’ knowledge, despite the proven potential of energy integration techniques, their systematic application in the hospital site is still at an early stage of development. Integration methods have nevertheless been implemented on few real case studies, highlighting the relevance of pinch analysis (Herrera et al., 2003) and mathematical optimization. Biglia et al. (2017) developed a mathematical model through the energy hub methodology for the energy and economic analysis of large hospital complex, applied to the hospital of Cagliari in Sardinia. The proposed method is based on monthly energy monitoring showing that including seasonal variation helps the process of equipment design and sizing. However, this approach considers non-evolving systems and does not include long-term planning aspects.
Several authors have investigated the integration of co- and trigeneration (CHCP) in healthcare facilities using MILP formulation to solve cost and pollutant emission optimization problems (Arcuri et al., 2007). Research have shown that CHCP plant integration in hospital buildings is a very competitive solution in the considered tariff structure from an energetic and economic point of view in four seasons countries (Pagliarini et al., 2012). However, in spite of very encouraging scenarios, CHP practice seems not yet satisfactorily developed in the hospital field (Pagliarini et al., 2012).
This study aimed at demonstrating the use of energy integration methods, in particular by filling the gap between multi-objective process-oriented models and data assessment, in order to support engineers in the elaboration of costed energy alternatives for the development of the energy infrastructure in hospitals (DHC, heat pump, boiler, cogeneration engine, refrigeration unit, and solar thermal) over the next 7 decades.
2.3. Building Retrofit
Building retrofitting measures in hospitals have demonstrated very satisfactory results (Buonomano et al., 2014; Carbonari et al., 2015; Ascone et al., 2016), and related methods have been widely developed. Ascone et al. (2016) opted for an envelope refurbishment approach, while Buonomano et al. (2014) carried out dynamic simulations of the building envelope as well as heating, ventilation, and air conditioning (HVAC) system simultaneously, showing that the highest savings derive from retrofitting the air conditioning systems (Carbonari et al., 2015).
To investigate the benefit of retrofitting measures assessing the buildings’ thermal behavior becomes crucial. In this framework, the dynamic simulation of conventional buildings has been commonly performed using software tools such as TRNSYS, EnergyPlus, IDA ICE, and others (IBPSA-USA, 2020), suitable for a small number of buildings without records of heating power profiles. More advanced building models including thermal inertia have also been largely investigated in the literature. Such methods, as the one proposed by Ashouri et al. (2015), are based on the electrical RC analogy to describe the buildings’ heating demand. However, identifying the parameters of the models requires a detailed knowledge and short-time sampling of the building features such as global internal temperature, occupancy, and electricity profiles. These profiles are highly fluctuating in important public buildings, making this method not suitable to describe districts composed of a large number of dilapidated buildings for which monitored data are not sufficient.
Therefore, due to a lack of data regarding measured and estimated energy consumption in hospital buildings (Buonomano et al., 2014), it is relevant to develop simple and yet reliable models, flexible and adaptable to large hospital complexes. This study proposes a refinement of the energy signature model (Girardin et al., 2010) to distinguish between ventilation and thermal envelope conductive heat losses, in order to take into account the hygienic prescriptions related to ventilation air flows.
2.4. Investment Scheduling in Energy Planning
Multi-time optimization problems including investment scheduling have been formulated mainly in the purpose of helping expansion planning of factories assuming fluctuating market. Garcia-Herreros et al. (2016) maximized the net present value (NPV) assuming varying prices, while Khalili-Damghani et al. (2012) proposed a multi-objective mathematical programming to select a portfolio of independent investments in the form of projects in a multi-planning period, with project parameters evolving through the time horizons. Recently, (Bütün et al. (2019), Bütün (2020) proposed an optimization approach using process integration and multiple investment periods for long-term industrial investment planning.
This work extends the methodologies above for the planning of a complex urban energy system where capital expense and timing of implementation are the key components for the selection and deployment of technologies (Bornand, 2017). The proposed multi-period description characterizes the main stages of the future district evolution by integrating refurbishment actions as decision variables of the optimization problem, thus allowing to plan improvement of the building envelope and hydronic system (Section 3.2.1).
3. Materials and Methods
The proposed approach extends the use of process integration techniques to the generation of long-term energy strategy and investment planning for heterogeneous and evolving major energy consumers. Building thermal modeling techniques and state-of-the-art optimization approaches is combined and applied to a complex hospital district, the processes of which are subject to high hygienic and supply reliability constraints.
The overall demand of the hospital complex is defined by the combination of characteristic processes (Section 3.1), based on the results of a first stage of data monitoring and analysis, and space heating/cooling estimated through the building thermal model (Section 3.2). In order to apply energy integration techniques (Section 3.4) on evolving systems, the power heat load (
As space heating, cooling, and ventilation account for about one-third of the final energy consumption for hospitals located in central European climate (Table 3), assessing the retrofit potential of the building envelope and HVAC systems (Section 3.3) is a primary concern. Finally, parametric optimization is employed to generate alternative scenarios, the major underlying trends which are identified through clustering techniques (Section 3.5).
3.1. Hospital Processes
The main variable influencing the process power demand evolution is related to the service provided, that is, the number of patients and occupancy profile. In the case of a hospital district, processes are assumed centralized (i.e., not building-specific) and thus describe by a single degree of freedom depending on the number of patients (number of beds) or the end-use energy reference area (ERA), as process power load is daily or weekly cyclic and is approximated to be constant over the year. The temperature levels are prescribed by hygienic standards and are set as constants. The benchmark energy requirements based on a first stage of on-site data monitoring and analysis resulted in the identification of the processes presented in Table 1.
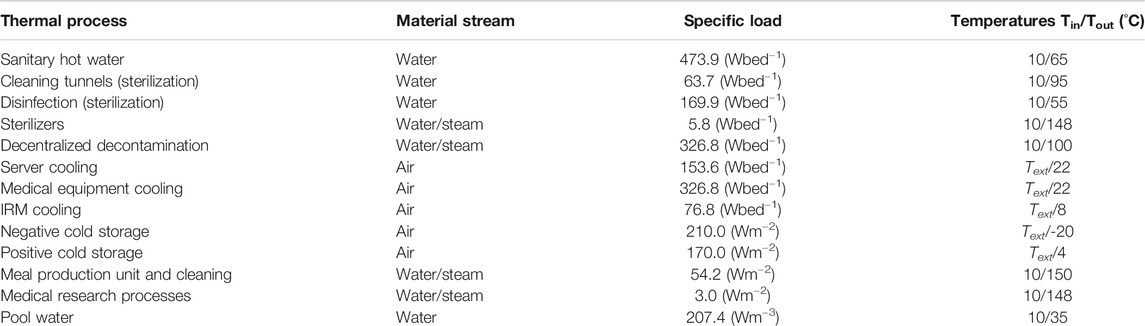
TABLE 1. Thermal streams overview of typical hospital processes (compiled from on-site data monitoring and analysis).
3.2. Heterogeneous Space Heating and Cooling
To overcome the lack of dynamic measurement and estimation of (
As the hourly energy consumption may not be available for each building, the possible lack of information is offset considering similar thermo-physical property of the building envelope and HVAC systems for given construction periods (see Figure 1). This approach is justified by the fact that hospital development is usually implemented by stage, with similar technical and construction materials.
3.2.1. Building Energy Model
In order to characterize the retrofit potential, it is essential to use a building model allowing to distinguish between the thermal transmission and the air renewal losses, within the building heat demand (
The indoor (
The supply (
Equation 3 can be solved assuming a constant flow
3.2.2. Standard Parameter
The standard fresh air flow (
The standard building heat transfer coefficient (
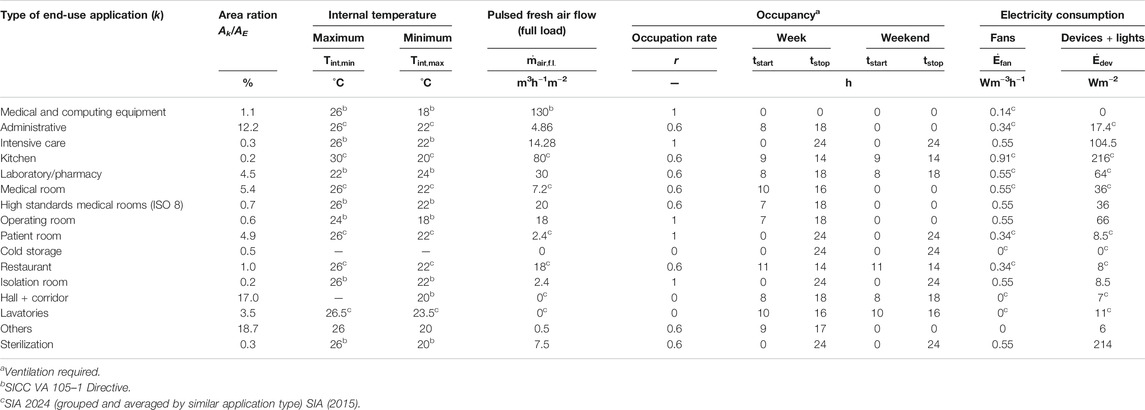
TABLE 2. Hospital typical end-use and hygienic standards in Switzerland. If reference is not specified corresponding values refer to data collected on-site.
The first guess for the heat gain (
3.2.3. Parameters Estimation and Model Validation
The procedure of calibration aims at discriminating the buildings’ overall static heat transfer coefficient and dynamic ventilation air flow. It consists of the following steps:
(1) Initialization of the fresh air flow, building heat transfer coefficient, and heat gains with standard values for each reference building.
(2) Estimation of the parameters using tuning factors (
(3) Extrapolation of the estimated parameter to the buildings of the same cluster (Figure 1) for which measured data are not available.
The validity of the model is assessed by Student’s test (Student, 1908) to verify the level of significance of each coefficient
where MSE represents the mean square error:
3.3. Retrofit Potential
The retrofit potential is estimated from the difference between standard and estimated values of the fresh air flow and overall envelope heat transfer coefficient. The space heating load after refurbishment (
After refurbishment, the heating distribution temperatures are lowered as well with nominal departure/return temperatures of typically 55/45°C.
3.4. Energy Integration
The energy integration problem minimizes the total expense, providing the optimal match between evolving energy demand in buildings and energy conversion technologies over the long term (Section 3.4.1). The energy balances are expressed as linear constraint of the MILP problem (Section 3.4.5). Continuous variables are used for sizing technologies, while binary variables provide optimal operation and selection strategies (Section 3.4.2).
Long-term investment scheduling uses binary variables to define a strategy for the purchase, acquisition, upgrade, or selling of existing facilities (Section 3.4.4). The district development planning (Figure 2) is integrated as availability constraints for buildings, energy conversion technologies, and resources.
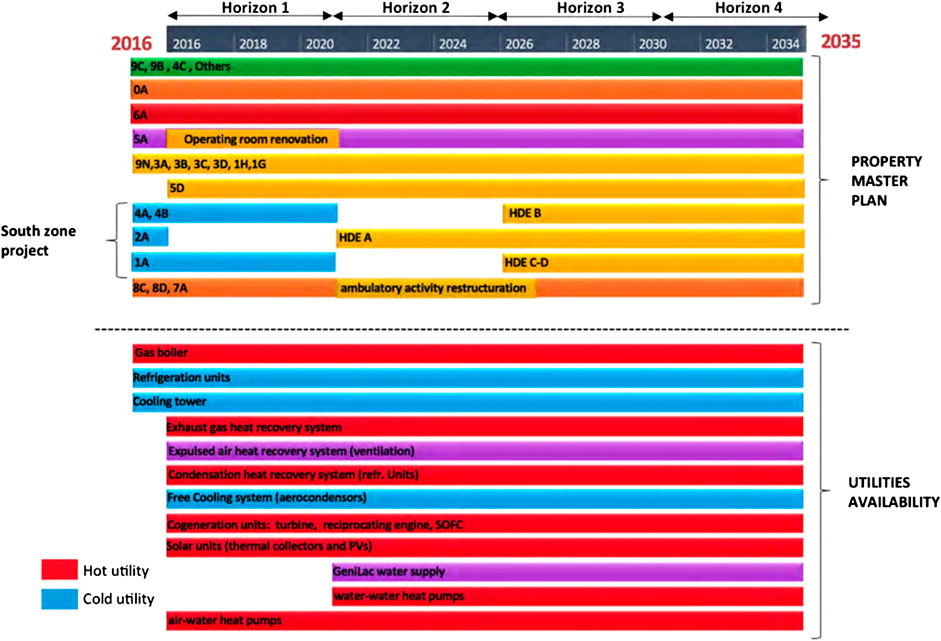
FIGURE 2. Time horizons of the energy planning of Cluse-Roseraie hospital district, including the architectural projects planned by the property master plan (main activity morphing and refurbishment actions in yellow), the existing energy supply units, the new available technologies, and the urban-scale DHC project “GéniLac” in 2021. Colors refer to Figure 1.
3.4.1. Cost Function
The optimal investment and operation strategy is solved through the minimization of the total cost (Eq. 9) over all time periods of the year (p) and long-term horizon (h).
The overall operating cost (
where
On the other hand, the overall capital expenses in each time horizon (
3.4.2. Technology Selection and Sizing
Multi-period selection and sizing of technologies allow to determine the best set of technologies, their size, and operation strategy throughout the planning horizon. The installed capacity in each temporal horizon (
The system of Eqs 12a–12c ensures that the working load remains between specified bounds and that operation logically precedes investment in installed (
3.4.3. Retrofit Actions Selection
The building heating model is implemented as a two-state entity: the current heating need (
A renovation action, including the retrofit of the ventilation system (
The renovation of the ventilation system of a building implies the potential recovery of the heat load of the exhausted air, ideally cooled down from
3.4.4. Long-Term Investment Scheduling
Investment scheduling aims at gradually replacing the existing facilities. The primary target influencing utility selection and sizing in public buildings, especially hospitals, is reliability in energy supply and power load backup, as presented in the list of criteria defined by Franco et al. (2017). To ensure security of supply and redundancy, a risk analysis of failure scenario defined by energy supply blackout during extreme days (winter and summer) has been simulated resulting in the definition of availability constraint (Eqs 15a and 15b) ensuring a minimum capacity for backup units (
Moreover, the evolution of the property master plan defines the set of temporal horizons (Figure 2). The changes are put in force by (Eqs 16a and 16b) with binary parameters for construction (
Additional continuity constraints could possibly be activated for some particular units (e.g., PV and DHC) to avoid selling and to ensure constant or increasing installed capacity in time until decommissioning (Eqs 17a–17c)
3.4.5. Energy Balance
The energy integration solves the heat cascade (Gundersen, 2002), derived from all thermal streams
3.5. Parametric Optimization for Scenario Generation
When optimizing for conflicting objectives, the overall optimum is not the goal (Schüler et al., 2018), and the single optimization presented in Eq. 9 does not provide a systematic overview of the solution space. In order to generate a range of n alternative solutions, parametric optimization is used to minimize the problem with the supplementary ϵ-constraint of Eq. 19. The latter allows to generate different solutions for distinct values of the key performance indicator (KPI). In this study, CO2 emissions have been chosen as the constraining KPI parameter.
3.6. Multi-Criteria Decision Analysis
The set of final system configurations (i.e., results from the last period 2030–35), obtained through the parametric optimization, is clustered using k-medoids algorithms and elbow’s method. It allows for identifying the existing solution representative of the cluster. This algorithm is used instead of k-mean for preserving time continuity of the generated solutions. The scenarios identified by the cluster medoids define the main investment strategy trends and are represented by a parallel coordinate plot.
The last period is considered for defining the KPI of each solution to assess the relevance and effectiveness of the energy performance actions. The considered KPIs are the following: final energy consumption, renewable energy share, CO
4. Case Study: University Hospital of Geneva Hospital District
4.1. Building Stock
With an annual heat and electricity consumption of 60 and 45 GWh, respectively, the HUG main complex fits the definition of “major consumer” (Republic and Canton of Geneva, 2010; Republic and Canton of Geneva, 2012). The building stock is composed of 33 buildings (25 existing and eight architectural projects within the year 2035) with an overall ERA of 332,311 m2, and a total of 1,224 beds, including a large landscape of activities presented in Table 2.
Architectural projects are planned by region, dividing the district into two distinct zones: the north and south zones (see Figure 2). Buildings are aggregated by construction periods as shown in Figure 1. The distribution of the energy reference area by end-use type of activity is detailed in Supplementary Tables S1 and S3, and the list of project values, obtained according to Sections 3.2 and 3.3, is presented in Supplementary Tables S2 and S4.
4.2. Cost and Emissions
Considering the significant uncertainties on the cost parameters [up to 50% according to Moret et al. (2016) and Favrat et al. (2016)], a conservative approach is adopted as a first worst case estimation, setting constant energy prices to 2015 values and technology purchase costs not evolving over the studied period (2016–2035). The CO2 emission level related to electricity consumption from the Swiss grid is set as a linearly decreasing value between 2015 and 2035, fitting the expectations of the Swiss government low-emission scenario (0.129 in 2015 down to 0.034 kg-CO2 eq./kWh in 2035) (Favrat et al., 2016). The energy costs, emissions, and techno-economic values applied are detailed in Supplementary Tables S5 and S6.
The meteorological factors influencing the demand are the external temperature Text and the solar irradiation I recorded during 2015, which is taken as the reference year. Year-to-year fluctuations are neglected: a reasonable assumption considering the level of uncertainty on these parameters with respect to their sensitivity.
4.3. Property Master Plan
The property and urban project master plan define time constraints related to technology availability and renovation potential within the year 2035, as presented on the Gantt diagram (Figure 2). The considered 20-year long-term projection is thus divided into four time horizons of 5 years. The property master plan foresees the full renovation of the district south zone while considering partial service restructuring in the north zone. These projects can be seen as an opportunity for envelope refurbishing, and the relevance of such actions is assessed and optimized for the north zone group of buildings (orange marked entities, including 5 and 6A). Urban energy supply projects such as 4th-generation very low temperature DHC (GeniLac hydrothermal network) which are emerging in the hospital area are also included to assess the profitability of integrating them in the project.
5. Results
5.1. Energy Assessment from On-Site Data Monitoring and Analysis
Energy invoices are the starting point to set the annual overall energy balance based on final energy consumption (Table 3; Supplementary Figure S1). Due to lack of monitoring of the sanitary hot water distribution system, decentralized decontaminators, and process and equipment cooling, the corresponding consumption values are estimated from technical documentations and standards, adjusted to match annual records. Despite the fact that hospitals are large electricity consumers for lights, fans, and biomedical equipment, monitoring is not systematically performed neither on large medical equipment nor on building power consumption. Electrical power flows are therefore estimated and adjusted from invoicing, technical documentation, and the standard values defined by SIA (2015).

TABLE 3. Yearly final energy balance of the hospital district (source: on site collected data and HUG, 2016)
The composite curves of the entire hospital district (Figure 3) show the minimum energy requirements (MERs) in the current hospital configuration for two typical operating conditions (winter and summer), based on hospital standards [upper and lower internal temperature limitations for hospitals according to the SWKI (2015)]. It appears that MERs in winter can mainly be achieved through ventilation heat recovery systems. Half of the annual hot thermal needs are dedicated to space heating (Table 3), requiring a design supply temperature between 50 and 80°C due to building obsolescence. The current heat generation is centralized, and gas boilers supply heat to the entire district through a 170°C district heating network even though the sterilization process high-temperature heating needs account for only 3.8% of the overall heat consumption, as highlighted by the composite curves (Figure 3).
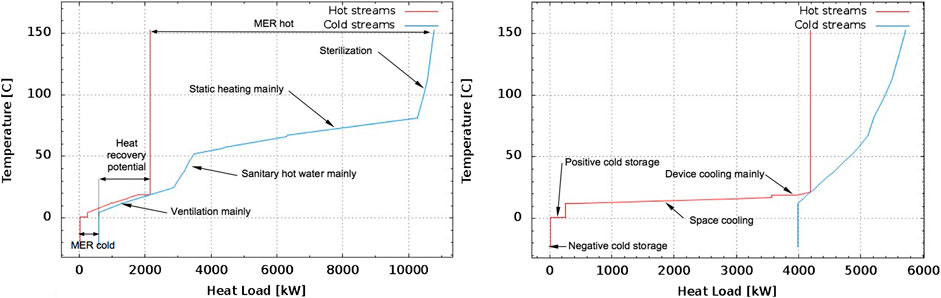
FIGURE 3. Composite curves of the thermal streams of the entire site (energy requirements only) for two typical operating conditions: on the left, a wintertime with average external temperature of 1.7°C (February 2015) and on the right, a summertime with 24.2°C (July 2015).
5.2. Building Thermal Model Calibration
The heating hourly power profile (Figure 4) and the building model calibration factors (Table 4) show the model relevance for describing heating needs in a typical hospital patient hosting building built in 1966. A 20% error is to be expected while computing the integral of the modeled heating power load over the full year (yearly energy bill) as summer and mid-season needs are not described by the model with the same level of accuracy.
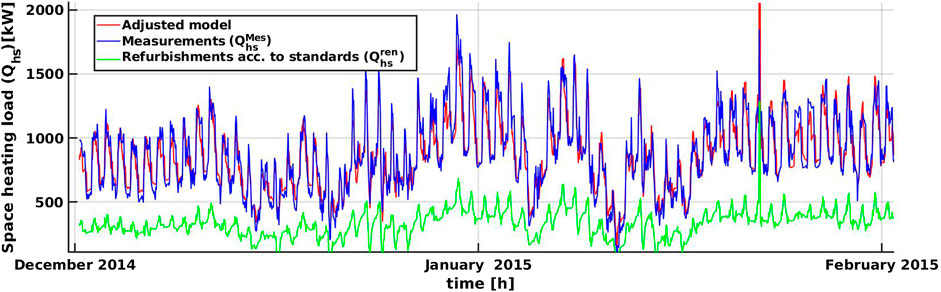
FIGURE 4. Hourly heating consumption records (static and ventilation) in blue, calibrated model results in red, and estimated demand after refurbishment in green for the 6A patient hosting building (1966).

TABLE 4. Parameters identification for reference building 6A with 3,000 points (December 2014 to February 2015).
The model calibration is performed on the reference buildings (listed in Figure 1) and the parameters extrapolated to the others belonging to the same cluster. Overall, 3,000 points between December 2014 and February 2015 constitute the training set.
According to Table 4, the null hypothesis of the three coefficients is rejected (t-value > t0.95 = 1.645), and the model with three variables presented in section 3.2.1 is therefore used for assessing the heating parameters of the other reference buildings. The results of the model calibration are reported in Supplementary Table S7.
5.3. Scenarios toward the Best Long-Term Energy Planning
The mix of solutions generated by the parametric optimization forms a Pareto front as depicted in Figure 5. Values of the objective function and the KPI are expressed per year and ERA in order to compare the different time horizons. The last time horizon (2030–2035) is taken as reference in order to assess the indicator’s quality (Table 5). The parallel plot (Figure 6) shows each solution features in the last time horizon. The four scenarios highlight the major trends.
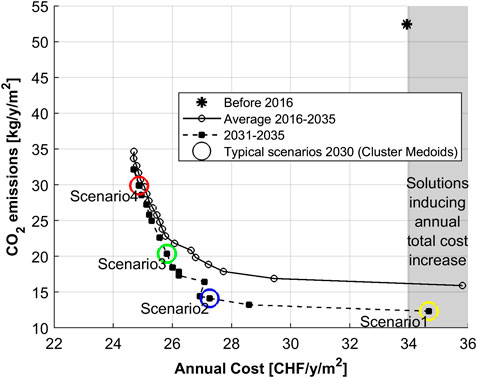
FIGURE 5. Pareto front resulting from total costs minimization under constrained CO

TABLE 5. ERA relative indicators increase between 2015 and 2035.

FIGURE 6. Mix of solutions (20 lines aggregated according to the colors of Figure 5), the four scenarios extracted thanks to k-medoids algorithm (bold lines) and the corresponding KPI for time horizon 2030–2035.
Scenario 1 is characterized by the full refurbishment of the whole building stock in the north zone (65% of the total ERA refurbished, Figure 6), leading to a large increase in the expenditures (34% higher than scenario 2 and the second most expensive). This scenario maximizes the use of SOFC fuel cells for cogeneration purposes, which is associated with a large natural gas consumption increase and a low renewable energy share (Figure 6).
Following the state prescriptions in terms of final energy consumption and renewable energy share, scenario 3 appears the best option, allowing for 36% final energy consumption reduction, while reducing the CO2 emission level by 60% and decreasing the annual total cost by 24%, considering full integration of all the thermal streams (Figure 9). As highlighted by the parallel plot (Figure 6), very low–emission level solutions (scenario 1) promote the sale of all conventional gas utilities (e.g., boiler and diesel engine) in 2020, assuming full refurbishment of the north zone (Figure 7). These units are replaced by low-temperature utilities such as heat pumps, as well as solar thermal collectors and CHP SOFC units, to fulfill high-temperature needs (Figures 8 and 10). The other scenarios promote the use of reciprocating cogeneration engines combined with the SOFC fuel cell (scenario 2) or gas boiler (scenario three and 4) to supply high-temperature demand (Figure 8). DHC (GeniLac) is considered profitable for both heat pumping and direct cooling purposes in each scenario, the cost of this technology being assumed to be 10 cts/kWh. Each scenario favors as well the installation of multi-stage heat pumps to satisfy heating needs below 75°C, using the abovementioned DHC, together with the refurbishment of minimum 30% of the total ERA (Figure 7). As reference design value, about 2,000 kW water supplied at 5°C is required to feed centralized heat pumps of 4,000 kW capacity, when external temperature is of 1.7°C.
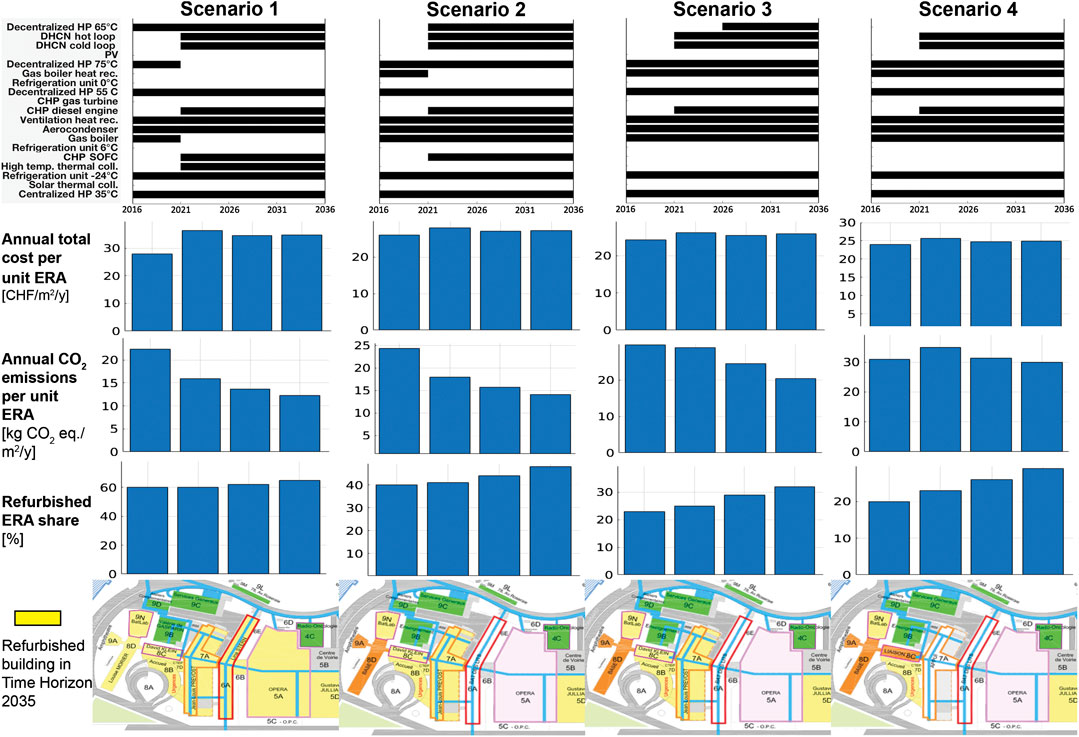
FIGURE 7. Optimized planning related to the investment in new energy supply units and building refurbishment actions, with associated total costs at each of the four time horizon. Comparison with CO2 emissions level for each scenario. The Map of refurbishment actions aggregates all time horizons.

FIGURE 8. Time evolving equipment design size over the various time horizons for each scenario.
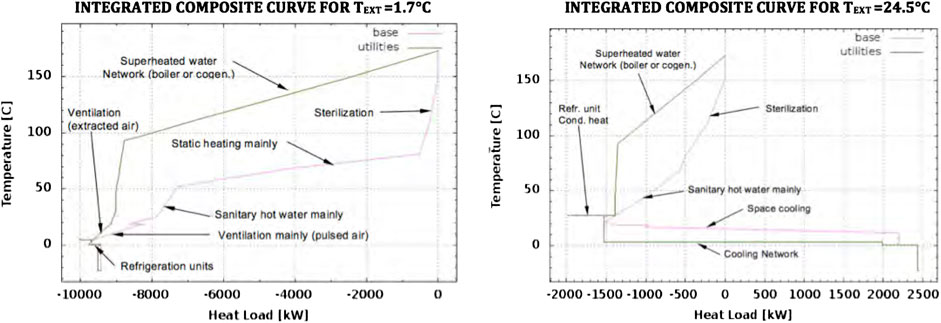
FIGURE 9. TS Integrated Composite Curves (ICC) in current configuration (2015) for two typical wintertime and summertime operating conditions with average external temperature of February (1.7 °C) and July 2015 (24.5 °C).
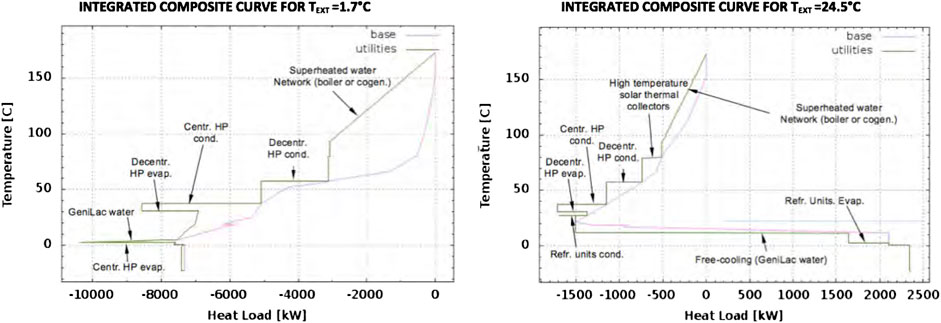
FIGURE 10. TS integrated composite curves (ICC) of scenario 3 for time horizon 2030–2035, for two typical wintertime and summertime operating conditions with average external temperature of February (1.7°C) and July 2015 (24.5°C), considering maximum refurbishment, multi-stage heat pumps, solar thermal collectors, and GeniLac DHC.
As shown by the integrated composite curves (Figure 10), all comfort cooling needs (4,000 kW at 12°C when the external temperature is 35°C) are fulfilled by free cooling, thanks to GeniLac DHC. This network is moreover used as a refrigeration unit hot source, for the purpose of satisfying lower temperature process needs.
The optimized investment planning (Figure 7) shows a transition period between 2016 and 2021, before the integration of GeniLac DHC. Equipment sizes are furthermore subject to evolve significantly up to 2026 (Figure 8) due to architectural morphing projects. Regarding the heat pumps, scenarios 1 to 4 promote the investment in low-temperature heat pumps (5,000 kW capacity in total supplying heat at 35°C), combined with medium-temperature heat pumps (totaling 2,000–3,000 kW capacity at 55–75°C).
5.4. Building Refurbishment Scheduling
The set of solutions emphasizes that once considered optimal for a building, refurbishment is to be conducted as the priority action (e.g., to be realized as soon as possible). Half of the heating demand being dedicated to space heating, the building obsolescence is a significant factor influencing not only the power but also the temperature levels of the heat supply systems, hence directly impacting the choice of utilities (Figure 7). It highlights that relevance of the refurbishment action mainly depends on three building parameters. Priority is to be given to buildings with a large aspect ratio, high heat transfer coefficient (U), and large roof area, considering that roof refurbishment expenditures are lower than facade. Since the refurbishment of the entire district is not foreseen within the considered time horizon (2017–2035), complementary units have to be considered for supplying heat at higher temperature (Figure 10). The results show that the entire roof surface available should be dedicated to solar thermal collectors which could bring up to 23% saving for the preparation of the sanitary hot water. Considering the moderate level of solar radiation in Geneva area, high-temperature collectors have been considered unable to supply heat at temperatures above 80°C. It is moreover estimated that distribution network renovation would allow for reaching the state prescriptions, with 30% of the sanitary water preheated by the solar collectors.
6. Discussion
6.1. Toward the Minimum Energy Requirements
The minimum thermal energy requirement (237 kWh/m2 in the current hospital configuration) is reachable by full integration of all the thermal streams, allowing a theoretical 20% savings in the yearly final energy. Implementing heat recovery on the ventilation extracted air flow (around 2,000 kW heat recovery systems to be implemented as shown in Figure 8) and device cooling systems appears as the most effective action to approach this target value, as demonstrated by the composite curves (Figure 3). Condensation heat recovery of both boiler exhaust gases and refrigeration unit hot source is to be considered too, pushing toward the implementation of a DHC in combination with heat pumping. The size of the supply pipe has to be designed according to summer free cooling needs (between 6,000 and 8,000 kW depending on the scenario).
The significant share of electricity consumption with respect to the overall energy demand confirms that hospitals are large electricity consumers due to heavy medical equipment, lights, fans, and numerous sparse electrical devices. And 36% of the incoming energy is thus dedicated to device operation [34% according to Franco et al. (2017)], management of which is mainly linked to user-oriented actions such as standby reduction, equipment replacement, and pooling. Therefore, the reduction of the overall energy consumption should go beyond the sole thermal aspects.
6.2. Heating Model Limitations
The building thermal model presented in Eq. 1, calibrated on the measured heat consumption
In the framework of the current study, aiming at a preliminary analysis of the long-term investment strategy and based on monthly averaged consumption profiles, the developed model was judged accurate enough by the authors. The procedure of model calibration has however proven the interest in tuning the model parameters, rather than assuming standard values. The development of a more sophisticated thermal model, for example, being able to predict the room internal temperature and opening the doors to future analyses, such as the implementation of model predictive control systems, is left for future studies.
6.3. Investment Scheduling
Thermo-economic optimization results being highly sensitive to the chosen costing functions, an accurate characterization of the equipment and refurbishment expenditures becomes crucial. The linear formulation of the investment cost gives a satisfactory mix of solutions in terms of diversity of both technologies and investment scheduling. On the contrary, considering nonlinear impairment loss over the equipment lifetime would better describe the economical aspect, while adding on the other hand uncertainties related to the new parameters. Comparative studies should be carried out in order to assess the most robust formulation against uncertainties. In addition, as cost parameters have been proven to be highly subject to uncertainties [up to 50% according to Moret et al. (2016) and Favrat et al. (2016)], sensitivity analysis or robust optimization is advised, regardless of the type of costing functions employed.
Moreover, during the current study, time continuity constraints (Eqs 17a–17c) are neglected. Each unit is indeed considered independent from one time horizon to another, with intrinsic selling of units which once installed during the generic period h is not purchased for all the consecutive periods until the end of their lifetime. The strength of this simplistic formulation lies in the possibility of selling outdated utilities at each time horizon, promoting the energy transition toward 100% renewable utilities, as soon as the resource or technology pops up. The implementation of a more detailed selling strategy is left for future work.
6.4. Toward the Solution Design
The gains of scenario 1 regarding energy consumption and CO2 emissions level are mitigated by the cost increase (Table 5). Nevertheless, other legal factors should to be considered, such as hygienic and safety standards, that will promote the hospital district full refurbishment within middle-term horizon. The state objectives regarding final energy consumption reduction and increase in renewable energy share promote the choice of scenario 3, despite a slightly higher CO2 emission level, counterbalanced by the yearly total savings (24% of the current annual energy invoice). The corresponding energy layout for the horizon 2030–2035 is presented in Supplementary Figure S3.
This work aimed at proposing a methodology for the generation of a set of optimal potential solutions through parametric optimization and consequent definition of major trends by means of clustering techniques. For the presented case study, a relatively low number of solutions (20 as depicted in Figure 5) have been considered sufficient to achieve a satisfactory level of diversity in terms of both technological choices and KPI indicators. For other applications, depending on the problem complexity and the landscape of potential units considered, a greater number of solutions (n) in Eq. 19 might be necessary to well-depict the solution space.
6.5. Additional Costs
The expenses related to the new heat exchangers and pipes for heat recovery and heating system retrofit are significant in the bill. Minimizing the economic impact of the network should be achieved by solving the heat exchanger network optimization problem, setting the spatiality constraints specific to the case study. Costs related to the retrofit of the hydronic network due to lowering the heating distribution temperature (Section 3.3) are therefore not included at this stage.
Computing the expenses related to heat recovery systems for satisfying the minimum energy requirements is a challenge due to the nonlinearity of the costs equations. These expenses have been estimated as a first approximation to be proportional to the overall heat load recovered (Section 3.4.3), reflecting the complexity of the case study’s scale and spatiality. The network costs being however significant, better characterization of the total area of exchange and piping is a priority for future works.
6.6. Energy Supply Backup
In the current hospital configuration, backups are guaranteed by fuel oil storage (for running gas boiler and electrical power generator) and no optimization is performed on these utilities at this stage, as the implementation of such restrictive constraints directly impacts the diversity of the mix of solutions and could be investigated in a second phase. Such choice is justified considering that energy supply blackout is unlikely and short events that will only slightly affect the annual energy bill.
6.7. Integration of the Next Generation of District Networks
The implementation of SOFC fuel cells should be considered in combination with a two-phase CO2 network, as well as SOEC reverse fuel cells with the aim of reducing gas consumption through supply–demand shifting (Suciu et al., 2018a). Dynamic models including storage and possibly thermal inertia are to be implemented in this perspective. The CO2 network technology is suitable for space heating and cooling, while high-temperature heat generated by the fuel cell could fulfill high-hygienic standard process needs such as sterilization. The implementation of an organic Rankine cycle using the heat generated by the SOFC as hot source would allow exergy efficiency improvement, decreasing the temperature level of the stream supplied by the fuel cell to the district network.
7. Conclusion
The literature review carried out in the field of long-term energy planning tools has revealed a lack of studies focusing on urban major consumers. Nevertheless, results have shown that the implementation of a multi-time formulation coupled with parametric optimization appears as a powerful means to generate integration strategies for those applications characterized by complex heterogeneous building stock and evolving demand. The authors have identified the following as the main reasons:
• The investment strategy can be staged to match the evolving demand and resource availability, taking into account the architectural morphing associated to the property and state master plan.
• As half of the thermal needs of the hospital district are dedicated to space heating, while the retrofit of the building envelope implies the highest expenditures, scheduling the investment is a central aspect. Results have shown that refurbishment appears as an action to be executed in early stages, with priority given to buildings with a large aspect ratio (as roof refurbishment is very efficient and involves moderate costs), reducing both the heating thermal load and the supply temperature of the hydronic network. This consideration justifies the use of a model able to distinguish between thermal losses and air conditioning demand and to characterize evolving heating needs over the years.
• A simple postprocessing analysis would allow to refine the investment strategy, for example, including the installation of smaller units or transition solutions to facilitate the evolution among consecutive periods.
Moreover, the parametric optimization has been proven suitable to avoid further complexity of alternative multi-objective formulations, while successfully targeting the legal prescriptions (maximal CO2 emission level and maximal energy consumption level). The final step would be the choice by the decision-maker among the different strategies derived from the various scenarios generated by the clustering algorithm.
In the particular case study, the best mean for targeting the MER appears to be the implementation of heat recovery in the ventilation systems. The fresh air flow being generally oversized in old hospital buildings, the proposed model is suitable for buildings with global heating consumption monitored at a sampling time shorter than 24 h. Only in this case, indeed it would be possible to distinguish whether retrofitting actions are to be implemented on the ventilation system or on the building envelope and to estimate the potential benefit. Nevertheless, global static values can be easily extrapolated to other buildings of the same type with lack of energy consumption monitoring, knowing their geometrical parameters and age.
With reference to the state prescriptions in terms of maximal final energy consumption and minimal renewable energy share, very low-temperature DHC system (scenario 3) emerges among the set of solutions generated by the optimization routine, allowing for 36% final energy consumption reduction while decreasing the annual total cost by 24%. This corresponds to the most optimistic scenario regarding the renewable energy share (current values multiplied by a factor 3.5), based on a full integration of all the thermal streams (i.e., introducing heat recovery systems) including the ventilation extracted air, with a total of 2,000 kW air heat recovery systems to be implemented, the refurbishment of about 35% of the building stock, installation of 8,000 kW multi-stage heat pumping, and implementation of direct cooling through the DHC (7,000 kW hydrothermal network).
Data Availability Statement
The data sets required to compute the model is available in the article Supplementary Material.
Author Contributions
BB designed and implemented the methodology and models, gathered and processed the data, produced the results, and wrote the article. LG assisted in the elaboration of the method and contributed to the paper. FB contributed to the revision and improvement of the content. JLR developed the foundation of the investment planning model. SB shared its expertise in complex urban energy system management and provided the necessary on-site data and planning information. FM gave valuable hints for the elaboration of the method and the presentation of the results.
Funding
This project is carried out within the frame of the Swiss Center for Competence in Energy Research on the Future Swiss Electrical Infrastructure (SCCER-FURIES) with the financial support of the Swiss Innovation Agency (Innosuisse - SCCER program). Moreover, the authors would like to thank the Operations Department of the Geneva University Hospitals (HUG) for their support and assistance in collecting and making available energy measurements and other data.
Conflict of Interest
The authors declare that the research was conducted in the absence of any commercial or financial relationships that could be construed as a potential conflict of interest.
The reviewer AK declared a shared publication, though no other collaboration, with one of the authors FM to the handling Editor.
Supplementary Material
The Supplementary Material for this article can be found online at: https://www.frontiersin.org/articles/10.3389/fenrg.2020.537973/full#supplementary-material
Glossary
Acronyms
AC aerocondenser
APE energy performance action
CAPEX capital expenditure
CHP combined heat and power
CHUV University Hospital of Lausanne
CMU Center for Medical Research
COP coefficient of performance
DHC district heating and cooling
ERA energy reference area
GB gas boiler
HP heat pump
HR ventilation heat recovery system
HUG University Hospital of Geneva
HVAC heating ventilation and air conditioning
KPI key performance indicator
MC maintenance cost
MCDA multi-criteria decision analysis
MER minimum energy requirements
MILP mixed-integer linear programming
MSE mean square error
NPV net present value
OPEX operating expenditure
PV photovoltaic panels
RC electrical resistor–capacitor
SC solar (thermal) collectors
SIG Industrial Services of Geneva
SOEC sold oxide electrolysis cell
SOFC solid oxide fuel cell
TC solar thermal collectors
UCPD meal production centralized unit
Symbols
Ė electrical load, kW
η equipment efficiency
π model parameter tuning factor
a binary parameter
c operation cost, CHF/KWh
c1 fixed investment, CHF
c2 variable investment, CHF/KW
cp specific heat, J/(kg K) d time duration, h
F capacity limit, kW
f equipment size, kW
i interest rate
lt lifetime, years
R heat cascade residuals, kW
r occupation rate, %
S sum of square residuals
T temperature, K
U conductive heat transfer coefficient, W/(m2K)
y binary variable
Subscripts/Superscripts
0 design condition
b index of building
dev electrical device
el electrical
ext external (outdoor)
fan ventilation fan
fl full load
h index of time-horizon
hs heating system
ini initial guess
int internal (indoor)
j index of process
k index for end-use application
mes measured
p index of time-period
ren renovated
s stream
std standards value
tr threshold
u index of energy conversion utility
vent ventilation system
Footnote
a The property master plan includes all the renovation projects of the building stock defined by the property for the next 20 years as depicted in Figure 2.
b Consumer with an annual heat and electricity consumption greater than 5 GWh/yr or/and electricity consumption greater than 0.5 GWh/yr.
References
Arcuri, P., Florio, G., and Fragiacomo, P. (2007). A mixed integer programming model for optimal design of trigeneration in a hospital complex. Energy 32, 1430–1447. doi:10.1016/j.energy.2006.10.023
Ascone, F., Nicola, B., Claudio, D. S., Maria, M. G., and Peter, V. G. (2016). Multi-stage and multi-objective optimization for energy retrofitting a developed hospital reference building: a new approach to assess cost-optimality. Appl. Energy 174, 37–68. doi:10.1016/j.apenergy.2016.04.078
Ashouri, A., Fazlollahi, S., Benz, M. J., and Maréchal, F. (2015). “Particle swarm optimization and kalman filtering for demand prediction of commercial buildings,”in Proceedings of ECOS 2015, Pau, France, June 30–July 3, 2015 Pau, France: Laboratoire de Thermique, Energetique et Procedes (LaTEP).
ASHRAE (2003). ASHRAE handbook: heating, ventilating, and air-conditioning applications. Atlanta, GA: American Society of Heating, Refrigerating and Air-Conditioning Engineers.
ASTM International (2017). ASTM E917-17-standard practice for measuring life-cycle costs of buildings and building systems. West Conshohocken, PA: ASTM International. doi:https://doi.org/10.1520/E0917-17
Biglia, A., Caredda, F. V., Fabrizio, E., Filippi, M., and Mandas, N. (2017). Technical-economic feasibility of CHP systems in large hospitals through the energy hub method: the case of cagliari AOB. Energy Build. 147, 101–112. doi:10.1016/j.enbuild.2017.04.047
Bornand, B. M. (2017). Integrated energy planning assistance for major consumers—application: HUG–Cluse Roseraie Hospital district. Master’s thesis. Lausanne (Switzerland): IPESE-EPFL.
Buonomano, A., Calise, F., Ferruzzi, G., and Palombo, A. (2014). Dynamic energy performance analysis: case study for energy efficiency retrofits of hospital buildings. Energy 78, 555–572. doi:10.1016/j.energy.2014.10.042
Bütün, H., Kantor, I., and Maréchal, F. (2019). An optimisation approach for long-term industrial investment planning. Energies 12, 4076. doi:10.3390/en12214076
Bütün, H. E. (2020). Optimal retrofit and investment planning methodologies for improving industrial energy and resource efficiency. Thesis. Lausanne (Switzerland): EPFL. doi:10.5075/epfl-thesis-7231
Cajot, S., Peter, M., Bahu, J.-M., Guignet, F., Koch, A., and Maréchal, F. (2017). Obstacles in energy planning at the urban scale. Sustain Cities Soc. 30, 223–236. doi:10.1016/j.scs.2017.02.003
Cajot, S., and Schüler, N. (2019). “Urban energy system planning: overview and main challenges,” in Urban energy systems for low-carbon cities. Editor U., Eicker (Cambridge, MA Academic Press), 19–49. doi:10.1016/B978-0-12-811553-4.00001-9
Carbonari, A., Fioretti, R., Lemma, M., and Principi, P. (2015). Managing energy retrofit of acute hospitals and community clinics through EPC contracting: the MARTE project. Energy Proc. 78, 1033–1038. doi:10.1016/j.egypro.2015.11.054
Favrat, D., Codina Gironès, V., Vuille, F., and Maréchal, F. (2016). “The information platform energyscope.ch on the energy transition scenarios,” in Proceedings of ECOS 2016, Portoroz, Slovenia, June 19–23, 2016, Faculty of Mechanical Engineering, Ljubljana.
Favrat, D., Marechal, F., and Epelly, O. (2008). The challenge of introducing an exergy indicator in a local law on energy. Energy 33, 130–136. doi:10.1016/j.energy.2007.10.012
Fazlollahi, S. (2014). Decomposition optimization strategy for the design and operation of district energy systems. Thesis. Lausanne (Switzerland): EPFL. doi:10.5075/epfl-thesis-6130
Franco, A., Shaker, M., Kalubi, D., and Hostettler, S. (2017). A review of sustainable energy access and technologies for healthcare facilities in the global south. Sustainable Energy Technol. Assess. 22, 92–105. doi:10.1016/j.seta.2017.02.022
Garcia-Herreros, P., Zhang, L., Misra, P., Arslan, E., Mehta, S., and Grossmann, I. E. (2016). Mixed-integer bilevel optimization for capacity planning with rational markets. Comput. Chem. Eng. 86, 33–47. doi:10.1016/j.compchemeng.2015.12.007
Girardin, L., Lepage, L., and Doppenberg, F. (2015). “A supply/demand decision making-tool for the regional coordinated planning of thermal networks,” in CISBAT 2015 International Conference “Future Buildings and Districts - Sustainability from Nano to Urban Scale”, Lausanne, Switzerland, September 9‐11, 2015 (Lausanne, EPFL Solar Energy and Building Physics Laboratory), 785–790. doi:10.5075/epfl-cisbat2015-785-790
Girardin, L., Maréchal, F., Dubuis, M., Calame-Darbellay, N., and Favrat, D. (2010). Energis: a geographical information based system for the evaluation of integrated energy conversion systems in urban areas. Energy 35, 830–840. doi:10.1016/j.energy.2009.08.018
Gundersen, T. (2002). A process integration PRIMER. Trondheim (Norway): International Energy Agency (SINTEF Energy Research, Department of Thermal Energy and Hydro PowerAvailable at: https://iea-industry.org/app/uploads/a-process-integration-primer-iea-t-gundersen_2002.pdf.
Gynther, L., Lapillonne, B., and Pollier, K. (2015). Energy efficiency trends and policies in the household and tertiary sectors—an analysis Based on the ODYSSEE and MURE databases (ODYSSEE-MURE project). Available at: http://www.odyssee-mure.eu/publications/br/energy-efficiency-trends-policies-buildings.pdf.
Hakim, M., Walia, H., Dellinger, H. L., Balaban, O., Saadat, H., Kirschner, R. E., et al. (2018). The effect of operating room temperature on the performance of clinical and cognitive tasks. Pediatr. Qual. Saf. 3, e069. doi:10.1097/pq9.0000000000000069
Herrera, A., Islas, J., and Arriola, A. (2003). Pinch technology application in a hospital. Appl. Therm. Eng. 23, 127–139. doi:10.1016/S1359-4311(02)00157-6
HUG (2016). Hôpitaux Universitaires de Genève, Rapport d'activité 2015. Genève: HUG ‐ Direction de la communication. Available at: https://www.hug.ch/sites/interhug/files/documents/hug-ra2015_0.pdf
IBPSA-USA (2020). Building energy software tools—formerly hosted by US Dept. of Energy. Available at: https://www.buildingenergysoftwaretools.com [Dataset] (Accessed January 27, 2020).
IEA (2018). 2018 Global status report: towards a zero-emission, efficient and resilient buildings and construction sector. Paris, France: International Energy AgencyAvailable at: http://hdl.handle.net/20.500.11822/27140
IRENA (2018). Global energy transformation: a roadmap to 2050. Abu Dhabi: International Renewable Energy Agency (IRENA).
Khalili-Damghani, K., Tavana, M., and Sadi-Nezhad, S. (2012). An integrated multi-objective framework for solving multi-period project selection problems. Appl. Math. Comput. 219, 3122–3138. doi:10.1016/j.amc.2012.09.043
Liew, P. Y., Theo, W. L., Wan Alwi, S. R., Lim, J. S., Abdul Manan, Z., Klemeš, J. J., et al. (2017). Total site heat integration planning and design for industrial, urban and renewable systems. Renew. Sustain. Energy Rev. 68, 964–985. doi:10.1016/j.rser.2016.05.086
Liew, P. Y., Walmsley, T. G., Wan Alwi, S. R., Abdul Manan, Z., Klemeš, J. J., and Varbanov, P. S. (2016). Integrating district cooling systems in locally integrated energy sectors through total site heat integration. Appl. Energy 184, 1350–1363. doi:10.1016/j.apenergy.2016.05.078
Moret, S., Bierlaire, M., and Maréchal, F. (2016). Robust optimization for strategic energy planning. Informatica 27, 625–648. doi:10.15388/Informatica.2016.103
Murdock, H. E., Gibb, D., André, T., Appavou, F., Brown, A., Epp, B., et al. (2019). Renewables 2019 global status report. Paris: REN21 Secretariat. Available at: https://www.ren21.net/wp-content/uploads/2019/05/gsr_2019_full_report_en.pdf
Pagliarini, G., Corradi, C., and Rainieri, S. (2012). Hospital CHCP system optimization assisted by TRNSYS building energy simulation tool. Appl. Therm. Eng. 44, 150–158. doi:10.1016/j.applthermaleng.2012.04.001
Rager, J. M. F. (2015). Urban energy system design from the heat perspective using mathematical programming including thermal storage. Thesis. Lausanne, (Switzerland): EPFL. doi:10.5075/epfl-thesis-6731
Republic and Canton of Geneva (2010). Loi sur l’énergie (LEn) (State of Geneva). Available at: https://www.ge.ch/legislation/rsg/f/s/rsg_l2_30.html
Republic and Canton of Geneva (2012). Règlement d’application de la loi sur l’énergie (REn) (State of Geneva). Available at: https://www.ge.ch/legislation/rsg/f/s/rsg_L2_30P01.html
Schüler, N., Cajot, S., Peter, M., Page, J., and Maréchal, F. (2018). The optimum is not the goal: capturing the decision space for the planning of new neighborhoods. Front. Built Environ. 3, 76. doi:10.3389/fbuil.2017.00076
SIA (2015). Cahier technique SIA 2024, Données d’utilisation des locaux pour l’énergie et les installations du bâtiment. Zurich: Swiss Society of Engineers and Architects (SIA).
SIA (2016). Sia 380/1:2016 - besoins de chaleur pour le chauffage. Zurich: Swiss Society of Engineers and Architects (SIA).
Student (1908). The probable error of a mean. Biometrika 6, 1–25. doi:10.2307/2331554 | . Available at: http://www.jstor.org/stable/2331554
Suciu, R., Girardin, L., and Maréchal, F. (2018a). Energy integration of CO2 networks and power to gas for emerging energy autonomous cities in Europe. Energy 157, 830–842. doi:10.1016/j.energy.2018.05.083
Suciu, R., Stadler, P., Girardin, L., and Maréchal, F. (2018b). “Multi-period multi-time optimisation of co2 based district energy systems,” in Proceedings of ESCAPE 28, Graz, Austria, June 10–13, 2018 (Elsevier), 1057–1062. doi:10.1016/B978-0-444-64235-6.50185-6
SWKI (2015). DIRECTIVE SICC VA105-01, Installations de ventilation et climatisation pour les locaux utilisés à des fins médicales (planification, réalisation, qualification, exploitation). Schönbühl: Schweizerischer Verein von Gebäudetechnik-Ingenieure (SWKI).
Teke, A., and Timur, O. (2014). Assessing the energy efficiency improvement potentials of HVAC systems considering economic and environmental aspects at the hospitals. Renew. Sustain. Energy Rev. 33, 224–235. doi:10.1016/j.rser.2014.02.002
Wang, T., Li, X., Liao, P.-C., and Fang, D. (2016). Building energy efficiency for public hospitals and healthcare facilities in China: barriers and drivers. Energy 103, 588–597. doi:10.1016/j.energy.2016.03.039
Weber, C. I. (2008). Multi-objective design and optimization of district energy systems including polygeneration energy conversion technologies. Thesis. Lausanne (Switzerland): EPFL. doi:10.5075/epfl-thesis-4018
Keywords: complex urban energy system, integrated energy systems, hospital, investment planning model, multi-objective multi-period optimization, process integration, 100% renewable energy systems, district heating and cooling
Citation: Bornand B, Girardin L, Belfiore F, Robineau J-L, Bottallo S and Maréchal F (2020) Investment Planning Methodology for Complex Urban Energy Systems Applied to a Hospital Site. Front. Energy Res. 8:537973. doi: 10.3389/fenrg.2020.537973
Received: 26 February 2020; Accepted: 22 September 2020;
Published: 09 December 2020.
Edited by:
Jin Xuan, Loughborough University, United KingdomReviewed by:
Andreas Koch, European Institute for Energy Research, GermanyHao Zhang, The Univeristy of Edinburgh, United Kingdom
Copyright © 2020 Bornand, Girardin, Belfiore, Robineau, Bottallo and Maréchal. This is an open-access article distributed under the terms of the Creative Commons Attribution License (CC BY). The use, distribution or reproduction in other forums is permitted, provided the original author(s) and the copyright owner(s) are credited and that the original publication in this journal is cited, in accordance with accepted academic practice. No use, distribution or reproduction is permitted which does not comply with these terms.
*Correspondence: Bastien Bornand, YmFzdGllbmJvcm5hbmRAdm9uZXQuY2g=