 Weiping Wang1,2,3,4*
 Chunyang Wang1,2,3,4
 Yongzhen Guo5,6*
 Manman Yuan1,2,3,4*
 Xiong Luo1,2,3,4
 Yang Gao7
- 1Department of Computer and Communication Engineering, University of Science and Technology Beijing, Beijing, China
- 2Beijing Key Laboratory of Knowledge Engineering for Materials Science, Beijing, China
- 3Institute of Artificial Intelligence, University of Science and Technology Beijing, Beijing, China
- 4Shunde Graduate School, Beijing University of Science and Technology, Guangzhou, China
- 5Industrial Control System Evaluation and Certification Department of China Software Testing Center, Beijing, China
- 6School of Automation, Beijing Institute of Technology, Beijing, China
- 7China Information Technology Security Evaluation Center, Beijing, China
Industrial control network is a direct interface between information system and physical control process. Due to the lack of authentication, encryption, and other necessary security protection designs, it has become the main target of malicious attacks under the trend of increasing openness. In order to protect the industrial control systems, we examine the detection of abnormal traffic in industrial control network and propose a method of detecting abnormal traffic in industrial control network based on autoencoder technology. What is more, a new deep autoencoder model was designed to reduce the dimensionality of traffic data in industrial control network. In this article, the Kullback–Leibler divergence was added to the loss function to improve the ability of feature extraction and the ability to recover raw data. Finally, this model was compared with the traditional data dimensionality reduction method (principal component analysis (PCA), independent component analysis, and singular value decomposition) on gas pipeline dataset. The results show that the approach designed in this article outperforms the three methods in different scenes in terms of f1 score.
Introduction
Industrial control system (ICS) is a highly complex integrated system that provides services to people through the coordination of various critical infrastructures. For example, smart grids, oil and gas, aerospace, transportation, and other critical infrastructure are all part of ICSs [Zhichen (2017); Inoue et al. (2017)]. Therefore, the safety and security of ICSs are vital to national security [Anton et al. (2018); Wang et al. (2016)].
The early ICS was a relatively independent and isolated system, maintaining a separate relationship with the external Internet [Garg et al. (2019)]. The functionality and controllability of ICS were its main concerns. However, with the rapid development of network and information technology, ICS gradually develops toward a networked, open architecture (Vávra and Hromada (2017)). This provides a convenient method for hackers to attack ICS by network, resulting in the network security of ICS having huge security risks. For example, Stuxnet in 2015 and widespread power outages in Ukraine and Venezuela in 2019 were all caused by hacking attacks on industrial infrastructure. As can be seen from these industrial network security incidents, the tentacles of hackers have extended to the field of industrial control.
Although the IT community has considered the security of critical infrastructure, efforts to develop security solutions for ICSs remain limited. Traditional network security cannot provide effective guidance for ICSs because the traditional network security and ICSs security problems are quite different (Alguliyev et al. (2019); Martins et al. (2018)). Therefore, it is necessary to build a strong anomaly detection mechanism for ICSs under an open environment.
For the special case of ICSs, different anomaly detection methods are proposed. The behavior-based abnormal detection model realizes the recognition of abnormal data by modeling normal data and judging the deviation degree between current behavior and normal behavior by designing distance model (Lai et al. (2019); Huda et al. (2018)). The learning-based abnormal detection model realizes the recognition of normal data and abnormal data by learning the characteristics of all data Anthi et al. (2020). But these methods only model specific types of attack data; such techniques cannot identify new types of attacks. In addition, most of the existing research is aimed at a specific industrial control environment and lacks some universality.
Most importantly, the existing literature fails to consider the problem that the length of traffic data in ICSs is not fixed. Most of them are based on the industrial control data after complex processing, which will greatly reduce the efficiency of industrial control anomaly detection. Because of the higher data dimension, the training speed and recognition accuracy of the model will be greatly reduced.
Aiming at the special situation and existing problems of ICSs, in this article, we propose a traffic data dimension reduction method that can handle variable-length data, and a new loss function is designed to speed up the processing speed. Finally, the decision tree is used as a binary classifier to evaluate the performance of the algorithm on a real industrial control dataset.
The main contributions of this article are as follows:
1 A new model of autoencoder is designed. The model can not only accelerate the speed of feature extraction but also extract more key information.
2 The accuracies of anomaly detection and F1 are improved by using the new dimension reduction method and decision tree classifier.
3 A generic model is developed that can be used for different critical infrastructures and improve the performance of identifying abnormal data.
The rest of this article is organized as follows. The related work is presented in Section 2. The deep autoencoder algorithm is studied in Section 3. The dataset is described in Section 4. The contrast test is presented in Section 5. And conclusions are drawn in Section 6.
Related Work
With the development of computer technology and network technology, the importance of ICSs is becoming increasingly prominent. Because ICSs did not consider the design of security protection at the beginning, the network interconnection exposes the industrial control network to cyberspace, which undoubtedly brings huge security risks and hidden dangers to the critical infrastructure controlled by ICSs (Morris and Gao (2013); Ding et al. (2018)). In order to avoid the occurrence of industrial safety incidents, the detection and prevention of ICSs are very important.
The existing abnormal detection methods of industrial control are usually based on the traditional network abnormal detection methods. At present, the commonly used detection methods are signature-based and learning-based technology (Das et al. (2020)). Signature-based methods use fixed signatures to detect known attacks. However, this method is inefficient in detecting unknown or new attacks (Marian et al. (2020)). The learning-based industrial control anomaly detection technology can identify the anomaly data by extracting the key features of similar samples as the classification basis. In 2019, Pang Ying et al. (Pang et al. (2019)) realized the abnormal detection of malicious traffic by signing the dataset of network traffic after clustering. In 2020, the abnormal nodes were detected by using the elliptic curve digital signature (Deepalakshmi and Kumanan (2020)).
In contrast, learning-based industrial control anomaly detection has higher performance because it can continuously learn new knowledge and then realize accurate identification of abnormal data (Halftermeyer (2020)). An effective anomaly detection framework was proposed by optimizing the parameters of support vector machines (Injadat et al. (2018)). A classifier model of industrial control anomaly detection based on support vector machine and C4.5 decision tree is established, and the effective classification of industrial control data is realized by taking advantage of the physical properties of the system (Al-Madani et al. (2019)). Jeyaram (2017), YaLi Liu and Ding (2018), Junjie Shao and Feng (2018), and Songqing and Zhiguo (2018) combined flow anomaly detection technology and adopted traditional machine learning method to further improve the identification accuracy of industrial control anomaly detection.
Although the above studies solved some problems related to network attack detection in ICSs, most of them relied on complex feature engineering to process data into fixed-length datasets. This process is very complex and can seriously increase the computational burden of the model. In addition, most of the traditional dimensionality reduction methods are used in industrial control anomaly detection, and the feature extraction energy is poor. Therefore, this kind of algorithm cannot extract the key features of industrial control data well and cannot get good detection effect. Inspired by the above article, this article proposes a new AE-based feature extraction method, which extracts a new and efficient representation from the original variable-length non-time series dataset so that the classifier can accurately identify the attack data.
Deep Autoencoder Algorithm
The traffic data dimension of industrial control network is so large that the task of traffic classification is carried out directly, which is prone to the problem of dimension disaster. Therefore, the autoencoder techniques (Hou et al. (2017)) were used to reduce data dimensions without breaking the original data semantics. The framework of malicious traffic detection system is shown in Figure 1. The system consists of models of data preprocessing, automatic encoder, and classifier.

FIGURE 1. The system of malicious traffic detection.
In the part of data preprocessing, due to the diversity of data sources, the character data should be carried out one-hot encoding processing. Then, the data need to be normalized and standardized. The normalized and standardized formulas are shown as follows:
where
Autoencoder is an unsupervised method of data dimension compression and data feature expression. The autoencoder is composed of an encoder and a decoder, as shown in Figure 2, where
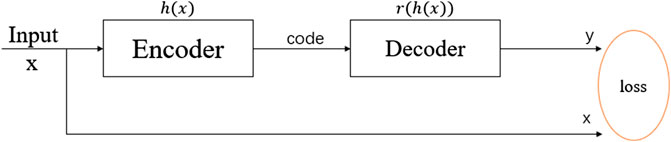
FIGURE 2. Autoencoder model.
Remark 1. Autoencoder is a kind of feedforward neural network; however, it differs from feedforward neural network. Feedforward neural network is a kind of supervised learning method, which needs a lot of marked data. Autoencoder is a kind of unsupervised learning method, data need not be annotated, so they are easier to collect. M is a key parameter. The value of m should be unique in different applications. We can find the optimal m by looking for the minimum value of the loss function in different dimensions.
The Description of Autoencoder Algorithm
(1) Autoencoder automatically encodes the network to restore compressed data by learning
(2) In order to restore the original data as much as possible, we can define the objective function of the algorithm as
The working process of autoencoder is shown in Algorithm 1:
Algorithm 1. Deep autoencoder.
Require:X: Raw input data
Ensure: Dimensionally-reduced data
1.Initial
2.repeat
3.repeat
4.Extract
5.The weight
6.The weighted
7.Calculate the loss
8.Back propagation updates the weights and the bias parameters
10.until
12.until
13.X is putted into the encoder to get the encoded data Y;
Remark 2. The DAE is composed of multiple autoencoders, in which the output of the previous encoder is the input of the next encoder.
In this article, the network structure of autoencoder is shown in Figure 3. This network structure is called DAE. The encoder is composed of a three-layer neural network. And the number of layers of the network decreases layer by layer. It changes the input data to
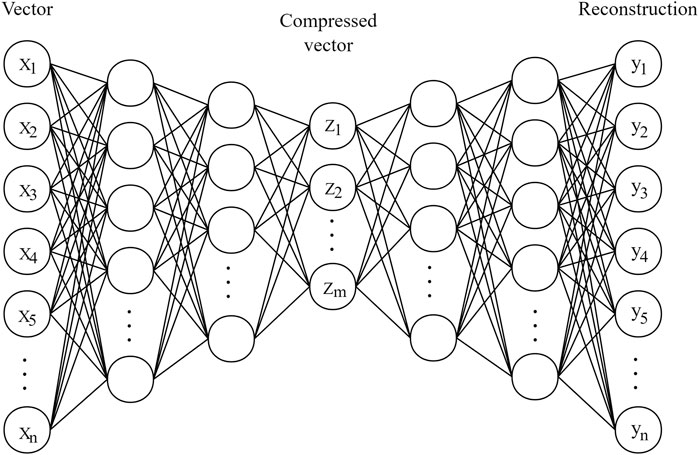
FIGURE 3. Deep autoencoder model.
Traditional DAE uses Mean Squared Error (MSE) as the loss function. This approach only considers the numerical value of the input and output data, not the distribution of the data. In this case, the extracted features do not include the distribution characteristics between the data. This caused some data loss. Kullback–Leibler divergence (KLD) is the asymmetry measure of the difference between the two probability distributions Goodfellow et al. (2016). Here, we add KLD to the loss function. At this time, the distribution of the input data is the true distribution, and the output data is the theoretical distribution. KLD means the loss of information produced by fitting a theoretical distribution to a true distribution.
In order to recover the speech and distribution characteristics of the original data as much as possible on the basis of removing redundancy and noise, the loss function designed in this article is composed of MSE and KLD. MSE is the difference between the generated data and the original data, and KLD is the difference between the generated data distribution and the original distribution. Our goal is to minimize the sum of MSE and KLD.
where
The role of MSE is to make the value of decoded data as close as possible to the input data. The functions of KLD are mainly to make the distribution of decoded data as close as possible to the distribution of the input data. After adding KLD to DAE model, the DAE model becomes KLD-based DAE (KDAE) model, which has better feature extraction capability. By constructing the KDAE model, we can realize the dimensionality reduction of the original data, extract the key features and distribution of the original data, and reduce the noise of the original data. Through analyzing Algorithm 1, we can see that the time complexity of KDAE is O(n).
Dataset
In this part, the gas pipeline dataset proposed by the Critical Infrastructure Protection Center at Mississippi State University was used to test the performance of the proposed algorithm and compare the algorithm with principal component analysis (PCA) and other mainstream data dimensionality reduction methods.
This dataset is the standard dataset of ICS by injecting attack and capturing network data in the natural gas pipeline control system. Apart from “normal” data, the dataset also includes seven types of attack data. The seven types are original malicious response injection (NMRI), complex malicious response injection (CMRI), malicious status command injection (MSCI), malicious parameter command injection (MPCI), malicious function command injection (MFCI), denial of service (DOS), and detection attack (RA). In the dataset, each of the network data contains 27 marked features, among which 26 are connection features and one is marked to mark whether the data is normal or not. In the gas pipline dataset, the proportion of normal samples is 62.9% and that of abnormal samples is 37.1%.
Contrast Test
To enable the machine to recognize the gas pipline dataset, one-hot encoding technology was used to transform each column of data that contains a string. After the data transformation, the characteristic number is 35, and then each sample changes from a 26-dimensional vector to a 35-dimensional vector. Then the whole dataset was standardized and normalized using (1) and (2). In order to ensure the accuracy of the experimental results, all data in this article are the average values of the ten repeated experiments. Each experiment randomly selects 15% of the data from the dataset as the test set and the rest as the train set.
Firstly, the preprocessed data reduced the dimension to 16 by using the DAE model that only has BCE and the KDAE model that has BCE and KLD, respectively. The number of hidden neurons in the three layers of the encoder is 86, 64, and 32, respectively. The optimizer used Adam training method. The batch size is 1,000.
The loss variation of KDAE and DAE model is shown in Figure 4. One of the models is DAE with MSE loss function and the other is KDAE, whose loss function has MSE and KLD. In the beginning, the loss of KDAE is higher than DAE because KDAE adds the KLD item. Figure 4 illustrates that the model converges faster at the early stage after adding KLD to the loss function. From Figure 4, we can see that the loss value of KDAE is significantly lower than the loss value of DAE when it finally reaches stability. The overall convergence rate of the KDAE model is higher than that of the DAE model. This shows that the KDAE model has a better recovery effect on data. This indicates that data extracted by KDAE are more representative of the information of the original data than DAE and have better feature extraction capability.
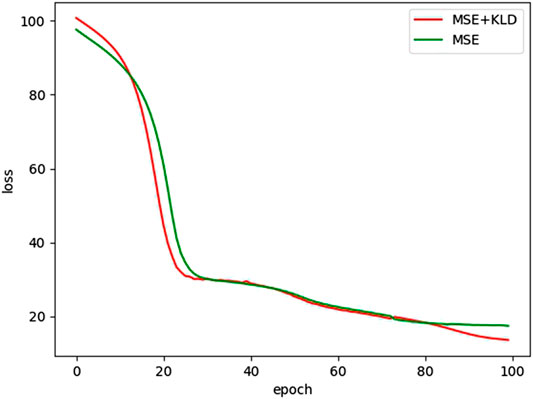
FIGURE 4. The loss of the KDAE and DAE.
In order to test the performance of the classifier after dimension reduction, the data was reduced to 22 and 16 dimensions, respectively, and then compared their effects with neural network (NN), support vector machine (SVM), and decision tree (DT) classification model. When the KDAE model was used to reduce the data dimensions to 64, the number of hidden neurons in the three-layer NN of the encoder was 100, 86, and 64, respectively. When the KDAE model was used to reduce the data dimensions to 16, the number of hidden neurons in the three-layer NN of the encoder was 64, 32, and 16, respectively.
In the NN, the optimizer used the Adam training method. The penalty coefficient of the objective function in SVM is
In the prediction, the True Positive (TP), True Negative (TN), False Positive (FP), and False Negative (FN) were used to represent the number of normal samples judged as normal samples, the number of abnormal samples predicted as normal samples, the number of normal samples predicted as abnormal samples, and the number of abnormal samples predicted as abnormal samples, respectively. In order to further test the performance of the classifier, recall, precision, and F1 score are used to evaluate the classification performance of the classifier. The definition of precision is
Recall rate is a measure of coverage, which is mainly used to measure how many positive cases are divided into positive cases. The formula of the recall rate is as follows;
Accuracy and recall rates sometimes contradict each other, so we need to take them into consideration. f1 score is the weighted harmonic average of recall rate and accuracy. And it is a comprehensive evaluation index.
When the value of f1 score is high, it indicates that the experiment has better results and the model is more effective.
At the beginning of this section, the KDAE and DAE models reduce the data to 16 dimensions, respectively. Then we will use the NN to see the impact of dimensionless data on classifier classification performance.
As we can see from Table 1, datasets processed by KDAE have higher f1 score. This indicates that the KDAE model has a stronger feature extraction capability than the DAE model. This also proves that KDAE is superior to DAE in noise reduction.

TABLE 1. The comparison of feature extraction abilities.
By analyzing the change of the loss function, we can know that compared with other dimensionality reduction methods, the autoenconder dimensionality reduction method designed by us can better recover the original data.
Then, we compare the KDAE algorithm with traditional dimension reduction methods. Firstly, Table 2 shows the classification effect of raw data in three classifiers. It can be seen that the classification effect of untreated data in NN and SVM is very poor. The reason is that the classifier fails to extract the characteristics of the abnormal samples, so the abnormal samples are mostly predicted to be normal samples.
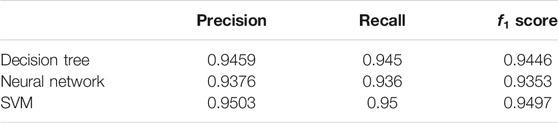
TABLE 2. Detection of raw data.
Tables 3, 4 are the classification of the data reduced to 16 and 22 dimensions, respectively. To be specific, we use three kinds of dimensionality reduction methods to compare the methods proposed in this article. In Tables 3, 4, the highest f1 score is generated by SVM. And it is obtained by the KDAE method. The value of f1 score is 0.9613.
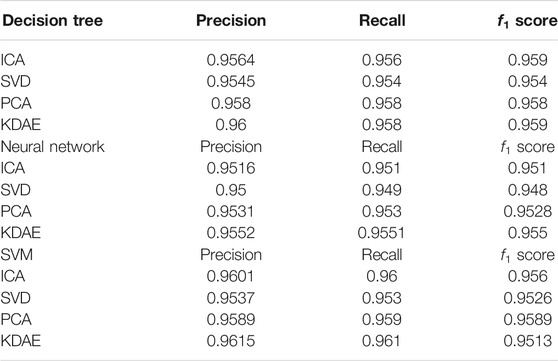
TABLE 3. Detect data in 16 dimensions.
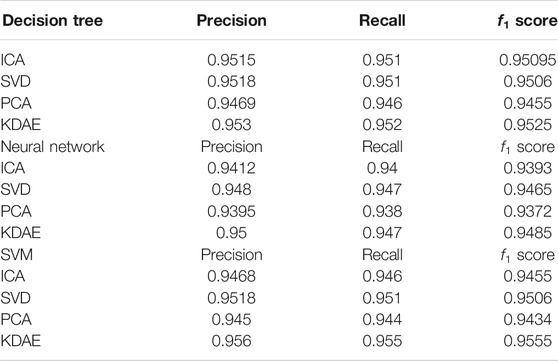
TABLE 4. Detect data in 22 dimensions.
In addition, from Tables 2–4, it can be found that the effect of classification has been significantly improved after the dimension reduction of KDAE. This means that the KDAE method is not only better than the traditional DAE method but also better than other traditional methods.
In Table 5, we used the LSTM autoencoder method that was proposed by Lai et al. (2019) to reduce the data to 16 and 22 dimensions, respectively. The classifiers of DT, NN, and SVM are used to detect the performance of reduced data. The precision, recall, and f1 score are significantly lower than the value in Tables 2–4. This is mainly because gas datasets are characteristic data. Before dimensionality reduction, we must first use the word2vec encoding method to convert the data into data that can be processed by LSTM. The data is then dimensioned down by LSTM. In the process, some important information is lost. Therefore, the method of LSTM dimension reduction is not suitable for processing such datasets.
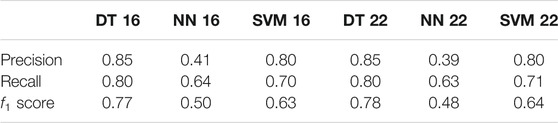
TABLE 5. The detection of data reduced by LSTM autoencoder.
At the same time, in Figure 5, each polyline represents the change in f1 score of the data on different classifiers after being reduced by different dimensionality reduction methods. It is shown that the red line has the smallest change. And the range of other lines is very large. This shows that the data reduced by KDAE can achieve good results on various classifiers. Moreover, the KDAE-reduced data had the highest f1 score on each classifier. From the above, we can conclude that the KDAE-reduced data not only extracts the key features of the original data but also eliminates redundancy and noise. This makes the classification effect significantly improved. It shows that our deep autoencoder anomaly flow detection system is efficient and has practical value.
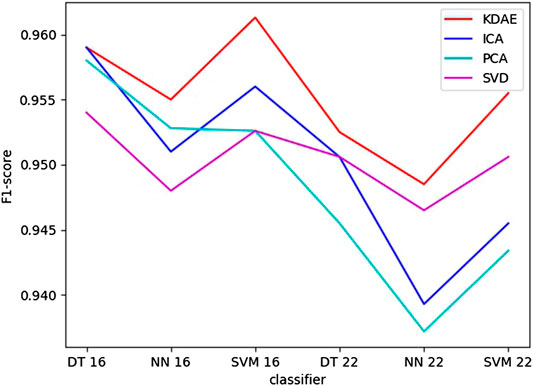
FIGURE 5. The comparison of F1 Score with different dimension reduction methods.
To further illustrate the effectiveness of the deep autoencoder algorithm proposed in this article on a malicious traffic monitoring system, the k-fold cross-validation was used to construct a receiver operating characteristic (ROC) curve to evaluate the performance of our anomaly detection system. In this case, the classifier is the NN. The data is reduced to 16 dimensions by using KDAE. And
Figure 6 illustrates that the average area obtained by six cross-validations is 0.89 and the worst is 0.55. At the same time, the ROC curve of the raw data under the same classifier is given in Figure 7. In the ROC curve, the average area of raw data is 0.87 that is much lower than the number in Figure 6. This indicates that data processed by KDAE have better performance when used for classifier classification. The classifier can identify the abnormal traffic more stably.
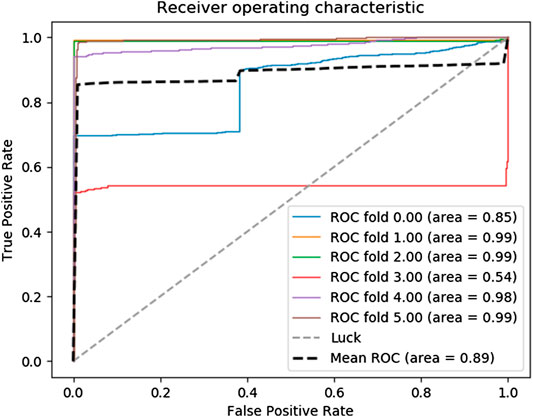
FIGURE 6. Receiver operating characteristic of 16 dimensions.
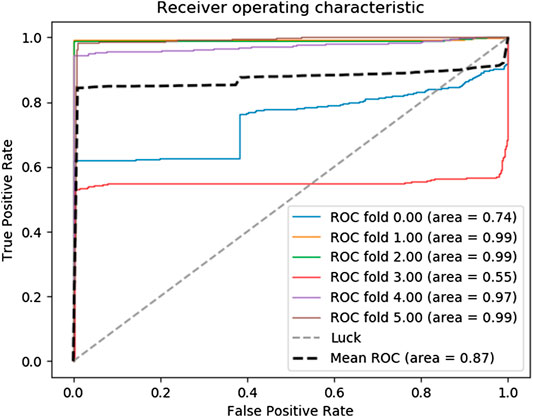
FIGURE 7. Receiver operating characteristic of raw data.
In Table 6, we compare the time required for each process of different dimensionality reduction methods. Table 6 shows that the time difference of different algorithms in classification is not big. However, the conversion time of the KDAE algorithm in dimension reduction is 53.44s, which is significantly higher than other algorithms. Combined with the previous comparative experiments, we can know that the KDAE algorithm improves the identification accuracy of attack samples on the basis of lost time.
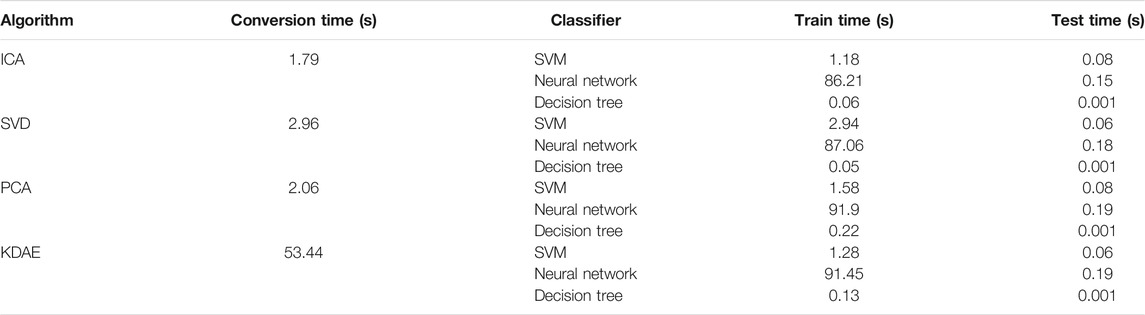
TABLE 6. Time consumption in different algorithms.
Conclusion
In this article, a new industrial control flow anomaly detection model was proposed, which reduces dimension by improved deep autoencoder. The new algorithm has verified the performance of the gas pipeline dataset. And the new algorithm was compared with the traditional methods of dimension reduction such as PCA and singular value decomposition based on the classifier such as SVM, random forest, and deep NN. Experiments show that the algorithm of KDAE has good performance in dimensionality reduction of industrial control network datasets. Data processed by the KDAE algorithm can significantly improve the performance of the classifier. This will greatly improve the identification accuracy of attack data in different detection models. And we prove that our algorithm can obtain the best ROC scores and F1 score in different classifiers.
Data Availability Statement
Publicly available datasets were analyzed in this study. This data can be found here: https://github.com/ahsan-z-khan/IDS-Model-for-SCADA.
Author Contributions
All authors listed have made a substantial, direct, and intellectual contribution to the work and approved it for publication.
Funding
This work was supported in part by the 2018 industrial Internet innovation and development project “construction of industrial Internet security standard system and test and verification environment”, in part by the National Natural Science Foundation of China under Grant 81961138010, Grant U1736117 and Grant U1836106, in part by the Fundamental Research Funds for the Central Universities under Grant FRF-TP-19-005A3, in part by the Technological Innovation Foundation of Shunde Graduate School, USTB, under Grant BK19BF006.
Conflict of Interest
The authors declare that the research was conducted in the absence of any commercial or financial relationships that could be construed as a potential conflict of interest.
References
Al-Madani, B., Shawahna, A., and Qureshi, M. (2019). Anomaly detection for industrial control networks using machine learning with the help from the inter-arrival curves. Available at: http://arxiv.org/abs/1911.05692
Alguliyev, R. M., Aliguliyev, R. M., and Abdullayeva, F. J. (2019). Hybridisation of classifiers for anomaly detection in big data. IJBDI 6, 11–19. doi:10.1504/IJBDI.2019.097396
Anthi, E., Williams, L., Rhode, M., Burnap, P., and Wedgbury, A. (2020). Adversarial attacks on machine learning cybersecurity defences in industrial control systems. Available at: http://arxiv.org/abs/2004.05005
Anton, S. D., Kanoor, S., Fraunholz, D., and Schotten, H. D. (2018). “Evaluation of machine learning-based anomaly detection algorithms on an industrial modbus/tcp data set”, in Proceedings of the 13th international conference on availability Reliability and Security, 1–9, Hamburg Germany, August, 2018. doi:10.1145/3230833.3232818
Das, T. K., Adepu, S., and Zhou, J. (2020). Anomaly detection in industrial control systems using logical analysis of data. Comput. Secur. 96, 101935. doi:10.1016/j.cose.2020.101935
Deepalakshmi, P., and Kumanan, T. (2020). “Elliptic curve digital signature technique based abnormal node detection in wireless ad hoc networks,”, in Proceedings of the IOP conference series: materials science and engineering, 925, Chennai, India, September 16–17, 2020 (Bristol, United Kingdom: IOP Publishing). 012075.
Ding, D., Han, Q. L., Xiang, Y., Ge, X., and Zhang, X. M. (2018). A survey on security control and attack detection for industrial cyber-physical systems. Neurocomputing 275, 1674–1683. doi:10.1016/j.neucom.2017.10.009
Garg, S., Kaur, K., Kumar, N., and Rodrigues, J. J. P. C. (2019). Hybrid deep-learning-based anomaly detection scheme for suspicious flow detection in sdn: a social multimedia perspective. IEEE Transactions on Multimedia 21, 566–578. doi:10.1109/TMM.2019.2893549
Halftermeyer, R. (2020). Machine learning method for cyber security intrusion detection for industrial control systems. (Thousand Oaks, CA: SAGE).
Hou, X., Shen, L., Sun, K., and Qiu, G. (2017). “Deep feature consistent variational autoencoder,” in Proceedings of the IEEE winter conference on applications of computer vision (WACV). Santa Rosa, CA, March 24–31, 2017 (New York, NY: IEEE), 1133–1141. doi:10.1109/WACV.2017.131
Huda, S., Miah, S., Yearwood, J., Alyahya, S., Al-Dossari, H., and Doss, R. (2018). A malicious threat detection model for cloud assisted internet of things (cot) based industrial control system (ics) networks using deep belief network. J. Parallel Distr. Comput. 240, 23–31. doi:10.1016/j.jpdc.2018.04.005
Injadat, M., Salo, F., Nassif, A. B., Essex, A., and Shami, A. (2018). “Bayesian optimization with machine learning algorithms towards anomaly detection,” in Proceedings of the IEEE global communications conference (GLOBECOM). Abu Dhabi, UAE, December 9–13, 2018 (IEEE), 1–6. doi:10.1109/GLOCOM.2018.8647714
Inoue, J., Yamagata, Y., Chen, Y., Poskitt, C. M., and Sun, J. (2017). “Anomaly detection for a water treatment system using unsupervised machine learning,” in Proceedings of the IEEE international conference on data mining workshops (ICDMW), New Orleans, LA, November 18–21, 2017 (IEEE), 1058–1065. doi:10.1109/ICDMW.2017.149
Jeyaram, N. (2017). Intrusion detection system based on combined support vector machine with ant colony ptimization. J. Softw. Eng 11, 30. doi:10.26634/jse.11.4.13819
Junjie Shao, W. D., and Feng, Z. (2018). Industrial control network anomaly detection method based on machine learning. Information technology and network security, 17–20.
Lai, Y., Liu, Z., and Liu, J. (2019). Abnormal detection method of industrial control system based on behavior model. Comput. Secur. 84, 166–178. doi:10.1016/j.cose.2019.03.009
Marian, M., Cusman, A., Stîngă, F., Ionică, D., and Popescu, D. (2020). Experimenting with digital signatures over a dnp3 protocol in a multitenant cloud-based scada architecture. IEEE Acc 8, 156484–156503. doi:10.1109/ACCESS.2020.3019112
Martins, R. S., Angelov, P., and Costa, B. S. J. (2018). “Automatic detection of computer network traffic anomalies based on eccentricity analysis,” in Proceedings of the IEEE international conference on fuzzy systems (FUZZ-IEEE), Rio de Janeiro, Brazil, July 8–13, 2018 (IEEE), 1–8. doi:10.1109/FUZZ-IEEE.2018.8491507
Morris, T. H., and Gao, W. (2013). “Industrial control system cyber attacks,” in 1st international symposium for ICS & SCADA cyber security research 2013 (ICS-CSR 2013), Leicester, UK, September 16–17, 2013, 1, 22–29.
Pang, Y., Chen, Z., Peng, L., Ma, K., Zhao, C., and Ji, K. (2019). “A signature-based assistant random oversampling method for malware detection,” in Proceedings of the 2019 18th IEEE international conference on trust, security and privacy in computing and communications/13th IEEE international conference on big data science and engineering (TrustCom/BigDataSE). Rotorua, New Zealand, August 5–8, 2019 (IEEE), 256–263. doi:10.1109/TrustCom/BigDataSE.2019.00042
Songqing, Z., and Zhiguo, L. (2018). An intrusion detection method based on semi-supervised learning for industry control system network. Information Technology and Network Security.
Vávra, J., and Hromada, M. (2017). “Anomaly detection system based on classifier fusion in ics environment,” in Proceedings of the 2017 International Conference on Soft Computing, Intelligent System and Information Technology (ICSIIT) (IEEE), Denpasar, Indonesia, September 26–29, 2017, 32–38. doi:10.1109/ICSIIT.2017.35
Wang, P., Chao, K.-M., Lin, H.-C., Lin, W.-H., and Lo, C.-C. (2016). “An efficient flow control approach for sdn-based network threat detection and migration using support vector machine,” in Proceedings of the IEEE 13th international conference on e-business engineering (ICEBE), Macau, China, November 4–6, 2016 (IEEE), 56–63. doi:10.1109/ICEBE.2016.020
YaLi Liu, L. M., and Ding, Y. (2018). Application and algorithm improvement of abnormal traffic detection in smart grid industrial control system. Computer system application, 173–178.
Keywords: anomaly detection, industrial control system, dimensionality reduction, feature extraction, autoencoder
Citation: Wang W, Wang C, Guo Y, Yuan M, Luo X and Gao Y (2021) Industrial Control Malicious Traffic Anomaly Detection System Based on Deep Autoencoder. Front. Energy Res. 8:555145. doi: 10.3389/fenrg.2020.555145
Received: 24 April 2020; Accepted: 04 December 2020;
Published: 19 January 2021.
Edited by:
Zhe Song, Nanjing University, ChinaReviewed by:
Lun Hu, Chinese Academy of Sciences (CAS), ChinaS. M. Suhail Hussain, National Institute of Advanced Industrial Science and Technology (AIST), Japan
Copyright © 2021 Wang, Wang, Guo, Yuan, Luo and Gao. This is an open-access article distributed under the terms of the Creative Commons Attribution License (CC BY). The use, distribution or reproduction in other forums is permitted, provided the original author(s) and the copyright owner(s) are credited and that the original publication in this journal is cited, in accordance with accepted academic practice. No use, distribution or reproduction is permitted which does not comply with these terms.
*Correspondence: Weiping Wang, d2VpcGluZ3dhbmdqdEB1c3RiLmVkdS5jbg==; Manman Yuan, eXVhbm1hbl9zbWlsZUAxNjMuY29t; Yongzhen Guo, eXpndW9AY3N0Yy5vcmcuY24=