 Thor A. Aarhaug
 Ole S. Kjos1
 Alain Ferber
 Thomas Bacquart
- 1SINTEF Industry, Trondheim, Norway
- 2SINTEF Digital, Oslo, Norway
- 3Smart Chemistry, Sacramento, CA, United States
- 4National Physics Laboratory, Teddington, United Kingdom
As part of FCH-JU funded HyCoRA project running from 2014 to 2017, 28 gaseous and 13 particulate samples were collected from hydrogen refueling stations in Europe. Samples were collected with commercial sampling instruments and analysis performed in compliance with prevailing fuel quality standards. Sampling was conducted with focus on diversity in feedstock as well as commissioning date of the HRS. Results indicate that the strategy for sampling was good. No evidence of impurity cross-over was observed. Parallel samples collected indicate some variation in analytical results. It was however found that fuel quality was generally good. Fourteen analytical results were in violation with the fuel tolerance limits. Therefore, eight or 29% of the samples were in violation with the fuel quality requirements. Nitrogen, oxygen and organics were the predominant impurities quantified. Particulate impurities were found to be within fuel quality specifications. No correlation between fuel quality and hydrogen feedstock or HRS commissioning date was found. Nitrogen to oxygen ratios gave no indication of samples being contaminated by air. A comparison of analytical results between two different laboratories were conducted. Some difference in analytical results were observed.
Introduction
Hydrogen has become a major energy vector within sustainable transportation. At the end of 2017 there were approximately 330 hydrogen refueling stations (HRS) around the world, most of these being publicly accessible for hydrogen refueling.
As polymer exchange membrane (PEM) fuel cells are sensitive to impurities, stringent requirements for hydrogen fuel quality has been set (SAE International, 2015; CEN, 2018; International Organisation for Standardization, 2019c). The requirements for hydrogen fuel quality control of HRS’s has been standardized (International Organisation for Standardization, 2019d), defining both prescriptive as well as risk assessment approaches to fuel quality control. An overview of the hydrogen fuel quality impurity tolerance is given in Table 1.
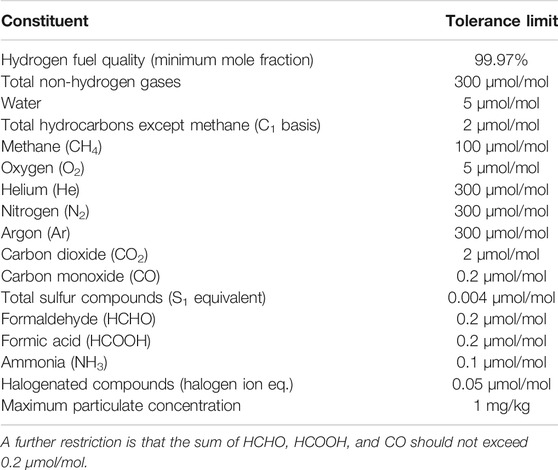
TABLE 1. Hydrogen fuel tolerance limits as given by ISO/FDIS 14687.
When conducting hydrogen fuel quality control, sampling from the dispenser nozzle at representative pressure and gas velocity would be most representative of the hydrogen fuel accepted by the fuel cell electric vehicle (FCEV). This sample would contain impurities sourcing from hydrogen production methods and thus feedstock, impurities sourcing from the transport of hydrogen from production to HRS, and finally the impurities sourcing from the HRS itself. Collection of samples from the nozzle is also the most challenging sample point due to pressures up to 87.5 MPa.
Sampling was initially documented by ASTM (ASTM International, 2013; ASTM International, 2017). This strategy involved a direct sampling approach where a gas sample was collected at reduced pressure through a sample line including a two-ended sample cylinder at reduced pressure. Initial purging of the sample line was conducted through an exhaust pipe installed at the end of the sample line. For sampling of particulates, a similar configuration was used where the sample cylinder was replaced by a particulate filter holder. Since sampling of particulates through pressure reducing valves tend to represent losses, representative sampling could only be conducted at refueling pressure. The device described [ASTM] was designed to sample from H35 nozzles.
Linde eventually offered a commercial product for sampling of hydrogen fuel from H35 and H70 nozzles. The “Qualitizer” provided a different strategy to that of the ASTM methods: a parallel bleed of hydrogen throughout the refueling protocol was collected in a 10 L sample cylinder. In the approximately three minutes it takes to refuel a FCEV vehicle with H70 [ISO refuelling protocol], the bottles were filled to a pressure between 10 and 13 MPa. Another benefit to this approach was that no venting of large volumes of hydrogen was required; the FCEV was used as sink. A commercial sampling adapter from HYDAC also became available for H70 applications.
Analysis of gaseous samples collected from HRS should be performed to check for fuel compliance with prevailing fuel tolerance standards (SAE International, 2015; CEN, 2018; International Organisation for Standardization, 2019c). Due to the low tolerance of selected impurities, analysis is challenging. Suggested analytical methods are given in ISO 21087 (International Organisation for Standardization, 2019a). At the start of HYCORA, only Smart Chemistry offered commercial services for quality control of hydrogen fuel. At the end of the project, more laboratories were emerging although not fully compliant with the analytical performance required.
Before startup of the HyCoRA project in 2014, limited information about the impurities in hydrogen fuel dispensed at HRS's was publicly available. As part of the H2MovesScandinavia project, SINTEF had already conducted sampling from three refueling stations in 2012 (Aarhaug and Ferber, 2013). For HyCoRA, a major goal for the project was to publish the results from 30 samples collected from refueling stations in Europe. Although sampling locations were limited by the requirement of publication of the results, the HRS were selected with the aim of covering as many hydrogen production techniques as possible. Further, to capture impurities sourcing from the HRS itself, a preference for refueling stations that was newly commissioned was decided.
This paper presents the results from the sampling of 28 gaseous and 13 particulate samples collected in Europe in the period 2014–2017. The samples were analyzed by Smart Chemistry. For some of the last samples, additional analysis was performed by National Physics Laboratory as to provide information about inter-laboratory variation. The particulate samples were qualitatively gravimetrically analyzed by SINTEF. The paper will present the first large hydrogen quality campaign on European HRS. The correlation between feedstock, technologies and quality will be discussed. Hydrogen quality violation will be discussed in term of number, contaminants type and analytical chemistry explanation. In a second part of the article, discussion on laboratory inter-comparison will be presented highlighting potential laboratory bias and impact on the final hydrogen quality results (false results).
Materials and Methods
Sampling of Gas and Particulates
Gaseous sampling was conducted with a commercial adapter “Qualitizer” manufactured by Linde. This is a parallel sampling strategy, where a tee connector is inserted between the HRS nozzle and the FCEV receptacle. A sealed safety valve is installed for ensuring pressure to be kept below 87.5 MPa. A high-pressure hose connects the tee to a reducing valve rated for 103.4 MPa. The outlet pressure is reduced to a maximum of 16 MPa. The reducing valve is connected to a sample cylinder, typically a 10 L aluminium canister with DIN477/1 connector. Filling the cylinder is limited by a throttle valve. The valve is set as to fill the cylinder in approx. 3 min, about the time it takes to refuel a vehicle in accordance with SAE J2601 (SAE International, 2014a). Since adapter does not relay IR Communication information between receptacle and nozzle (SAE International, 2014b), refueling is sometimes restricted to 60 MPa. After sampling, the sampling adapter is de-pressurized through a bleed-valve on the reducing valve. A schematic of the parallel sampling and a picture of the adapter in use is shown in Figure 1. Sampling is conducted by inserting the T-connector between the HRS nozzle and the FCEV receptacle. A normal refueling is initiated by HRS and once started, the valve of the sample cylinder is opened. After refuelling is completed, the valve is closed. Before disconnection of the T-connector, the system is depressurized with a bleed valve on the pressure regulator. The high-pressure hose connecting the T-connector with the pressure regulator is attached with quick connects, making disassembly efficient.
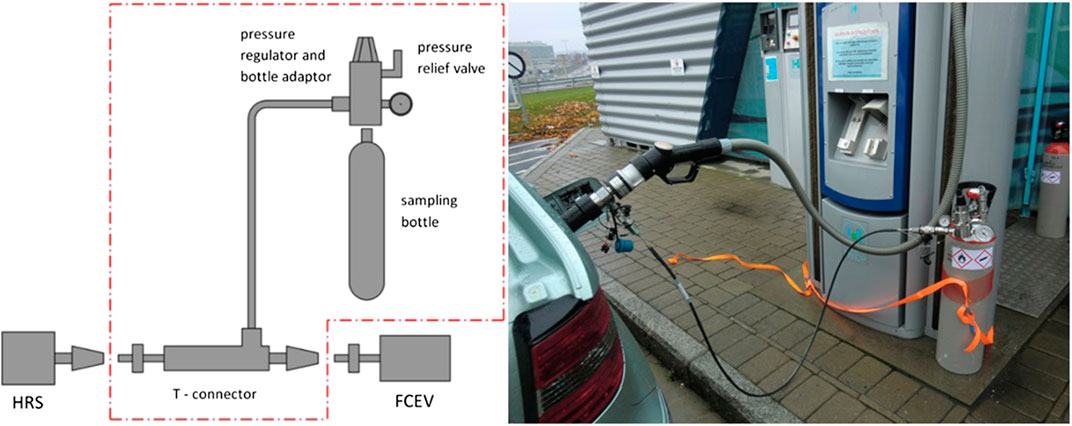
FIGURE 1. Schematic of parallel sampling (left) and actual refueling with Qualitizer (right).
The sample cylinders used were 10 L aluminium spectra-seal from Linde with stainless steel valve. The use of liner and stainless-steel valves were as to minimize adsorption of fuel contaminants. The cylinders were prepared by three times repeating a cycle consisting of vacuuming to 1 mbar followed by pressurization to 10 bar with hydrogen 5.0.
Particulate sampling was conducted with a HYDAC PSA-H70 adapter. The adapter is a serially connected filter holder placed between the HRS nozzle and FCEV receptacle. The adapter does not relay IrDA communication (SAE International, 2014b). This sometimes limits the refueling to 60 MPa. Particulate sampling requires representative velocity of the gas over the filter. To avoid rupture of the filter when the 87.5 MPa test pulse is applied (SAE International, 2014a), a rotary valve is used to throttle the gas flow initially, when the protocol test pulse is applied to the system. After the refuelling has started, the rotary valve is fully opened as to allow for full and representative flow of hydrogen over the filter. After refuelling, the adapter is depressurized with a bleed valve on the sampling device before the adapter can be disconnected from the nozzle and the vehicle.
The particulate sample was collected on 0.2 µm ∅ 47 mm Albet Lab Science PTFE filters (PT 020 47 BL). Prior to weighing, the filters were conditioned with respect to temperature and humidity to remove a contribution from water to the gravimetric estimate. A schematic of the particulate sampling and a picture of the adapter in use is shown in Figure 2. The sampling adapter uses double o-rings for sealing the filter holder during sampling. The integrity of the o-rings are critical to avoid leakage, and require inspection before every use. Replacement o-rings are considered consumables.
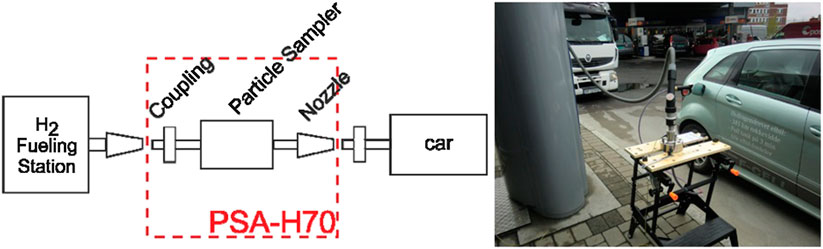
FIGURE 2. Schematic of particulate sampling adapter (left) and use during refueling of FCEV (right).
Sampling of gas and particulates separately requires two empty FCEV's. With a limited number of vehicles available, it is possible to combine the sampling in series. For representative sampling over the full refuelling protocol, it is required that the FCEV is nearly empty. Sampling normally pressurizes the 10 L cylinder between 90 and 130 bar.
Sampling was conducted in three campaigns. The first was conducted in December 2014. Eight samples were collected with a focus on diversity in feedstock. For the second campaign, newly commissioned HRS’s were targeted, and ten HRS’s were visited for sampling. Eight particulate samples were also collected upstream the gas sampling adapter. Filter changes were done in a portable glove box with a nitrogen gas atmosphere. The second sampling campaign was conducted in June 2016. The final sampling campaign was conducted in March and April 2017. Ten refueling stations were visited and five particulate samples were collected downstream of the gas sampling adapter. An overview of the HRS's samples were collected from were given in Table 2.
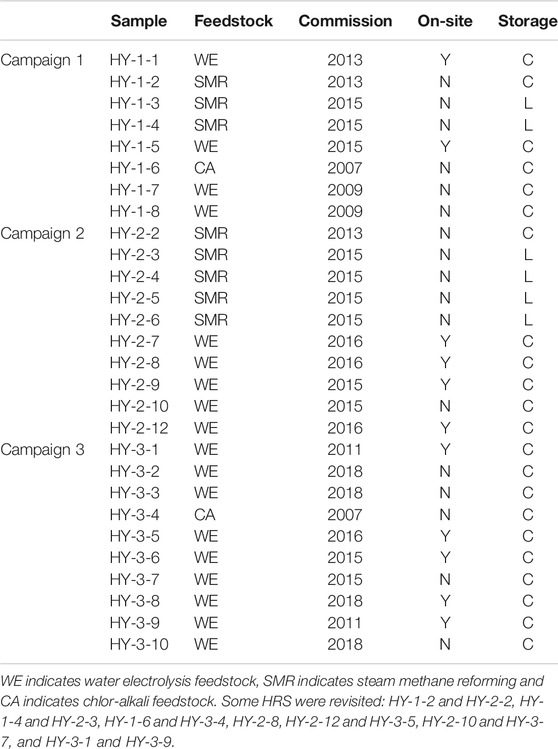
TABLE 2. List of HRS from which samples were collected.
The sampling strategy applied is described in ISO/TS 19880-1 Annex K (International Organisation for Standardization, 2019b).
Analytical Methods
Quality control of hydrogen fuel requires application of several analytical techniques. An evaluation of analytical methods applicable has been performed by NPL (Brown et al., 2011). It was found that gas chromatography with a mass spectrometry detector (GC-MS), gas chromatography with a pulsed discharge helium ionization detector (GC-PDHID) as well as Fourier transform infrared (FTIR) spectroscopy were found to be of the more versatile multicomponent techniques. The term “Total halogenate compounds” is a misnomer as there is an infinite list of organohalides to be analyzed. The available methods for analysis of “total halogenate compounds” were reviewed by NPL (Brown et al., 2011). No one method was found. A common approach is to analyze for the list found in (ASTM International, 2015) although this list is not populated by organohalides expected to be found in hydrogen fuel. On the inorganic side, hydrochloric acid and chlorine gas has been analyzed. In an updated community draft of ISO/DIS 14687 (International Organisation for Standardization, 2019c) the “total halogenate compounds” notation has been replaced by “Halogenated compounds.” They are to be specified as organohalides (R-X) and hydrochloric acid (HCl) on a halogen ion basis.
Total sulfur compounds are, according to ISO/DIS 14687 (International Organisation for Standardization, 2019c), to be a reported on a S1 equivalent. As a minimum, the analysis of H2S, COS, CS2, and mercaptans are to be reported. The total notation is valid since methods for total sulfur detection by use of sulfur chemiluminescence detector (SCD) has been developed (Downey et al., 2014).
Smart Chemistry
Smart Chemistry has developed a laboratory around gas chromatographic instrumentation, where a wide range of detectors are applied. The analytical methods have in many cases been developed in collaboration with ASTM. To achieve the required analytical performance, Smart Chemistry makes use of several pre-concentration steps. In addition to the application of a cryogenic trap, thermal desorption and cryo-focusing of the sample are applied in order to improve method sensitivity.
All Smart Chemistry methods are referenced to ASTM. An overview of the analytical methods used are listed in Table 3.
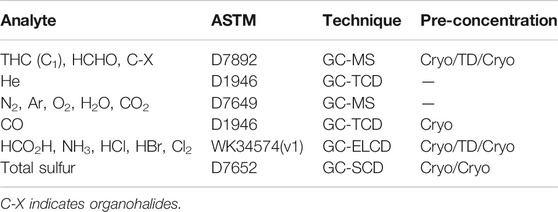
TABLE 3. Analytical methods used by Smart Chemistry.
Minimum volume requirement for complete analysis is two 1-liter Restek cylinders, pressurized to 7 MPa.
NPL
NPL has developed a hydrogen quality capability around the development of gas certified reference materials. NPL is using mainly gas chromatographic instrumentation, where a wide range of detectors are applied. The analytical methods have in been developed in house using NPL primary reference materials. An overview of the methods used for analysis of the samples is given in Table 4.
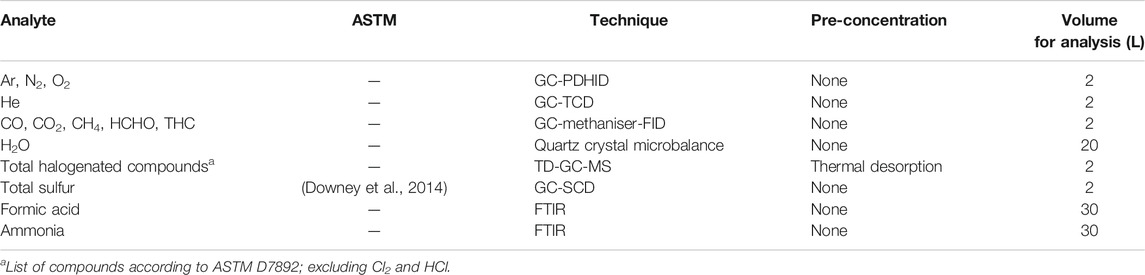
TABLE 4. Analytical instrumentation used by NPL.
Nitrogen, oxygen and argon were analysed by gas chromatography (Agilent with pulsed discharge helium ionization detector (PDHID, VICI) using helium as a carrier gas. Gases are sampled directly from the gas cylinder to the analyser, a pressure regulator (set at 20 psig outlet) and a needle valve were used to restrict the flow to 30 ml/min. The GC/PDHID sampling loop was 1 ml and the sample was then transferred onto capillary column molsieve 5A plot (30 m × 0.53 mm × 50 µm) and a second capillary column molsieve 5A plot (50 m × 0.53 mm × 50 µm). The GC oven was set at 30°C and the PDHID detector was set at 180°C. NPL gravimetric gas standards in hydrogen containing nitrogen (N2), carbon monoxide (CO), carbon dioxide (CO2), methane (CH4), ethane (C2H6), and oxygen (O2) were used to calibrate the analyser. Dynamic standards (prepared by dilution using mass flow controller system (Bronkhorst, NL) were used to generate calibration curve ranging from 1 to 75 µmol/mol of oxygen and 2–150 µmol/mol. The method can separate argon from oxygen. The measurement of water content in hydrogen sample was performed using quartz crystal microbalance, QMA (Michell, United States) Gases are sampled directly from the gas cylinder to the analyzer, a valve was used to restrict the flow to 0.333 L/min for the QMA. NPL measured carbon monoxide, carbon dioxide, methane and non-methane hydrocarbons using a GC-methaniser-FID (Peak Laboratories, United States). The measurement of carbon monoxide, carbon dioxide and methane was done by separating them on a packed column Haysep D (60/80 mesh, length 186 inch). The non-methane hydrocarbons were back flushed after the elution of CO, CO2, and CH4. The non-methane hydrocarbons eluted as one peak. The carbon compounds were converted into methane using a methaniser set at 270 ± 1 C. The detector is a flame ionisation detector (FID). Gases are sampled directly from the gas cylinder to the analyser. A needle valve was used to restrict the flow to 30 ml/min. The gas chromatography oven is set at 65°C and the injection loop volume equals to 5 ml. The calibration curve was from 20 nmol/mol to 10 µmol/mol for CO, CO2, CH4 and non-methane hydrocarbons (reported on methane basis) in hydrogen matrix. NPL measured total sulphur by gas chromatography with sulphur chemiluminescence detector using a non-retaining column as described by Downey et al. (2014). The analysis of the sample is performed on an Agilent 7890A gas chromatograph (Agilent, United States) equipped with two detectors, a flame ionization detector and sulfur chemiluminescence detector (SCD 355, Agilent Technologies, United States). The GC/SCD sampling loop volume was 1 ml and the sample was then transferred onto capillary column used which is a HP-5, 30 m × 0.320 mm ID × 0.251 µm film thickness (Agilent, United States). The column program temperature is isothermal at 110 C. Helium is used as a carrier gas at a flow rate of 20 ml/min. Gases are sampled directly from the gas cylinder to the analyser.
Formic acid and ammonia were analysed using fourier transform infra-red spectroscopy (FTIR). The instrument was a Nicolet 6700 (Thermo Fisher Scientific, United Kingdom) equipped with nitrogen purged multi-range optics, a KBr beam splitter and a liquid nitrogen cooled MCT-A detector. The spectrometer was fitted with a heated “White” type gas cell (Cyclone C5, Specac, United Kingdom), nominal path length: 8 m and volume = 2 L, equipped with a borosilicate glass body and KBr windows. The gas cell conditions were typically T = 30°C and p = 1055 mbar with a sample flow rate of 0.7–1 standard litre per min (SLM). Single beam spectra were collected between 4,000–0 cm−1 with a resolution set to 1 cm−1 and each recorded spectrum consisted of an average of 180 individual spectra. Helium was measured using GC-TCD (Agilent Technologies, United Kingdom). The method used one Heyesep Q 80/100 mesh 2 m × 1/8” outer diameter × 2.0 mm inner diameter column and one Molesieve 5A 80/100 mesh 9 ft × 1/8” outer diameter × 2 mm inner diameter column with hydrogen carrier. The loop size used for sample injection was 2 ml.
Organo-halogenated compounds were analysed using a TD-GC (Markes International, United Kingdom) coupled with mass spectroscopy (MS) with a split FID (Agilent Technologies, United Kingdom). The compounds were adsorbed onto chromosorb tube. This system desorbs the analytes from the sorbent and releases the analytes onto a U-T6SUL cold trap. A DB-VRX column 60 m × 0.25 mm with a helium carrier was used for separation.
The instrument was calibrated against NPL primary reference standards. The data was scrutinised however no result was discarded without a technical reason. The calibration curve, results of analysis and uncertainties associated were determined using NPL software XLGENline (Smith and Onakunle, 2007). An expanded uncertainty using a k value of 2 was used. In some cases, a more conservative uncertainty was derived from expert knowledge.
SINTEF
While SINTEF is not a contracting laboratory, SINTEF has analytical capabilities relevant for hydrogen fuel quality control. In order to provide further information about the speciation of hydrocarbons and other organic constituents, SINTEF has analyzed some of the collected gas samples with fourier-transform infrared (FTIR) spectroscopy. In order to achieve quantification limits in the ppbv range, a 35-meter gas cell was installed on a Bomem MB-154 spectrometer. This cell was heated to 80°C in order to prevent adsorption of gas onto the surfaces exposed to the sample gas. The gas cell has a volume of 11 L, thus requiring a larger sample volume than normally required. Qualification of gas constituent were performed by comparison with library spectral data. Quantitation was performed by linearization of spectral data from library spectral data selected around the observed absorbance of the analyte. The spectral frequencies were selected as to eliminate interference from other gas constituents.
Results
Gas Samples
An overview of the 28 gas samples collected and analyzed is shown in Figure 3 The samples were analyzed for all compounds listed in ISO 14687-2 standards representing approximately 400 independent analysis from analytical laboratories (Smart Chemistry and NPL). Fourteen analytical results were in violation with the fuel tolerance limits. Therefore, 8 or 29% of the samples were in violation with the fuel quality requirements.
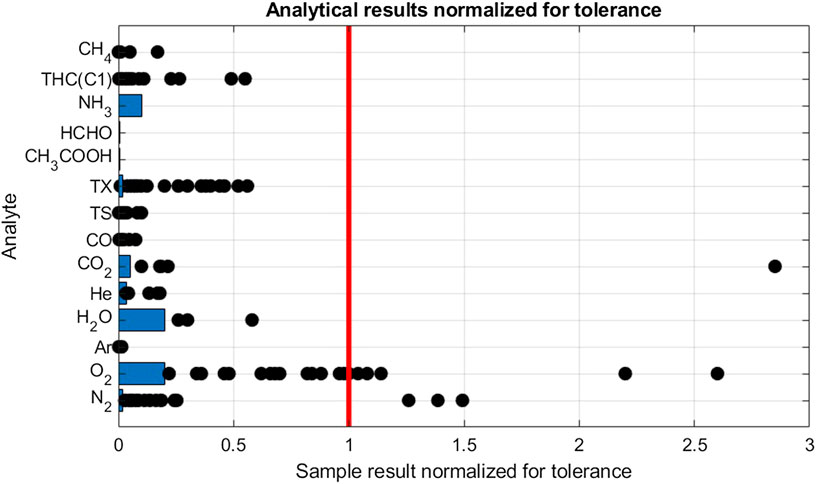
FIGURE 3. Analytical results of gas samples from HRS. Results are normalized by dividing the results by the hydrogen fuel tolereance for the individual analytes. The Limit of Detection, indicated with blue bars, is also normalized. For scalability, the highest results for N2 (4.8) and THC(C1) (15) were omitted.
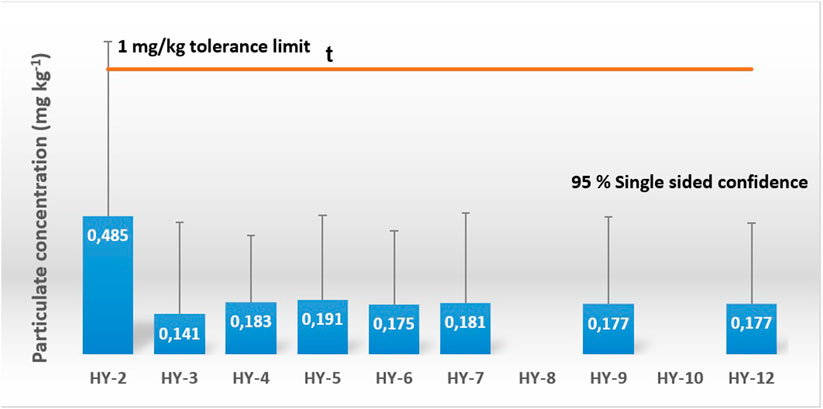
FIGURE 4. Results from sampling of particulates. The results are given with a 95% single sided confidence interval of the uncertainty budget of the measurements. No samples were collected for HY-8 and HY-10 due to sampling adapter failure.
The most frequent violation was found for oxygen. Oxygen was detected in 25 samples of which seven samples were in violation with the tolerance. Figure 3 shows sample results distribution between LOD (1 µmol/mol) and tolerance (5 µmol/mol). Even if most violation were found for oxygen, the highest amount fraction was less than three times the tolerance limit (13 µmol/mol). The second culprit was found to be nitrogen with detection in 26 samples of which 4 were in violation with the tolerance limit. Table 5 shows that when excluding violating samples, a mean value of 32, 6 µmol/mol was calculated. Nitrogen is often used in maintenance operation at hydrogen refueling station, therefore it could be one of the sources of this contamination. By studying the ratio of nitrogen to oxygen concentration in the samples there were no indication of samples being contaminated by air. It confirms the presence of the nitrogen and oxygen in the hydrogen fuel and discard any contamination during the sampling exercise.
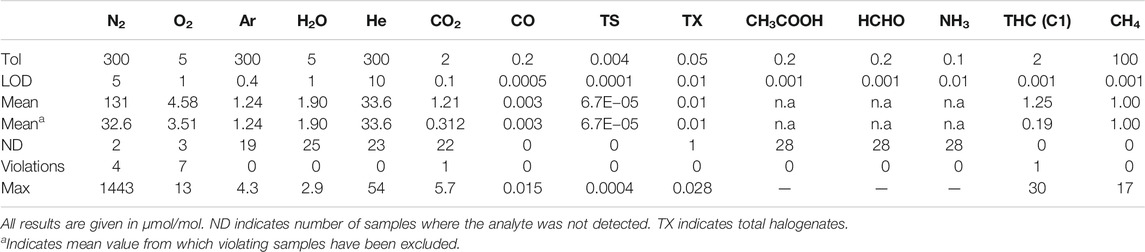
TABLE 5. Aggregated analytical results from the 28 gas samples.
Total halogenate concentration (TX) has a stringent fuel tolerance requirement of 50 nmol/mol reported on a hydrochloric acid basis. In all but one sample, halogenates were detected. Analysis indicated the halogenate to be tetrachlorohexafluorobuthane in all but one sample, where also dichloromethane was detected. Since decomposition of chlorinated carbon compounds in PEM fuel cells are not well understood, the analytical results are reported on a per molecule basis. No violation was found. When recalculating for a HCl basis, i.e., by multiplying the analytical result with the number of chlorine atoms, 11 samples were found to be in violation with the tolerance limit. The source of the tetrachlorohexafluorobuthane in the hydrogen fuel is not fully understood but has been previously reported by Hsu (2012).
One violation of the CO2 tolerance limit was found. For hydrocarbons, a violation of total hydrocarbon (THC) content was found in one sample. Ethane, propane and n-butane was identified as the significant contributors to the THC budget. Methane was also found to be elevated, although not in violation with its tolerance limit of 100 µmol/mol. Neither CO nor total sulfur (TS) was found in any sample to be close to the tolerance limit. Sulfur speciation was dominated by H2S, COS and CS2 (Aarhaug and Kjos, 2017). Ammonia, formic acid and formaldehyde were not detected in any of the 28 samples.
From the reported mapping of dispensed hydrogen quality from European HRS, it is interesting to determine if there is comparable results or pattern worldwide. European HRS hydrogen quality results were compared with results from the survey done by NREL in US. In this survey reporting results from more than 200 analysis at US HRS, the main violation observed were water, nitrogen and formaldehyde (10 nmol/mol threshold). A few cases of Sulphur above 4 nmol/mol and total hydrocarbons were observed too.
The results of this study present similar results with NREL study in United States for nitrogen and hydrocarbons. Significant number of nitrogen violation were observed in the United States and European HRS. The magnitude seems similar within 10–20% of the violation which makes nitrogen one of the most prevalent contaminant in hydrogen for FCEV. Total hydrocarbons were reported rarely, it would be interesting to get more information on these violations correlated with the HRS operation and maintenance.
In contrary, no oxygen violation was observed for oxygen at US HRS. As it is significant difference and seemingly unrelated to production methods. Therefore, this difference may have to be investigated in term of sampling method and analytical results to understand and confirm that the violation is linked to the hydrogen delivered and not related to sampling or analysis process.
Particulate Sampling
In addition to the 28 gas samples, 13 particulate samples were collected. For the second sampling campaign, the particulate sampling adapter was installed upstream of the gas sampling adapter. Eight samples were collected. The results from the gravimetric analysis is shown in Figure 4. None of the results were in violation with the 1 mg/kg threshold. An uncertainty budget for the result was estimated from the metering of hydrogen and the gravimetric analysis. For sample HY-2, the calculated 95% single-sided confidence interval was outside the tolerance limit. In general, the uncertainty was found to be high for the method and was ascribed to the conditioning of the filter prior to performing the gravimetric analysis. The filter mass was found to be highly dependent on ambient temperature and humidity. Conditioning over several hours was required in order to obtain satisfactory conditioning of the filters.
For the third and last sampling campaign, the particulate sampling adapter was installed downstream of the gas sampling adapter. Five particulate samples were collected. No accumulation of particulate materials was found for the samples. It was suspected that the upstream installation of the gas sampling adapter somehow interfered with the collection of particulates onto the filter. These results are important for joined sampling of gas and particulate as the position of the gas sampler and the particulate sampler influenced the final results.
Confidence in Analytical Laboratory Results
The results of analysis presented in the study require consideration around the confidence in analytical laboratory performing the measurement. It is important to consider that in 2019 only few laboratories are capable of performing the measurements required by ISO 14687-2. The quality control tool (i.e., reference materials, gas calibrants, inter-laboratory comparison) are not always commercially available. Therefore, the results presented require further discussion on an analytical chemistry view. The analysis of oxygen in hydrogen is strongly dependent on the quality of the calibrant especially stable gas calibrant in hydrogen. There are few reports mentioning the conversion of oxygen in water in hydrogen cylinder over time. If this is happening in a gas calibrant, the amount of oxygen decrease, and the value of the tested sample will increase due to the calibration curve bias. The consequence could be a false positive and potentially to false violation of the tolerance threshold.
As hydrogen quality analysis is an emerging topic, several gas standards in hydrogen matrices are lacking, for example tetrachlorohexafluorobuthane in hydrogen is not commercially available. In this case, the identification and quantification are relying on mass spectrometry identification and internal method quantification. In this specific case, it is extremely difficult to reproduce the measurements. It is highlighted by the difference between Smart Chemistry, NPL, and SINTEF. Smart Chemistry was able to identify and quantify tetrachlorohexafluorobuthane while SINTEF and NPL failed to reproduce it. Therefore, depending on the laboratory, the results may be significantly different. In this case, the difference is due to the lack of standard to validate the methods and ensure comparability between analytical laboratories, the lack of standardized procedure for halogenated analysis and the low amount fraction required by the international standard ISO 14687.
As a first inter-laboratory comparison on real samples, the results presented highlights the needs of improving analytical laboratory tools (standard, reference materials, inter-comparison) to provide the right level of confidence to the end-users. The next section will provide a first example of inter-comparison exercise and potential benefit of it.
Inter-Laboratory Comparison
As part of the third sampling campaign, a subset of five samples were shipped off to NPL for analysis. The analytical results are compared side-by-side in Table 6. The results from both laboratories concurred in flagging sample #4 as out of spec. There was however large difference in the analytical results for the individual impurities. Only NPL flagged water as being out of spec. Total hydrocarbons (THC) were flagged by both laboratories, although the THC budget estimate was much lower for Smart Chemistry. Whereas Smart Chemistry found n-butane, propane and ethane in the sample, NPL only detected ethane. Additional analysis performed by SINTEF found only ethane in the sample and were in support of the high concentration level found by NPL.
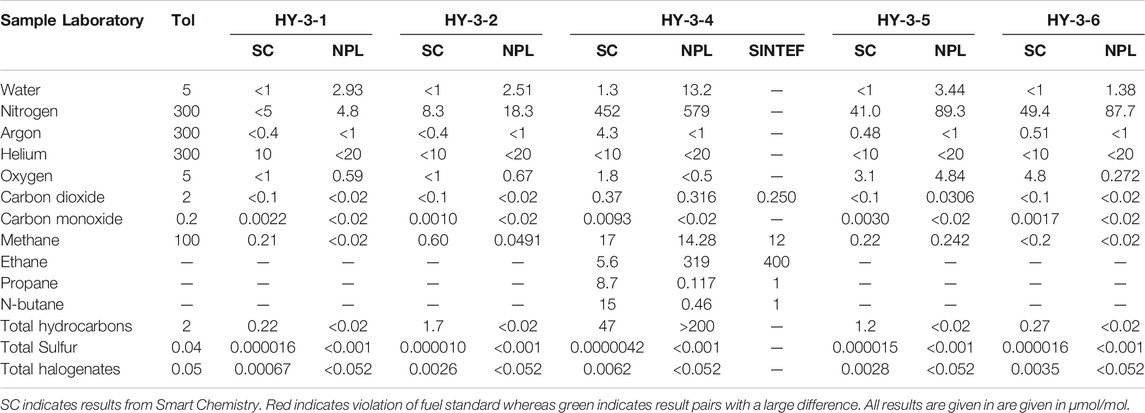
TABLE 6. Comparison of analytical results from the third sampling campaign.
Looking on the whole subset of samples compared, it appears to be systematic differences between the laboratories: for water and nitrogen, NPL results are higher than for Smart Chemistry.
One parameter missing to compare the results presented is the uncertainty. The results from methane in Sample SC-4 may be equivalent if uncertainty of the laboratories is approximately 2 µmol/mol (k = 2). In this case, the results of SC, NPL, and SINTEF would overlap. However, the information is currently missing and would require technical investigation to understand the discrepancies. This example highlights the need of reporting analytical results with uncertainty to avoid erroneous interpretation.
This inter-comparison study is extremely important for hydrogen quality laboratory. It highlights several critical points to be implemented for analytical laboratory: 1) each discrepancies observed would need a perform corrective action plans in order to understand the technical reason behind the results; 2) uncertainty is required in order to interpret the significance of the difference between laboratories and implement corrective action plan only where needed; 3) analytical laboratory are not able to determine quality control tools (reference materials, inter-laboratory comparison) therefore biased results may stay hidden for long time.
On disadvantage of using real sample for inter-comparison is the absence of some contaminants like Sulphur, formaldehyde, ammonia or formic acid. The detection or non-detection of this compounds does not demonstrate that the laboratories will be able to report an accurate result if the contaminant is present. Despite the simplicity of this inter-laboratory comparison, there is a growing need for reference materials with Sulphur, formaldehyde, formic acid or ammonia.
Discussion
A successful strategy for sampling of gas from HRS nozzle has been demonstrated (including vessel preparation, conditioning, sampling equipment H2 Qualitizer and sampling protocol). The results shows that no samples have not been contaminated by air, nor have cross-contamination between samples been observed by the applied strategy for preparation of sampling vessels.
This study presents the results of the largest sampling campaign on hydrogen quality on European HRS (28 HRS tested). The sampling strategy presented in this study has been used to perform the sampling campaign on hydrogen quality providing 28 reliable samples to be analysed according to ISO 14687. Of the 28 samples, eight or 29% of the samples were in violation with the fuel quality standard ISO 14687-2. Oxygen was the most frequent violation observed, followed by nitrogen. Water was found in three samples, although below the 5 µmol/mol threshold. The high-impact impurities CO and total sulfur was only detected at levels way below fuel tolerance. For total halogenates, tetrachlorohexafluorobutane has been observed in almost all samples analyzed by Smart Chemistry. Reported on a molecular basis, the results were not in violation with the 50 nmol/mol tolerance limit. However, if the results were reported on a HCl basis, several of the results would have been higher than the tolerance.
The violation reported in this study for European HRSs are coherent with results in other part of the world for nitrogen, water and total hydrocarbons. According to the different studies, nitrogen is the most prevalent contaminant observed above ISO 14687 threshold. The level of violation of oxygen is interesting however it may require more investigation around the analytical method and sampling. The difficulty to obtain reliable standard for oxygen in hydrogen may be a source of bias to be considered.
The contamination origin based on the feedstock or HRS age (commissioning date) was investigated. For the first sampling campaign, the results were analyzed with respect to their feedstock. No correlation between impurity levels and production method and cleanup was found. For the second campaign, sampling from newly commissioned refueling stations were targeted. With the exception of one refueling station that was in violation for three impurities, no systematic correlation was found. The results demonstrated that there is no clear correlation between hydrogen quality and feedstock (electrolyser, steam methane reforming) or age of the station (i.e., impact of degradation or new parts). Therefore, the reason behind the violation will require additional investigation. One strategy would be to analyze HRS according to their maintenance schedule as to be able to detect possible impact on.
For particulates, eight samples were successfully collected by adapter installation upstream of the gas sampling adapter. No violation of the 1 mg/kg tolerance was observed, but the gravimetric analysis of the filters indicated a high uncertainty that could potentially affect fuel quality control results.
The study presented some of the limitations of the current quality control tools available for hydrogen fuel quality. There is a lack of reference materials, standardized methods or inter-laboratory comparisons. The lack of these quality control tool may lead to bias results (positive or negative). The consequence is fake violation that could create wrong interpretation by the end user’s community. It is therefore critical to implement the new ISO standard on analytical measurement: ISO 21087 and support the development of inter-laboratory comparison and reference materials.
The inter-laboratory comparison of analytical results from two laboratories indicates that there are significant differences both in quantification levels as well as specification. As part of the Hydraite project funded by FCH-JU (2018–2020), three laboratories in Europe will established and inter-laboratory comparisons will be conducted on samples collected in the project. The differences observed between laboratories requires additional study as dedicated inter-laboratory comparison. The EURAMET 1220 (Bacquart et al., 2017) round robin is a good example of results comparison from several laboratories on samples of CO and H2S in hydrogen. It is critical for analytical laboratory to identify accuracy or bias issues and perform coorective action plan to ensure the equivalence of results between all the analytical laboratories reporting hydrogen fuel quality.
While the sampling strategy has proven to be successful with respect to collecting representative samples at the nozzle, it has also been discovered that the need for an near-empty FCEV in order to collect a sample has been limiting the efficiency. This can be remedied by more vehicles available in the future. The hydrogen fuel quality from European HRS agreed with ISO 14687 specification at 71% which is quite good. The identification of main and reoccurring impurities in hydrogen fuel suggests that online monitoring of these could be beneficial with respect to the cost of quality control but also in order to provide continuous information about dispensed fuel quality, and especially in conjunction with maintenance performed on the HRS. Finally, the analytical laboratory performance was mostly in agreement however the study highlights the need to develop more tools for quality control (reference materials and inter-laboratory comparison). So the overall analytical laboratory performance will become highly reliable.
Data Availability Statement
The raw data supporting the conclusions of this article will be made available by the authors, without undue reservation.
Author Contributions
TA is the main author and main contributor to writing. OK and AF conducted sampling of hydrogen for HRS; and analysed the samples and reported results for SINTEF. JH analysed samples and reported results for Smart Chemistry. TB analysed samples and reported results for NPL.
Funding
HyCoRA project has received funding from the European Union's Seventh Framework Programme (FP7/2007-2013) for the Fuel Cells and Hydrogen Joint Technology Initiative under grant agreement no 621223.
Conflict of Interest
Authors TA, OK, and AF were employed by the companies SINTEF Industry and SINTEF Digital, and author JH was employed by company Smart Chemistry.
The remaining author declares that the research was conducted in the absence of any commercial or financial relationships that could be construed as a potential conflict of interest.
Acknowledgments
Clean Energy Partnership (CEP), Shell Europe are acknowledged for their assistance in gaining access to HRS’s as well as providing access to FCEV’s.
References
Aarhaug, T. A., and Ferber, A. M. C. (2013). Deliverable 7.4 results from H2-FUEL gas quality monitoring at various HRSS IN OSLO area, H2Moves scandinavia. FCH-JU-2008-1 grant agreement number 245101. Available at: https://www.fch.europa.eu/sites/default/files/project_results_and_deliverables/Deliverable%207%204%20%28ID%202849294%29.pdf (Accessed July 01, 2020)
Aarhaug, T. A., and Kjos, O. (2017). D3.3 results from the 2nd HRS measurement campaign. HyCoRA – hydrogen contaminant risk assessment grant agreement no (2017) 621223. Available at: http://hycora.eu/deliverables/D%203.3%20Results%20from%20the%202nd%20HRS%20measurement%20campaign_final.pdf. (Accessed August 1, 2020)
ASTM International (2013). D7650 standard test method for sampling of particulate matter in high pressure hydrogen used as a gaseous fuel with an in-stream filter. West Conshohocken, PA: ASTM International.
ASTM International (2015). Standard test method for determination of total organic halides, total non-methane hydrocarbons, and formaldehyde in hydrogen fuel by gas chromatography/mass spectrometry. West Conshohocken, PA: ASTM International.
Aarhaug, T. A., and Kjos, O. (2013). D3.3 results from the 2nd HRS measurement campaign. HyCoRA – hydrogen contaminant risk assessment grant agreement no (2017) 621223.. Available at: http://hycora.eu/deliverables/D%203.3%20Results%20from%20the%202nd%20HRS%20measurement%20campaign_final.pdf (Accessed August 1, 2020)
ASTM International (2017). D7606 standard practice for sampling of high pressure hydrogen and related fuel cell feed Gases. West Conshohocken, PA: ASTM Inernational.
Bacquart, T., van der Veen, A. M. H., Bartlett, S., Ent, H., van Wijk, J. I. T., and Minarro, M. D. (2017). Euramet 1220: international comparability on hydrogen purity analysis. NPL Report. ENV 16.
Brown, A. S., Vargha, G. M., Downey, M. L., Hart, N. J., Ferrier, G. G., and Hall, K. I. (2011). AS 64 Methods for the analysis of trace-level impurities in hydrogen for fuel cell applications. Pusa, New Delhi: National Physics Laboratory.
CEN (2018). EN 17124 (2018) hydrogen fuel. Product specification and quality assurance. Proton exchange membrane (PEM) fuel cell applications for road vehicles. Bruxelles, BE: European Committee on Standardisation.
Downey, M. L., Murugan, A., Bartlett, S., and Brown, A. S. (2015). A novel method for measuring trace amounts of total sulphur-containing compounds in hydrogen. J. Chromatogr. A 1375, 140–145. doi:10.1016/j.chroma.2014.11.076
Hsu, J. P. (2012). Recommended pre-operation cleanup procedures for hydrogen fueling station. Int. J. Hydrogen Energy. 37, 1770–1780. doi:10.1016/j.ijhydene.2011.09.134
International Organisation for Standardization (2019a). 14687 Gas analysis -- Analytical methods for hydrogen fuel -- Proton exchange membrane (PEM) fuel cell applications for road vehicles. Geneva, Switzerland: International Organisation for Standardization.
International Organisation for Standardization (2019b). Gaseous hydrogen -- Fuelling stations -- Part 1: general requirements. Geneva, Switzerland: International Organisation for Standardization.
International Organisation for Standardization (2019c). ISO/DIS 14687 Hydrogen fuel quality -- Product specification. Geneva, Switzerland: International Organisation for Standardization.
International Organisation for Standardization (2019d). ISO/DIS 19880-8 Gaseous hydrogen -- Fuelling stations -- Part 8: fuel quality control. Geneva, Switzerland: International Organization for Standardization.
SAE International (2014a). J2601 fueling protocols for light duty gaseous hydrogen surface vehicles. Warrendale, PA: SAE International.
SAE International (2014b). J2799 hydrogen surface vehicle to station communications hardware and software. Warrendale, PA: SAE International.
SAE International (2015). J2719 hydrogen fuel quality for fuel cell vehicles. Warrendale, PA: SAE International.
Keywords: hydrogen fuel quality control, hydrogen fuel quality, analysis of hydrogen samples, hydrogen fuel impurity tolerance, fuel cell impurity impact
Citation: Aarhaug TA, Kjos OS, Ferber A, Hsu JP and Bacquart T (2020) Mapping of Hydrogen Fuel Quality in Europe. Front. Energy Res. 8:585334. doi: 10.3389/fenrg.2020.585334
Received: 20 July 2020; Accepted: 19 October 2020;
Published: 11 November 2020.
Edited by:
Nicholas P. Stadie, Montana State University, United StatesReviewed by:
Suyin Gan, University of Nottingham Malaysia Campus, MalaysiaMichael Bielmann, Comet AG, Switzerland
Copyright © 2020 Aarhaug, Kjos, Ferber, Hsu and Bacquart. This is an open-access article distributed under the terms of the Creative Commons Attribution License (CC BY). The use, distribution or reproduction in other forums is permitted, provided the original author(s) and the copyright owner(s) are credited and that the original publication in this journal is cited, in accordance with accepted academic practice. No use, distribution or reproduction is permitted which does not comply with these terms.
*Correspondence: Thor A. Aarhaug, dGFhcmhhdWdAc2ludGVmLm5v