 Jian Wang
 Niancheng Zhou
 Anqi Tao
- State Key Laboratory of Power Transmission Equipment and System Security and New Technology, Chongqing University, Chongqing, China
Soft open point-based energy storage (SOP-based ES) can transfer power in time and space and also regulate reactive power. These characteristics help promote the integration of distributed generations (DGs) and reduce the operating cost of active distribution networks (ADNs). Therefore, this work proposed an optimal operation model for SOP-based ES in ADNs by considering the battery lifetime. First, the active and reactive power equations of SOP-based ES and battery degradation cost were modeled. Then, the optimal operation model that includes the operation cost of ADNs, loss cost, and battery degradation cost was established. The mixed integer nonlinear programming model was transformed to a mixed integer linear programming model derived through linearization treatment. Finally, the feasibility and effectiveness of the proposed optimization model are verified by the IEEE33 node system.
Introduction
Renewable energy power generation is a key measure to solve the contradiction between load growth, environmental protection, and energy shortage (Habibollahzade et al., 2018; Zhao and Chen, 2018). Renewable energy power generation is usually connected to the distribution network in the form of distributed generation (DG) (Badran et al., 2018; Naderi et al., 2018). The increasing integration of DG has a profound impact on the distribution network. In a traditional distribution network, power flows in a one-way radial from the slack bus to the load side; meanwhile, a DG may make power flow in multiple directions from multiple points inside the distribution network, an occurrence which will raise the voltage (Su et al., 2014). Flexible and controllable equipment are present in active distribution networks (ADNs) and can improve the operation efficiency and management level of ADNs.
A soft open point (SOP) is a new type of power electronic equipment which consists of two back-to-back voltage source converters (VSCs) and can replace the traditional tie switch (Bloemink and Green, 2010). An SOP’s flexible control characteristics and rapid response capability effectively deal with renewable energy fluctuation. An SOP can transfer power flow and regulate reactive power, thereby promoting the access level of DGs. Energy storage (ES) transfers the electric energy through the storage and release of the said energy, a feature which can effectively reduce the operating cost of the ADNs under the time-of-use (TOU) electricity price environment (Imani et al., 2019). The battery module of the ES can be connected to the DC bus of the SOP through a DC–DC converter to form an SOP-based ES. By controlling two VSCs and one DC–DC converter, the SOP-based ES has multiple functions such as energy storage, power flow transfer, and reactive power regulation (Yao et al., 2018). Therefore, investigating the optimal operation of SOP-based ES for reducing the operation cost and improving the operation efficiency of ADNs is of great significance.
Numerous research achievements exist on the operation strategy of an SOP in the ADNs. Ref. (Cao et al., 2016) reduced the loss of the distribution network by controlling an SOP. In fact, the control ability of the SOP is reflected not only in the loss reduction, but also in its voltage regulation ability. Most studies consider both loss and voltage quality and adopt a multi-objective optimization model to solve the problem. Ref. (Long et al., 2016; Ji et al., 2017; Li et al., 2017; Qi et al., 2017; Ji et al., 2018; Li et al., 2019; Shafik et al., 2019) proposed a variety of multi-objective optimization operation models of the active distribution network and used an SOP to reduce the distribution network loss and improve system voltage deviation. Some studies also considered load balancing. In (Sun et al., 2021), a long-term and short-term two-stage distribution network optimization model is established by considering the uncertainty of the renewable energy output. In the long-term model, the minimum loss and voltage unbalance are taken as the optimization objectives, and the operation point of the SOP is obtained. Then, according to the actual output of renewable energy sources, the short-term model responds to the actual output of renewable energy through droop control. Ref. (Shafik et al., 2019) improves the renewable energy utilization efficiency by controlling the tie switch and SOPs. Ref. (Lou et al., 2020; Wang et al., 2020) further reduces the voltage unbalance in the unbalanced distribution network by controlling the three-phase power of SOPs. In (Chen et al., 2020; Ding et al., 2020), the SOP was used to enhance the service restoration ability of a distribution network. As for the reliability of the distribution network, (Escalera et al., 2020; Yan et al., 2020) shows that the substitution of an SOP for a tie switch can improve distribution network reliability, especially for ADNs with DGs. However, research on SOP-based ES operation strategy is scant, and only Ref (Yao et al., 2018) utilized an SOP-based ES to reduce the loss of ADNs. This approach does not maximize the ability of ESs to transfer power in time to reduce the operating cost of the ADNs. In addition, the frequent charge and discharge of ES directly affects the lifetime of the battery module (Tran and Khambadkone, 2013). Therefore, the influence of SOP-based ES on the operating cost of the ADNs and the consideration of the battery lifetime are necessary.
To fill the aforementioned gaps, an optimal operation model for an SOP-based ES in the ADNs with regard for battery lifetime is proposed in this article. The main contributions of this work can be summarized as follows:
(1) The active and reactive power equations of an SOP-based ES are established, and the cost of battery degradation is deduced.
(2) An optimal operation model is established and considers the power exchange cost, loss cost, and battery degradation cost of the distribution network. Moreover, the original mixed integer nonlinear programming (MINLP) problem is transformed into a mixed integer linear programming (MILP) problem by linearization, thereby improving the solving efficiency and convergence.
(3) The effectiveness of the proposed optimization model is verified by the IEEE 33-node test system (Baran and Wu, 1989).
The remainder of this paper is organized as follows. The SOP-based ES is modeled in Section Modeling of SOP-Based ES. The optimal operation model of the SOP-based ES in the ADNs is established in Section Problem Formulation. Case studies are presented in Section Case Studies. Conclusions are drawn in Section Conclusion.
Modeling of SOP-Based ES
Active and Reactive Power Equations of the SOP-Based ES
The structure of an SOP-based ES is shown in Figure 1. The SOP-based ES has two VSCs and a DC–DC converter. The DC sides of the two VSCs are connected with the DC–DC converter, the AC sides are connected to the feeders, and the other side of the DC–DC converter is linked to the battery. The SOP-based ES can transfer the active power between feeders and store energy, and the AC side of VSCs can also regulate the reactive power. The power of the SOP-based ES meets the following constraints (Yao et al., 2018):
where Pti,VSC and Pti,VSC are the active power injections of VSC i and j at time t. Ptm,ES is the active power consumption of the ES. PL,ti,VSC and PL,tj,VSC are the power losses of VSC i and j, respectively. PL,tm,DC is the power loss of the DC–DC converter ij. Ai,VSC, Aj,VSC and Aij,DC are the power loss coefficients. Qti,VSC and Ptj,VSC are the reactive power injections of VSC i and j. Si,VSC, Sj,VSC, and Sij,DC are the capacities of the VSC and DC–DC converter. Qmini,VSC and Qmaxi,VSC are the minimum and maximum reactive power injections of VSC i. Qminj,VSC and QmaxJ,VSC are the minimum and maximum reactive power injections of VSC j.
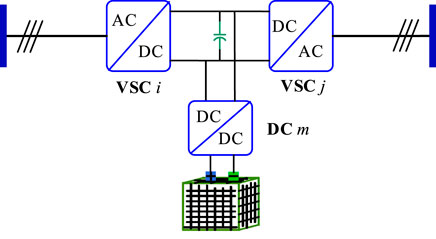
FIGURE 1. The structure of SOP-based ES.
Eq. 1 is the active power balance of the SOP-based ES. Eq. 2 is the power loss equation. Eqs. 3, 4 are the capacity and reactive power constraints, respectively.
ES must also meet the following constraints:
where Ptm,ch,ES and Ptm,dis,ES are the charging and discharging powers of ES m. λtm is a binary variable if ES m is in the charging state, λtm =1, otherwise, λtm =0. SoC tm is the state of charge of ES m, and SoC 0m is the initial SOC. Δt is the time interval and equals one hour in this work. Capm is the energy capacity of ES m. ηm,ES is the ES efficiency. M is a sufficiently large number. SoCminm and SoCminm are the SOC limits of ES m. T is the total time intervals of an operation cycle.
Eq. 5 is used to obtain the charging and discharging powers. Eq. 6 is the relationship between SOC and the charging and discharging powers. Eq. 8 is the lower and upper limits of SOC. Eq. 9 indicates the SOC of ES in the last time interval and equals the initial SOC.
Lifetime Model of the Battery
The depth of cycle discharge is the key factor affecting the battery lifetime (Tran and Khambadkone, 2013). The charge and discharge cycles of a battery constitute the process from discharging to charging. That is,
where cyctm is a binary variable and indicates the battery changes from a discharging to a charging state when cyctm = 1.
The cycle discharge depth dt−1m,cyc of the battery refers to the discharge depth dt−1m at the moment before charging and can be expressed as
The cycle life Ntm,d of the battery can be expressed as the cycle discharge depth. That is,
where N0 is the cycle number of the charge and discharge of a battery at 100% discharge depth. kp is a constant that usually between 1.1 and 2.1 (Tran and Khambadkone, 2013; Duggal and Venkatesh, 2014).
The equivalent life degradation Nm,de of the daily charge and discharge cycle can be expressed as (Duggal and Venkatesh, 2014)
The battery cycle life in years Tm,life and the daily degradation cost Cm,ES can be formulated as:
where Cm,inv,ES is the investment cost of ES and r is discount rate.
Problem Formulation
Optimization Model
The objective function is to minimize the total daily operation cost C, including the power exchange cost, network loss cost, and battery degradation cost.
where ctb, ct s, and cL are the electricity purchase price, electricity selling price, and loss cost, respectively. Ptb,grid and Ptb,grid are the active power purchase and selling.
The constraints of the optimization model include the power flow, PV generation, and network operation constraints.
Linearized DistFlow Equations
The power flow equations of an ADN can be expressed as
where
PV Generations Constraints
where
Network Operation Constraints
where Vmin and Vmax are the minimum and maximum node voltages, respectively.
Model Linearization
Constraints Eqs. 2, 3, 13–15, 23, 24, 28 are nonconvex and nonlinear, and will affect the solution efficiency and convergence. Linearization can help solve this problem.
Constraints Eqs. 14, 15 can be approximately treated as the following linear function (He et al., 2017)
where Lm,de and Km,de are linear parameters that can be obtained by linear fitting.
The power function terms z = yσ (σ > 1) in Constraints Eqs. 13, 23, 24 are linearized as Eq. 30 (Wang et al., 2020),
where
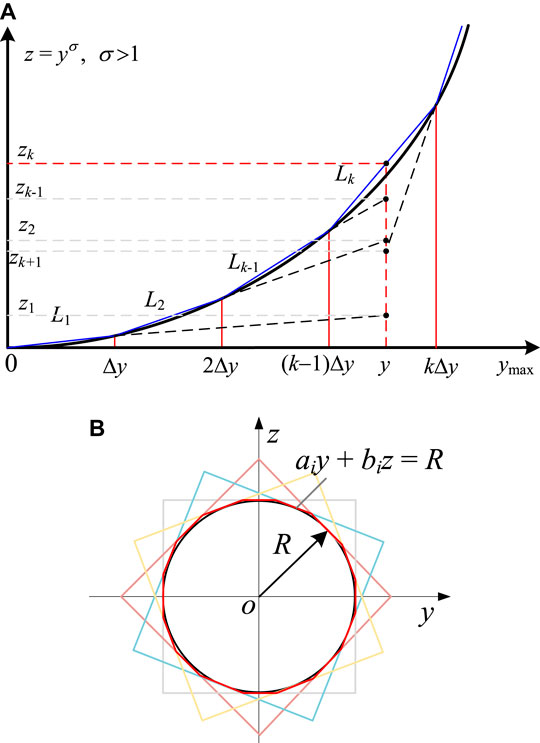
FIGURE 2. Piecewise linearization for the power function term and circle term; (A) power function term; and (B) circle term.
The circle terms in Constraints Eqs. 2, 3, 28 can be linearized with the replacement of a regular polygon, as shown in Figure 2B. Constraint Eq. 2 is an equation constraint and should be relaxed to an inequality constraint (Yao et al., 2018). These convex second-order conic models y2 + z2 ≤ R2 can be linearized as follows:
where ai and bi are the linear equation coefficients.
The absolute value constraint in Constraint Eq. 2 can be linearized as follows:
Case Studies
The IEEE 33-node test system is used to verify the feasibility and efficiency of the proposed model. The simulation program is tested on the MATLAB R2016b-YALMIP platform (Lofberg, 2004), and the optimization models are solved by CPLEX (IBM ILOG CPLEX Optimization Studio, 2020). YALMIP is an open source software that provides interfaces for MATLAB and solvers. CPLEX is a mathematical programming solver developed by IBM and can effectively solve MILP problems. The hardware device is a computer with Intel Core i7-8700 @ 3.2 GHz and 16 GB RAM.
Parameter Settings
The IEEE 33-node system has two SOP-based ESs and eight PV generations (Figure 3). The system parameters can be found in (Baran and Wu, 1989). Each SOP-based ES include two VSCs, a DC–DC converter and an ES. The capacity of each VSC is 300 kVA, and the DC–DC capacity is 300 kW. The energy capacities of ES one and two are both 2000 kWh. The power loss coefficient of the VSC and DC–DC converter is 0.02. The capacity PV converter is 500 kVA. The voltage limits are (0.95, 1.05) p.u.. The load demand and PV generation and electricity price are shown in Figures 4, 5, respectively. The network loss cost is $0.5/kWh. The investment cost of the ES one and two are both $200/kWh, the cycle number of ES one and two N0 = 1,591, and the constant kp = 2.09. The initial SOC values of ES one and two are both 0.5, and the minimum and maximum SOC values of ES one and two are 0.2 and 0.9, respectively.
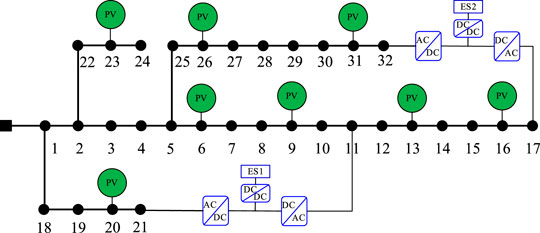
FIGURE 3. IEEE 33-node system with SOP-based ES and PV generations.
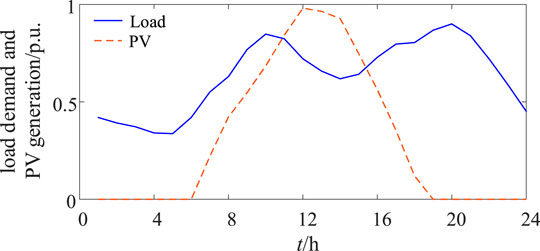
FIGURE 4. Load demand and PV generation.
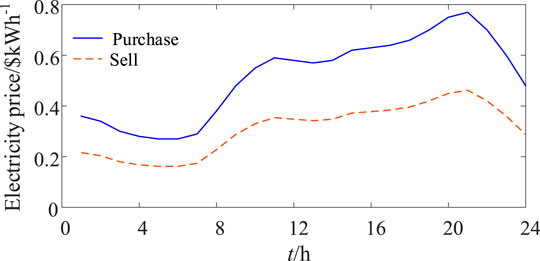
FIGURE 5. Daily electricity price.
Optimization Results Analysis
Four cases are used to evaluate the effect of the SOP-based ES and battery degradation.
Case 1: Without SOP-based ES.
Case 2: Two SOPs exist in the system, and no ES connects to the SOP DC side.
Case 3: Two SOP-based ESs exist in the system (Figure 4), and the battery degradation is not considered.
Case 4: Two SOP-based ESs exist in the system (Figure 4), and the battery degradation is considered.
The optimization results are shown in Table 1. As no ES exists in Cases 1 and 2, the difference in the TOU electricity price cannot be fully utilized to reduce the operating cost of the ADN. The SOP in Case 2 reduces power losses, thereby resulting in lower power purchase costs and loss costs and increase in revenue from electricity sales. Therefore, the total cost in Case 2 is slightly lower than that in Case 1 and the total cost is highest for Case 1. In Cases 3 and 4, the operating cost of the ADN is reduced by controlling the storage and release of energy. Although SOP-based ES loss is included in Cases 3 and 4, the total loss cost is lower than that in Cases 1 and 2. Given that SOP-based ES can balance the feeder load and compensate for reactive power, this feature helps reduce the line loss. In addition, the ES degradation cost is considered in Case 3, so the degradation cost in Case 3 is lower than that in Case 2. The cycle life of ES one and of ES two in Case 3 can reach 15.1 and 10.7 years, respectively. By contrast, the cycle life of ES one and of ES two in Case 2 are only 8.3 and 7.5 years, respectively.

TABLE 1. Optimization results.
Figure 6 depicts the maximum and minimum voltage profiles of ADN in Cases 1–4. In Case 1, the maximum voltage of Nodes 8–17 violates the voltage upper limit, while the minimum voltage is less than the voltage lower limit. Given the peak output of PV generation, the power flow reverses, thereby causing the voltage at the end node to rise. When the PV output is low, the load causes the voltage to decrease. The SOP in Case 2 improves the voltage profile by transferring power flow and adjusting reactive power, but some nodes (Nodes 12–17 and 28–32) still violate the voltage constraint. However, the SOP-based ESs in Cases 2 and 3 not only have the functions of transferring active power and regulating reactive power, but also have the ability to store and release active power, so the voltage profile is significantly improved.
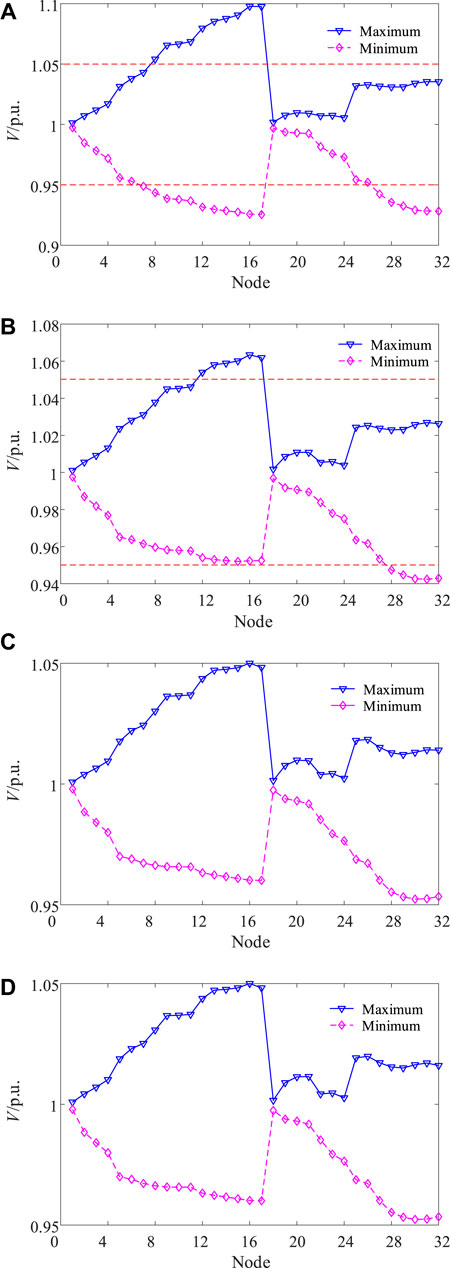
FIGURE 6. Voltage profile of ADN in Cases 1–4; (A) Case 1, (B) Case 2, (C) Case 3 and (D) Case 4.
The SOC of ESs one and two in Cases 3 and 4 are shown in Figure 7. The ESs are in the charging state from t = 4 to 6 h because of the low price of electricity. In t = 9 and 10 h, the ESs discharge because electricity prices and load demand increase. From t = 12 to 14 h, the SOC increases again because the PV output increases but the load decreases. From t = 19 h, the ES discharged due to the increased load. Moreover, the SOC in Case 3 is higher than that in Case 2, a situation which can avoid excessive discharge and extend the battery life.
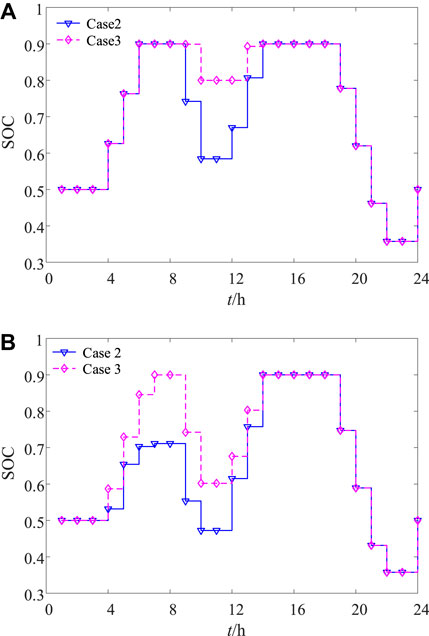
FIGURE 7. The SOC of ES in Cases 2 and 3, (A) ES 1, and (B) ES 2.
Figure 8 depicts the active power of the SOP-based ESs in Case 3. The active power of VSC 21 and ES one are positive and negative, respectively, from t = 4 to 6 h. Thus, the SOP-based ES one transfers the active power from Node 21 to ES 1. As the PV output is 0 and Node 21 is close to the slack bus, Node 11 is far from the slack bus with a lower voltage. Similarly, SOP-based ES two mainly transfers the active power from Node 32 to ES two at this period. From t = 9 h, the ES starts to discharge. As the PV output is higher, the voltage at the end nodes of the branch increases, so VSCs 21 and 32 inject active power, while VSCs 11 and 17 absorb active power. From t = 12 h, the ESs start to charge again when the PV output is highest. Given that VSC 21 is close to the balance node, the active power of VSC 21 is injected into Node 21, while other VSCs absorb active power. From t = 18 h, the PV output is 0, and the voltage at the end node is relatively low. Thus, VSC 21 absorbs active power, whereas other VSCs inject active power.
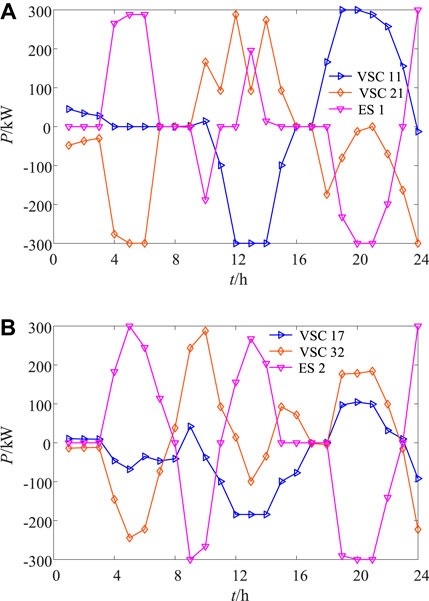
FIGURE 8. Active power of SOP-based ESs in Case 4; (A) SOP -based ES 1, (B) SOC-based ES 2
Figure 9 shows the reactive power of SOP-based ESs in Case 4. When the PV output is low or absent (t = 1–6 h and 19–24 h), all the output reactive power of VSCs improves the system voltage and reduces the power loss. When the PV output is high (t = 11–16 h), power flow reverse leads to voltage increase and the VSC absorption reactive power reduces system voltage.
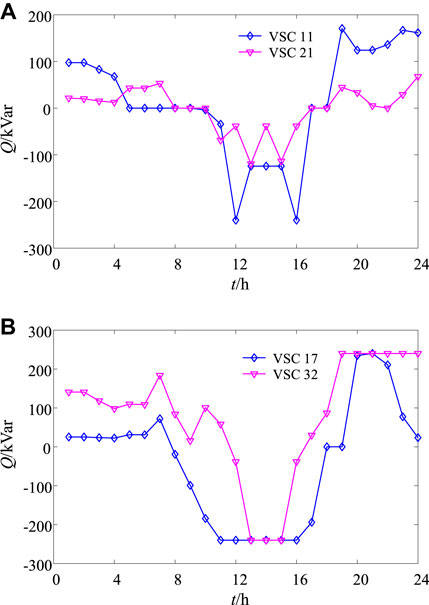
FIGURE 9. Reactive power of SOP-based ESs in Case 4 (A) SOP -based ES one and (B) SOC-based ES 2
Computing Performance
To verify the validity and convergence of the proposed linearized model, Table 2 provides the comparison of optimization results and the computing time between the proposed MILP model and the original MINLP model solved by Knitro (Artelys Knitro, 2020). The solving efficiency of the MILP model is noticeably improved by linearization. The original MINLP problem is a nonconvex one for which obtaining the optimal solution is difficult. The nonconvex problem is transformed into a convex optimization problem by linearization, and its convergence is further improved.

TABLE 2. Convergence and solving efficiency of different models.
Conclusion
In this study, the optimization operation model of SOP-based ESs in ADNs is presented, and the battery degradation cost is considered. The effectiveness and performance of the proposed model is validated by case studies. The ability of SOP-based ESs to transfer power in time and space not only promotes the integration of DG, but also reduces the operating cost of the ADNs. By considering the battery degradation cost in the optimization model, excessive discharge can be avoided and battery life can be prolonged. The MILP proposed in this paper further improves the solving efficiency and convergence of the optimization model and helps identify the optimal solution. The research in this work is helpful for improving the operation management of ADNs and promoting the further development of renewable energy.
Data Availability Statement
The original contributions presented in the study are included in the article/Supplementary Material, further inquiries can be directed to the corresponding author.
Author Contributions
JW: Software, Validation, Writing- Original draft preparation NZ: Supervision, Writing-Reviewing and Editing AT: Data curation QW: Investigation, Conceptualization, Methodology.
Funding
This work was supported by the National Natural Science Foundation of China (Grant No. 52077017), Chongqing Technology Innovation and Application Development Special Key Project (cstc2019jscx-mbdxX0017) and the Fundamental Research Funds for the Central Universities (Grant No. 2019CDXYDQ0010).
Conflict of Interest
The authors declare that the research was conducted in the absence of any commercial or financial relationships that could be construed as a potential conflict of interest.
References
Artelys Knitro (2020). Available at: https://www.artelys.com/solvers/knitro/.
Badran, O., Mokhlis, H., Mekhilef, S., Dahalan, W., and Jallad, J. (2018). Minimum switching losses for solving distribution NR problem with distributed generation. IET Gener., Transm. Distrib. 12 (8), 1790–1801. doi:10.1049/iet-gtd.2017.0595
Baran, M. E., and Wu, F. F. (1989). Optimal capacitor placement on radial distribution systems. IEEE Trans. Power Deliv. 4 (1), 725–734. doi:10.1109/61.19265
Bloemink, J. M., and Green, T. C. (2010). “Increasing distributed generation penetration using soft normally-open points,” in 2010 IEEE Power and Energy Society General Meeting, Providence, RI, July 25–29, 2010 (Piscataway, NJ: IEEE). doi:10.1109/pes.2010.5589629
Cao, W., Wu, J., Jenkins, N., Wang, C., and Green, T. (2016). Operating principle of soft open points for electrical distribution network operation. Appl. Energy 164 (15), 245–257. doi:10.1016/j.apenergy.2015.12.005
Chen, W., Lou, X., Ding, X., and Guo, C. (2020). Unified data‐driven stochastic and robust service restoration method using non‐parametric estimation in distribution networks with soft open points. IET Gener., Transm. Distrib. 14 (17), 3433–3443. doi:10.1049/iet-gtd.2019.1895
Ding, T., Wang, Z., Jia, W., Chen, B., and Shahidehpour, M. (2020). Multiperiod distribution system restoration with routing repair crews, mobile electric vehicles, and soft-open-point networked microgrids. IEEE Trans. Smart Grid 11 (6), 4795–4808. doi:10.1109/tsg.2020.3001952
Duggal, I., and Venkatesh, B. (2014). Short-term scheduling of thermal generators and battery storage with depth of discharge-based cost model. IEEE Trans. Power Sys. 30 (4), 2110–2118. doi:10.1109/TPWRS.2014.2352333
Escalera, A., Prodanović, M., Castronuovo, E. D., and Roldan-Perez, J. (2020). Contribution of active management technologies to the reliability of power distribution networks. Appl. Energy 267, 114919. doi:10.1016/j.apenergy.2020.114919
Habibollahzade, A., Houshfar, E., Ashjaee, M., Behzadi, A., Gholamian, E., and Mehdizadeh, H. (2018). Enhanced power generation through integrated renewable energy plants: solar chimney and waste-to-energy. Energy Convers. Manag. 166, 48–63. doi:10.1016/j.enconman.2018.04.010
He, G., Chen, Q., Kang, C., Pinson, P., and Xia, Q. (2017). Optimal bidding strategy of battery storage in power markets considering performance-based regulation and battery cycle life. IEEE Trans. Smart Grid 7 (5), 2359–2367. doi:10.1109/TSG.2015.2424314
IBM ILOG CPLEX Optimization Studio (2020). Available at: https://www.ibm.com/products/ilog-cplex-optimization-studio.
Imani, M. H., Niknejad, P., and Barzegaran, M. R. (2019). Implementing Time-of-Use Demand Response Program in microgrid considering energy storage unit participation and different capacities of installed wind power. Elec. Power Syst. Res. 175, 105916. doi:10.1016/j.epsr.2019.105916
Ji, H., Wang, C., Li, P., Ding, F., and Wu, J. (2018). Robust operation of soft open points in active distribution networks with high penetration of photovoltaic integration. IEEE Trans. Sustain. Energy 10 (1), 280–289. doi:10.1109/TSTE.2018.2833545
Ji, H., Wang, C., Li, P., Zhao, J., Song, G., Ding, F., et al. (2017). An enhanced SOCP-based method for feeder load balancing using the multi-terminal soft open point in active distribution networks. Appl. Energy 208, 986–995. doi:10.1016/j.apenergy.2017.09.051
Li, P., Ji, H., Wang, C., Zhao, J., Song, G., Ding, F., et al. (2017). Coordinated control method of voltage and reactive power for active distribution networks based on soft open point. IEEE Trans. Sustain. Energy 8 (4), 1430–1442. doi:10.1109/tste.2017.2686009
Li, P., Ji, H., Yu, H., Zhao, J., Wang, C., Song, G., et al. (2019). Combined decentralized and local voltage control strategy of soft open points in active distribution networks. Appl. Energy 241, 613–624. doi:10.1016/j.apenergy.2019.03.031
Lofberg, J. (2004). “YALMIP: a toolbox for modeling and optimization in MATLAB,” in 2004 IEEE international conference on robotics and automation (IEEE Cat. No. 04CH37508), New Orleans, LA, September 2–4, 2004 (Piscataway, NJ: IEEE), 284–289.
Long, C., Wu, J., Thomas, L., and Jenkins, N. (2016). Optimal operation of soft open points in medium voltage electrical distribution networks with distributed generation. Appl. Energy 184, 427–437. doi:10.1016/j.apenergy.2016.10.031
Lou, C., Yang, J., Li, T., and Vega-Fuentes, E. (2020). New phase‐changing soft open point and impacts on optimising unbalanced power distribution networks. IET Gener., Transm. Distrib. 14 (23), 5685–5696. doi:10.1049/iet-gtd.2019.1660
Naderi, Y., Hosseini, S. H., Ghassem Zadeh, S., Mohammadi-Ivatloo, ., and Guerrero, J. M. (2018). An overview of power quality enhancement techniques applied to distributed generation in electrical distribution networks. Renew. Sustain. Energy Rev. 93, 201–214. doi:10.1016/j.rser.2018.05.013
Qi, Q., Wu, J., and Long, C. (2017). Multi-objective operation optimization of an electrical distribution network with soft open point. Appl. Energy 208, 734–744. doi:10.1016/j.apenergy.2017.09.075
Shafik, M. B., Chen, H., Rashed, G. I., El-Sehiemy, R. A., Elkadeem, M. R., and Wang, S. (2019). Adequate topology for efficient energy resources utilization of active distribution networks equipped with soft open points. IEEE Access 7, 99003–99016. doi:10.1109/access.2019.2930631
Su, X., Masoum, M. A. S., and Wolfs, P. J. (2014). Optimal pv inverter reactive power control and real power curtailment to improve performance of unbalanced four-wire lv distribution networks. IEEE Trans. Sustain. Energy 5 (3), 967–977. doi:10.1109/tste.2014.2313862
Sun, F., Ma, J., Yu, M., and Wei, W. (2021). Optimized two-time scale robust dispatching method for the multi-terminal soft open point in unbalanced active distribution networks. IEEE Trans. Sustain. Energy 12 (1), 587–598. doi:10.1109/tste.2020.3013386
Tran, D., and Khambadkone, A. M. (2013). Energy management for lifetime extension of energy storage system in micro-grid applications. IEEE Trans. Smart Grid 4 (3), 1289–1296. doi:10.1109/tsg.2013.2272835
Wang, J., Zhou, N., Ran, Y., and Wang, Q. (2020). Reducing the active power curtailment of distributed generation based on soft open points in unbalanced distribution networks. IET Renew. Power Gener. 14, 3252. doi:10.1049/iet-rpg.2020.0301
Yan, F., Chen, X., Tang, W., Yan, R., and Wu, H. (2020). Reliability and power supply capability evaluation of active distribution networks with four‐terminal soft open points. IET Smart Grid 3 (5), 657–666. doi:10.1049/iet-stg.2019.0353
Yao, C., Zhou, C., Yu, J., Xu, K., Li, P., and Song, G. (2018). A sequential optimization method for soft open point integrated with energy storage in active distribution networks. Energy Procedia 145, 528–533. doi:10.1016/j.egypro.2018.04.077
Zhang, C., Xu, Y., and Dong, Z. Y. (2019). Robustly coordinated operation of a multi-energy micro-grid in grid-connected and islanded modes under uncertainties. IEEE Trans. Sustain. Energy 11 (2), 640–651. doi:10.1109/TSTE.2019.2900082
Keywords: active distribution networks, soft open point, energy storage, battery lifetime, optimal operation
Citation: Wang J, Zhou N, Tao A and Wang Q (2021) Optimal Operation of Soft Open Points-Based Energy Storage in Active Distribution Networks by Considering the Battery Lifetime. Front. Energy Res. 8:633401. doi: 10.3389/fenrg.2020.633401
Received: 25 November 2020; Accepted: 29 December 2020;
Published: 10 February 2021.
Edited by:
Hao Yu, Tianjin University, ChinaReviewed by:
Qunhai Huo, Chinese Academy of Sciences, ChinaLu Zhang, China Agricultural University, China
Copyright © 2021 Wang, Zhou, Tao and Wang. This is an open-access article distributed under the terms of the Creative Commons Attribution License (CC BY). The use, distribution or reproduction in other forums is permitted, provided the original author(s) and the copyright owner(s) are credited and that the original publication in this journal is cited, in accordance with accepted academic practice. No use, distribution or reproduction is permitted which does not comply with these terms.
*Correspondence: Qianggang Wang, eWl0YWdvdUBjcXUuZWR1LmNu