 Alessandro Martulli
 Ray Galvin
 Franco Ruzzenenti
- 1Integrated Research on Energy, Environment and Society, Faculty of Science and Engineering, University of Groningen, Groningen, Netherlands
- 2Institute for Future Energy Consumer Needs and Behavior, Aachen, Germany
In the last four decades the European truck industry has made remarkable progress in energy efficiency, but this higher efficiency has failed to materialize in lower consumption per unit of load and distance (Tkm). One possible explanation is rebound effects due to average traveling speed and power enhancements. An original set of data covering forty years of truck tests of 526 commercial vehicles and 28 different European brands shows that energy efficiency (fuel economy) of heavy-duty trucks improved by 43% and (engine) power by 44%. We propose exergy as a metric to capture both dimensions and estimate that exergy efficiency increased by 73% over the same period, with an estimated speed rebound effect generally positive among the trucks tested on road conditions. Rebound effects caused by increased speed add to other sources of rebound like load, distance and frequency of journeys to potentially undermine gains delivered by higher energy efficiency. Our results provide evidence of the existence in the transport sector of a trade-off between power and efficiency as theoretically described by finite-time thermodynamics.
Introduction
Transport is a key activity of the economic sector and has undergone rapid growth during the past century. Due to its importance and its dependence on fossil fuels, the transport sector is responsible for about 19% of global energy use and 21% of CO2 emissions, and it is expected that energy use and emissions will increase by 50% by 2030 and 80% by 2050 (IEA, 2015). Within the sector, freight transport accounts for 40% of global energy use in transport and 10% of energy-related CO2 emissions (IPCC, 2014). Furthermore, the fuel demand of the road freight transport sector is expected to rise in the next years. This represents a potential threat to the environmental burden considering that, in the European Union alone, trucks and vans are responsible for about 60% of the GHG emissions related to transport (McKinnon, 2010; De Borger and Mulalic, 2012).
The attention of policy regulators on monitoring energy efficiency in the road freight transport sector has been marginal, with the idea that commercial vehicle operators are more conscious of fuel costs than private drivers. There has always been a widespread belief that, in theory, policy intervention has not been necessary because the market could ensure optimum efficiency (Kojima and Ryan, 2010). In January 2007, the worldwide harmonized heavy-duty certification (WHDC) test procedures for fuel efficiency of heavy-duty vehicles were developed as a global technical regulation from UNECE (United Nations Economic Commission for Europe). To date, Japan and the United States remain the only countries to have introduced heavy-duty vehicle fuel efficiency standards. On February 19, 2019, representatives of the European Commission, the European Parliament, and the European Council agreed on a compromise for setting carbon dioxide emission standards for new heavy-duty vehicles (HDVs) for the first time in the European Union (European Parliament, 2019).
So far, the lack of interest of the public regulator has rested on the conviction that the energy efficiency performance (i.e., the distance and tonnage of freight carried for each unit of energy input) of commercial vehicles has been improving thanks to the invisible hand of the market, but was this the case? According to ENERDATA (2020), in 1998, the average specific consumption (L/100 km) of diesel trucks in European countries spanned from a minimum of 27.02 for Portugal to a maximum of 38.43 for Sweden. In 2012, the maximum was still 38.00 (Croatia) and the minimum 21.55 (Latvia), with an average yearly decline across EU28 countries of merely 0.4%. With respect to the average unit consumption of diesel trucks (toe/vehicle), figures are even more enigmatic, showing, during the same period, significant yearly improvement for Austria (−4.81%), Belgium (−1.68%) and Netherlands (−1.76%); a mild improvement for Denmark (−0.74%), Ireland (−0.25%) and Greece (−0.24%); and an increase for Lithuania (+3.05%), Estonia (+5.99%) and Malta (+0.76%). For the other European countries, values were not reported or are too volatile to be reliable. As seen from this data, which draw directly from national agencies, there has been no clear trend in the efficiency performance of trucks in Europe over recent decades. This is despite steady technical increases in the energy efficiency of the vehicles’ engines and drive trains, as we will show.
Despite the relevance of road freight transport to efficiency and the related environmental consequences due to its energy consumption, few research studies have addressed the energy efficiency subject in relation to this sector. The works that have been carried out have focused on a defined country road freight energy efficiency, namely for Italy (Danielis, 1995), Germany (Leonardi and Baumgartner, 2004), France and the United Kingdom (Kamakaté and Schipper, 2009; Sorrell and Stapleton, 2018), Finland (Liimatainen and Pollanen, 2010) and Spain (Andrés and Padilla, 2015). Within the diverse analyses performed, generally, two different indicators were employed for summarizing energy efficiency: energy intensity (ratio between energy and economic services, e.g., amount of fuel per Tkm) and fuel economy (ratio between energy and work, e.g., L/100 km). Moreover, two main approaches were used in freight transport efficiency evaluation: top-down and bottom-up approaches. The former considers the total distance traveled yearly by a defined vehicle category, divided by the fuel consumed. The latter uses data on truck tests performed, usually under standard conditions, hence provides specific information on each model vehicle’s performance. Both methods were tested by Ruzzenenti and Basosi (2008) while evaluating the energy efficiency improvements of the European road freight fleet; their findings show the dramatic increase in energy efficiency performance of trucks. Nevertheless, none of the previously published studies analyzed the contrast between increases in energy efficiency and the relatively stable (or growing) road-transport energy consumption. In this contribution, we offer insights into the evolution of European trucks’ technical energy efficiency performance by constructing a database of road freight vehicles tested over the last forty years. Furthermore, to address the ongoing debate of energy efficiency improvements that have not materialized in reduced energy consumption, we propose a novel metric: exergy efficiency (Box 1). We demonstrate how this measure can simultaneously embrace changes in efficiency and power; we then explore the interplay of these factors by estimating a speed rebound effect revealed in on-road test data and how such an effect could partially explain the shortfall in expected fuel reduction.
The remainder of this paper proceeds as follows. In Data, we introduce the empirical dataset of truck performance and estimate changes in efficiency performance of this fleet over the past two decades. In Exergy Analysis, we estimate the exergy efficiency of vehicles and use these results for estimating speed rebound effects in Speed Rebound Effect; in Discussion, we discuss the speed rebound estimation results, and in Conclusion, we draw some conclusions and suggest avenues for further research.
Data
We present here an unpublished dataset produced by a specialized magazine, TuttoTrasporti, which has been carrying out tests since the late 1970s, with a documented and consistent methodology, to assess trucks’ absolute (i.e., ideal) performance (short-track) and real, on-road (long-track) fuel consumption (Figure 1).
Box 1Units and terms used in this paper as defined by the authors.
Fuel intensity: (L/(100 km*ton)) fuel consumption per unit distance and weight, often popularly called “fuel economy”
Fuel efficiency: The reciprocal of fuel intensity
Fuel exergy: Instantaneous exergy uptake (kW)
Specific consumption: Fuel consumption per unit distance (L/100 km)
Energy efficiency: A general expression for energy services delivered per unit of energy used
Exergy efficiency: Rate of fuel exergy converted into work
Unit consumption (toe/vehicle, ton of oil equivalent per vehicle) –per unit of time (year)
Efficiency performance: A general term for the ensemble of output parameters of vehicle journeys
Journeying fuel intensity: Fuel economy in L/100 km–the same as specific consumption (but averaged over whole journeys)
Rated power: The maximum engine power at the drive-shaft as declared by the manufacturer (kW)
Absorbed power: The total work (drag and rolling resistance) done by the vehicle to maintain a speed of 80 km/h in standard conditions (kW)
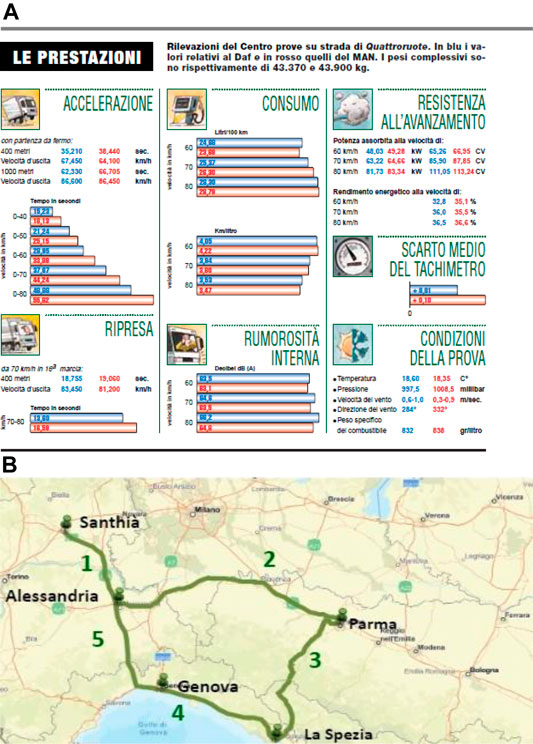
FIGURE 1. Performance and on-road test. The data refers to two different tests, generally performed on two successive days with the same vehicle and setting: 1) performance test (short-track) performed always on the same flat and straight stretch of road, with monitored environmental conditions (temperature, humidity and wind) and data gathered with specific instruments (UNI-EN Iso 9001:2008) at different speeds/accelerations ((A), source: (TuttoTrasporti), 210, September 1999). Absorbed power is assessed by launching the fully loaded truck at the speed of 85 km/h and measuring the work done from 80 km/h until it stops by inertia. 2) on-road test (long-track) performed on four highway-routes, with mixed road conditions of slope and speed. The example (B) shows the route Santhià-Alessandria-La Spezia, with a total of 544.2 km. The fuel consumption measurement is carried out with an on-board flow meter. This tool can be installed on the power circuit or, as happens more often, it is the on-board computer that measures the time and openings of the injectors and calculates the quantity of diesel per cylinder every cycle. A second measurement of the fuel consumed is conducted at the end of the test, when the truck tank is refuelled at the same gas station and position used before the departure (the precise position is recorded by tracking specific signs on the road). The assessment is done with a thermometer sensor by adjusting the volume growth of the heated fuel during the test due to the injector’s return.
Performance Test
The recorded performance data between 1979 and 2018 of 526 commercial vehicles covering 28 different European brands are grouped according to three size-categories:
(1) Vans: commercial vehicles with weight <3.5 ton.
(2) Medium trucks: vehicles with weight above 3.5 ton and below 40 ton.
(3) Heavy-duty trucks: vehicles with weight >40 ton.
While vans and heavy-duty trucks show a remarkable efficiency improvement, having halved their average fuel intensity over the years of the tests, medium trucks improved by only 8%. However, it should be noted that medium trucks display a wide variety of function/service as well as a variety of vehicles’ design purpose, from food delivery to earthmoving. Grouping them according to the maximum weight load is thus misleading. This is clear by observing the standard deviations of the annual samples, which are sometimes wider than 100%, and no clear trend over time can be deduced (Figure 2). Vans and heavy-duty trucks, however, exhibited much lower variability and showed the sharpest increases in efficiency in the first 15 y. This trend among heavy-duty trucks is the most consistent over time, leading to a constant improvement in efficiency over time. The fuel intensity of light-duty trucks halved (−50%), and that of heavy-duty trucks improved by 43%. However, the much-marked increase in exergy efficiency hints that part of the available energy made available by advances in engine performance did not deliver lower fuel intensity.
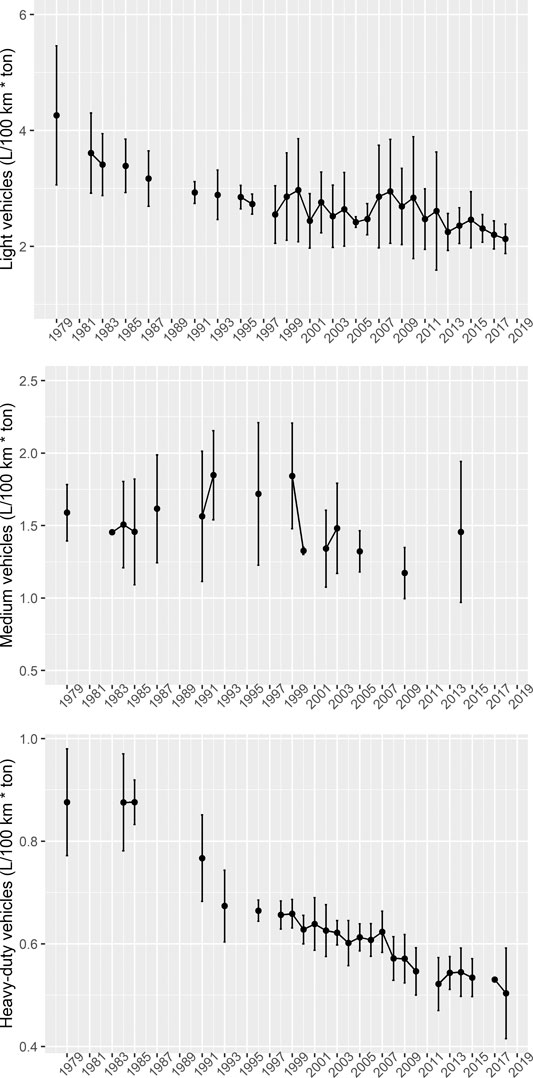
FIGURE 2. Trend in fuel intensities (L/100 km*t; 1978–2018) for light, medium and heavy duty vehicles.
On-Road Test
After 1999 Tuttotrasporti also performed on-road tests consistently, enabling a thorough comparison with its idealized performance tests. The on-road tests, for the necessity of accurate comparison, are adjusted to compensate for the presence of unplanned events such as congested traffic, roadworks, unexpected braking or other types of incident. Tests are always performed on highway roads, and possible fuel consumption on other types of road is not taken into consideration. As regards the climate conditions, the test is always conducted regardless of weather, except in the presence of extreme events (e.g., heavy rainfall). Since the manufacturers do not provide truck models for testing during the winter season, the on-road test has never been performed in the presence of snow.
The truck under evaluation during the performance is always driven by an experienced driver of Tuttotrasporti with the assistance of a driver employed by the manufacturer of the specific truck tested. In the last 20 years, only two truck drivers have been employed in these tests, both with long-lasting experience in the heavy-duty truck industry.
In 20 years, an improvement in fuel economy of heavy-duty trucks of 22% did not materialize in lower on-road energy consumption, as journeying fuel intensity decreased by barely 7%. During the same period, the average maximum power of trucks increased by 25%. These figures tell us that efficiency, as measured in idealized tests, is not enough to understand the evolution of trucks’ performance, a notion confirmed by the much higher increase in exergy efficiency. Speed and acceleration, for example, affect vehicles’ energy consumption in a way that is undetectable when scaling for distance and mass (Galvin, 2016; Galvin, 2017). Other relevant factors are drivers’ comfort and behavior, which ultimately depend on power availability: a higher-power vehicle can provide more electricity for climatizing and more vivacity for driving, though this effect for trucks is arguably negligible. According to Fontaras et al. (2017), factors affecting vehicle’s performance can be grouped into: 1) vehicle characteristics and sub-systems; 2) environmental and traffic conditions; and 3) driver and user-related factors. As all tests here considered were performed in standard conditions, number two does not apply to the present study, but also with regard to number one and three, the random variations can be significantly reduced as the vehicles tested were new and all parameters were monitored. Furthermore, testers were professionals and often the same person tested a large sample of vehicles.
The concept of power-efficiency trade-off has been developed and studied in the methodologies of energy efficiency by Patterson (1996), who stated how, especially in the transport sector, the speed variable and the need to minimize travel time for goods and people is essential in developing an analysis of the energy consumption of the sector. In this respect, energy efficiency may be employed to save time by increasing the speed of the process and substituting energy for time (Herring and Roy, 2007). For example, while the average fuel intensity of heavy-duty trucks decreased (i.e., improved) by 43%, average power increased by 44%, from around 350 to more than 500 HP (horsepower); compression ratios increased from 15 to up to 20, but with almost the same average load factor (from 43.2 to 44 tons). What was all this extra power used for if vehicles carried much the same loads?
Exergy Analysis
Concept
To synthetically assess the effect of power enhancement on trucks’ performance, we estimated the exergy efficiency of heavy-duty trucks, i.e., the amount of exergy in fuel instantaneously converted into useful work.
Exergy is a measurement of the maximum (physical) work that can be extracted from a given energy source during a process that brings the entropy of the system to a maximum (i.e., to exergy destruction). The typical, most intuitive example is that of a suspended water reserve at an altitude h: the exergy content, in this case, coincides with the potential energy of a mass of water. At the ground level, the potential exergy is destroyed, and the kinetic exergy is at a maximum. When heat transfers are involved, exergy and energy can significantly differ: a huge mass of water at room temperature can have high internal energy, but no exergy. Vice versa, heating water with solar vacuum tubes is energetically efficient but exergetically inefficient, as it involves a very high exergy degradation to bring the temperature of solar beams to that of domestic hot water. In our analysis, we will compare the exergy content of the fuel (diesel) with the exergy content of the useful work, which is, in this case, the rolling and drag resistance encountered by the vehicle while moving at constant speed.
To simplify the analysis, we assumed that the fuel used in all the vehicles under consideration is Dodecane (Diesel—C_12 H_26, see Supplementary Material S3 for a sensitivity analysis thereof). In the following, we computed the availability of fuel supplied (Eq. 1) for the heavy-duty vehicles to measure the exergy instantaneously available to the truck. Due to data availability, for the present research only the power output (shaft or powertrain) availability is considered, namely, the maximum rated power as declared by the manufacturer. The reason behind this choice is related to the relationship between the energy of the engine and exergy of the fuel. Validation on validation offers a different exergy estimation, though on a limited number of trucks, and an assessment of the assumption above. Note that, regarding the vehicle’s mechanical work, there are no entropy losses, and the energy used for mechanical work equals the exergy use.
Methods
The first method calculates the mass flow rate of the fuel under consideration and its lower heating value (Katsanos et al., 2013):
where:
•
•
•
•
•
For each model of heavy-duty truck in the database, the technical specifications were considered to calculate the mass flow rate of the air and consequently derive the mass flow rate of the fuel. Engine displacement and maximum engine speed were used to compute the mass flow rate of air in the engine. In this case, a rule of thumb to estimate the air flow requires the multiplication of the engine displacement and the maximum RPM (revolutions per minute) of the engine, divided by a constant (3,456) (Baechtel, 2015). The result needs to be multiplied by the engine’s volumetric efficiency to get a realistic estimation of the airflow rate. In this respect, as data about the vehicles' volumetric efficiency were not available, an assumption was made: all the trucks were considered to have turbocharged diesel engines since this technology was introduced in the early 1980s (Ruzzenenti and Basosi, 2009). For this reason, the mass flow rate was multiplied by a factor of 1.5 for every vehicle of the database, as assumed in experimental studies on the calculation of mass air flow rate in turbocharged diesel engines (Miller, 2008). The mass fuel flow rate was then derived by using the stoichiometric air-fuel ratio, and it was used to calculate the availability of fuel supplied. The lower heating value of diesel for trucks changed in the period considered (CBS, 2017) (Table 1). A representation of the evolution of these values over the last 40 y is shown in Table 2. Finally, the specific fuel consumption (SFC) was computed using the mass fuel flow rate and the engine power.
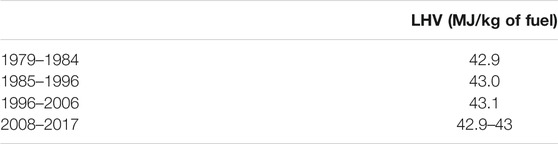
TABLE 1. Evolution of lower heating value of Diesel fuel (CBS, 2017).

Vehicles were grouped in samples of 5–10 elements. We calculated the SFC (Eq. 2) and the average availability of fuel supplied (fuel exergy, Eq. 1): the amount of fuel and exergy instantaneously used for every kW and vehicle. The average specific fuel consumption decreased over time along with the fuel exergy, by 42 and 20%, respectively. The percentage of fuel exergy supplied which is converted into power (shaft) availability, i.e., the maximum rated power, measures the exergy efficiency, and this increased from 22% in 1982 to about 37% in 2018 (Figure 3). Whereas the specific fuel (exergy) consumption improved by 42% over forty years, the exergy efficiency increased more than 73% during the same period, showing that engines became much more efficient in extracting useful work from the combustion of diesel, rather than just more efficient in converting this energy into vehicle’s motion Figure 3. This means that the reduction in fuel intensity of the trucks (−43%) underestimates the real efficiency improvement of conversion from chemical to mechanical energy in the trucks’ engines (+73%).
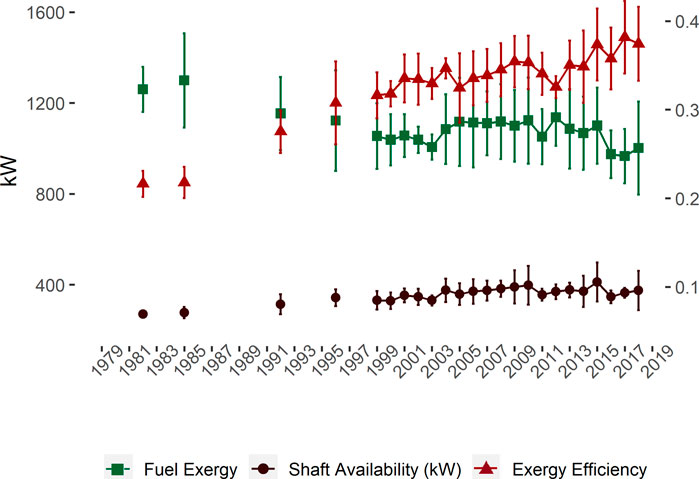
FIGURE 3. Breakdown of exergy efficiency in fuel exergy and power, heavy-duty trucks. Indicated with dots: fuel exergy (or availability of fuel supplied, Eq. 1, measured in kW); with triangles: power availability at shaft (left-hand axis, measured in kW); with squares: exergy efficiency as measured as the ratio between the two (right-hand axis).
Validation
To validate the assumption made to assess exergy efficiency, we used a second formula utilizing the vehicle’s specific fuel consumption and the absorbed power at the constant speed of 80 km/h (Supplementary Material S1). In this case, absorbed power (drag and rolling resistance) was measured contingent to fuel consumption in test conditions. Due to the availability of data, this method was applied only for a shorter time interval. The mathematical formulation used to calculate the chemical availability for diesel fuel (exergy of the fuel) is (Al-Najem and Diab, 1992):
where:
with:
• FC = fuel economy (L/100 km) at 80 km/h
• ρfuel = density of fuel = 750 (kg/m3)
• v = vehicle speed = 80 km/h
•
The first formula (Eq. 1) tends to overestimate SFC and fuel exergy by 10% on average (Table 2), which means that the previous estimation of the long-term exergy efficiency evolution of 73% is conservative (and could amount up to 79% increase considering an average gap of 10%). Assuming the same LHV for diesel throughout the entire period would reduce the exergy efficiency change by between 1 and 2% (see Supplementary Material S3). For the remainder of the article, the second formula will be used when possible, and it will be referred to as the SFC exergy formula.
Speed Rebound Effect
Methods
Rebound effects due to user behavior in transport can be decomposed into two main components, one concerning driving styles, such as the average speed and the acceleration patterns of travel, and secondly the distances of travel, i.e., change in origin-destination patterns (which clearly do not apply to drive tests). Owing to a recently proposed methodology aimed at assessing speed and distance rebounds, we investigate the influence of driving behavior as captured by an average speed-increase (Galvin, 2016; Galvin, 2017). The method used here defines the “speed rebound effects” as an “increase in average speed as a consequence of increased energy efficiency” (Galvin, 2017). We estimated rebound effect by comparing the fuel intensity and the speed variations at the years t1 and t2, where t1 and t2 are the first and last available records on the same route. The road tests, only available for heavy-duty trucks, also provide the actual energy consumption of the trucks at a defined average traveling speed for each track-length upon which it is possible to assess the rebound.
Formally, the speed rebound effect is defined:
where
where S is speed, ε is efficiency, and E is the energy consumed. The relationship between energy consumption and average speed is not always linear since acceleration is a critical component of determining average speed, and research shows that energy consumption increases with acceleration (Berry, 2010). After testing for non-linearity, we found the relationship between (average) speed and efficiency to be linear1 (M = 1). This implies that there was reasonable consistency in the acceleration patterns of the trucks during their test runs. The next section will address the acceleration effect as captured by power enhancement.
Results
In Table 3, results of speed rebound (evaluated on fuel intensity at 80 km/h, using Eq. 4) and exergy rebound (evaluated on exergy efficiency estimated with the SFC method) are reported for the four tracks evaluated.

TABLE 3. Speed rebound on energy (fuel intensity) and exergy efficiency.
A more in-depth investigation into the speed rebound was possible by comparing the on-road test performance of the evolution of the same truck over a defined number of years. For this analysis, when possible, we looked at how the same model performed in two different road-track records when enhancements were developed to justify a new test. In the record, we found 33 couples of comparable trucks. We could evaluate 14 trucks with the SFC method, and 11 showed a positive exergy rebound, five greater than one (backfire). The 19 remaining trucks, analyzed with the first method, showed a positive exergy rebound in 16 cases, nine of which showed backfire (see Supplementary Material S4).
One might expect that speed rebound is more sensitive to exergy efficiency variation as this captures power enhancement contrary to fuel economy. Indeed, speed rebound measured by fuel intensity and exergy are consistent, showing the same sign but not always the same magnitude (Table 3). For example, exergy rebound is higher in the second, third, and fourth track, but between 1999 and 2004 (first track), rebound on fuel intensity was higher. Thus, it is difficult to claim whether exergy with respect to energy is more informative for estimating speed rebound, though exergy, in most cases, is associated with a higher rebound.
Discussion
Of the four tracks examined, only the third, evaluated between 2008 and 2015, the longest timespan, exhibited a negative rebound. A negative rebound means that fuel consumption decreased more than one could expect by observing energy efficiency and speed variation. In all other cases, efficiency improvement rebounded, as also confirmed by observing the 33 pairs of truck models and their performance as enhancements were made. In 25 out of 33 cases, the same make and model tested on the same track showed a positive speed rebound when enhancements were introduced (Supplementary Material S4). Moreover, speed rebound measured on fuel intensity and exergy are consistent in that they show the same sign, though the same cannot be said with regards to their magnitudes. Sometimes the former delivers higher rebound, sometimes the latter. Thus, it is difficult to claim whether exergy with respect to energy is more informative for estimating speed rebound. A source of bias could be truck sampling. Indeed, by comparing the same model’s performances, 21 out of 33 showed a rebound increase when using exergy instead of energy efficiency, but more research is needed. The concept is that exergy should be a better basis for assessing speed rebound as it captures power enhancements and efficiency improvements.
The average maximum power of trucks increased in twenty years by 25%, an amount similar to the change in fuel intensity. Is this a clue to the notion that power enhancement absorbed efficiency improvement? It is also worth noting how this power peak was achieved in the first decade, and the average maximum power remained more or less constant after that (perhaps as a result of the oil price shock). During the second decade, apparently, fuel intensity improvements were more effective in translating into lower energy consumption. The same phenomenon can be observed in the trajectories of fuel efficiency as compared to exergy efficiency: during the last decade, exergy efficiency increased significantly because of a reduction of fuel exergy rather than an increase in shaft availability (Figure 3). Is this a sign that a virtuous path has been taken since the truck industry's last oil shock, to maximize efficiency rather than performance? Perhaps yes, but more research is needed to ascertain this tendency.
The main limitations of our research concern the sampling of the trucks, on the one hand, which may cause a source of bias and incoherence in the data set, and the specific conditions of the road tests, on the other hand, which span over a significant number of years and thus present diverse traffic and weather conditions. Furthermore, more rated power can rebound in multiple forms other than increased average speed. Here we have only estimated speed rebound, but a more aggressive acceleration pattern could also have contributed to lower than expected fuel reduction. We have addressed both power-rebound and the effects of environmental factors in fuel use in a second research project currently under review elsewhere.
Conclusion
In the 1950s, Chambadal and Novikov, two Russian nuclear physicists, estimated that nuclear plants work at a real efficiency much lower than the Carnot efficiency (Novikov, 1958). Their seminal work led to the development of a new branch of thermodynamics which modeled how thermic machines, such as power plants, in real conditions are designed to optimize power output rather than efficiency (Curzon and Ahlborn, 1975).
In the framework of finite-time thermodynamics, this sub-optimal efficiency was theoretically defined as the result of a trade-off between the need to maximize the speed of heat transfer to the cold reservoir and minimize the losses of the work done during the thermodynamic cycle (coupled forces). In this formalization, no behaviors are involved. Interestingly, our results outline the same trade-off between efficiency and power, though, in our case, behaviors materially affect overall performance, namely through the speed rebound effect. Nevertheless, it is possible that a design in the truck also plays an essential role in the trade-off and that vehicles that were developed to increase efficiency at the expense of power (or exergy efficiency by reducing fuel exergy rather than increasing shaft availability) lead to more conservative performance and, perhaps, more parsimonious driving. Overall, our results suggest that when the available power is higher, the (speed) rebound tends to be higher. Whether this is an explanation of the aforementioned trade-off or a side-effect is a question that to be answered needs more research. We can only hypothesize that both truck design and driving behaviors compound to counterbalance efficiency to the extent that in some cases have neutralized potential savings (rebound greater than 1 or backfire).
Indeed, with respect to the complexity and variety of factors involved, technical or behavioral, which affected on-road use performance to the detriment of maximum attainable efficiency, there are avenues for new research. What is, for example, the role of technical features such as N/V ratio (the engine RPM divided by the vehicle speed) as opposed to—or coupled with—vigorous driving behaviors that are captured by different acceleration/deceleration patterns? New research should thus address this composite, multivariate factor framework with an analysis able to gauge each separate factor’s contribution in eroding efficiency.
A path to a decarbonized economy cannot ignore the question of road freight transport, which is the predominant mode of transport in terms of volumes and energy consumption in developed countries. Whether internal combustion and diesel can be economically and easily replaced is a question that we leave to economists, engineers, and practitioners. Undoubtedly, the nexus between power and efficiency and the related potential for (speed) rebound effect is an issue of far-reaching implications for any climate policy aiming at reducing energy consumption by fostering energy efficiency in transport. As long as thermic machines are our freight basis, the trade-off between power maximization and efficiency optimization will curb our desired energy savings.
Data Availability Statement
The original contributions presented in the study are included in the article/Supplementary Material, further inquiries can be directed to the corresponding author.
Author Contributions
RG, FR, and AM designed the analysis. AM perfomed the analysis. All authors wrote the manuscript.
Conflict of Interest
The authors declare that the research was conducted in the absence of any commercial or financial relationships that could be construed as a potential conflict of interest.
Supplementary Material
The Supplementary Material for this article can be found online at: https://www.frontiersin.org/articles/10.3389/fenrg.2021.609077/full#supplementary-material
Footnotes
1The statistics of a non-linear fit between average speed and fuel intensity are: R-Squared: 0.0182, Adjusted R-Squared −0.00102 F-statistic vs. constant model: 0.947, p-value = 0.391, indicating a linear fitting worse than the linear model. This is not a surprise as we are comparing trucks’ performance at the very similar average speeds (∼80 Km/h).
References
Al-Najem, N. M., and Diab, J. M. (1992). Energy-Exergy Analysis of a Diesel Engine. Heat Recov. Syst. CHP 12, 525–529. doi:10.1016/0890-4332(92)90021-9
Andrés, L., and Padilla, E. (2015). Energy Intensity in Road Freight Transport of Heavy Goods Vehicles in Spain. Energy Policy 85, 309–321. doi:10.1016/0890-4332(92)90021-910.1016/j.enpol.2015.06.018
Baechtel, J. (2015). Practical Engine Airflow: Performance Theory and Application. Forest Lake, MN: CarTech Inc.
Berry, I. M. (2010). The Effects of Driving Style and Vehicle Performance on the Real-World Fuel Consumption of U.S. Light-Duty Vehicles. Masters Thesis. Cambridge (MA): Massachusetts Institute of Technology.
CBS (2017). Adjustment of Heating Values and CO2 Emission Factors of Petrol and Diesel. Den Haag, Netherlands: Den Haag.
Curzon, F. L., and Ahlborn, B. (1975). Efficiency of a Carnot Engine at Maximum Power Output. Am. J. Phys. 43, 22–24. doi:10.1119/1.10023
Danielis, R. (1995). Energy Use for Transport in Italy. Energy Policy 23 (9), 799–807. doi:10.1016/0301-4215(95)00059-r
De Borger, B., and Mulalic, I. (2012). The Determinants of Fuel Use in the Trucking Industry-Volume, Fleet Characteristics and the Rebound Effect. Transp. Policy 24, 284–295. doi:10.1016/j.tranpol.2012.08.011
ENERDATA (2020). Global Energy Statistical Yearbook 2020. Available at: https://yearbook.enerdata.net/total-energy/world-consumption-statistics.html.
European Parliament (2019). Provisional Agreement Resulting from Interinstitutional Negotiations. Proposal for a Regulation of the European Parliament and of the Council on the CO2 Emission Performance Standards for New Heavy-Duty Vehicles. Available at: http://www.europarl.europa.eu/RegData/commissions/envi/inag/2019/02-22/ENVI_AG(2019)636151_EN.pdf.
Fontaras, G., Zacharof, N.-G., and Ciuffo, B. (2017). Fuel Consumption and CO 2 Emissions from Passenger Cars in Europe - Laboratory versus Real-World Emissions. Prog. Energy Combust. Sci. 60, 97–131. doi:10.1016/j.pecs.2016.12.004
Galvin, R. (2017). How Does Speed Affect the Rebound Effect in Car Travel? Conceptual Issues Explored in Case Study of 900 Formula 1 Grand Prix Speed Trials. Energy 128, 28–38. doi:10.1016/j.energy.2017.03.168
Galvin, R. (2016). Rebound Effects from Speed and Acceleration in Electric and Internal Combustion Engine Cars: An Empirical and Conceptual Investigation. Appl. Energy 172, 207–216. doi:10.1016/j.apenergy.2016.03.120
Herring, H., and Roy, R. (2007). Technological Innovation, Energy Efficient Design and the Rebound Effect. Technovation 27, 194–203. doi:10.1016/j.technovation.2006.11.004
IEA (2015). CO2 Emissions From Fuel Combustion Highlights 2015. Paris, France: University of Oklahoma Press
IPCC (2014). Climate Change 2014: Synthesis Report. Contribution of Working Groups I, II and III to the Fifth Assessment Report of the Intergovernmental Panel on Climate Change, Intergovernmental Panel on Climate Change.
Kamakaté, F., and Schipper, L. (2009). Trends in Truck Freight Energy Use and Carbon Emissions in Selected OECD Countries From 1973 to 2005. Energy Policy 37, 3743–3751. doi:10.1016/j.enpol.2009.07.029
Katsanos, C. O., Hountalas, D. T., and Zannis, T. C. (2013). Simulation of a Heavy-Duty Diesel Engine with Electrical Turbocompounding System Using Operating Charts for Turbocharger Components and Power Turbine. Energy Convers. Manag. 76, 712–724. doi:10.1016/j.enconman.2013.08.022
Kojima, K., and Ryan, L. (2010). Transport Energy Efficiency: Implementation of IEA Recommendations since 2009 and Next Steps, IEA Energy Papers, No. 2010/09. . Paris, France: OECD Publishing. doi:10.1787/5km69t42w48w-en
Léonardi, J., and Baumgartner, M. (2004). CO2 Efficiency in Road Freight Transportation: Status Quo, Measures and Potential. Transp. Res. D: Transp. Environ. 9, 451–464. doi:10.1016/j.trd.2004.08.004
Liimatainen, H., and Pöllänen, M. (2010). Trends of Energy Efficiency in Finnish Road Freight Transport 1995-2009 and Forecast to 2016. Energy Policy 38, 7676–7686. doi:10.1016/j.enpol.2010.08.010
McKinnon, A. C. (2010). “Sustainability: A New Priority for Logistics Managers,” in Green Logistics: Improving the Environmental Sustainability of Logistics. Editors A. C. McKinnon, , S. Cullinane, , M. Browne, , and A. Whiteing, (London, United Kingdom: Kogan Page), 4–30.
Miller, J. (2008). Turbo: Real World High-Performance Turbocharger Systems. Forest Lake, MN: CarTech Inc.
Novikov, I. I. (1958). The Efficiency of Atomic Power Stations (A Review). J. Nucl. Energy 7, 125–128. doi:10.1016/0891-3919(58)90244-4
Patterson, M. G. (1996). What is Energy Efficiency? Energy Policy 24 (5), 377–390. doi:10.1016/0301-4215(96)00017-1
Ruzzenenti, F., and Basosi, R. (2009). Evaluation of the Energy Efficiency Evolution in the European Road Freight Transport Sector. Energy Policy 37, 4079–4085. doi:10.1016/j.enpol.2009.04.050
Ruzzenenti, F., and Basosi, R. (2008). The Role of the Power/Efficiency Misconception in the Rebound Effect’s Size Debate: Does Efficiency Actually Lead to a Power Enhancement? Energy Policy 36, 3626–3632. doi:10.1016/j.enpol.2008.06.014
Sorrell, S., and Stapleton, L. (2018). Rebound Effects in UK Road Freight Transport. Transp. Res. Part D: Transp. Environ. 63, 156–174. doi:10.1016/j.trd.2018.05.006
Keywords: rebound effects, exergy, road freight transport, energy effciency, finite-time thermodynamic
Citation: Martulli A, Galvin R and Ruzzenenti F (2021) Evolution of Energy and Exergy Efficiency in the European Road Freight Industry, 1978–2018. Front. Energy Res. 9:609077. doi: 10.3389/fenrg.2021.609077
Received: 23 September 2020; Accepted: 27 April 2021;
Published: 24 May 2021.
Edited by:
Michel Feidt, UMR7563 Laboratoire d’énergétique et de mécanique théorique et appliquée (LEMTA), FranceReviewed by:
Neeraj Dhanraj Bokde, Aarhus University, DenmarkT. Hikmet Karakoc, Eskisehir Technical University, Turkey
Copyright © 2021 Martulli, Galvin and Ruzzenenti. This is an open-access article distributed under the terms of the Creative Commons Attribution License (CC BY). The use, distribution or reproduction in other forums is permitted, provided the original author(s) and the copyright owner(s) are credited and that the original publication in this journal is cited, in accordance with accepted academic practice. No use, distribution or reproduction is permitted which does not comply with these terms.
*Correspondence: Franco Ruzzenenti, Zi5ydXp6ZW5lbnRpQHJ1Zy5ubA==