 Jie Liu1,2
 Xiangfeng Liu
 Farhad Taghizadeh-Hesary
- 1China Research Institute of Regulation and Public Policy, Hangzhou, China
- 2China Institute of Regulation Research, Zhejiang University of Finance and Economics, Hangzhou, China
- 3School of Public Administration, Zhejiang University of Finance and Economics, Hangzhou, China
- 4School of Finance, Zhejiang University of Finance and Economics, Hangzhou, China
- 5Social Science Research Institute, Tokai University, Hiratsuka, Japan
The Chinese government has stepped up its anti-corruption efforts since 2013; the National Energy Administration (NEA), an energy regulatory agency, has been hard hit by corruption. This paper analyzes the impact of government corruption on energy efficiency (EE) from a perspective of energy regulations and also a mechanism of the impact of corruption on EE, and then adopts statistical methods to estimate the impact of corruption on EE in China. The results show that government corruption generally has a negative effect on EE in China. The establishment of dispatched energy regulatory agencies in eastern China can significantly reduce the adverse effects of corruption on EE. Furthermore, a single threshold effect was found between corruption and EE. Finally, based on the results of an empirical analysis, suggestions for a constructive policy are put forward.
Introduction
Since the reform and opening up of China, with a rapid development of urbanization and industrialization, the conflicting demands of energy, environment, and economic development have become increasingly prominent (Zhao et al., 2020). Energy efficiency (EE) is defined by the International Energy Agency (IEA) as “a way to manage and limit energy consumption, which has also become an important goal and basis for energy management and energy policy-making in various countries” (Proskuryakova and Kovalev, 2015). Improving EE is an inevitable choice to alleviate the contradiction between energy supply and energy demand and to guarantee sustainable development, which is also an important measure to protect the environment and realize a sustainable development strategy. In the past 20 years, given the rapid growth of Chinese economy, energy production and energy consumption have increased exponentially. In 2018, China consumed the energy equivalent to 3,422.96 million tons of oil, which was 4.3% more than in 2017; annual power generation reached 7.4 trillion kilowatt-hours, which was a 7.2% year-on-year increase (BP World Energy Statistical Yearbook, 2019). Table 1 shows that China occupies the first position in energy production and energy consumption in the world. As shown in Figure 1, EE in China has increased from 0.66 in 2000 to 1.19 in 2017 while maintaining a high growth rate of 3.53% per year. EE was calculated based on Equation (1), and the data were collated from the National Bureau of Statistics (2020). Thus, from the chart, we find that energy production and energy consumption in China are among the most prominent ones in the world energy market.
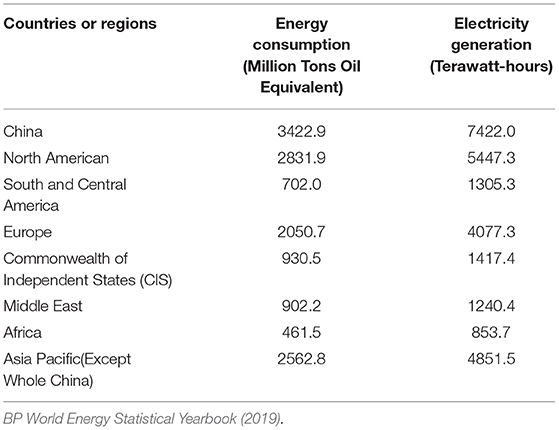
Table 1. Comparison of energy consumption and electricity generation between China and other areas of the world in 2018.
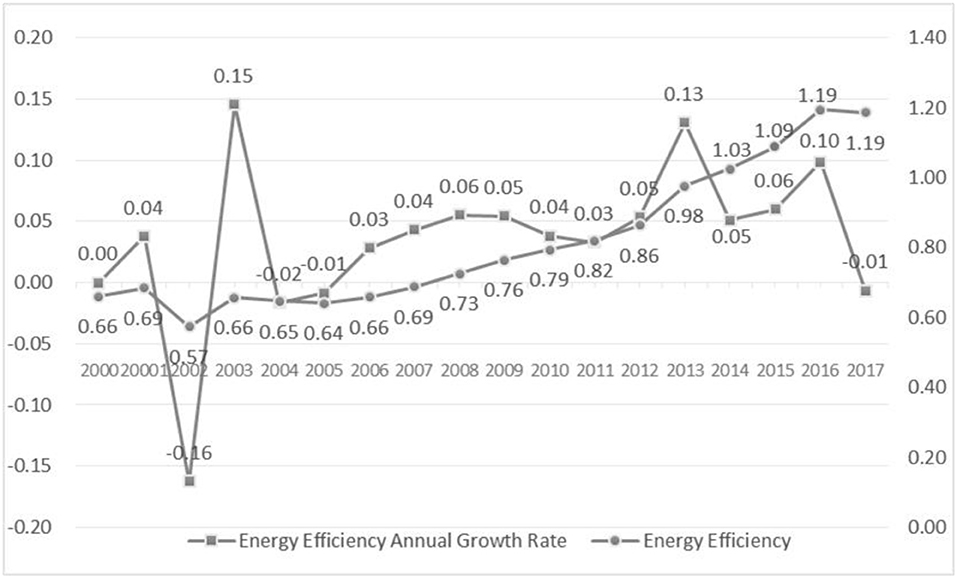
Figure 1. Energy efficiency (EE) and its annual growth rate from 2000 to 2017 in China. Source: National bureau of statistic, People's Republic of China.
However, China is facing severe corruption issues especially in the energy industry; Figure 2 shows that China has a low ranking in the Corruption Perceptions Index released by Transparency International (ranging from 0 to 100, with higher scores corresponding to less corruption). Statistics published by the Central Commission for Discipline Inspection (CCDI) show that since the National Energy Administration (NEA) was established 10 years ago, two of the four directors (at a ministerial level) have been investigated for corruption (source: http://www.ccdi.gov.cn/scdc/). In addition, two deputy directors (at a bureau level) and eight department-level officials were also investigated by the CCDI. As the investigations progressed, many officials at different levels in energy systems of China were dismissed.
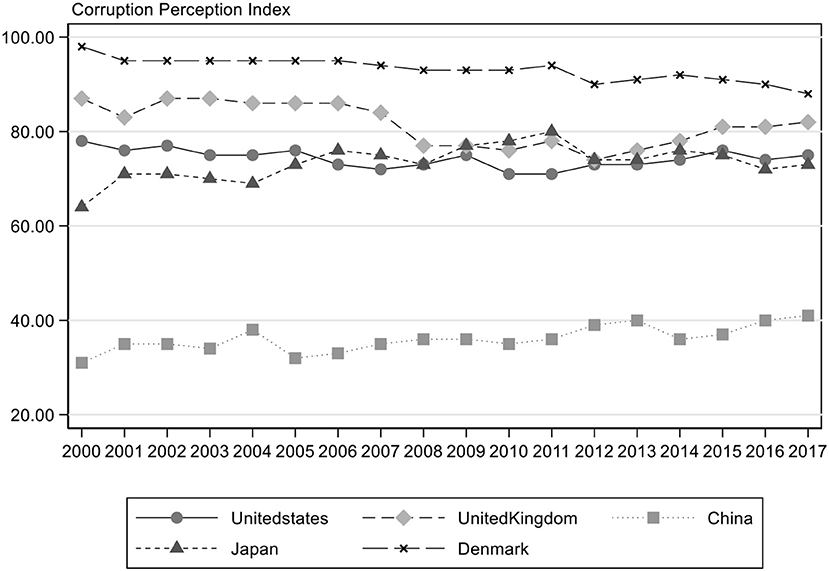
Figure 2. Transparency international's corruption perception index from 2000 to 2017. Source: Transparency international.
With a deepening of the investigations, many corruption cases associated with the energy industry, such as oil, coal, and electricity, have gradually been exposed and 80 officials at different levels have been investigated (source: https://www.sohu.com/a/255202925_752796). The exposed corruption was shocking and present in different areas of the energy industry. For example, in 2013, executives in more than 40 different levels from the China National Petroleum Corporation were involved.
How does China create EE under high-level corruption in the energy industry? This interesting phenomenon inspired us to study the relationship between the two in China. This toxic culture of corruption interacts with energy regulators; the exposure can help to motivate officials and reduce administrative delays and thus becoming a lubricant for the improvement of EE (Wang and You, 2012). On the other hand, rent-seeking and other corrupt behaviors of government regulatory officials will lead to the failure of regulatory policies, a waste of social costs, and low government efficiency (Kaller et al., 2018). Political expediency related to utilities such as electricity and gas tends to undermine regulatory independence and rigor in political environments with high levels of corruption. Moreover, Chinese local government officials often control resources, and the collusion of officials provide opportunities for rent-seeking and corruption, further aggravating the problem of resource mismatch (Aidt, 2016). This study combines corruption, energy regulations, and EE to address the following four questions: (1) Under the current situation in China, will government corruption hinder or promote EE? (2) What is the impact of different levels of corruption on EE? (3) Will increased energy regulations promote EE? (4) Are there any measures to improve EE?
This study uses the panel data from 2000 to 2017 of 30 provinces and provincial municipalities in China to analyze the difference between corruption and EE, utilizing the models of individual fixed effects measurement and the panel threshold. This research examines the interaction between dispatched energy regulatory agencies in different areas of China and the degree of corruption. Moreover, the influence of dispatched energy agencies on the efficiency of energy regulations by curbing corruption was also analyzed. Based on an empirical analysis, countermeasures and suggestions for improving supervision systems of the government, the organizational structure of regulations, and the promotion of the market reforms of energy industries in China are proposed.
The rest of this paper is organized as follows: Section Literature Review and the Theoretical Influencing Mechanism shows the literature review and the theoretical influencing mechanism. Section Methodology and Data presents the methodology and data. Section Empirical Analysis provides an empirical analysis. Section Conclusions and Policy Recommendations concludes the paper and provides policy recommendations.
Literature Review and the Theoretical Influencing Mechanism
Energy industry is a regulated industry in which the regulatory authorities issue permits, approvals, and exemptions for operation, development, and construction. Lovei and McKechnie (2000) analyzed and evaluated the results of corruption activities and identified various forms of corruption in the energy sector. However, the study does not propose the steps that the USA should take to mitigate the risk of corruption at the public utility level. China is in the stage of economic transformation, and the content of regulatory responsibilities, laws, and regulations is still being improved. This inevitably involves business negotiations with the government, which has a larger space for rent-seeking. In a political environment with a high degree of corruption, political expediency related to utilities such as electricity and natural gas tends to weaken the independence and rigor of regulations (Eberhard, 2007). Therefore, regulations are easily captured by politics or become a rent-seeking tool for government officials. Many consumers also believe that utility operators have colluded with regulators to make excess profits (Stiglitz, 1998).
China is readjusting and reforming its economic structure and distribution model, but the problem of resource misallocation is still quite serious. Current research suggests that resource misallocation in China is greatly affected by local governments that use administrative or economic means to influence the free flow of production factors to achieve the purpose of political execution and thus resulting in serious resource misallocation. From a perspective of resource allocation, some scholars believe that corruption further exacerbates the problem of resource misallocation (Liu et al., 2015; Restuccia and Rogerson, 2017; Pailler, 2018). The government regulatory officials' rent-seeking behavior will cause a failure of regulatory policies, a waste of social resources, and low government efficiency (Halkos and Tzeremes, 2013; Rose-Ackerman and Palifka, 2016; Kaller et al., 2018). In recent years, scholars have begun to study the relationship between corruption, resource misallocation, and EE. Corruption exacerbates resource misallocation and, in turn, impacts EE, leading to energy inefficiency (Wei and Li, 2017; Yang et al., 2018; Shibao et al., 2019, 2020, 2021). Local governments in China have concentrated on a large amount of capital and labor resources in some enterprises through administrative orders, which have artificially caused the misallocation of capital and labor among the industries. These enterprises tend to be traditional enterprises that cause high pollution and high energy consumption, so EE is greatly affected. Low EE due to resource misallocation leads to high emissions of sulfur dioxide (SO2), soot, and suspended particulate matter (PM2.5) (Bian et al., 2019). Wang et al. (2020) used the provincial panel data from 2006 to 2015 in China to empirically study the impact of corruption and resource misallocation on ecological efficiency. The research concludes that corruption directly reduces ecological efficiency and intensifies resource misallocation, leading to a further decline in ecological efficiency.
However, the “grease” theory of corruption has led some scholars to put forward a contrary research conclusion (Vial and Hanoteau, 2010; Wang and You, 2012). The risk of corruption in the energy sector is often linked to a significant influence of the government in the sector by organizing auctions and granting concessions. In legal systems with high regulatory interventions in business activities, the incidence of corruption is significantly higher. However, in the context of excessive regulation, rigid management, and a lack of market competition, corruption helps to overcome the resulting deeper distortions and becomes a suboptimal option (Leff, 1964; Leys, 1965; Huntington, 1968). Bribery or “refueling” reduces long administrative delays and advances through slow-moving public service queues. Kaufmann and Wei (2000) found that corruption cannot only save the management time wasted by the bureaucracy but also reduce the regulatory burden on enterprises, such as avoiding cumbersome regulations, reducing long waiting times, and speeding up the allocation of licenses and permits. Fan and Grossman (2001) found that those local officials who made greater contributions to the reform are likely to accept more bribes and have more valuable public property. Corruption in China can be regarded as a compensation or an incentive for the contributions of officials to improve their work enthusiasm. In this sense, corruption can also be seen as a new way to improve the effectiveness of supervision. Egger and Winner (2005) studied the data of 73 countries and found that corruption can bypass the regulations and speed up administrative processes. In addition, it improves the possibility of foreign investment to obtain public-funded projects and plays a positive role in foreign direct investment (FDI) both in the short and long term.
Some scholars also found that a positive or negative impact of corruption on energy regulations cannot be simply concluded because of its dependence on the complex national mechanism and various factors related to the specific economic, political, and social environment of each country (Vial and Hanoteau, 2010).
George and Tzeremes (2013) applied non-parametric estimators to study the impact of six governance measures (voice and accountability, political stability and lack of violence, government effectiveness, regulatory quality, rule of law, and corruption control) on CO2 emissions by G20 governments. These results showed that the quality improvement of different governance factors in countries did not always reduce CO2 emissions. Kaller et al. (2018) assessed the quality of supervision and the impact of corruption on electricity costs in European electricity market regulatory reforms. The results showed that improving regulatory quality and decreasing corruption could reduce electricity prices. However, when reforms were conducted in an institutional environment with severe corruption and poor regulatory quality, the reforms only limited prices.
Based on the previous research, we conclude that coordination costs of bribes may have two kinds of impact on energy regulatory policies and EE. Coordination costs can play a similar role as lubricants, promoting mutual cooperation between enterprises and governments and reducing rent-seeking costs. These factors are not always harmful in some periods and, thus, corruption levels can have both active and opposing sides on EE. However, in China, few studies have examined the relationship between the degree of corruption in government energy regulations or management and EE. Furthermore, almost no studies have analyzed the impact of government corruption and the structure of an energy regulatory organization on EE. Due to the complexity of the relationship between corruption and government regulation, resource allocation, and EE, further studies should be conducted to identify its impact on EE and provide effective recommendations for improving EE.
Methodology and Data
In this section, 2000–2017 panel data from 30 provinces of China and provincial municipalities were obtained and analyzed. We adopted an individual fixed effects model and a panel threshold regression model to investigate the relevance of government corruption to EE. In the model, EE and the degree of corruption were utilized as an explanatory variable and a core explaining variable, respectively. Moreover, five indicators, technological progress (TP), energy prices (EP), changes in economic structure (IS), degree of openness (EX), and government intervention (GV), were selected as control variables in the model.
Variables and Data
Description of Variables
This study selects EE as an explanatory variable and the degree of corruption as a core explanatory variable. The interaction between government corruption and dispatched energy regulatory agencies in different provinces and provincial municipalities was introduced in this study.
There are different indicators of EE particularly at a policy level. The economic outcomes of the energy investment ratio or the output-to-input ratio are the two most commonly used indicators of EE in a certain area. The former stands for “energy efficiency,” which measures the macro EE level of a region or country in a certain phase by the service or output per unit of energy costs (Patterson, 1996); the latter measures the energy consumption of unit output and it is known as energy intensity. These two indicators are reciprocal and easy to evaluate (Kander et al., 2017).
In this thesis, the proportion of constant price gross domestic product (GDP; constant prices, base year 2000) to the total energy consumption is a measure of appraising comprehensive EE, which agrees with the indicators used in the literature to measure EE (Liu et al., 2015; Li and Lin, 2017). Researchers such as Dan (2006), Yang (2010), and Wang J. (2018) also used the same measure. Based on this, the following equation is developed for evaluating the regional EE for each province of China:
where EEit represents EE for the province i in the year t, GRPit stands for a constant price gross regional product (constant prices, base year 2000) for the province i in the year t measured by 108 Yuan, and Eit is the regional energy consumption in the province i in the year t measured by an equivalent of 104 tons of coal.
The degree of government corruption in each region is a core explanatory variable in the proposed model. Because corruption is hidden, a determination is made how to measure corruption effectively is usually difficult in quantitative research. International organizations have raised several corruption indices, such as the Corruption Perception Index and Bribe Payers Index released by Transparency International and a set of indexes reflecting the degree of corruption of various countries published by Business International (Knack, 2006). Although the data are widely used in cross-border corruption research, their focus is quite different and no index can fully measure all kinds of corruption (Knack, 2006). Moreover, the validity of an index is difficult to guarantee because it is based on the survey information. Therefore, researchers have attempted to use objective indicators to characterize the degree of corruption. At present, the most commonly used objective indicators for corruption mainly include the number of corruption cases per million of the population (Del Monte and Papagni, 2007; Wu, 2008) and the number of corruption cases among the public officials (Fisman and Gatti, 2002; Yongzheng and Haibo, 2011). Because the data show only the government corruption that has been found or investigated, it may be just a tip of the iceberg of the actual amount of corruption. However, the results of the research of domestic and foreign scholars show that taking data as an indicator of the degree of government corruption is more consistent with reality (Apergis et al., 2010; Yongzheng and Haibo, 2011; Wang et al., 2020). The subject of corruption in Chinese law is defined as government staff, and this paper mainly studies the degree of corruption in the public sector. Therefore, the number of cases of corruption, bribery, and malfeasance in the province i in the year t, denoted as Caseit, and the number of civil servants, noted as CivilServantsit, is used to evaluate the degree of corruption (Cor) in each province i in the year t as follows:
The natural logarithm of the corruption degrees, lnCor, for the 30 Chinese provinces and provincial municipalities is calculated and is shown in Table 4, Section Data and Statistical Description.
China has implemented an administrative regulation unification mode so that dispatched energy regulatory agencies are government bureaus. There exists an interaction between government corruption and the existence of dispatched energy regulatory agencies. Therefore, this paper introduces a virtual variable (Reguit) representing the setup of dispatched energy regulatory agencies in the province i in the year t. The value Reguit equals 1 if a dispatched energy regulatory agency has been set up in the province i in the year t; otherwise, it equals 0. Table 2 illustrates provinces and provincial municipalities or regions setting up energy regulatory agencies and their corresponding times. The interaction term between the setup of the dispatched energy regulatory agency and regional corruption is used as an explanatory variable in the model, which is denoted as Regu*lnCor.
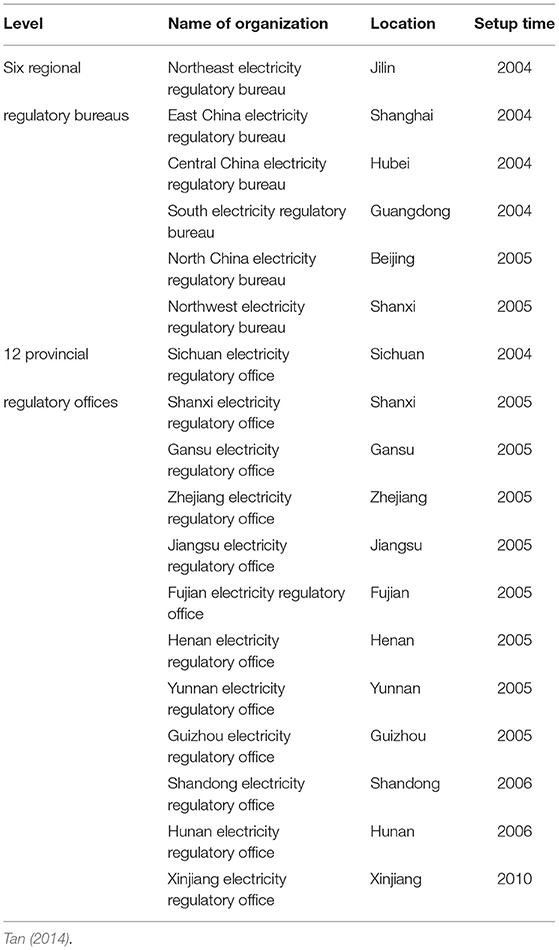
Table 2. Year of establishment of local electricity dispatched agencies.
Table 3 shows the selected variables and their brief explanation. This study also selected five representative indicators as control variables: TP, EP, IS, EX, and GV.
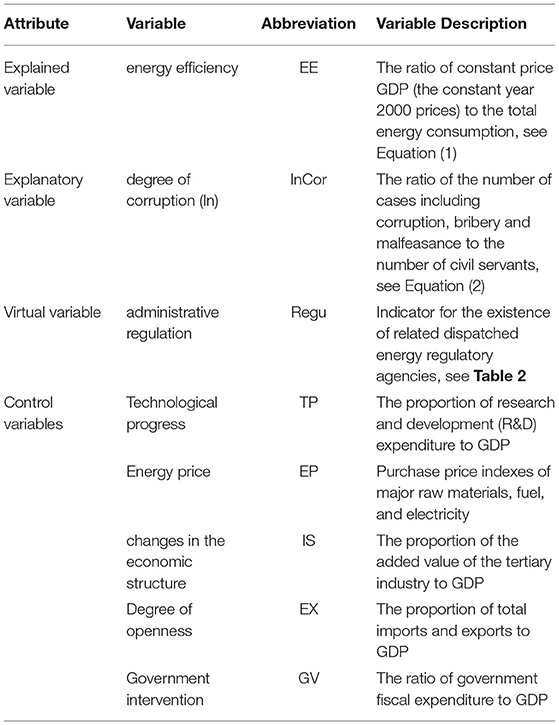
Table 3. Selected variables and their brief explanation.
Technological progress: Li and Lin (2017) developed a total-factor energy performance indicator (TEPI) to evaluate the EE of 30 provinces and provincial municipalities in China. The results illustrate that TP is fundamental to improving the EE in China. Zhu et al. (2019) studied how the abovementioned factors relate to each other and believed that technological advancements could make energy use more efficient at an annual average rate of 7.1%. Indicators are productivity improvements (Aguilera and Ripple, 2012), patents (Albino et al., 2014; Li and Lin, 2017), research and development (R&D) investment (Lin and Zhang, 2013; Ouyang and Lin, 2015), financial development, and FDI (Li and Lin, 2014). The average growth rate of per capita GDP over the past 3 years (Antonietti and Fontini, 2019) is often used as a surrogate variable to measure changes in TP. In this paper, we use the R&D spending in each province, as a proportion of GDP for measuring regional R&D capacity (Lin and Zhang, 2013; Ouyang and Lin, 2015). The greater the investment in R&D, the stronger the ability to develop advanced technologies.
Energy prices (EP): EP are generally considered to be an essential motivation for saving energy and promoting EE (Huang et al., 2017). However, market regulation barriers caused by information dissymmetry, high transaction costs, and the contorted energy price resulting from inappropriate promotion policies adversely affect improvements in EE (Oikonomou et al., 2008). EP in different regions of the world have various impacts on EE (Antonietti and Fontini, 2019). In recent years, researchers have conducted extensive and in-depth studies on how energy efficiency in China influences its prices. Some scholars (Fisher-Vanden et al., 2004; Wu, 2009) found that improving EP was conducive to improving EE, while others (Lin and Du, 2013; Ju et al., 2017) also proposed that the price distortions of power, natural gas, coal, and other energy markets caused by strict price regulations and imperfect market mechanisms in China significantly prevented EE from improving. In this study, the producer price indexes of primary raw materials, fuel, and electricity were adopted as proxy variables for EP (Shi and Shen, 2013).
Economic structural change (IS): due to the large differences in energy demand between various economic structures, economic structure can also play an essential role in EE. Moreover, structural changes may also cause tremendous changes in EE over time (Dong et al., 2018). Voigt et al. (2014) analyzed trends and driving factors of energy demand strength in about 40 major economies and concluded that economic structural changes do not significantly affect EE in most countries. However, in Japan, the USA, Australia, Taiwan, Mexico, Brazil, and other countries, an adjustment to industrial structure is regarded as a main driver of the decline in energy demand intensity. Evaluating the ratio of industrial added value to GDP has been widely used to measure economic structure (Dong et al., 2018). We use this method to calculate the proportion of the added value of the tertiary industry in the nominal GDP as the proxy variable of the economic structure.
Degree of openness: foreign commerce is not only an important source of TP but also drives improvements in EE (Lin and Liu, 2015; Roy and Yasar, 2015). However, foreign trade will make a difference in EE, but it varies from country to country. Cole and Tran (2011) analyzed the panel data of 32 developed and developing countries from 1975 to 1995 and found that imported or exported energy-intensive commodities influenced the trade impact on energy intensity. In this thesis, the appropriate volume of imports and exports to nominal GDP of each province is the measurement index.
Government intervention: Chinese GV has positive and negative effects on EE of a country. On one hand, GV may lead to a distorted resource allocation and reduce EE. On the other hand, due to market failures in environmental quality governance, appropriate market and GV will benefit the improvement in EE (Shi and Shen, 2013). Relevant indicators of marketization level and the degree of the government interference are measured by government spending in proportion to GDP. Lower ratios indicate less GV and higher marketization.
Data and Statistical Description
To ensure data validity, the author selected the data from 30 provinces and cities in China (except Tibet, Hong Kong, Taiwan, and Macao) from 2000 to 2017. The number of cases of corruption and malfeasance was obtained from the annual work reports of provincial procuratorates in the Procuratorial Yearbook of China. Due to the lack of data in the pro-curatorial yearbooks of some provinces and provincial municipalities in some years of some provinces and provincial municipalities in some years, we have supplemented the data with relevant local legal yearbooks, economic yearbooks, and work reports. The calculation of the degree of corruption (Cor) is given in Equation (2), and the natural logarithm value of the corruption degrees (lnCor) of each region in the sample period is shown in Table 4. In Table 4, Beijing, Gansu, and Hunan have low degrees of corruption and are ranked in the top three positions.
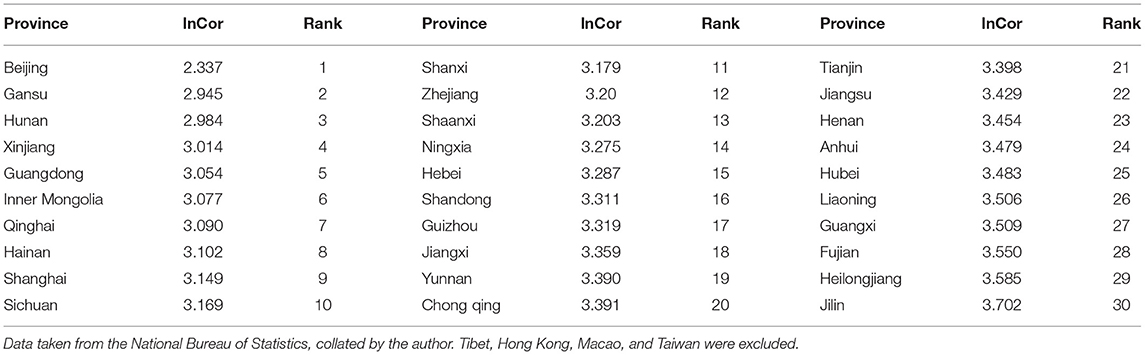
Table 4. Ranking of corruption of 30 provinces of China and provincial municipalities 2000–2017.
The energy expenses of each province over the studied period were obtained from the China Energy Statistical Yearbooks1,2 of the provinces and provincial municipalities. The nominal R&D expenditures were obtained from the China Statistical Yearbook of Science and Technology. The energy price data used the producer price indexes of major raw materials, fuel, and power in the China Statistical Yearbook. The total volume of imports and exports was converted into RMB at the average exchange rate of RMB against the US dollar for the current year. In calculating EE, the CPI was used to reduce GDP to the actual value based on the year 2000 to eliminate price factors. Descriptive statistics of the variables are listed in Table 5.
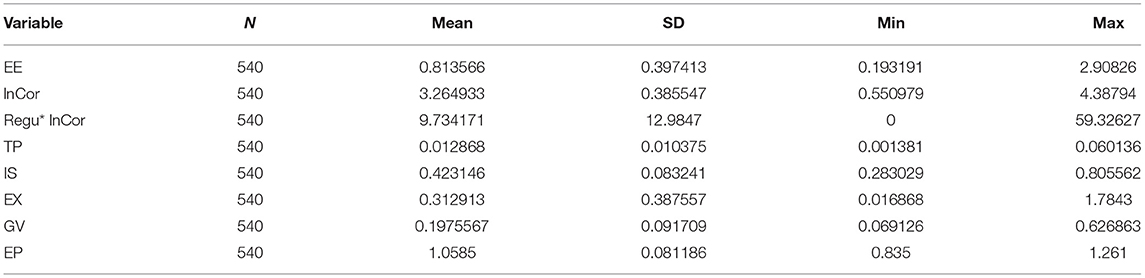
Table 5. Descriptive statistics of variables.
As Table 5 shows, the sample SD of the interaction term between the setup of dispatched energy regulatory agencies, and corruption and the EX are slightly larger than the means, and the sample SD of other variables are all smaller than the means; that is, the sample coefficient of variation is less than 1. This illustrates that the sample data structure are stable and that there are no extreme outliers; thus, subsequent empirical analysis can be performed on this basis.
Statistical Model
Fixed Effects Model
The framework of a static panel data model has been widely applied in empirical studies on the factors affecting EE. This method is useful for controlling the bias effect of individual effects in the sample, which are difficult to observe and do not change over time. Before regression, the model settings were subjected to the Hausman test. The Hausman test statistic value is 133.81, which is significant at the level of 1%; therefore, we preferred fixed effects to the alternative hypothesis of the random one.
We develop the following equation of individual fixed effects:
where i is the province index (i = 1,2,…,30), t is the year index (t = 2000, 2001,., 2017), EEit is the EE of province i in year t, is the corruption degree of the province i in the year t, Xit represents a set of control variables that may affect a province's EE, θ is the corresponding coefficient variable, ηi represents individual effects that are difficult to observe, λt is the time effect, and εit is the disturbance term.
Government structure and size are important factors that influence government corruption. Wang J. (2018) have suggested that the NEA power regulatory dispatch agency will improve EE. China has implemented an administrative regulation unification mode, so the energy regulatory department is a part of government agency; thus, government corruption and the establishment of energy regulatory dispatch agencies have a mutual influence. The model takes the interaction term Regu × ln Cor as an explanatory variable to analyze its effects on EE, which can be represented by the following equation:
Panel Threshold Model
Corruption reduces government efficiency, damages social welfare, and inhibits economic growth (Mauro, 1995; Mo, 2001; Chen et al., 2008). However, in developing countries, some studies have indicated that because corruption can relax the inefficiencies and rigid regulations imposed by governments, welfare can be improved (Leff, 1964). Nye (1967) argued that there may exist a positive level of corruption that maximizes the output.
Méndez and Sepúlveda (2006) have suggested that economic growth affected by corruption may be non-linear. When corruption is at a low level, it is conducive to economic growth, while it would harm economic growth when the corruption levels are high. Wu and Rui (2010) have researched the connection between the abovementioned two factors in various regions of China indicated that there is a U-shaped relationship between the two. Corruption has a dual threshold effect on China's regional TP brought about by FDI technology spillover and a single threshold effect on R&D, foreign trade, and TP (Ma, 2015). Since corruption has different influences on economic growth and technology spillovers, we doubt that it exists in EE as well. This phenomenon is called the “threshold effect” by Borensztein et al. (1998); in other words, only when the extent of government corruption in a certain area exceeds a certain “threshold” level, it can have an impact on EE. To evaluate this threshold value, Hansen (1999) proposed a regression model for the non-dynamic panel threshold, which can also perform a significance test on the correctness of the value.
The idea aims to introduce the threshold, which is an unknown variable in the empirical model, to develop a segmented function for the regression coefficient of an explanatory variable, and perform a series of estimates and significance tests on the threshold and threshold effects. The fundamental form of the fixed effects panel threshold model can be represented as follows:
where i is the province index (i = 1, 2, …, 30), t is the year index (t = 2000, 2001,., 2017), qit is the threshold parameter, γ is the threshold value to be estimated, xit represents an explanatory variable, which is independent of the disturbance item εit, and ui is the individual intercept term. Equation (5) is a segmented function model, when qit ≤ γ, the coefficient of xit is β1, qit>γ, and the coefficient is β2.
To further test the influence of corruption levels on EE, we have introduced the threshold value of corruption as an unknown variable into the fixed effects model and developed a piece-wise function of corruption levels, represented as follows:
where InCoritis the threshold variable and γ is the threshold value to be estimated. Wald tests can be applied to test threshold effects (Hansen, 1999).
Empirical Analysis
National Level
In the regression results at the national level, as the number of control variables increases (from experiments (1) to (5) in Table 6), the regression coefficient of the explanatory variable lnCor is negative and stable between −0.13 and −0.20, maintaining a significance level of 1%. In addition, other control variables showed a high level of significance. Table 6 shows that the test results are robust.
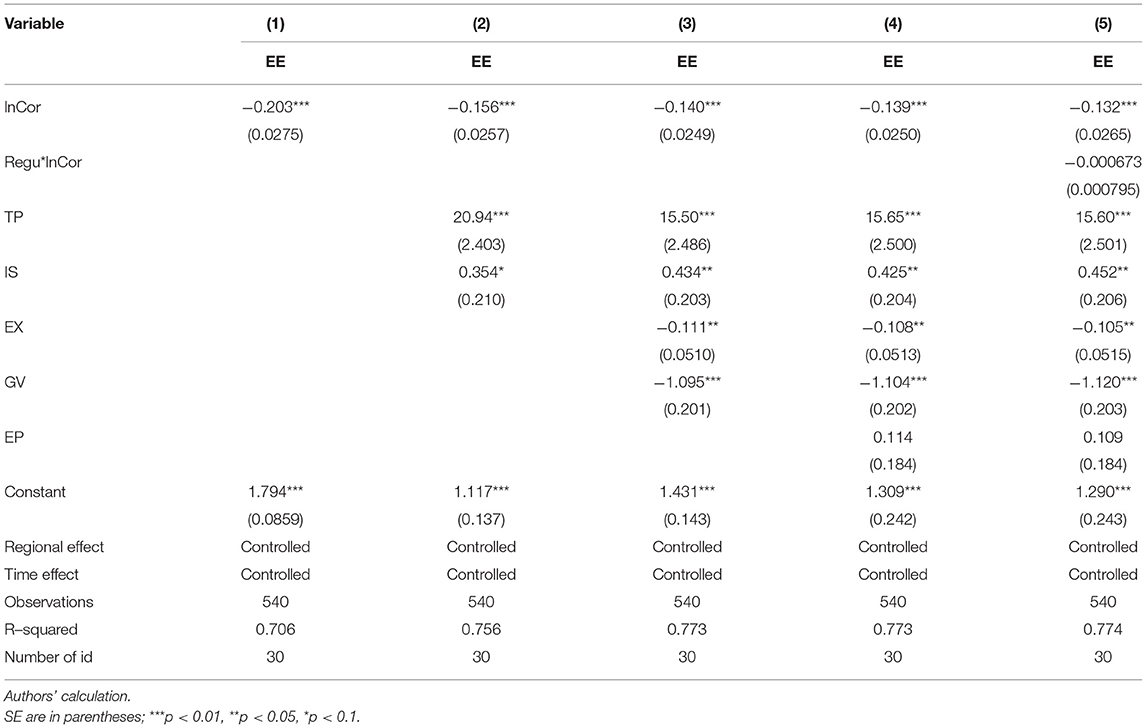
Table 6. National regression results.
Based on the results of experiment (4) in Table 6, the corruption level affecting EE in China was systematically analyzed. After controlling the variables including TP, IS, EX, EP, and GV and controlling the regional and time effects, the regression coefficient of an explanatory variable is −0.139, passing the significance inspection at the 1% level. This means that corruption increases by every 1%, and the EE decreases by 0.139%. Based on these results, it can be seen that corruption significantly suppresses EE in China.
Considering the impact of corruption on EP and GV, there may be endogeneic problems. Therefore, this study uses the endogenous test method, the Davidson–MacKinnon test, to test for endogeneity. The F-statistic of the Davidson–MacKinnon test is 16.81, and the value of p is 0.000, which significantly rejects the original hypothesis, indicating that there is no endogenous problem in the model. Therefore, we believe that the model has no endogeneic problems.
The regression coefficient of the interaction term Regu × lnCor in experiment (5) was also negative. However, they failed to pass the significance test. Thus, from a national perspective, the interaction between the political environment of corruption and dispatched energy regulatory agencies has weakened government regulatory efficiency. In a corrupt environment, the contribution of dispatched energy regulatory agencies to the improvement of EE is limited and insignificant.
From the regression results of the control variables, an increase in the proportional ratio of R&D investment to GDP and tertiary industry can promote EE in China to varying degrees. The proportional ratio of R&D investment to GDP can obviously promote EE, which also shows that the TP in China has a prominent role in facilitating EE. GV has significantly inhibited the improvement of EE, which is consistent with a previous research showing that GV has distorted resource allocation and reduced EE.
The EX has a significantly negative correlation with EE at the level of 5%. On one hand, EE can be improved by foreign investment for advanced technology and managerial expertise; on the other hand, they can also reduce EE by introducing high energy consumption and pollution enterprises. From the negative coefficient of the level of openness, we can infer that the negative effect is larger than the positive effect.
The coefficient of EP is positive but fails to pass the significance test. This means that China has not yet established a market-based energy price mechanism. Prices do not have obvious effects on improving the EE. Therefore, the government should promote the market mechanism reform of EP.
Eastern3, Central4, and Western5 Regions of China
The regression results for the eastern, central, and western regions of China are shown in experiments (6) to (11) in Table 7. In the eastern and western regions, regional corruption negatively influences EE, and the negative effect is significant at 1 and 5% levels, respectively. Corruption is significant when it comes to EE in the eastern region, with a coefficient of −0.264, and a lesser impact on the western region, only −0.0552. Therefore, EE is more sensitive to changes in the level of corruption in the eastern region. For the central region, the corruption coefficient is 0.0752, which passes the significance test at 5% level, indicating that a positive effect of “corruption lubricant” in the middle part is larger than its impact on efficiency distortion. In contrast, the regression coefficients of the explanatory variable lnCor in the central and western regions are smaller than those for the eastern region, which shows that the reflection of EE on the change in corruption is weaker than that for these two regions in the eastern region. Therefore, corruption has different effects on EE, which can be positive or negative in different regions.
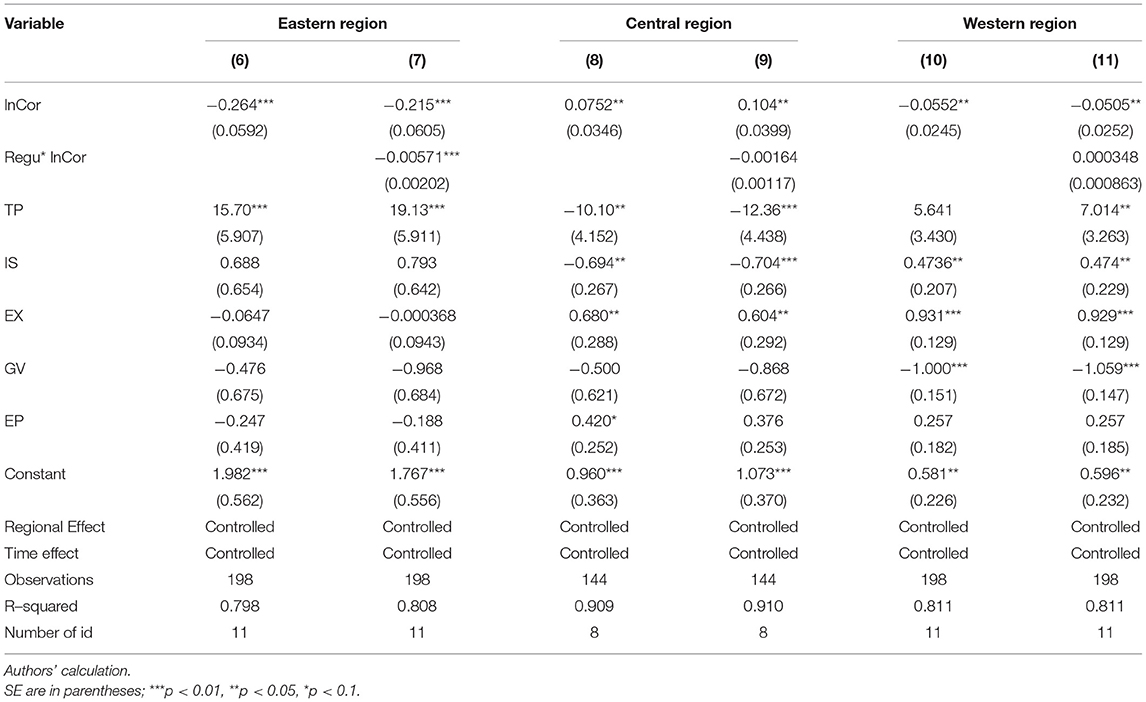
Table 7. Regional regression results.
Setting up of dispatched regional and provincial energy regulatory agencies is an important measure to increase energy regulations, but corruption has affected the effectiveness of regulations. Experiments (7), (9), and (11) show the regression results after introducing the interaction between the establishment of dispatched regulatory agencies and corruption, Regu*lnCor.
The interaction coefficient in the eastern region is −0.00571 and is significant at the level of 1%, which means that corruption negatively affects government regulatory efficiency in the east. However, as the regression coefficient of “corruption” has decreased from −0.264 to −0.215, which shows that an increasing regulatory oversight can reduce the influence of corruption on EE. The coefficents of interaction terms of the central part and western part are not significant, which indicates that corruption has a little effect on government regulatory efficiency. However, when the interaction term was added, positive impact coefficient of the central region was increased, which caused corruption to increase EE, but that of the western region remained basically unchanged.
The correlation between the overall impact of EE and TP is significant and positive. However, the coefficient of TP in the central region is −10.10 and through a significance test at the level of 5%, and shows that blindly improving the technological level cannot completely settle the issue of low EE. EP in different regions have a little effect on EE, mainly because China's energy price market mechanism has not been fully developed, and the energy price cannot fully reflect the corresponding cost. The proportion of tertiary industry structures is positively correlated with overall EE. However, the positive impact is not significant in the east, and the effect direction is opposite in the middle and west, which shows that EE will be affected by the interaction between the degree of marketization and the industrial structure. In the eastern region, the influence of openness on EE is not apparent, but positive in the central and western regions. GV also showed regional heterogeneity. The effect of GV on EE in the eastern region and the central region is not conspicuous, but it significantly contributes to the control of the western region.
An Empirical Analysis of the Threshold Effect Model and Discussion
From the abovementioned analysis, we find that the degree of corruption in EE varies in different regions. To determine whether there is a threshold effect value for the degree of corruption, the corruption threshold effect model proposed by Equation (6) was utilized for the analysis. Tables 8, 9 illustrate the estimated threshold values for corruption and their CIs. The results indicate that the model has a single threshold effect at a significance level of 1%, with a threshold of 2.4307. As shown in Figure 3, the likelihood ratio (LR) value corresponding to the threshold estimate of the degree of corruption is significantly less than the critical value, and thus the obtained threshold estimate is effective. According to the threshold value, the selected provinces and provincial municipalities are divided into low corruption regions with lnCor ≤ 2.4307 and high corruption regions with lnCor > 2.4307.

Table 8. Panel threshold self–sampling model.

Table 9. Threshold effect estimates and CIs.
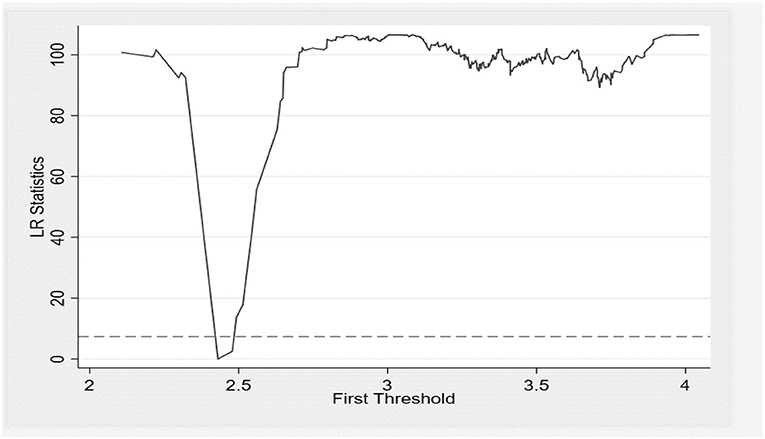
Figure 3. Threshold effect.
As shown in Table 9, when the level of corruption is below the threshold of 2.4307, which means that the incidences of corruption, bribery, and malfeasance cases per 10,000 government officials are <11.37, the regression coefficient is positive but not significant. The result indicates that when the degree of corruption is lower than the threshold, corruption has a little effect on EE. However, when the level of corruption is greater than the threshold, it has a prominent negative influence on EE and has a regression coefficient of −0.13, which means that when the corruption level is 1%, the EE decreases by 0.13%. Judging from the average corruption level in the sample period, other regions in China, except Beijing, have passed the high threshold of corruption. In other words, government corruption in most regions of China has largely inhibited the improvement of EE. Therefore, the government should continue to strengthen anti-corruption efforts to improve EE.
Robustness Test
To verify the robustness between corruption and EE, a sensitivity analysis was conducted.
First, this study utilizes another index to characterize the general corruption degree, that is, the number of corruption cases in a million rather than per 10,000 civil servants in Equation (2). The new index is employed as a proxy variable for the degree of corruption to retest how corruption and EE relate to each other (Dong and Torgler, 2013; Wang and Wang, 2016; Wang and Gao, 2017). The results of the robustness test are shown in Table 10 shows the parameter estimation results. Table 11 and experiments (12) to (14) will be discussed in the following sections.
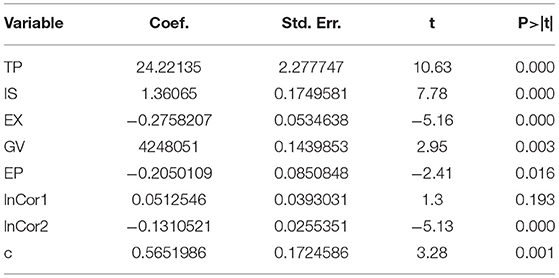
Table 10. Parameter estimation results.
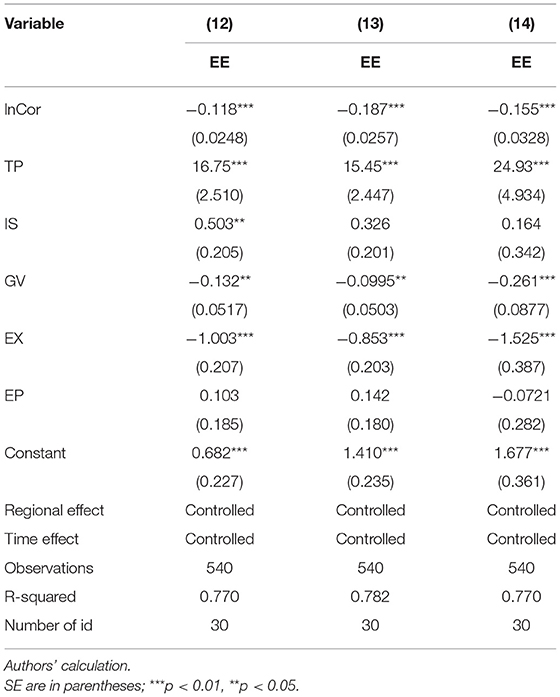
Table 11. Robustness test.
Experiment (12) shows the regression results when applying a new index of the degree of corruption. In Table 11 (12), the absolute value of the corruption coefficient on EE is 0.118, which is slightly smaller than 0.139 in the previous experiment (4) in Table 6, while the negative effect and coefficient significance remain the same. As for the other control variables, the sign of the coefficients and their significance are almost consistent with the previous results.
Second, corruption cases, as a main measure of the degree of corruption, have a significant time lag. Generally, corruption cases that occurred in a certain year will not be investigated and punished in that year. The lag period of cases normally varies from 1 to 6 years, even more than 10 years for certain special cases, although most corruption cases will be exposed within 3 years. Therefore, following Zhu (2016), the degree of corruption is recalculated based on the average of the number of post crimes in the current period and the next three periods. Moreover, a regression experiment (13) is performed based on a new degree of corruption to further validate the relation between corruption and EE. As shown in Table 11 (13), the influence of corruption on EE is consistent with the previous conclusion. The absolute value of the corruption coefficient to an EE of 0.187 becomes slightly larger than the previous 0.139, which further emphasizes a negative influence of corruption on EE in China.
Third, considering a steady number of corruption cases in China in the past 10 years, the entire period from 2008 to 2017 was taken as the research object from the full sample to test the stability of the results. The regression results are presented in Table 11 (14). Compared with the regression results in experiments (12) and (13), the signs of the explanatory variable and almost all control variables remain the same, only with the coefficient values slightly changed. The above conclusion is consistent with our expectations.
The robustness test confirms a strong negative impact of corruption on EE in China.
Conclusions and Policy Recommendations
Conclusions
This study utilizes the corruption and EE data of 30 provinces in China from 2000 to 2017 and uses a fixed effects model to analyze the relationship between corruption and EE. The study indicates that an increase in corruption generally decreases EE, while a negative impact of corruption on EE varies in different regions. A negative impact was observed in both eastern and western China, but a negative influence in eastern China is significantly higher than that in western China. Furthermore, a threshold-effect model was constructed to analyze the impact of different corruption levels on EE. When the corruption is below a certain threshold (11.37 cases per 10,000 public officials), its impact on EE is relatively weak, whereas when the corruption degree exceeds a certain threshold, a significant hindrance to EE can be found. Most of the provinces in China are currently above the threshold level of corruption, so anti-corruption efforts should continue to be intensified to ensure a steady improvement in EE.
In addition, this study analyzes the relationship between corruption and EE from a perspective of energy regulations. Although the dispatched provincial-level energy regulatory agencies have strengthened regulations, a negative impact of corruption can still be observed. In central and western China, where corruption is more severe, corruption harms energy regulations and weakens a positive effect of regulations on EE. However, in eastern China, where the degree of corruption is relatively low, the establishment of regulatory branches can significantly inhibit the negative effects of corruption.
Policy Recommendations
This study not only uncovers the correlation between corruption and EE statistically but also provides practical references and policy suggestions for an anti-corruption work in the energy industry of China. The following policy suggestions are proposed:
First, corruption can significantly hinder the improvement of EE, so the relationship between corruption and EE should be properly studied. Although China's anti-corruption work has achieved some results in recent years, the degree of corruption in most of the provinces of China is still serious, and the role of anti-corruption in the long-term development of the energy industry should be viewed properly. The centralization of administrative power and the lack of transparency in the Chinese government make it difficult for external supervision agencies to play an effective role in anti-corruption, which encourages the continuous growth of corruption. Therefore, an anti-corruption work requires a systemic reform and innovation. The state should effectively play legislative and supervisory roles in the people's congress, legally fill the loopholes in the congress's ability and procedures for a review and supervision of the public budget, and improve the transparency of government finances. In addition, the state should make the effective use of think tanks, strengthen the research on key fiscal and taxation issues, and promote the pluralistic participation of society.
Second, based on the findings of the cases of corruption investigated in the energy industry, government officials and enterprise executives form a chain of interest transmission. On one hand, the fixed asset investment projects of energy are often worth hundreds of millions, which are huge and can easily induce corruption. On the other hand, the power of examination and approval for energy market access and energy fixed asset investment is highly centralized, and the examination and approval processes are not very transparent, which provide a space for officials to seek rent. Therefore, for weak links and key areas of corruption in the energy industry, the government should use advanced technologies such as cloud computing and blockchain to innovate the means of anti-corruption work (Abeyratne and Monfared, 2016). Employing advanced technologies that are unable to tamper with and forge data, monitoring agencies and the public can track and verify each data block (Pellegrini et al., 2020) to suppress corruption effectively and improve the transparency of government public services.
Third, government regulations can improve the efficiency of resource allocation and ensure the effective implementation of regulatory policies, and thus improving EE. However, the existence of provincial energy regulatory agencies may lead to excessive GV and reduce EE. At the same time, government corruption will also affect energy regulatory agencies and reduce EE. Considering the different levels of corruption and marketization in the eastern, central, and western regions, the government should set up regulatory agencies according to the local corruption level, giving priority to regions with less corruption, such as the eastern provinces. In addition, regulators of the energy industry should be effectively supervised. The government should design a diversified external supervision system for energy regulations in China from the four dimensions of legislation, administration, justice, and society. In addition, to reduce the corruption of government regulations, the government should also advocate a rational participation of social organizations and citizens, and form an internal and external supervision mechanism of energy regulations with complementary functions and an effective coordination. Meanwhile, the government should improve the marketization mechanism of EP (Liu et al., 2020), play an effective role in improving resource allocation and EE, reducing GV in the economy, and gradually changing the positioning of government functions from an interventional government to a service one.
Data Availability Statement
The original contributions presented in the study are included in the article/supplementary material, further inquiries can be directed to the corresponding author/s.
Author Contributions
JL and JG: conceptualization and methodology. JL: data curation and software. JL and XB: formal analysis. XL and XB: investigation. XL: resources. FT-H: validation. JG and JL: writing—original draft. XL, FT-H, and JL: writing—review and editing. All authors contributed to the article and approved the submitted version.
Funding
This research was supported by funding from the National Natural Science Foundation of China (Grant Nos. 17AZZ017 and 71742001), the Natural Science Foundation of Zhejiang Province, China (Grant Nos. LY19G030016 and LQ18G010006), and the Grant-in-Aid for Excellent Young Researcher of the Ministry of Education of Japan (MEXT), of the Humanities and Social Sciences Research of the Ministry of education of the People's Republic of China.
Conflict of Interest
The authors declare that the research was conducted in the absence of any commercial or financial relationships that could be construed as a potential conflict of interest.
Abbreviations
Cor, Degree of Corruption; CO2, Carbon Dioxide; CCDI, Central Commission for Discipline Inspection; EP, Energy Prices; EX, Degree of Openness; EE, Energy Efficiency; GV, Government Intervention; IEA, International Energy Agency; IS, Changes in Economic Structure; NEA, Administration; PM2.5, Suspended Particulate Matter; R&D, Research and Development; SO2, Sulfur Dioxide; TP, Technological Progress; TEPI, Total-factor Energy Performance Indicator.
Footnotes
1. ^China Energy Statistical Yearbooks 1986-2018. Available online at: http://data.cn ki.net/ Trade/yearbook/single/N 201 90800 25?z=Z024. (accessed December 15, 2019).
2. ^China Statistical Yearbook 1999-2019. Available online at: http://data.stats.gov.cn /publish.htm? sort =14. (accessed December 15, 2019).
3. ^Eastern region of China refers to 11 provinces and provincial municipalities including Beijing, Tianjin, Hebei, Liaoning, Shanghai, Jiangsu, Zhejiang, Fujian, Shandong, Guangdong, and Hainan.
4. ^Central region of China refers to eight provinces including Shanxi, Jilin, Heilongjiang, Anhui, Jiangxi, Henan, Hubei, and Hunan.
5. ^Western region of China in this paper refers to 11 provinces and provincial municipalities including Sichuan, Guizhou, Yunnan, Inner Mongolia, Guangxi, Shaanxi, Gansu, Qinghai, Ningxia, Xinjiang, and Chongqing. Tibet province is not included due to the missing data.
References
Abeyratne, S., and Monfared, R. (2016). Blockchain ready manufacturing supply chain using distributed ledger. Int. J. Renew. Energy Technol. 5, 1–10. doi: 10.15623/ijret.2016.0509001
Aguilera, R. F., and Ripple, R. D. (2012). Technological progress and the availability of European oil and gas resources. Appl. Energy 96, 387–392. doi: 10.1016/j.apenergy.2012.02.069
Aidt, T. S. (2016). Rent seeking and the economics of corruption. Constitute. Pol. Econ. 27, 142–157. doi: 10.1007/s10602-016-9215-9
Albino, V., Ardito, L., Dangelico, R. M., and Petruzzelli, A. M. (2014). Understanding the development trends of low-carbon energy technologies: a patent analysis. Appl. Energy 135, 836–854. doi: 10.1016/j.apenergy.2014.08.012
Antonietti, R., and Fontini, F. (2019). Does energy price affect energy efficiency? Cross-country panel evidence. Energy Policy 129, 896–906. doi: 10.1016/j.enpol.2019.02.069
Apergis, N., Dincer, O. C., and Payne, J. E. (2010). The relationship between corruption and income inequality in US states: evidence from a panel cointegration and error correction model. Public Choice 145, 125–135. doi: 10.1007/s11127-009-9557-1
Bian, Y., Song, K., and Bai, J. (2019). Market segmentation, resource misallocation and environmental pollution. J. Clean. Prod. 228, 376–387. doi: 10.1016/j.jclepro.2019.04.286
Borensztein, E., De Gregorio, J., and Lee, J. W. (1998). How does foreign direct investment affect economic growth? J. Int. Econ. 45, 115–135. doi: 10.1016/S0022-1996(97)00033-0
Chen, G., Li, S., and Yin, X. (2008). Corruption and China's economic growth: an empirical perspective. Compar. Econ. Soc. Syst. 03, 59–68. (in Chinese)
Cole, S., and Tran, A. (2011). 14 Evidence from the firm: a new approach to understanding corruption. International handbook on the economics of corruption, 408(7).
Dan, S. H. I. (2006). Regional differences in China's energy efficiency and conservation potentials. China Industr. Econ. 10, 49–58. (in Chinese) Data Available online at: http://www.ccdi.gov.cn/scdc/ (accessed December 25, 2019).
Del Monte, A., and Papagni, E. (2007). The determinants of corruption in Italy: regional panel data analysis. Eur. J. Polit. Econ. 23, 379–396. doi: 10.1016/j.ejpoleco.2006.03.004
Dong, B., and Torgler, B. (2013). Causes of corruption: evidence from China. China Econ. Rev. 26, 152–169. doi: 10.1016/j.chieco.2012.09.005
Dong, K., Sun, R., Hochman, G., and Li, H. (2018). Energy intensity and energy conservation potential in china: a regional comparison perspective. Energy 155, 782–795. doi: 10.1016/j.energy.2018.05.053
Eberhard, A. (2007). Infrastructure Regulation in Developing Countries; An Exploration of Hybrid and Transitional Models. Washington, DC: Public-Private Infrastructure Advisory Facility (PPIAF), World Bank.
Egger, P., and Winner, H. (2005). Evidence on corruption as an incentive for foreign direct investment. Eur. J. Polit. Econ. 21, 932–952. doi: 10.1016/j.ejpoleco.2005.01.002
Fan, C. S., and Grossman, H. I. (2001). Incentives and corruption in Chinese economic reform. Econ. Policy Reform. 4, 195–206. doi: 10.2139/ssrn.261701
Fisher-Vanden, K., Jefferson, G. H., Liu, H., and Tao, Q. (2004). What is driving China's decline in energy intensity? Resour. Energy Econ. 26, 77–97. doi: 10.1016/j.reseneeco.2003.07.002
Fisman, R., and Gatti, R. (2002). Decentralization and corruption: Cross-country and cross-state evidence. J. Public Econ. 83, 325–345. doi: 10.1016/S0047-2727(00)00158-4
George, E. G., and Tzeremes, N. G. (2013). Carbon dioxide emissions and governance:a nonparametric analysis for the G-20. Energy Econ. 40, 110–118. doi: 10.1016/j.eneco.2013.06.010
Halkos, G. E., and Tzeremes, N. G. (2013). Carbon dioxide emissions and governance: a nonparametric analysis for the G-20. Energy Econ. 40, 110–118.
Hansen, B. E. (1999). Threshold effects in non-dynamic panels: estimation, testing, and inference. J. Econom. 93, 345–368. doi: 10.1016/S0304-4076(99)00025-1
Huang, J., Du, D., and Tao, Q. (2017). An analysis of technological factors and energy intensity in china. Energy Policy 109, 1–9. doi: 10.1016/j.enpol.2017.06.048
Ju, K., Su, B., Zhou, D., and Wu, J. (2017). Does energy-price regulation benefit China's economy and environment? Evidence from energy-price distortions. Energy Policy 105, 108–119. doi: 10.1016/j.enpol.2017.02.031
Kaller, A., Bielen, S., and Marneffe, W. (2018). The impact of regulatory quality and corruption on residential electricity prices in the context of electricity market reforms. Energy Policy 123, 514–524. doi: 10.1016/j.enpol.2018.09.008
Kander, A., Warde, P., Henriques, S. T., Nielsen, H., Kulionis, V., and Hagen, S. (2017). International trade and energy intensity during European industrialization, 1870–1935. Ecol. Econ. 139, 33–44. doi: 10.1016/j.ecolecon.2017.03.042
Kaufmann, D., and Wei, S. (2000). “Does ‘grease money' speed up the wheels of commerce?” in National Bureau of Economic Research Working, Paper No. 7093 (Cambridge, MA). doi: 10.3386/w7093
Knack, S. (2006). Measuring Corruption in Eastern Europe and Central Asia: A Critique of the Cross-Country Indicators. Washington, DC: The World Bank. doi: 10.1596/1813-9450-3968
Leff, N. H. (1964). Economic development through bureaucratic corruption. Am. Behav. Sci. 8, 8–14. doi: 10.1177/000276426400800303
Leys, C. (1965). What is the problem about corruption? Modern Afr. Stud. 3, 215–230. doi: 10.1017/S0022278X00023636
Li, K., and Lin, B. (2014). The nonlinear impacts of industrial structure on China's energy intensity. Energy 69, 258–265. doi: 10.1016/j.energy.2014.02.106
Li, K., and Lin, B. (2017). An application of a double bootstrap to investigate the effects of technological progress on total-factor energy consumption performance in China. Energy 128, 575–585. doi: 10.1016/j.energy.2017.04.044
Lin, B., and Du, K. (2013). The energy effect of factor market distortion in China. Econ. Res. J. 9, 125–136. (in Chinese)
Lin, B., and Zhang, G. (2013). Estimates of electricity saving potential in Chinese nonferrous metals industry. Energy Policy 60, 558–568. doi: 10.1016/j.enpol.2013.05.051
Lin, B. Q., and Liu, H. X. (2015). Do energy and environment efficiency benefit from foreign trade?—the case of China's industrial sectors. Econ. Res. J. 9, 127–141. (in Chinese)
Liu, Q., Lu, R. S., and Ma, X. J. (2015). Corruption, financial resources and exports. Rev. Int. Econ. 235, 1023–1043. doi: 10.1111/roie.12194
Liu, W., Zhang, X., Wu, Y., and Feng, S. (2020). Economic analysis of renewable energy in the electricity marketization framework: a case study in Guangdong, China. Front. Energy Res. 8:98. doi: 10.3389/fenrg.2020.00098
Lovei, L., and McKechnie, A. (2000). The Costs of Corruption for the Poor-The Energy Sector. Washington, DC: World Bank Other Operational Studies 11437, the World Bank.
Ma, L. (2015). Corruption and FDI technology spillover – research on threshold effect based on provincial panel data. Commer. Econ. Res. 18, 115–117. (in Chinese)
Méndez, F., and Sepúlveda, F. (2006). Corruption, growth and political regimes: cross country evidence. Eur. J. Polit. Econ. 22, 82–98. doi: 10.1016/j.ejpoleco.2005.04.005
Mo, P. H. (2001). Corruption and economic growth. J. Comp. Econ. 29, 66–79. doi: 10.1006/jcec.2000.1703
National Bureau of Statistics (2020). Since the establishment of the National Bureau Energy, 2 directors and 8 directors have been injured! No. 30 in Nogen system, No. 80 in Nogen business (Appendix details). Available online at: https://www.sohu.com/a/255202925_752796 (accessed December 15, 2019).
Nye, J. S. (1967). Corruption and political development: a cost-benefit analysis. Am. Polit. Sci. Rev. 61, 417–427. doi: 10.2307/1953254
Oikonomou, V., Jepma, C., Becchis, F., and Russolillo, D. (2008). White Certificates for energy efficiency improvement with energy taxes: a theoretical economic model. Energy Econ. 30, 3044–3062. doi: 10.1016/j.eneco.2008.04.005
Ouyang, X., and Lin, B. (2015). An analysis of the driving forces of energy-related carbon dioxide emissions in China's industrial sector. Renew. Sust. Energ. Rev. 45, 838–849. doi: 10.1016/j.rser.2015.02.030
Pailler,S. (2018). Re-election incentives and deforestation cycles in the Brazilian Amazon. J. Environ. Econ. Manag. 88, 345–365.doi10.1016/j.jeem.2018.01.008 doi: 10.1016/j.jeem.2018.01.008
Patterson, M. G. (1996). What is energy efficiency? Concepts, indicators and methodological issues. Energy Policy. 24, 377–390. doi: 10.1016/0301-4215(96)00017-1
Pellegrini, L., Campi, S., Locatelli, M., Pattini, G., Di Giuda, G. M., and Tagliabue, L. C. (2020). Digital transition and waste management in architecture, engineering, construction, and operations industry. Front. Energy Res. 8:576462. doi: 10.3389/fenrg.2020.576462
Proskuryakova, L., and Kovalev, A. (2015). Measuring energy efficiency: is energy intensity a good evidence base? Appl. Energy. 138, 450–459. doi: 10.1016/j.apenergy.2014.10.060
Restuccia, D., and Rogerson, R. (2017). The causes and costs of misallocation. J. Econ. Perspect. 31, 151–174. doi: 10.1257/jep.31.3.151
Rose-Ackerman, S., and Palifka, B. J. (2016). Corruption and Government: Causes, Consequences, and Reform. Cambridge: Cambridge University Press. doi: 10.1017/CBO9781139962933
Roy, J., and Yasar, M. (2015). Energy efficiency and exporting: evidence from firm-level data. Energy Econ. 52, 127–135. doi: 10.1016/j.eneco.2015.09.013
Shi, B., and Shen, K. (2013). The government intervention, the economic agglomeration and the energy efficiency. Management World. 10, 6–18. (in Chinese).
Shibao, L., Xiao, B., Wei, L., and Ning, W. (2019). Impacts of climate change on water resources and grain production. Technol. Forecast. Soc. Change 143, 76–84. doi: 10.1016/j.techfore.2019.01.015
Shibao, L., Xiaoling, Z., Huarong, P., Martin, S., Xiao, B., and Zhihong, Z. (2021). The energy-food-water nexus: water footprint of Henan-Hubei-Hunan in China. Renew. Susta. Energy Rev. 135:110417. doi: 10.1016/j.rser.2020.110417
Shibao, L., Xiaoling, Z., and Yao, T. (2020). Evolutionary analysis on structural characteristics of water resource system in basins of Northern China. Sus. Dev. 2020, 1–13. doi: 10.1002/sd.2031
Stiglitz, J. (1998). Distinguished lecture on economics in government: the private uses of public interests; incentives and institutions. J. Econ. Perspect 12, 3–22. doi: 10.1257/jep.12.2.3
Tan, R. (2014). Ten-Year Overview of the State Electricity Regulatory Commission. Beijing: China Electric Power Press, 279–323. (in Chinese).
Vial, V., and Hanoteau, J. (2010). Corruption, manufacturing plant growth, and the Asian paradox: Indonesian evidence. World Dev. 38, 693–705. doi: 10.1016/j.worlddev.2009.11.022
Voigt, S., De Cian, E., Schymura, M., and Verdolini, E. (2014). Energy intensity developments in 40 major economies: structural change or technology improvement? Energy Econ. 41, 47–62. doi: 10.1016/j.eneco.2013.10.015
Wang, J. (2018). Research on China's Modern Energy Regulatory System and Regulatory Efficiency. Beijing: China Social Sciences Press. (in Chinese).
Wang, J., and Gao, M.-H. (2017). Anticorruption, entrepreneurial competencies and enterprise innovation. Busin. Manag. J. 39, 36–52. (in Chinese).
Wang, S., Zhao, D., and Chen, H. (2020). Government corruption, resource misallocation, and ecological efficiency. Energy Econ. 85:104522. doi: 10.1016/j.eneco.2019.104573
Wang, X., and Wang, K.-Q. (2016). Impact of corruption on banks' non-performing loans – based on chinese provinical dynamic panel GMM method. Collected Essays Fin. Econ. 08, 36–43. (in Chinese).
Wang, Y., and You, J. (2012). Corruption and firm growth: evidence from China. China Econ. Rev. 23, 415–433. doi: 10.1016/j.chieco.2012.03.003
Wei, C., and Li, C. Z. (2017). Resource misallocation in Chinese manufacturing enterprises: evidence from firm-level data. J. Clean. Prod. 142, 837–845. doi: 10.1016/j.jclepro.2016.04.083
Wu, L. (2009). The Fluctuations of China' s energy efficiency: theoretical explains, numerical simulations and policy experiments. Econ. Res. 5, 130–142. (in Chinese)
Wu, Y. (2008). Fiscal decentralization, corruption and governance. China Econ. Q. 7, 1045–1060. (in Chinese).
Wu, Y., and Rui, M. (2010). Regional corruption, marketization and China's economic growth. Manag. World 11, 10–17. (in Chinese).
Yang, M. A., Yang, F. X., and Sun, C. W. (2018). Factor market distortion correction, resource reallocation and potential productivity gains: an empirical study on China's heavy industry sector. Energ. Econ. 69, 270–279. doi: 10.1016/j.eneco.2017.11.021
Yang, Z. (2010). Study on influence factors of china manufacturing energy efficiency: business circle and heavy industry. Statist. Res. 10, 33–39. (in Chinese).
Yongzheng, L., and Haibo, F. (2011). Corruption, public expenditure efficiency and economic growth. Econ. Res. J. 9, 17–28. (in Chinese).
Zhao, N., Xia, T., Yu, T., and Liu, C. (2020). Subsidy-related deception behavior in energy-saving products based on game theory. Front. Energy Res. 7:154. doi: 10.3389/fenrg.2019.00154
Zhu, L. (2016). The influence of corruption and market of TFP on Chinese provinces – an empirical analysis based on 30 provincial panel data of china during 2001-2011 (Doctoral dissertation). Dongbei University Of Finance And Economics, China (in Chinese).
Keywords: energy efficiency, energy regulation, energy policy, government corruption, energy regulatory agency
Citation: Liu J, Guo J, Liu X, Bai X and Taghizadeh-Hesary F (2021) Does Anti-corruption Policy Influence Energy Efficiency in China? Front. Energy Res. 9:634556. doi: 10.3389/fenrg.2021.634556
Received: 28 November 2020; Accepted: 15 March 2021;
Published: 30 April 2021.
Edited by:
Yanfei Li, Hunan University of Technology and Business, ChinaReviewed by:
Kangyin Dong, University of International Business and Economics, ChinaYang Zhang, Hunan University of Technology and Business, China
Copyright © 2021 Liu, Guo, Liu, Bai and Taghizadeh-Hesary. This is an open-access article distributed under the terms of the Creative Commons Attribution License (CC BY). The use, distribution or reproduction in other forums is permitted, provided the original author(s) and the copyright owner(s) are credited and that the original publication in this journal is cited, in accordance with accepted academic practice. No use, distribution or reproduction is permitted which does not comply with these terms.
*Correspondence: Jianming Guo, am1ndW9AenVmZS5lZHUuY24=; Farhad Taghizadeh-Hesary, ZmFyaGFkQHRzYy51LXRva2FpLmFjLmpw; Xiangfeng Liu, bGl1eGlhbmdmZW5nODVAenVmZS5lZHUuY24=