 Chen Feng1
 Rong Kang
 Caiquan Bai
- 1School of Public Economics and Administration, Shanghai University of Finance and Economics, Shanghai, China
- 2School of Finance, Nankai University, Tianjin, China
- 3School of Economics and Management, Northwest University, Xi’an, China
- 4The Center for Economic Research, Shandong University, Jinan, China
- 5School of Economics and Finance, Xi’an Jiaotong University, Xi’an, China
Based on the provincial panel data of China from 2001 to 2016, this study uses the social network analysis approach to empirically investigate the characteristics and driving factors of the spatial association network of China’s interprovincial renewable energy technology innovation. The findings are as following. 1) The spatial association of China’s interprovincial renewable energy technology innovation exhibits a typical network structure. Moreover, its network density, network hierarchy and network efficiency are 0.3696, 0.6667 and 0.7833 in 2001 and 0.4084, 0.4764 and 0.7044 in 2016, respectively, implying the spatial association network became more and more complex and the interprovincial association strengthened during the sample period. 2) This spatial association network presents a “core-edge” distribution pattern. The positions and roles of various provinces vary greatly in the spatial association network. Specifically, the developed coastal regions such as Shanghai, Beijing and Tianjin have a degree centrality, closeness centrality and betweenness centrality of above 75, 80 and 10, respectively, indicating that they always play a central role in the network. However, the northeastern regions and the relatively backward central and western regions such as Heilongjiang, Jilin, Xinjiang, Hainan and Hebei only have a degree centrality, closeness centrality and betweenness centrality of below 20, 55 and 0.1, respectively, indicating that they are at a relatively marginal position. 3) The geographical proximity and the expansion of the differences in economic development level and R&D inputs are conducive to the enhancement of the spatial association of China’s renewable energy technology innovation.
Introduction
As an important production factor for building a modern economic system, energy is closely linked to national economy, people's livelihood and economic security. With the rapid development of economy, China has become the largest energy consumer and the largest CO2 emitter in the world (Dong et al., 2018; Bai et al., 2019; Ma et al., 2019). However, due to the limitation of energy endowments, China’s energy consumption has been dominated by coals for a long time, which causes serious environmental pollution problems and brings major challenges to energy security (Wang et al., 2016; Long et al., 2017; Liang et al., 2019). Numerous studies have found that the development of renewable energies can contribute to reducing carbon emissions (Jaforullah and King, 2015; Dong K. et al., 2017; Lin and Zhu, 2017; Lin and Zhu, 2019; Wang et al., 2021), optimizing energy structure (Dong K.-Y. et al., 2017; Chen and Lei, 2018; Liang et al., 2019) and ensuring energy security (Irandoust, 2016; Hamed and Bressler, 2019; Tareq and Lindsey, 2019). China is fully aware of the importance of developing renewable energies. Therefore, in the 2014–2020 Strategic Action Plan for Energy Development, the Chinese government makes a promise to reduce the annual coal consumption below 4.2 billion tons and the share of coal below 62% by 2020. Meanwhile, China will actively develop renewable energies to increase the share of non-fossil fuels in the total primary energy mix from 9.8% in 2013 to 15% by 2020 (National Energy Administration of the People’s Republic of China, 2014).
Renewable energy technologies play a positive role in saving energies and reducing carbon emissions, which has been confirmed by a large number of studies (Muis et al., 2010; Anandarajah and Gambhir, 2014; Jaforullah and King, 2015; Long et al., 2015; Lin and Zhu, 2017; Lin and Zhu, 2019). Promoting renewable energy technology innovation and large-scale applications has become an important strategy for building a modern energy system. However, due to unbalanced regional development, China’s technological innovation endowments vary greatly in different regions. Typically, the eastern provinces play technological leaders to promote the progress in technology frontier and provide with the most advanced technologies, while the central and western provinces are learners and chasers. More to the point, the overall technological progress in China needs not only innovations from the leaders, but also sustaining R&D inputs and innovations from the laggards to absorb and localize technologies. Therefore, the spatially dispersed regions form an innovation community, playing different but associated roles in the overall development of renewable energy technology. Whether the scarce innovation resources are distributed across regions in a coordinated and efficient way endogenously affects the performance of the modern energy system in China. In this sense, it is necessary to systematically investigate the spatial association of interprovincial renewable energy technologies in China.
At present, researches on renewable energy technology innovation are mainly focused on exploring their driving factors. They have studied the impacts of R&D inputs (Johnstone et al., 2010; Popp et al., 2011; Li and Lin, 2016; Joëlle and Shestalova, 2017), energy price (Johnstone et al., 2010; Nicolli and Vona, 2016; Grafström and Lindman, 2017; He et al., 2018; Lin and Chen, 2018), financial development (Brunnschweiler, 2010; Li and Wang, 2011; Kim and Park, 2016), economic growth (Li and Lin, 2016; He et al., 2018; Xu and Lin, 2018), and other factors on renewable energy technology innovation. As pointed out by the new economic geography, the economic behaviors of economic entities have the spatial dependence on each other, and the economic linkages and knowledge spillovers between regional economic entities can promote the rapid development of the whole region through interregional spatial associations (Krugman P., 1991a; Krugman P., 1991b). As the subsystem under the national renewable energy technology innovation system, the regional renewable energy technology innovation systems generally interrelate with each other. However, the above always use the traditional econometric methods to investigate the impacts of the internal factors of each subsystem on renewable energy technology innovation activities, without considering the impacts of the inter-association between subsystems. With the development of spatial econometrics, the academic community has begun to pay attention to the issue of innovation spillovers between different geographical regions. Currently, a considerable number of researches has concerned the spatial association of technological innovation activities, reaching a relatively consistent conclusion. To be specific, there is a significant spatial correlation between technological innovation activities. In other words, the innovation performance in a certain region is affected by the innovation activities in surrounding regions (Keller, 2002; Bottazzi and Peri, 2003; Moreno et al., 2005; Cabrer-Borrás and Serrano-Domingo, 2007; Shang et al., 2012).
In general, there are still some shortcomings in existing literature as follows. First, in terms of research objects, most studies focus on general technology innovation activities but don’t discuss the specific technology innovation activities such as the renewable energy technology innovation (RETI). Meanwhile RETI is of great significance to conserve energies, reduce emissions and prevent pollution. Second, in terms of research methods, except the spatial weight matrix data, the other data used in the above studies is attribute data1, having no concern with the spatial association relationship between samples. The traditional spatial econometric methods used in the existing studies only consider the geographical proximity effect, which is difficult to grasp the spatial association characteristics of innovation activities on the whole. In fact, with the improvement of transportation infrastructure and the advancement of marketization, the association of innovation activities has exceeded the proximity relationship in the traditional spatial econometric analysis, but exhibits a multi-threaded complex network. The social network analysis (SNA) approach using the relational data2 can break through the limitations of attribute data, and better describe the characteristics of the overall spatial association network and the nodes in the network. So, it is gradually used for spatial association analysis of innovation activities. For instance, Maggioni and Uberti (2009) and Wanzenböck et al. (2014) use this approach to analyze the innovation activities across the Europe and explore their spatial association network characteristics; Li et al. (2015) employ it to study the spatial and temporal evolution of urban innovation network in China; Shao et al. (2018) adopt it to study the spatial network structure and driving factors of regional innovation development in China. Third, in terms of the research contents, most are focused on the characteristics of the spatial association network of technology innovation activities, but the driving factors of its formation are rarely discussed.
The academic contributions of this paper are as follows. First, this paper enriches the existing literature on renewable energy technology innovation research, especially the empirical analysis from a spatial perspective, and provides Chinese evidence that renewable energy technology innovation is spatially associated. The social network analysis is innovatively introduced into the field of energy research, providing a new perspective for the research on the spatial association of renewable energy technology innovation. Our method breaks through the limitations of traditional econometric methods, no longer limited to the geographical proximity. Additionally, the social network analysis method abandons the traditional attribute data, and directly uses matrix data to examine the spatial association relationship and describe the structure and characteristics of the spatial association network, making the entire analysis process easier and more reliable. Second, taking China’s 30 provinces and municipalities as spatially associated subsystems, we describe the characteristics of the overall spatial association network by using the Social Network Analysis (SNA) approach, and visualize the status of each province in the spatial association network by using GIS (geographic information system) technology. This not only enables us to better understand the role of each province in the complex interprovincial association network but also depict the “core-edge” pattern of China’s renewable energy technology innovation from a spatial perspective. Meanwhile, the reasons for the gap of renewable energy technology innovation in different regions are analyzed in detail. Third, this paper takes China as an example to empirically analyze the factors influencing the spatial association network of renewable energy technology innovation. These factors may also affect the international and regional renewable energy technology cooperation, helping us to find a breakthrough for international and regional cooperation in renewable energy technology. Moreover, the driving factors are empirically analyzed by the Quadratic Assignment Procedure (QAP) analysis. This is a non-parametric estimation method based on matrix data, no need to consider the common colinearity problem of the traditional OLS regression method, thus greatly facilitating the research of the influencing factors of association relationship from the perspective of renewable-energy-related policy.
Methodology and Data
Determination of the Spatial Association of Renewable Energy Technology Innovation
The SNA approach takes “association” as the basic analysis unit, used for analyzing relational data (Liu, 2009). Thus, the determination of the spatial association of renewable energy technology innovation is the key to this study. Gravity model and VAR Granger Causality test method are frequently used to determine such an association in existing researches. For this study, the Gravity model outperforms the VAR model as the former can construct the corresponding renewable energy technology innovation association matrix based on the data of each year. Hence, it can analyze the overall network structure of every year and therefore describe the dynamic evolution trend of the spatial association network while the VAR model cannot. Additionally, the lag order is required when using the VAR model, and the results may be biased due to the subjective selection of the lag order. But the Gravity model can avoid the sensitivity and errors caused by subjective selection. Therefore, following Maggioni and Uberti (2009) and Broekel et al. (2014), we select the gravity model to determine the spatial association of renewable energy technology innovation. The basic gravity model is as follows (Hoekman et al., 2009; Broekel et al., 2014; Kuik et al., 2019):
where
In this study, the gravity model is modified to enhance its applicability. The primary task is to determine the measurement indicators of renewable energy technology innovation “mass”. The number of renewable energy technology patent grants is selected to indicate the development level of renewable energy technology innovation since it is a widely used indicator of the output of energy-related R&D activities (Lam et al., 2017; Kim et al., 2017). Additionally, considering that an economically developed region often has good infrastructure and a strong ability to attract the resources and factors for renewable energy technology innovation, the economic development level indicator is used. Given that R&D personnel are the main promoters and implementers of renewable energy technology innovation activities, the number of R&D personnel is included. To sum up, the geometric means of the number of renewable energy technology patent grants, the regional real GDP and the number of R&D personnel are used to represent the regional renewable energy technology innovation “mass” (
Based on the study of Shao et al. (2018), the distance attenuation coefficient b is assigned a value of 2; the ratio of the number of the renewable energy technology patent grants of region i to the sum of regions i and j is selected as the empirical constant. Furthermore, in order to simultaneously consider the impacts of the spatial and economic distances on the spatial association of renewable energy technology innovation, we divide the straight-line distance of regions i and j (Dij, i.e., the distance between the provincial capitals) by their differences in per capita GDP (i.e., gi–gj). The specific model is as follows:
where
A gravitational matrix is obtained according to the above equation, and the average of each row is taken as the critical value. If the gravity value of a matrix element is higher than the critical value of the row, then the element is defined as 1, indicating that there is an association in renewable energy technology innovation between the two regions; otherwise, the element is defined as 0, indicating that there is no association between them (Liu et al., 2015; Su and Yu, 2019).
Network Characteristic Indicators
Overall Network Characteristics
(1) Network density. It represents the density of associations and the degree of closeness between nodes in a network, namely a measure of network completeness (Kim et al., 2020). A greater network density means an increased number of associations, and a closer spatial association between the regions in a network (Su and Yu, 2019). The network density is measured by the ratio of the actual number of associations to the maximum possible number of associations in a network. The network density is defined as Eq. 3 as follows, where
(2) Network hierarchy. It measures the asymmetrical reachability between nodes in a network, reflecting the hierarchical structure and dominance of each node. A lower network hierarchy means a decreased number of asymmetric associations and a less strict hierarchical structure (Liu et al., 2015). The network hierarchy is defined as Eq. 4 as follows, where
(3) Network connectedness. It measures the accessibility between nodes in a network (Kim et al., 2020). If there is an association between any two nodes in a network, then the network structure is relatively stable and the network connectedness is 1. If there are more isolated nodes in the network, that is to say, these nodes cannot associate with other nodes directly or indirectly, then the network connectedness is smaller. The network connectedness is defined as Eq. 5 as follows, where
(4) Network efficiency. It represents the degree of redundant associations in a network (Shao et al., 2018). A lower network efficiency means an increased number of spatial association channels between nodes, a more obvious multiple superpositions of spatial associations and a more stable network structure. The network efficiency is defined as Eq. 6 as follows, where
Node Network Characteristics
In this study, the node network characteristics are described by using degree centrality, closeness centrality and betweenness centrality.
(1) Degree centrality. It measures the ability of a node to control other nodes (Liu et al., 2015). If a node has a higher degree centrality, then the node has more associations with other nodes in the network with a stronger ability to control other nodes (Huallacháin and Lee, 2014). The degree is the ratio of the number of nodes directly associated with a certain node (n) to the maximum possible number of directly associated nodes (N). It is defined as follows:
(2) Closeness centrality. It measures the ability of a node to be out of the control of other nodes (Song et al., 2019). If a node has a higher closeness centrality, then the node is less susceptible to other nodes, and closer to the center of the network. Its specific definition is shown in Eq. 8 as follows, where
(3) Betweenness centrality. It measures the ability of a node to act as a “bridge” connecting other nodes (Shao et al., 2018). If a node has a high betweenness centrality, then the node has a stronger ability to control the association behaviors of other nodes. It can play a greater “bridge” and “intermediary” role, and is closer to the center of the network. It is defined as follows:
where
Overall, degree centrality, closeness centrality and betweenness centrality all reflect the position and role of each node in the network from different aspects. If a node is closer to the center in the network, then it is more capable of affecting other nodes, or other nodes have greater dependence on it. This means it have a higher centrality. By calculating the centrality of each node in the network, the position and role of each node can be described in the network, thus showing the distribution pattern of the network.
The Factors Influencing the Spatial Association Network
Based on the above analysis, the influential factors of the spatial association network are investigated by using the non-parametric QAP (quadratic assignment procedure) method. It does not assume the independence of explanatory variables. Compared with the traditional OLS method, it can effectively eliminate the estimation bias due to multicollinearity among independent variables by permuting the matrix data and is therefore more suitable for the parameter estimation of the matrix data (Bai et al., 2020a). Additionally, compared with the parametric method, its estimation results are generally more robust (Su and Yu, 2019).
According to the studies (Wang et al., 2018; Su and Yu, 2019), the QAP correlation analysis and QAP regressions analysis are employed to explore the driving factors of the spatial association network of China’s renewable energy technology innovation.
The steps of the QAP correlation analysis are as follows. The first step is to convert all matrixes into long vectors, and calculate the correlation coefficients. Then the correlation coefficients are re-calculated for many times through simultaneous and random permutation in rows and columns of the matrixes. Therefore, the distribution of the correlation coefficients is obtained. Finally the significance levels of correlation coefficients are calculated according to the proportion of the correlation coefficients greater or equal to the correlation coefficient calculated for the first time.
Before regression analysis, the driving factors that are significantly related to the spatial association matrix of renewable energy technology innovation are selected through QAP correlation analysis. Then they are used as the explanatory variables for QAP regression analysis. The steps of QAP regression analysis resemble to that of the QAP correlation analysis. The difference is that the former calculates the regression coefficients instead of correlation coefficients so that the explanatory variables that are insignificant in QAP correlation analysis are excluded.
When investigating the driving factors of the spatial association network, we first focus on the geographical proximity relationship. Relevant researches show that there may be a strong spatial association of renewable energy technology innovation between geographically adjacent regions (Keller, 2002; Bottazzi and Peri, 2003; Hoekman et al., 2009; Shang et al., 2012). Thus, we use the indicator of geographical proximity and test if its impact exists. Additionally, the proximity of economic characteristics is also considered as suggested by related studies (Boschma, 2005). Its effect can be ambiguous, depending on various economic indicators. For instance, two regions that are similar in terms of knowledge stock are likely to cooperate and share knowledge. But two regions with large divergence in energy resource endowments always entail flow of energy-related knowledge, since the eastern provinces in China are relatively rich in technology and poor in energy resource endowments compared with western provinces. Thus, following the existing researches (Joëlle and Shestalova, 2017; He et al., 2018; Lin and Chen, 2018), we divide the difference in economic characteristics into three aspects. First is the difference in economic development mode that is the core element of economic characteristics. Specifically, the difference in economic development level, the difference in industrial structure and the difference in the opening-up degree are selected. Second is the difference in energy consumption status. Specifically, the differences in energy consumption intensity and energy price are used, considering they affect the development of renewable energy technologies from the demand side. Third is the difference in science, technology, and education. It may lead to the flow of innovation resources among regions. Specifically, the differences in intensity of R&D inputs and scale of higher education are used.
Based on the above theoretical analysis, the following model is constructed:
The specific measures of driving factor variables are illustrated in Table 1. To obtain the differences in the above economic characteristic indicators between regions, we first calculate the average of the above indicators from 2001 to 2016, and then construct the difference matrices of the corresponding indicators by the absolute values of the differences between the corresponding indicators of each province. Since the measurement units of these difference matrices are different, they are normalized by the Z-value normalization method, so that the average of each driving factor difference matrix is 0, and its standard deviation is 1.
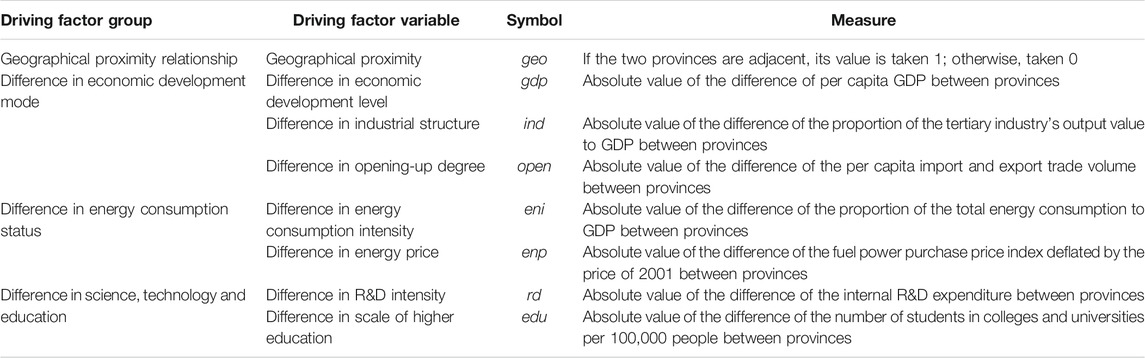
TABLE 1. Measure of driving factor variables.
Data Sources
In this study, 30 provinces and municipalities in China are selected (excluding the Tibet, Hong Kong, Macao, and Taiwan due to the unavailability of data). The research period is from 2001 to 2016. The data of the regional GDP, the per capita GDP, the GDP deflator, the tertiary industry's output value, the export trade, the population and the number of R&D personnel is derived from the China Statistical Yearbook (National Bureau of Statistics of the People’s Republic of China, 2002–2017a) and China Statistical Yearbook on Science and Technology (National Bureau of Statistics of the People’s Republic of China and Ministry of Science and Technology of the People’s Republic of China, 2002–2017). The total energy consumption and the fuel power purchase price index are derived from the China Energy Statistical Yearbook (National Bureau of Statistics of the People’s Republic of China, 2002–2017b). And the number of renewable energy technology patent grants is derived from China’s official patent search system, i.e., the Patent Search and Analysis (PSA) system of the China’s National Intellectual Property Administration (CNIPA)3 which has been used by Lin and Zhu (2019) and Bai et al. (2020). The price-related variables are deflated by the constant price of 2001 to reduce the impact of the price factor. The geographical distance between provinces is expressed by the straight-line distance, which calculated by the latitude and longitude coordinates of the provincial capitals. And the R&D capital stock data is calculated using the method of Wu (2006).
Network Structure Characteristics
Structure Characteristics and Evolution Trend of the Overall Network
Based on the modified gravity model, the spatial association of China’s interprovincial renewable energy technology innovation is determined and a spatial association matrix is established. Then, Netdraw, a visualization tool in UCINET (University of California at Irvine NETwork) software (Liu, 2009), is used to draw the spatial association network in 2001 and 2016 (see Figure 1 for details). It can be seen that the spatial association of China’s interprovincial renewable energy technology innovation exhibits a typical network structure. Meanwhile, compared with that in 2001, the spatial association network in 2016 is more complex and more closely associated in space.
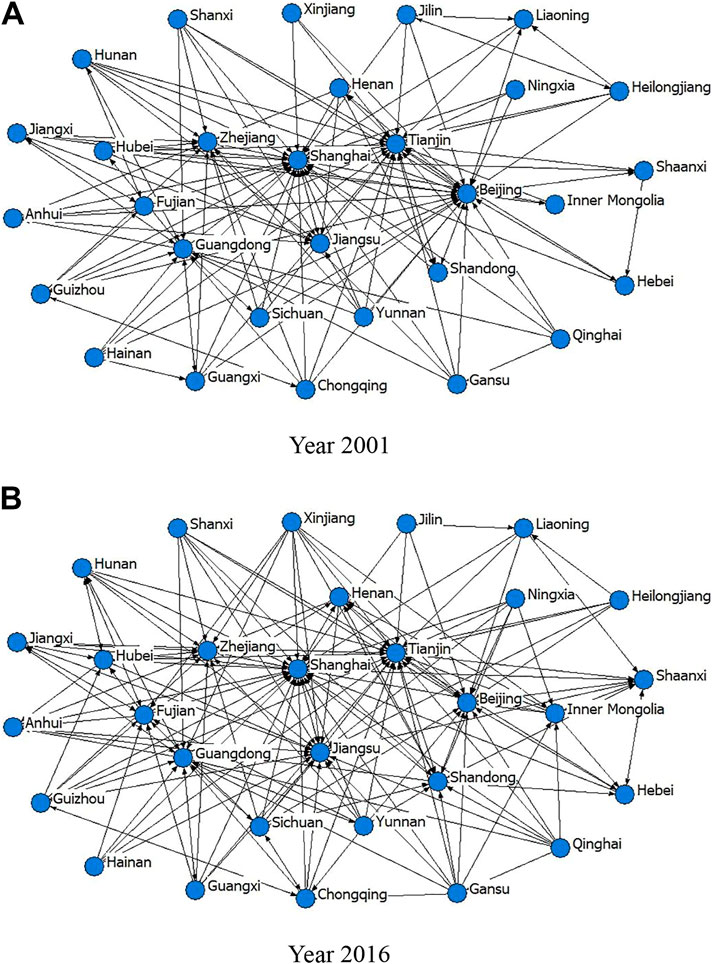
FIGURE 1. Spatial association network of interprovincial renewable energy technology innovation in (A) Year 2001 and (B) Year 2016. Notes: The blue cycles denote “nodes,” representing “provinces,” and black lines with arrows denote the spatial association of interprovincial renewable energy technology innovation.
To better carry out quantitative analysis, the UCINET software is further used to measure the overall network characteristics of China’s renewable energy technology innovation from the aspects of network density, network connectedness, network hierarchy, and network efficiency, etc. See Figures 2, 3.
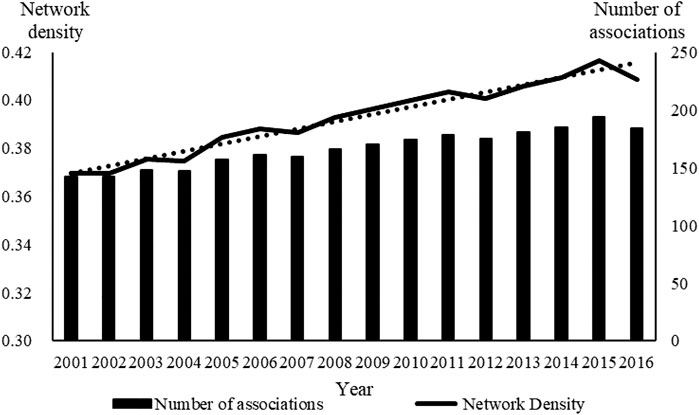
FIGURE 2. Number of associations and network density. Note: A greater network density means a closer spatial association between the regions in a network.
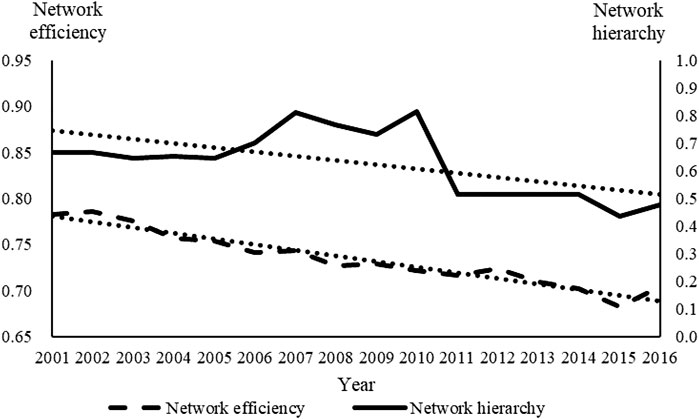
FIGURE 3. Network efficiency and network hierarchy. Note: A lower network efficiency means a more stable network structure, and a lower network hierarchy means a less strict hierarchical structure.
First, the results show that the network connectedness was one from 2001 to 2016, except for 2004 (only 0.9333), indicating the spatial association of China’s interprovincial renewable energy technology innovation was very close. Second, the number of spatial associations was increasing year by year. Specifically, it rose from 142 in 2001 to 184 in 2016. The network density was always rising, while the network efficiency was always declining, indicating that the spatial association of China’s interprovincial renewable energy technology innovation continuously strengthened, and the network stability was rising. Third, the network hierarchy was declining on the whole from 2001 to 2016, indicating that the relatively rigid spatial association system for China’s renewable energy technology innovation has been gradually broken, and the collaborative innovation capability of renewable energy technologies between regions has enhanced.
Based on the above results, it can be found that the spatial association of China’s interprovincial renewable energy technology innovation exhibits a typical network structure. Moreover, the spatial association network became more and more complex, and the spatial association between regions continuously strengthened during the sample period. The reasons are as follows. On the one hand, the Chinese government has enacted a series of policies aimed at promoting the development of renewable energies. For instance, the Chinese government promulgated the Renewable Energy Law of the People’s Republic of China in 2005, which supports the development of renewable energy in legislation and fosters the development of renewable energy in China (Wang et al., 2010; Schuman and Lin, 2012). Additionally, the Chinese government issued the Medium- and Long-Term Development Plan for Renewable Energy in China in 2007, pointing out that the share of renewable energy in total primary energy consumption will increase to 16% by 2020. This creates a favorable environment for the development of renewable energies (Wang et al., 2011; Hua et al., 2016). Overall, the above measures play a positive role in fostering the development of the renewable energy industry, and increase demand for renewable energy technology innovation, therefore strengthening the spatial association of China's renewable energy technology innovation. On the other hand, China’s transportation infrastructure has been continuously improving (Zhang, 2013; Tan et al., 2018), which has played a positive role in expanding the interregional exchange of people and commodities (Cantos et al., 2005; Bronzini and Piselli, 2009), thus promoting the interregional communication of renewable energy knowledge and technologies. Meanwhile, China’s communication technology has also achieved continuous progress, reducing the costs of interregional factor flows and enhancing the accessibility of innovative entities to exchange with long-distance partners (Salazar et al., 2003; Torre and Rallet, 2005), thus strengthening the cooperation of renewable energy technology innovation between regions in China.
Analysis of Node Network Characteristics
The position and role of each province in the spatial association network of China’s renewable energy technology innovation is analyzed by the following steps: 1) calculate the average of the original data from 2001 to 2016; 2) use the average data to measure the degree, closeness, and betweenness of each province; 3) make use of the above measurement results to analyze the centrality of each province. The measurement results are displayed on a map through the ArcGIS software, as shown in Figure 4.
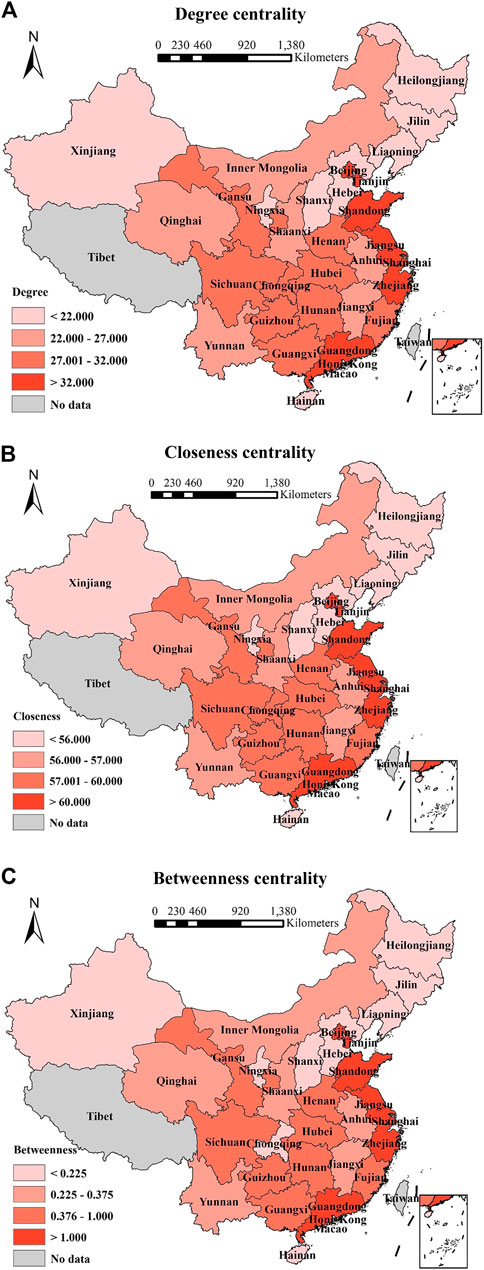
FIGURE 4. Spatial distribution of the centrality: (A) Degree centrality, (B) Closeness centrality and (C) Betweenness centrality. Notes: As the legend at the lower left shows, darker areas indicate a higher centrality and lighter areas indicate a lower centrality.
The measurement results show that the spatial association network of China’s interprovincial renewable energy technology innovation exhibits a significant “core-edge” distribution pattern. To be specific, i) the provinces with the three centrality indicators ranking in the first gradient (i.e., the darkest area in Figure 4) are Shanghai, Beijing, Tianjin, Jiangsu, Zhejiang, and Guangdong. All of them are located in the eastern coastal region. Furthermore, Shanghai has the highest degree, closeness and betweenness. It indicates that some of the eastern coastal developed provinces, led by Shanghai, are at the core of the spatial association network, playing a central role in the network, and having a strong ability to attract the innovative resources and factors needed for the development of renewable energy technologies; ii) the provinces with the three centrality indicators ranking in the fourth gradient (i.e., the lightest area in Figure 4) are Heilongjiang, Jilin, Liaoning, Xinjiang, Ningxia, etc. Most of them are located in the northeastern, central and northwestern regions. They play a marginal role in the network. The main reasons are as follows: first, the eastern coastal regions such as Shanghai have a highly developed economy and a large energy demand. But, subject to energy endowments, they have the poor ability in energy self-sufficiency, without sufficient conventional energy supplies. Therefore, they have a large demand for renewable energies. Statistics show that in 2016 Shanghai’s energy consumption was 117.12 million tons of standard coal, while its fossil energy yield was only 38.2752 million tons of standard coal (National Bureau of Statistics of the People's Republic of China, 2017a). The huge demand for renewable energies inevitably promotes the development of renewable energy technology innovation and strengthens its central position in the spatial association network. The central and western regions, such as Xinjiang and the northeastern region are rich in fossil energy, but compared with energy production, their energy consumption is relatively smaller. For example, in 2016, Xinjiang’s energy consumption was 162.02 million tons of standard coal, but its fossil energy yield was 250.2749 million tons of standard coal (National Bureau of Statistics of the People’s Republic of China, 2017b). The abundance of fossil energy supplies has led to a smaller demand for renewable energies in these regions, making it difficult for them to occupy a central position in the spatial association network; second, the eastern coastal developed regions such as Shanghai are relatively economically developed with complete infrastructure and good innovation conditions to attract R&D personnel and technologies (Liu, 2013; Yang et al., 2018), thus enhancing their central position in the spatial association network. While the central and western regions, such as Xinjiang and the northeastern region are economically backward, with relatively poor infrastructure and innovation environment, as well as relatively backward renewable energy technologies, thus making it difficult for them to occupy a central position in the spatial association network.
Analysis of the Factors Influencing the Spatial Association Network
Following Su and Yu (2019), we apply the QAP regression analysis to further investigate the impacts of various driving factors on the spatial association of renewable energy technology innovation. Before regression analysis, the driving factors that are significantly related to the spatial association matrix of renewable energy technology innovation are selected through the QAP correlation analysis. Then they are used as the explanatory variables for QAP regression analysis. The QAP correlation results are obtained through randomly permuting for 5,000 times. Table 2 reports the QAP correlation results. We can see that the actual correlation coefficient between the spatial association matrix and the geographical proximity matrix is 0.136, and significant at the 1% level. This indicates that the two matrices are significantly positively correlated, that is, geographically adjacent regions tend to have stronger relevance in terms of renewable energy technology innovation activities. The actual correlation coefficients between the per-capita GDP difference matrix, the industrial structure difference matrix, the openness degree difference matrix, the R&D capital stock difference matrix, the higher education scale difference matrix and the spatial association matrix are 0.472, 0.328, 0.462, 0.312 and 0.259 respectively, and all are significant at the 1% level. This implies that the differences in economic development mode, science, technology and education are significantly positively correlated with the spatial association of renewable energy technology innovation. The correlation coefficients between the energy consumption intensity difference matrix, the energy price difference matrix and the spatial association matrix are −0.033 and −0.029, respectively, and not significant. This means that there is no significant correlation between the spatial association of renewable energy technology innovation and the difference in energy consumption. These results indicate that the geographical proximity matrix, the per-capita GDP difference matrix, the industrial structure difference matrix, the openness degree difference matrix, the R&D capital stock difference matrix and the higher education scale difference matrix should be included in the QAP regression analysis framework of this study.
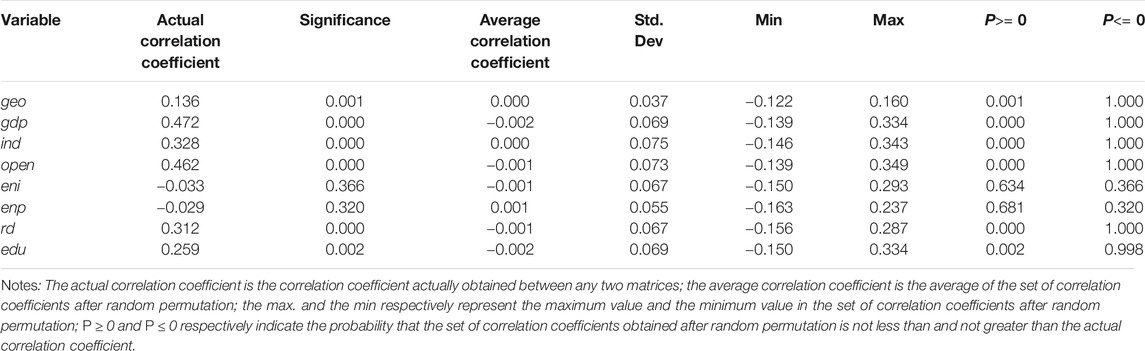
TABLE 2. Results of QAP correlation analysis.
We randomly permute the data for 2000 times using the UCINET software. Table 3 reports the QAP regression results. It should be noted that the normal standard errors cannot be obtained as the estimation results of QAP regression analysis are based on the matrix permutation (Peoples and Sutton, 2015). It can be seen from Table 3 that the coefficient of the geographical proximity matrix (i.e., geo) is significantly positive, indicating that the spatial association of renewable energy technology innovation between adjacent regions is stronger than others. This is because the geographical proximity is conducive to the flow of innovative factors (Hoekman et al., 2009; Shang et al., 2012; Abramo et al., 2020), thus establishing a stronger spatial association in renewable energy technology innovation. The coefficient of the difference in economic development level (i.e., gdp) is significantly positive, indicating that such a difference can promote the spatial association of interregional renewable energy technology innovation. The reasons are that those regions with a large difference in economic development level often have a large difference in factor endowment structure, making it more likely to establish trade contacts (Heckscher, 1919; Samuelson, 1948). Furthermore, the development of interregional trade is conducive to exchanges of innovative resources (Coe and Helpman, 1995; Eaton and Kortum, 1996), ultimately strengthening the spatial association of renewable energy technology innovation. Additionally, the widening of the difference in economic development level also enlarges the difference in the income of R&D personnel, which may attract renewable energy technology talents to migrate from underdeveloped regions to developed regions. Finally, the spatial association of renewable energy technology innovation is enhanced. The coefficient of the difference in R&D input intensity (i.e., rd) is significantly positive at the level of 1%, indicating that such a difference can promote the spatial association of interregional renewable energy technology innovation. This is because the growth of technology and knowledge is from R&D activities (Romer, 1990; Aghion and Howitt, 1992; Grossman and Helpman, 1993; Furman et al., 2002; Hall and Lerner, 2010), while technological advancement and innovation drive economic growth and social welfare improvement (Aghion and Howitt, 1992; Acemoglu and Akcigit, 2012). Therefore, those regions with a large difference in R&D inputs also have great differences in economic development, technical level, and social welfare, resulting in innovation elements such as R&D personnel migrating from the regions with low R&D inputs to the regions with high R&D inputs. As such, the spatial association network of interprovincial renewable energy technology innovation is enhanced.
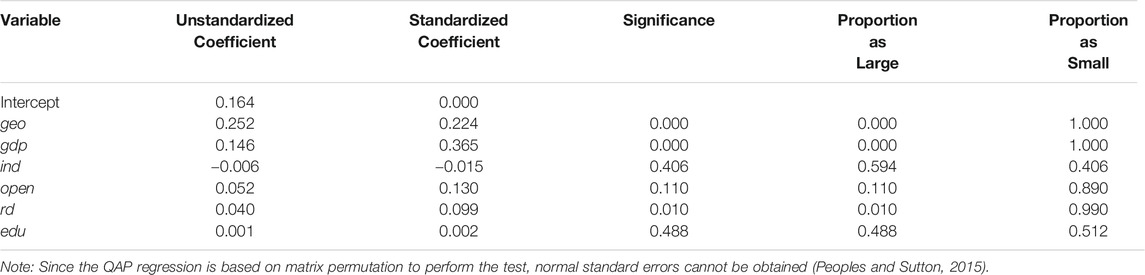
TABLE 3. Results of QAP regression analysis.
Conclusions and Policy Implications
Conclusions
Based on the provincial panel data of 30 provinces and municipalities in China from 2001 to 2016, this study uses the SNA approach to explore the spatial association network characteristics of China's interprovincial renewable energy technology innovation. Furthermore, the driving factors of such a spatial association network are empirically investigated through the QAP regression analysis. The main findings are as follows:
(1) Regarding the overall network characteristics, the spatial association of China’s interprovincial renewable energy technology innovation exhibits a typical network structure. Moreover, this spatial association network became more and more complex, and the interprovincial association strengthened during the sample period. Specifically, from 2001 to 2016, i) the number of associations and the network density of the spatial association network were always rising, while its network efficiency was always declining, indicating that the spatial association continuously strengthened and the network stability was rising; ii) the network hierarchy was declining on the whole, indicating that the relatively rigid spatial association system for China’s renewable energy technology innovation has been gradually broken, and the collaborative innovation capability of renewable energy technologies between regions has enhanced; iii) in most years, the network connectedness was one, indicating that the association in renewable energy technology innovations between regions was very close, and the spatial association network was relatively stable.
(2) Regarding the node network characteristics, the positions and roles of the provinces vary greatly in the spatial association network. The centrality indicators of the developed eastern coastal regions such as Shanghai, Tianjin, Beijing, Jiangsu, Zhejiang, Guangdong, etc. rank in the forefront, and they play a central actor role in the association network; while the centrality indicators of the relatively backward regions such as Heilongjiang, Jilin, Liaoning, Ningxia and Xinjiang rank behind, and they are on the edge of the network.
(3) From the results of QAP analysis, the geographical proximity, the difference in economic development level and the difference in R&D input intensity have a significant role in promoting the spatial association of China's interprovincial renewable energy technology innovation.
Policy Implications
(1) The overall network characteristics show that China’s interprovincial renewable energy technology innovation exhibits an obvious spatial association network structure. Therefore, when formulating relevant renewable energy technology policies, the Chinese government shall focus on integrating renewable energy technology innovation factors and resources in various regions, especially in regions that are insufficiently associated with others. First, for the central government, its governmental R&D budget in renewable energy technologies should be directed to the regions with abundant energy endowments in an appropriate way. Second, the technology transformation of national fossil energy bases (Inner Mongolia, Shaanxi, Shanxi, and Xinjiang) is the key to China’s clean energy transition. The headquarters of several powerful energy firms are located in these provinces, together with abundant talents and physical capital in the field of energy. Although our results indicate that renewable energy innovations of those provinces are increasingly associated with other provinces comparing 2016 to 2001, such kinds of network characteristics are insufficient given the roles of these provinces in China’s energy system. To contribute to the overall goals of China’s energy transition, local governments of these provinces should alleviate the subsidies to their traditional fossil energy sectors, initiate and fund interprovincial joint research programs in renewable energy technologies, and initial “talent-funds” to encourage inflows of excellent researchers in the field of renewable energy technologies.
(2) The node network characteristics show that the spatial association network of China's interprovincial renewable energy technology innovation presents a significant “core-edge” distribution pattern, and the positions and roles of various provinces and municipalities in the spatial association network are quite different. Therefore, different provinces and municipalities shall formulate differentiated renewable energy technology development policies according to their specific positions and roles in the network. To be specific, the developed eastern coastal regions such as Shanghai, Beijing, and Tianjin are at the core of the network and play a central actor. They have strong control over the innovative resources and factors needed for the development of renewable energy technologies. Hence, the provincial governments shall adopt corresponding policies to promote the advancement of technology frontier, focus on improving their capacities for indigenous innovation, and take advantage of the “central actor” in the spatial association network to achieve original breakthroughs in the field of renewable energy technologies. The relatively backward regions such as Heilongjiang, Jilin, and Liaoning are relatively marginalized in the network. These provinces should seek technological progress step by step. That is, they should first enhance their absorptive capacities through exchanging knowledge and researchers with technologically leading provinces, and then build their indigenous innovative capabilities through continuous funding R&D activities of renewable energy technologies.
(3) China’s ambitious goal of a clean energy transition needs efforts from almost every province. Furthermore, technological innovation of renewable energies is the key for this goal. The results of QAP regression show that the geographical proximity, the difference in economic development level and the difference in R&D inputs can promote the spatial association of renewable energy technology innovation. Thus, the uneven distributions of income and R&D resources in China are sort of opportunities for the technologically lagged provinces to chase the frontier. Specifically, for the technological laggards, the first priority of their policy regarding the association network of renewable energy technology innovation is to learn from and cooperate with geographically neighboring provinces ranking high in the given technology field. Taking advantage of the time efficiency and cost effectiveness brought about by the short distance, frequent exchange of R&D personnel and joint research programs with the neighboring and leading provinces will speed up the learning process of the laggards. The second priority should be cooperation with other neighboring provinces or learning from the technologically leading but not adjacent provinces. As such, China can create a regional renewable energy technology innovation community and enhance the level of local renewable energy technology innovation.
Data Availability Statement
The original contributions presented in the study are included in the article/Supplementary Material, further inquiries can be directed to the corresponding authors.
Author Contributions
CF: Conceptualization, Writing - Original Draft, Writing - Review and Editing. YW: Investigation, Writing - Original Draft. RK: Conceptualization, Writing - Review and Editing. LZ: Investigation, Methodology, Data Curation, Software. CB: Conceptualization, Writing - Original Draft, Writing - Review and Editing. ZY: Conceptualization, Writing - Review and Editing.
Funding
This paper is supported by National Natural Science Foundation of China (No. 72003145) and China Postdoctoral Science Foundation (Grant no. 2020M683437).
Conflict of Interest
The authors declare that the research was conducted in the absence of any commercial or financial relationships that could be construed as a potential conflict of interest.
Footnotes
1Data that relates to an individual’s attitudes, opinions, and behaviors, such as the characteristic data of certain individuals collected through surveys (Scott, 2007).
2Data that is about contact, association, group attachment and gathering, involving multiple individuals. Such data is used to describe the interrelationship between one individual and another. It is the property of a communication system between individuals (Scott, 2007).
3See http://www.pss-system.gov.cn/ for details.
References
Abramo, G., D’Angelo, C. A., and Di Costa, F. (2020). The Role of Geographical Proximity in Knowledge Diffusion, Measured by Citations to Scientific Literature. J. Informetrics 14 (1), 101010. doi:10.1016/j.joi.2020.101010
Acemoglu, D., and Akcigit, U. (2012). Intellectual Property Rights Policy, Competition and Innovation. J. Eur. Econ. Assoc. 10, 1–42. doi:10.1111/j.1542-4774.2011.01053.x
Aghion, P., and Howitt, P. (1992). A Model of Growth through Creative Destruction. Econometrica 60, 323–351. doi:10.2307/2951599
Anandarajah, G., and Gambhir, A. (2014). India's CO 2 Emission Pathways to 2050: What Role Can Renewables Play? Appl. Energ. 131, 79–86. doi:10.1016/j.apenergy.2014.06.026
Bai, C., Chen, Y., Yi, X., and Feng, C. (2019). Decoupling and Decomposition Analysis of Transportation Carbon Emissions at the Provincial Level in China: Perspective from the 11th and 12th Five-Year Plan Periods. Environ. Sci. Pollut. Res. 26, 15039–15056. doi:10.1007/s11356-019-04774-2
Bai, C., Feng, C., Du, K., Wang, Y., and Gong, Y. (2020a). Understanding Spatial-Temporal Evolution of Renewable Energy Technology Innovation in China: Evidence from Convergence Analysis. Energy Policy 143, 111570. doi:10.1016/j.enpol.2020.111570
Bai, C., Zhou, L., Xia, M., and Feng, C. (2020b). Analysis of the Spatial Association Network Structure of China's Transportation Carbon Emissions and its Driving Factors. J. Environ. Manage. 253, 109765. doi:10.1016/j.jenvman.2019.109765
Boschma, R. (2005). Proximity and Innovation: A Critical Assessment. Reg. Stud. 39, 61–74. doi:10.1080/0034340052000320887
Bottazzi, L., and Peri, G. (2003). Innovation and Spillovers in Regions: Evidence from European Patent Data. Eur. Econ. Rev. 47, 687–710. doi:10.1016/s0014-2921(02)00307-0
Broekel, T., Balland, P.-A., Burger, M., and van Oort, F. (2014). Modeling Knowledge Networks in Economic Geography: A Discussion of Four Methods. Ann. Reg. Sci. 53, 423–452. doi:10.1007/s00168-014-0616-2
Bronzini, R., and Piselli, P. (2009). Determinants of Long-Run Regional Productivity with Geographical Spillovers: The Role of R&D, Human Capital and Public Infrastructure. Reg. Sci. Urban Econ. 39, 187–199. doi:10.1016/j.regsciurbeco.2008.07.002
Brunnschweiler, C. N. (2010). Finance for Renewable Energy: An Empirical Analysis of Developing and Transition Economies. Envir. Dev. Econ. 15, 241–274. doi:10.1017/s1355770x1000001x
Cabrer-Borrás, B., and Serrano-Domingo, G. (2007). Innovation and R&D Spillover Effects in Spanish Regions: A Spatial Approach. Res. Pol. 36, 1357–1371. doi:10.1016/j.respol.2007.04.012
Cantos, P., Gumbau‐albert, M., and Maudos, J. (2005). Transport Infrastructures, Spillover Effects and Regional Growth: Evidence of the Spanish Case. Transport Rev. 25, 25–50. doi:10.1080/014416410001676852
Chen, W., and Lei, Y. (2018). The Impacts of Renewable Energy and Technological Innovation on Environment-Energy-Growth Nexus: New Evidence from a Panel Quantile Regression. Renew. Energ. 123, 1–14. doi:10.1016/j.renene.2018.02.026
Coe, D. T., and Helpman, E. (1995). International R&D Spillovers. Eur. Econ. Rev. 39 (5), 859–887. doi:10.1016/0014-2921(94)00100-e
Dong, K.-Y., Sun, R.-J., Li, H., and Jiang, H.-D. (2017). A Review of China's Energy Consumption Structure and Outlook Based on a Long-Range Energy Alternatives Modeling Tool. Pet. Sci. 14 (1), 214–227. doi:10.1007/s12182-016-0136-z
Dong, K., Sun, R., and Hochman, G. (2017). Do natural Gas and Renewable Energy Consumption Lead to Less CO2 Emission? Empirical Evidence from a Panel of BRICS Countries. Energy 141, 1466–1478. doi:10.1016/j.energy.2017.11.092
Dong, K., Sun, R., Jiang, H., and Zeng, X. (2018). CO2 Emissions, Economic Growth, and the Environmental Kuznets Curve in China: What Roles Can Nuclear Energy and Renewable Energy Play? J. Clean. Prod. 196, 51–63. doi:10.1016/j.jclepro.2018.05.271
Eaton, J., and Kortum, S. (1996). Trade in Ideas Patenting and Productivity in the OECD. J. Int. Econ. 40 (3-4), 251–278. doi:10.1016/0022-1996(95)01407-1
Furman, J. L., Porter, M. E., and Stern, S. (2002). The Determinants of National Innovative Capacity. Res. Pol. 31 (6), 899–933. doi:10.1016/s0048-7333(01)00152-4
Grafström, J., and Lindman, Å. (2017). Invention, Innovation and Diffusion in the European Wind Power Sector. Technol. Forecast. Soc. Change 114, 179–191. doi:10.1016/j.techfore.2016.08.008
Grossman, G. M., and Helpman, E. (1993). Innovation and Growth in the Global Economy. Cambridge: MIT Press. doi:10.3386/w4527
Hall, B. H., and Lerner, J. (2010). “The Financing of R&D and Innovation,” in Handbook of the Economics of Innovation (North-Holland: North Holland Publishing Company).
Hamed, T. A., and Bressler, L. (2019). Energy Security in Israel and Jordan: The Role of Renewable Energy Sources. Renew. Energ. 135, 378–389. doi:10.1016/j.renene.2018.12.036
He, Z.-X., Xu, S.-C., Li, Q.-B., and Zhao, B. (2018). Factors that Influence Renewable Energy Technological Innovation in China: A Dynamic Panel Approach. Sustainability 10, 124. doi:10.3390/su10010124
Heckscher, E. (1919). The Effect of Foreign Trade on the Distribution of Income. Ekonomisk Tidskrift 21, 497–512. doi:10.2307/3437730
Hoekman, J., Frenken, K., and van Oort, F. (2009). The Geography of Collaborative Knowledge Production in Europe. Ann. Reg. Sci. 43, 721–738. doi:10.1007/s00168-008-0252-9
Hua, Y., Oliphant, M., and Hu, E. J. (2016). Development of Renewable Energy in Australia and China: A Comparison of Policies and Status. Renew. Energ. 85, 1044–1051. doi:10.1016/j.renene.2015.07.060
hUallacháin, B. Ó., and Lee, D.-S. (2014). Urban Centers and Networks of Co-invention in American Biotechnology. Ann. Reg. Sci. 52, 799–823. doi:10.1007/s00168-014-0610-8
Irandoust, M. (2016). The Renewable Energy-Growth Nexus with Carbon Emissions and Technological Innovation: Evidence from the Nordic Countries. Ecol. Indicators 69, 118–125. doi:10.1016/j.ecolind.2016.03.051
Jaforullah, M., and King, A. (2015). Does the Use of Renewable Energy Sources Mitigate CO 2 Emissions? A Reassessment of the US Evidence. Energ. Econ. 49, 711–717. doi:10.1016/j.eneco.2015.04.006
Joëlle, N., and Shestalova, V. (2017). Knowledge Spillovers from Renewable Energy Technologies, Lessons from Patent Citations. Environ. Innovation Societal Transitions 22, 1–14. doi:10.1016/j.eist.2016.07.004
Johnstone, N., Haščič, I., and Popp, D. (2010). Renewable Energy Policies and Technological Innovation: Evidence Based on Patent Counts. Environ. Resource Econ. 45, 133–155. doi:10.1007/s10640-009-9309-1
Keller, W. (2002). Geographic Localization of International Technology Diffusion. Am. Econ. Rev. 92, 120–142. doi:10.1257/000282802760015630
Kim, A. C. H., Newman, J. I., and Kwon, W. (2020). Developing Community Structure on the Sidelines: A Social Network Analysis of Youth Sport League Parents. Soc. Sci. J. 57, 178–194. in press. doi:10.1016/j.soscij.2018.11.011
Kim, D., Kim, N., and Kim, W. (2017). The Effect of Patent Protection on Firms’ Market Value: The Case of the Renewable Energy Sector. Renew. Sustain. Energ. Rev. 82, 4309–4319. doi:10.1016/j.rser.2017.08.001
Kim, J., and Park, K. (2016). Financial Development and Deployment of Renewable Energy Technologies. Energ. Econ. 59, 238–250. doi:10.1016/j.eneco.2016.08.012
Krugman, P. (1991b). Increasing Returns and Economic Geography. J. Polit. Economy 99, 483–499. doi:10.1086/261763
Kuik, O., Branger, F., and Quirion, P. (2019). Competitive Advantage in the Renewable Energy Industry: Evidence from a Gravity Model. Renew. Energ. 131, 472–481. doi:10.1016/j.renene.2018.07.046
Lam, L. T., Branstetter, L., and Azevedo, I. M. L. (2017). China's Wind Industry: Leading in Deployment, Lagging in Innovation. Energy Policy 106, 588–599. doi:10.1016/j.enpol.2017.03.023
Li, D., Wei, Y. D., and Wang, T. (2015). Spatial and Temporal Evolution of Urban Innovation Network in China. Habitat Int. 49, 484–496. doi:10.1016/j.habitatint.2015.05.031
Li, F., and Wang, J. (2011). Financial System and Renewable Energy Development: Analysis Based on Different Types of Renewable Energy Situation. Energ. Proced. 5, 829–833.
Li, K., and Lin, B. (2016). Impact of Energy Technology Patents in China: Evidence from a Panel Cointegration and Error Correction Model. Energy Policy 89, 214–223. doi:10.1016/j.enpol.2015.11.034
Liang, Y., Yu, B., and Wang, L. (2019). Costs and Benefits of Renewable Energy Development in China's Power Industry. Renew. Energ. 131, 700–712. doi:10.1016/j.renene.2018.07.079
Lin, B., and Chen, Y. (2018). Carbon Price in China: A CO2Abatement Cost of Wind Power Perspective. Emerging Markets Finance and Trade 54, 1653–1671. doi:10.1080/1540496x.2017.1386547
Lin, B., and Zhu, J. (2017). Energy and Carbon Intensity in China during the Urbanization and Industrialization Process: A Panel VAR Approach. J. Clean. Prod. 168, 780–790. doi:10.1016/j.jclepro.2017.09.013
Lin, B., and Zhu, J. (2019). The Role of Renewable Energy Technological Innovation on Climate Change: Empirical Evidence from China. Sci. Total Environ. 659, 1505–1512. doi:10.1016/j.scitotenv.2018.12.449
Liu, H. D. (2013). Research on Siphon Effect of the Size of the Domestic Market and Innovation Elements Gathering. Sci. Sci. Manage. S.&T. 34, 104–112. (in Chinese).
Liu, H. J., Liu, C. M., and Sun, Y. N. (2015). Spatial Correlation Network Structure of Energy Consumption and its Effect in China. China Ind. Econ. (5), 83–95. (in Chinese).
Liu, J. (2009). Lectures on Whole Network Approach: A Practical Guide to UCINET. Shanghai: Shanghai People’s Publishing House. (in Chinese).
Long, X., Naminse, E. Y., Du, J., and Zhuang, J. (2015). Nonrenewable Energy, Renewable Energy, Carbon Dioxide Emissions and Economic Growth in China from 1952 to 2012. Renew. Sustain. Energ. Rev. 52, 680–688. doi:10.1016/j.rser.2015.07.176
Long, X., Sun, M., Cheng, F., and Zhang, J. (2017). Convergence Analysis of Eco-Efficiency of China's Cement Manufacturers through Unit Root Test of Panel Data. Energy 134, 709–717. doi:10.1016/j.energy.2017.05.079
Ma, X., Wang, C., Dong, B., Gu, G., Chen, R., Li, Y., et al. (2019). Carbon Emissions from Energy Consumption in China: Its Measurement and Driving Factors. Sci. Total Environ. 648, 1411–1420. doi:10.1016/j.scitotenv.2018.08.183
Maggioni, M. A., and Uberti, T. E. (2009). Knowledge Networks across Europe: Which Distance Matters? Ann. Reg. Sci. 43, 691–720. doi:10.1007/s00168-008-0254-7
Moreno, R., Paci, R., and Usai, S. (2005). Geographical and Sectoral Clusters of Innovation in Europe. Ann. Reg. Sci. 39, 715–739. doi:10.1007/s00168-005-0021-y
Muis, Z. A., Hashim, H., Manan, Z. A., Taha, F. M., and Douglas, P. L. (2010). Optimal Planning of Renewable Energy-Integrated Electricity Generation Schemes with CO2 Reduction Target. Renew. Energ. 35, 2562–2570. doi:10.1016/j.renene.2010.03.032
National Bureau of Statistics of the People’s Republic of China(2002-2017a). China Statistical Yearbook. China Statistics Press, Beijing, China. (in Chinese)
National Bureau of Statistics of the People’s Republic of China(2002-2017b). China Energy Statistical Yearbook. China Statistics Press, Beijing, China. (in Chinese)
National Bureau of Statistics of the People’s Republic of China and Ministry of Science and Technology of the People’s Republic of China,(2002-2017). China Statistical Yearbook on Science and Technology. China Statistics Press, Beijing, China. (in Chinese)
National Energy Administration of the People’s Republic of China, (2014). 2014-2020 Strategic Action Plan for Energy Development. (in Chinese)
Nicolli, F., and Vona, F. (2016). Heterogeneous Policies, Heterogeneous Technologies: The Case of Renewable Energy. Energ. Econ. 56, 190–204. doi:10.1016/j.eneco.2016.03.007
Peoples, C. D., and Sutton, J. E. (2015). Congressional Bribery as State-Corporate Crime: A Social Network Analysis. Crime, L. Soc. Change 64 (2-3), 103–125. doi:10.1007/s10611-015-9584-4
Popp, D., Hascic, I., and Medhi, N. (2011). Technology and the Diffusion of Renewable Energy. Energ. Econ. 33, 648–662. doi:10.1016/j.eneco.2010.08.007
Romer, P. M. (1990). Endogenous Technological Change. J. Polit. Economy 98, 71–102. doi:10.1086/261725
Salazar, A., Hackney, R., and Howells, J. (2003). The Strategic Impact of Internet Technology in Biotechnology and Pharmaceutical Firms: Insights from a Knowledge Management Perspective. Inf. Tech. Manage. 4, 289–301. doi:10.1023/a:1022910614411
Samuelson, P. A. (1948). International Trade and the Equalisation of Factor Prices. Econ. J. 58, 163–184. doi:10.2307/2225933
Schuman, S., and Lin, A. (2012). China's Renewable Energy Law and its Impact on Renewable Power in China: Progress, Challenges and Recommendations for Improving Implementation. Energy Policy 51, 89–109. doi:10.1016/j.enpol.2012.06.066
Shang, Q., Poon, J. P. H., and Yue, Q. (2012). The Role of Regional Knowledge Spillovers on China's Innovation. China Econ. Rev. 23, 1164–1175. doi:10.1016/j.chieco.2012.08.004
Shao, H., Zhou, L., and Liu, Y. (2018). Study on the Spatial Network Structure and Driving Factors of Regional Innovation Development in China. Stud. Sci. Sci. 36, 2055–2069. (in Chinese).
Song, J., Feng, Q., Wang, X., Fu, H., Jiang, W., and Chen, B. (2019). Spatial Association and Effect Evaluation of CO2 Emission in the Chengdu-Chongqing Urban Agglomeration: Quantitative Evidence from Social Network Analysis. Sustainability 11, 1. doi:10.3390/su11226503
Su, Y., and Yu, Y.-q. (2019). Spatial Association Effect of Regional Pollution Control. J. Clean. Prod. 213, 540–552. doi:10.1016/j.jclepro.2018.12.121
Tan, R., Liu, K., and Lin, B. (2018). Transportation Infrastructure Development and China's Energy Intensive Industries - A Road Development Perspective. Energy 149, 587–596. doi:10.1016/j.energy.2018.02.041
Tareq, A. H., and Lindsey, B. (2019). Energy Security in Israel and Jordan: The Role of Renewable Energy Sources. Renew. Energ. 135, 378–389. doi:10.1016/j.renene.2018.12.036
Torre, A., and Rallet, A. (2005). Proximity and Localization. Reg. Stud. 39, 47–59. doi:10.1080/0034340052000320842
Wang, F., Gao, M., Liu, J., and Fan, W. (2018). The Spatial Network Structure of China's Regional Carbon Emissions and its Network Effect. Energies 11, 2706. doi:10.3390/en11102706
Wang, F., Yin, H., and Li, S. (2010). China's Renewable Energy Policy: Commitments and Challenges. Energy Policy 38 (4), 1872–1878. doi:10.1016/j.enpol.2009.11.065
Wang, J., Dong, X., and Dong, K. (2021). How Renewable Energy Reduces CO2 Emissions? Decoupling and Decomposition Analysis for 25 Countries along the Belt and Road. Appl. Econ., 1–17. doi:10.1080/00036846.2021.1904126
Wang, R., Liu, W., Xiao, L., Liu, J., and Kao, W. (2011). Path towards Achieving of China's 2020 Carbon Emission Reduction Target-A Discussion of Low-Carbon Energy Policies at Province Level. Energy Policy 39 (5), 2740–2747. doi:10.1016/j.enpol.2011.02.043
Wang, Z., Zhu, Y., Zhu, Y., and Shi, Y. (2016). Energy Structure Change and Carbon Emission Trends in China. Energy 115, 369–377. doi:10.1016/j.energy.2016.08.066
Wanzenböck, I., Scherngell, T., and Brenner, T. (2014). Embeddedness of Regions in European Knowledge Networks: a Comparative Analysis of Inter-regional R&D Collaborations, Co-patents and Co-publications. Ann. Reg. Sci. 53, 337–368. doi:10.1007/s00168-013-0588-7
Wu, Y. B. (2006). R&D Stock, Knowledge Function and Productive Efficiency. China Econ. Q. (3), 1129–1156. (in Chinese).
Xu, B., and Lin, B. (2018). Assessing the Development of China's New Energy Industry. Energ. Econ. 70, 116–131. doi:10.1016/j.eneco.2018.01.001
Yang, M. H., Zhang, H. X., Sun, Y. N., and Li, Q. Q. (2018). The Study of the Science and Technology Innovation Ability in Eight Comprehensive Economic Areas of China. J. Quantitative Tech. Econ. 35, 3–19. (in Chinese).
Keywords: renewable energy technology innovation, spatial association, driving factor, social network analysis, China
Citation: Feng C, Wang Y, Kang R, Zhou L, Bai C and Yan Z (2021) Characteristics and Driving Factors of Spatial Association Network of China’s Renewable Energy Technology Innovation. Front. Energy Res. 9:686985. doi: 10.3389/fenrg.2021.686985
Received: 28 March 2021; Accepted: 28 April 2021;
Published: 25 May 2021.
Edited by:
Kangyin Dong, University of International Business and Economics, ChinaReviewed by:
Qian Zhou, Zhongnan University of Economics and Law, ChinaMiao Wang, Xiamen University, China
Lei Jiang, Zhejiang University of Finance and Economics, China
Copyright © 2021 Feng, Wang, Kang, Zhou, Bai and Yan. This is an open-access article distributed under the terms of the Creative Commons Attribution License (CC BY). The use, distribution or reproduction in other forums is permitted, provided the original author(s) and the copyright owner(s) are credited and that the original publication in this journal is cited, in accordance with accepted academic practice. No use, distribution or reproduction is permitted which does not comply with these terms.
*Correspondence: Rong Kang, a2FuZ3JvbmdAbnd1LmVkdS5jbg==; Caiquan Bai, YmFpY2FpcXVhbkBzZHUuZWR1LmNu; Zheming Yan, emhlbWluZ3lhbjg4QDE2My5jb20=