 Lingling Mu1
 Yidan Gu
 Ping Liu
- 1School of Economics and Management, Hebei University of Technology, Tianjin, China
- 2School of Civil and Transportation Engineering, Hebei University of Technology, Tianjin, China
Achieving grid parity in 2021 is the goal of China’s photovoltaic development, which is not only on the user side but also on the generation side. Relevant studies indicated that distributed PV has realized grid parity basically in China, while centralized PV, which belongs to the generation side, still has some difficulties in achieving grid parity. Therefore, this paper takes Ningxia Province, which is abundant in solar resources, as the research object and compares LCOE with the traditional coal-fired price to analyze the situation of grid parity of the Pingluo project. It is found that this project cannot reach the goal of grid parity. Then, the future evolution of the local LCOE is analyzed, so as to determine the time of grid parity of Ningxia’s centralized PV power stations. In the calculation of LCOE, the presence and absence of environmental benefits and the general and optimistic forecast of cumulative installed capacity are combined into four scenarios. The results show that the centralized PV in Ningxia cannot achieve grid parity in 2021 under the four scenarios. However, in addition to the scenario that there are no environmental benefits and the cumulative installed capacity is generally forecasted and will reach grid parity of the generation side in 2023, the other three situations can achieve the goal in 2022. Moreover, the LCOE value is the lowest under the scenario of considering environmental benefits and the optimistic forecast of future installed capacity.
Introduction
In order to alleviate the energy crisis caused by the increase in electricity consumption, it is necessary to carry out energy transformation. Especially, the signing of the Paris Agreement in 2016 has made each country around the world to pay more attention to the importance of the renewable energy industry. Clean and abundant solar energy resources have great potential compared with fossil fuels (Lin and Luan, 2020). Every country has taken steps to promote the use of solar photovoltaic (PV). Germany is the most developed and mature country in the PV industry (Karakaya et al., 2015). In 2020, the Renewable Energy Law was enacted to stimulate large-scale growth of PV-installed capacity with fixed feed-in-tariffs (FITs) and subsidies. Then, in order to bring renewable energy into the power market to compete with traditional energy, the fixed subsidy was gradually changed into bidding, until it was finally canceled (Yu et al., 2016). It has been concluded that Germany has achieved grid parity in 2012 (Spertino et al., 2014). In the United States, each state has different incentives for the PV industry, but tax incentives are the most direct measure to guide their development. Moreover, it implemented the SunShot plan to encourage the research of PV technology which reduces the cost of PV power generation. Solar power generation accounted for 43% of U.S. power generation in 20201. By the end of 2019, the cumulative installed capacity of global PV had reached 626 GW, more than a thousand times that of a decade ago.
China has been guided by the conviction that lucid water and lush mountains are invaluable assets. To promote the comprehensive green transformation of economic and social development, the 14th five-year plan for national economic and social development of the People’s Republic of China further emphasizes in promoting clean, low-carbon, safe, and efficient utilization of energy, reducing the intensity of carbon emission (NDRC, 2021). As important clean energy, solar PV has become one of the renewable energy resources that China strongly supports. Since China implemented the FIT policy in 2011 and provided subsidies for PV in 2013, the cumulative installed capacity of PV in China has grown rapidly and surpassed Germany in 2015, becoming an important contribution to the global PV industry, as shown in Figure 1 (NDRC, 2011a; NDRC, 2013; Tu et al., 2020). However, the massive growth of solar PV power plants has increased the financial burden of the Chinese government, resulting in a high subsidy gap (Zhang et al., 2020a). This subsidy gap reached 45.5 billion CNY by 2017 and exceeded 60 billion CNY in 2018 (NEA, 2019b; Zhang et al., 2020a). It not only increases the burden of China but also affects the enthusiasm for investment in the solar PV industry. To accelerate the decline of subsidies and promote the sustainable development of the PV industry, China has continuously lowered the PV FIT and subsidy standards and changed the centralized PV price to the guidance price in 2019, actively promoting the transformation of PV power generation to the era of grid parity. Figure 2 shows the changes in PV electricity prices and subsidies. The electricity price has been falling year by year. Subsidies have also been reduced until they are abolished in the era of grid parity.
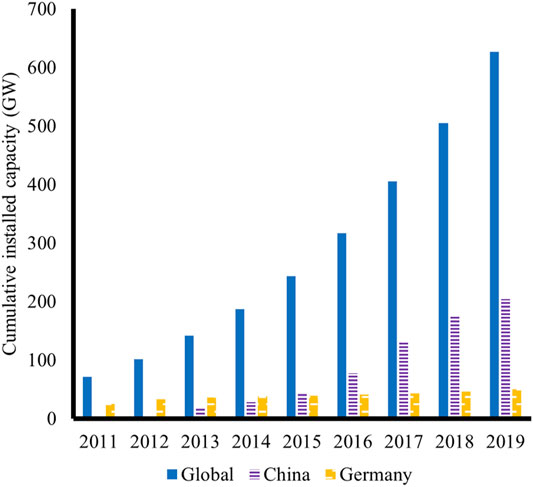
FIGURE 1. Cumulative installed capacity of PV in the world, China and Germany from 2011 to 2019.
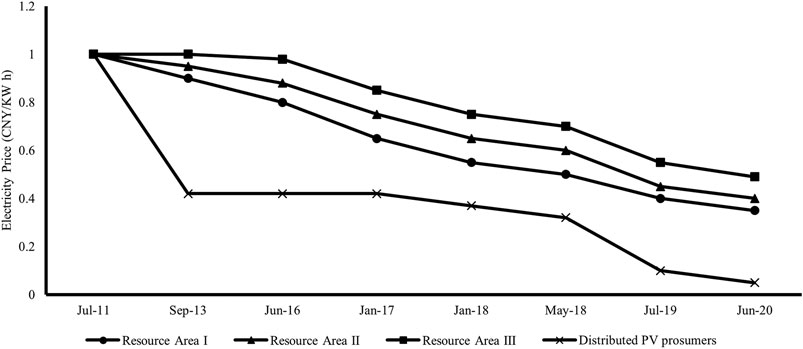
FIGURE 2. FIT and guidance price of centralized PV and full on-grid distributed PV power stations and subsidy standard for distributed PV prosumers.
The grid parity of PV power generation can be divided into two sides: the centralized PV directly sends the generated power through the transmission network, which is the generation side of the grid parity; distributed PV power plants sell the power to users, so it belongs to the user side (Bhandari and Stadler, 2009; Yan et al., 2019; Zhang and Zhang, 2020). The levelized cost of electricity (LCOE) model is a commonly used tool for evaluating the cost-effectiveness of power generation technologies and determining whether emerging technologies are realizing grid parity (Hernandez-Moro and Martinez-Duart, 2013; Zhao et al., 2017; Zhang and Zhang, 2020). It represents the cost per kilowatt hour (kW h) of electricity generated by energy technology. If the LCOE is equal to or lower than the traditional generation price or retail price, it indicates that the emerging technologies are competitive and can achieve grid parity on the generation side or the user side (Castillo-Ramirez et al., 2017). The calculation and application of the LCOE method have been studied in pieces of literature. Allouhi et al. (2019) measured the LCOE of three different types of PV systems in 20 cities in Morocco and found that the lower cost of PV modules and higher solar radiation had a positive effect on reducing LCOE. Castillo-Ramirez et al. (2017) decomposed the operation and maintenance cost of PV specifically and calculated the LCOE of two large PV power plants in Colombia in 2015. Ouyang and Lin (2014) compared the LCOE of wind power, PV power, and biomass power in China. Liu et al. (2020) not only compared the LCOE of wind power and PV power in Guangdong but also studied the economic relationship between them under different load conditions. Some other papers used Monte Carlo simulation to conduct global sensitivity analysis on the LCOE of energy technologies to obtain the LCOE with the maximum probability (Darling et al., 2011; Pillot et al., 2018; Tran and Smith, 2018; Aldersey-Williams and Rubert, 2019). These papers calculated the LCOE of PV projects and other energy technologies under static conditions, and some other papers considered the changes in LCOE of renewable energy in the future and the time to achieve grid parity from a dynamic perspective. The learning curve is a power function, which is widely used to study the future evolution of energy technology power generation, reflecting that the cost of energy technology decreases with the increase in cumulative installed capacity (Yao et al., 2021). The single-factor learning curve was used to describe the relationship between the PV system cost and cumulative installed capacity, so as to obtain the future evolution of LCOE (Hernandez-Moro and Martinez-Duart, 2013; Wang et al., 2014; Vartiainen et al., 2020). Some papers used the two-factor learning curve to consider the dual effects of cumulative installed capacity and technological progress on the realization of PV grid parity (Zhang et al., 2020a). Yao et al. (2021) constructed a four-factor learning curve to measure the main driving factors of different renewable energy technologies.
At present, with the decrease in subsidy intensity in China, new energy is in the postsubsidy period, but the subsidy has not been completely canceled (Zhang et al., 2019). Qualified renewable energy such as wind and PV power can obtain the subsidy qualification by bidding and strive to achieve the goal of grid parity in 2021 (NEA, 2019a). Although the gradual decline of subsidies can reduce the financial pressure of the government, it has affected the passion of building PV to a certain extent. It needs follow-up incentive policies, for example, the tradable green certificate (Tu et al., 2020) and carbon emission trading (Tran and Smith, 2018; Tu et al., 2019), to ensure the sustainable development of PV projects (Jia et al., 2020). Since the provisions of the Kyoto Protocol, the European Union (EU) has established the European Union Emission Trading Scheme (EU-ETS) (Ge et al., 2019), which is the largest and most influential greenhouse gas emission reduction mechanism. In 2011, China also started the pilot work of carbon emission trading (NDRC, 2011b). Key emission units can use emission reduction indicators such as China Certification Emission Reduction (CCER). CCER comes from renewable energy, carbon sequestration, and methane and other emission reduction projects. One unit of CCER can offset one ton of carbon dioxide emissions (MEE, 2020b). The transaction of CCER not only reflects the carbon reduction and green development of renewable energy investments but also increases the profitability of renewable energy projects such as wind and solar PV (Tu et al., 2019).
In the study of the grid parity of PV projects, it is found that distributed PV projects have good economic feasibility by calculating the LCOE and internal rate of return (IRR) (Bhandari and Stadler, 2009; Pillot et al., 2018; Zhang et al., 2020b). The grid parity of distributed PV on the user side in China has been basically realized (Yan et al., 2019; Zhang and Zhang, 2020). The Development Research Center of the State Council also obtained this finding and considered that it is still very difficult for the generation side of centralized PV to reach grid parity (Zhou and Mu, 2020). However, centralized PV projects have always been the main force of China’s PV development, accounting for more than half of China’s PV industry, as shown in Figure 3. Moreover, China PV Industry Association (CPIA) predicted that a new round of development upsurge will appear in centralized PV power plants in 2021 (CPIA, 2020). Therefore, the generation-side grid parity of centralized PV will promote the realization of comprehensive grid parity. It is necessary to study the cost benefit and the time of grid parity of centralized PV power plants. At the same time, the cost offsetting effect of environmental benefits on PV projects cannot be ignored.
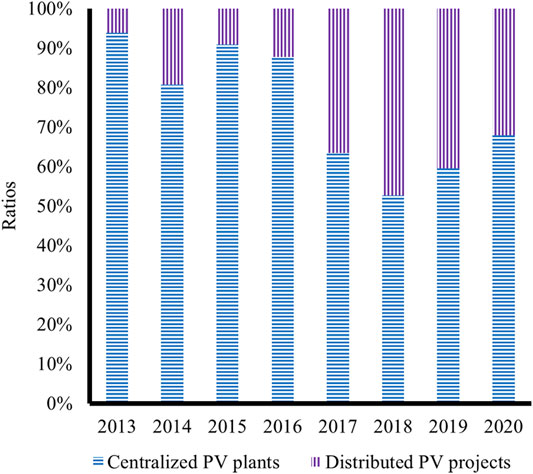
FIGURE 3. Proportion of new installed capacity of centralized PV and distributed PV in China from 2013 to 2020.
This paper takes Ningxia Province as the research object, which is in the leading position of PV power generation in China. The Datang Pingluo Gaoren 55 MW project is selected, the cost factors of this centralized PV power station in the whole life cycle are comprehensively considered, and the LCOE value of the project under the two conditions of whether to obtain the additional environmental benefits brought by carbon emission trading is calculated. The purpose is to analyze whether it can reach grid parity in 2021. Then, the absence and presence of environmental benefits and the general and optimistic forecast of cumulative installed capacity are combined into four scenarios to analyze the future LCOE evolution and the time of grid parity in Ningxia from the dynamic perspective of considering the learning effect. There are two contributions of this paper. One is analyzing the grid parity of centralized PV in Ningxia Province, which is abundant in solar resources. The other is considering the impact of environmental benefits and future cumulative installed capacity and dividing them into four scenarios when estimating the evolution of LCOE.
The structure of this paper is as follows. Methodology introduces the research method LCOE and learning curve. The Development of Centralized PV: The Case of Ningxia Province in China provides the relevant parameters involved in the calculation of LCOE in Ningxia Province. Results and Discussion shows the analysis of the centralized PV grid parity in Ningxia Province under different scenarios. Conclusion and Policy Implications shows the conclusion and policy implications.
Methodology
Levelized Cost of Electricity
LCOE is widely used in the estimation of power generation costs. It is a common tool to evaluate the cost-effectiveness of different energy generation technologies (Ouyang and Lin, 2014) and also a common method to study the grid parity of emerging technologies (Hernandez-Moro and Martinez-Duart, 2013). LCOE is a critical price when the sum of the present value of income is equal to the sum of the present value of costs in the whole life cycle of PV power generation (Tu et al., 2020), which is written as follows:
where n is the year n during the operation of centralized PV power stations, N is the life cycle of centralized PV power stations,
Two scenarios are set to determine when the centralized PV power stations will achieve grid parity in this paper: without environmental benefits and with environmental benefits.
Generally, the basic LCOE of centralized PV projects is calculated without environmental benefits brought by carbon emission trading, as shown in Eq. 3.
where CI is the initial investment cost and
Under the scenario of introducing environmental benefits, the centralized PV power stations can not only obtain the electricity sale income but also obtain the additional benefits brought by carbon emission trading. Environmental benefits can offset the cost of centralized PV in the whole life cycle, as shown in Eq. 4 and Eq. 5.
where
It should be noted that the power generation in the equations seems to be discounted. In fact, it is obtained by rearranging the equations (Hernandez-Moro and Martinez-Duart, 2013).
Learning Curve
The increase in the cumulative installed capacity of energy technology leads to cost reduction, which is influenced by the “learning by doing”. It can be represented by the learning curve, which is shown as Eq. 6.
where
According to Eqs 6–8, the future unit generating cost can be predicted as follows:
where
Therefore, the initial investment cost in the year n is
The Development of Centralized PV: The Case of Ningxia Province in China
Ningxia Province is located in Northwest China with high altitudes. The annual sunshine can reach more than 3,000 h. It is one of the areas with the most abundant sunshine and solar radiation in China. Its unique geographical conditions are conducive to the development of solar energy and wind energy. In 2012, the National Energy Administration (NEA) agreed to establish the first National Comprehensive Demonstration Zone of new energy in Ningxia, which promoted the rapid and orderly development of the new energy industry. At present, Ningxia has eight large-scale wind power and PV industry clusters, which are important bases for promoting clean energy in China. Therefore, the grid parity of Ningxia PV will be a strong driving force for the national grid parity. The following is about the centralized PV system in Ningxia Province.
Cumulative Installed Capacity
The learning effect of unit initial investment of the PV project is affected by the cumulated installed capacity. The cumulative installed capacity of centralized PV projects in Ningxia was 0.49 GW in 2011 and then soared to 8.44 GW in 2019. Based on the forecast of the CPIA, China’s average annual installed capacity of new PV projects during the 14th Five-Year Plan period (2021–2025) is generally expected to be 70 GW, while the optimistic estimate is 90 GW (CPIA, 2020). Therefore, according to the proportion of Ningxia PV in China, it can be estimated that the cumulative installed capacity of centralized PV in Ningxia in 2025 is generally expected to be 120 GW and is expected to be 150 GW under the optimistic forecast. The most suitable description for the change in cumulative installed capacity is the logistic function (“s” curve) (Hernandez-Moro and Martinez-Duart, 2013; Tu et al., 2020). Equations 11, 12 are logistic functions of the cumulative installed capacity of centralized PV in Ningxia Province under general and optimistic forecast, respectively, which are simulated using MATLAB software. n is the forecast year, and 2011 is the base year of the evolution of PV cumulative installed capacity. The fitting degrees are 0.9971 and 0.9977, separately. In Figure 4, the cumulative installed capacity curve of centralized PV in Ningxia is drawn under these two conditions from 2011 to 2030.
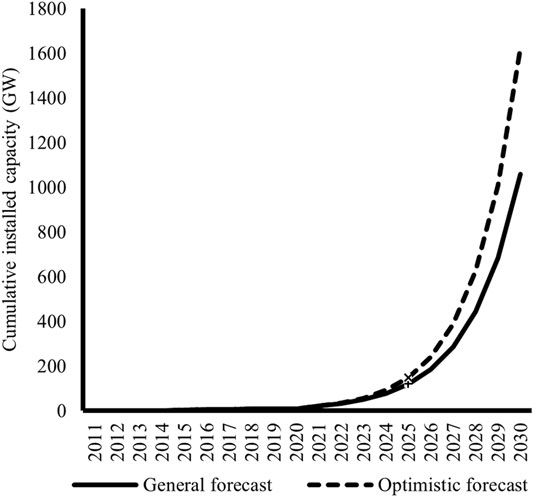
FIGURE 4. Cumulative installed capacity of centralized PV in Ningxia from 2011 to 2030 under two conditions of general forecast and optimistic forecast.
Initial Investment
The costs of centralized PV power stations during the construction period include equipment installation costs, construction engineering costs, basic reverse fund, and other expenses. Equipment installation costs mainly consist of the purchase costs and installation costs of generation equipment, distribution equipment, protection equipment, and auxiliary equipment related to PV power station operation. According to the arrangement of initial investment of ground PV power stations in the China PV Industry Development Roadmap, the costs of PV modules and equipment account for about 82% of the initial investment (CPIA, 2020). Construction costs contain the expenses of infrastructure facilities such as housing and transportation. The investment of environmental protection and conservation of water and soil can also be included. Other expenses include land use costs, production preparation costs, survey and design fees, and related management expenses.
The CPIA calculated the unit average investment costs of China’s centralized PV power plants from 2011 to 2020. It has decreased year by year between the last 10 years, and by 2020, it decreased by about 77%. The cumulative installed capacity of centralized PV in Ningxia increased from 0.49 GW to about 10 GW during this period. In the future, with the growth of cumulative installed capacity, the unit investment costs will continue to decline. The single-factor learning curve model is used to fit the power-law relationship between them to obtain the learning rate and predict the change in unit investment costs from 2021 to 2030. It is found that the fitting degree between the cumulative installed capacity and the unit investment costs is 0.8502, and the slope of the learning curve −b is −0.366, so the learning rate is estimated at 22% correspondingly. According to Eq. 9, unit investment costs can be predicted through the learning rate and future cumulative installed capacity under general forecast and optimistic forecast from 2021 to 2030, which is shown in Figure 5.
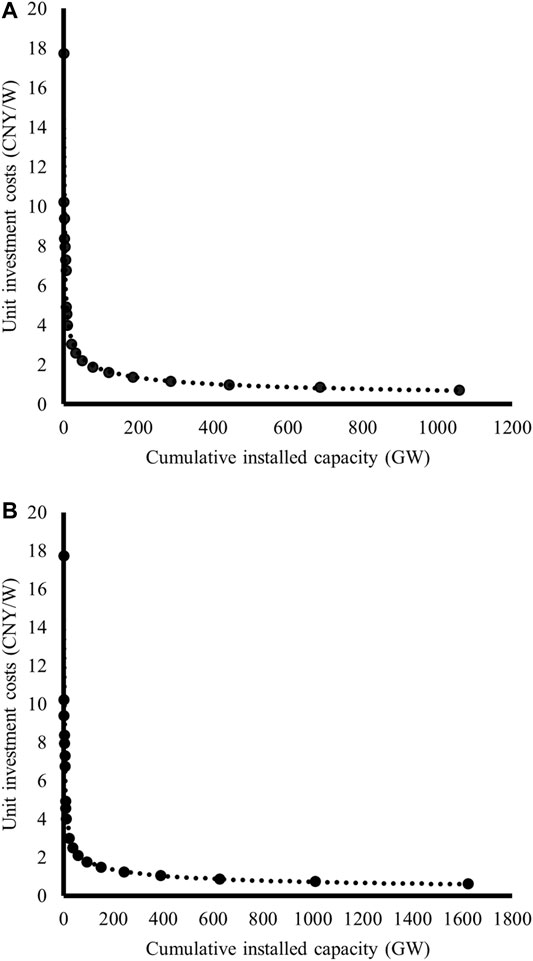
FIGURE 5. Learning curve function of the cumulative installed capacity (GW) and unit investment costs (CNY/W) of centralized PV projects in Ningxia Province from 2011 to 2030 under the general forecast (A) and optimistic forecast (B).
Operation Costs
Operation costs refer to all expenses incurred during the operating phase of centralized PV power stations, including equipment repair costs, panel cleaning costs, all taxes payable, and so on. According to the China PV Industry Development Roadmap in 2020, the annual operation and maintenance cost (O&M) of centralized PV power stations is 0.046 CNY/W, which will remain at this level but slightly decrease in the future (CPIA, 2020). In order to simplify the calculation, it is determined that the unit operation and maintenance cost remain unchanged at 0.046 CNY/W.
This paper also takes into account the possible tax costs during the operation phase of centralized PV projects. According to the Regulations on the Implementation of Enterprise Income Tax, the tax costs include the income tax, urban construction tax, and education surtax, as shown in Eq. 13 (CCTAA, 2010b).
The calculation of the urban construction tax and education surtax is based on the value-added tax (VAT). VAT is the difference between the output tax and input tax. The calculation of the VAT, urban construction tax, and education surtax is shown in Eqs 14–16.
The enterprise income tax is the total income minus costs and expenses. According to the Enterprise Income Tax Law, the calculation of the income tax should deduct all taxes except the VAT (CCTAA, 2010a). The calculation is shown in Eq. 17.
As the environmental protection projects, PV stations can enjoy the preferential income tax, which will be exempted in the first to third years and halved in the fourth to sixth years. The tax rates of related tax costs are shown in Table 1.
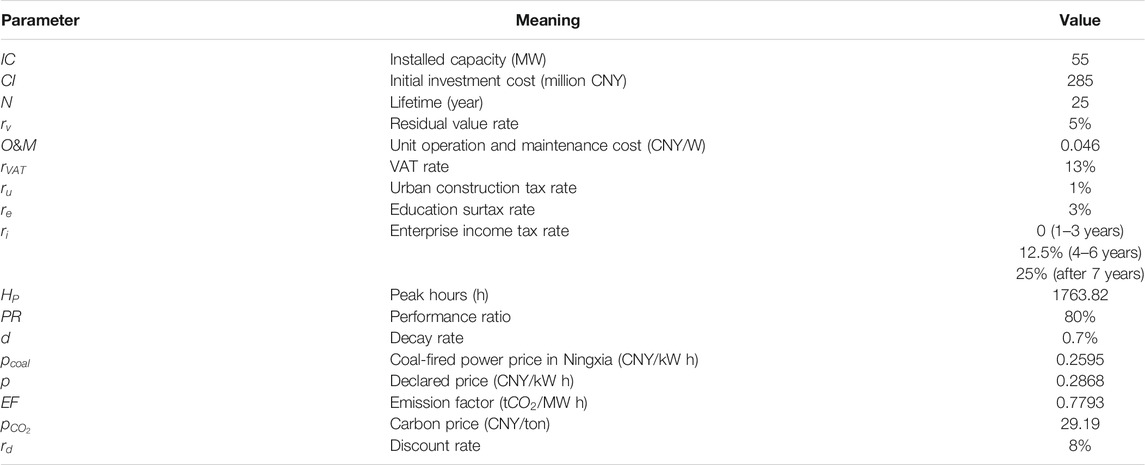
TABLE 1. Relevant parameters of the Pingluo project.
Therefore, the cost of PV projects during the operation period is
Power Generation
The Specification of Performance Evaluation for Photovoltaic Power Station stipulates the calculation of annual power generation of PV power stations (SAC, 2021a):
where
Electricity Price
According to the Notice on Issues Related to Feed-in-tariff Policy of PV Power Generation in 2020, the FIT (electricity price) of newly added centralized PV power stations shall be determined through the market competition. The part lower than the local coal price is settled by the provincial power grid, and the part higher than the local coal price is subsidized by the state. Therefore, the declared electricity price consists of the current coal price and state subsidies (Figure 6). If the declared electricity price of the PV project is equal to or lower than the coal price, the state subsidy cannot be obtained (Figures 6B,C) (NDRC, 2020). Eq. 20 reflects the relationship between the declared electricity price and the coal price.
where p is the declared electricity price of PV projects;
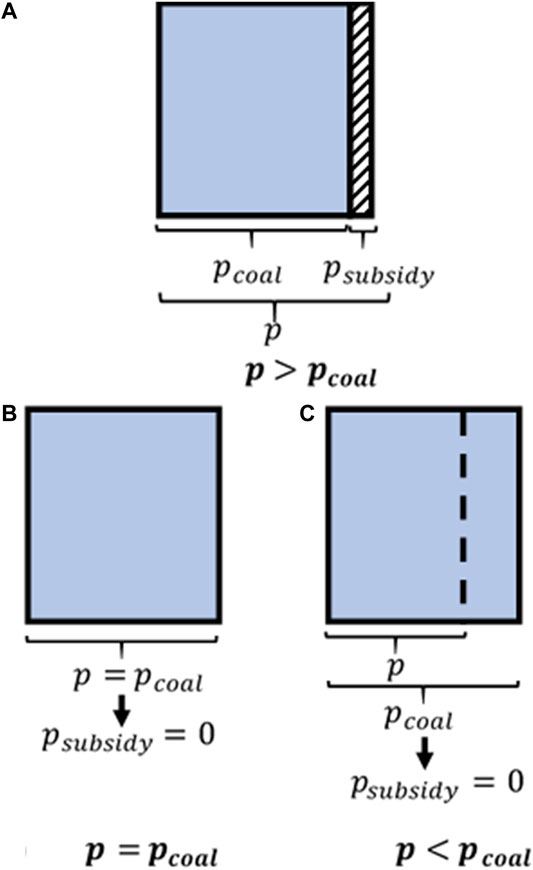
FIGURE 6. Relationship among the declared electricity price of centralized PV projects
In order to adapt to the market orientation, China decides that the coal-fired power price will be determined by the current benchmark price fluctuation from 2020, with the upward floating not exceeding 10% and the downward fluctuation not exceeding 15% (NDRC, 2019). The current benchmark price of coal-fired electricity in Ningxia is 0.2595 CNY/kW h, so the floating range of the coal-fired price is 0.2206 CNY/kW h to 0.2855 CNY/kW h, which is the comparative standard of whether Ningxia-centralized PV can achieve grid parity.
Environmental Benefits
In 2020, the Ministry of Ecological Environment (MEE) proposed that renewable energy projects such as wind power and PV power could trade CCER and receive additional revenue in the National Carbon Emission Trading Management Measures (MEE, 2020b).
The carbon emission reduction (CER) of PV power stations is the product of the power generation (G) and the carbon emission factor (EF) of the area where this project is located (MEE, 2016).
The environmental benefits are
where CER is the carbon emission reduction of PV projects and EF is the carbon emission factor of the area where the PV project is located. Ningxia belongs to the northwest regional power grid, and its baseline EF is 0.7793 t
Discount Rate
The discount rate is an important parameter affecting LCOE, which reflects not only the expected revenue of PV projects (Ren et al., 2018) but also the time value and investment risks (Zhao et al., 2017). China’s social discount rate is 8%. It is the benchmark discount rate for most investment projects in China. The discount rate most commonly used in the new energy industry is 8% (Ouyang and Lin, 2014; Lai and McCulloch, 2017; Abdelhady, 2021). Therefore, the cost and power generation of LCOE is discounted at an 8% discount rate in this paper.
Therefore, the prediction of future LCOE without and with environmental benefit impacts can be written as Eq. 23 and Eq. 24, respectively.
In order to transition to the era of grid parity, China stipulated in 2019 that the PV projects requiring subsidies should determine the price and scale of subsidies in a competitive way and give priority to the projects with strong subsidy regression (NEA, 2019a). In this paper, the Datang Pingluo Gaoren 55 MW PV power station (Pingluo project) in Ningxia is also selected as an example, which was included in the national bidding subsidy list in 2020. This project is located at the junction of Gaoren Township of Pingluo County and Yueyahu Township of the Xingqing District of Ningxia Province (38.39N, 106.39E). It is rich in solar energy resources, with an average annual solar radiation of 6349.75 MJ/m2. The Pingluo project was a new project in 2020 and was planned to be completed by the end of 2020. Figure 7 shows the location of this power station and the average annual sunshine hours in Ningxia Province. Table 1 shows the relevant parameters of the Pingluo PV project.
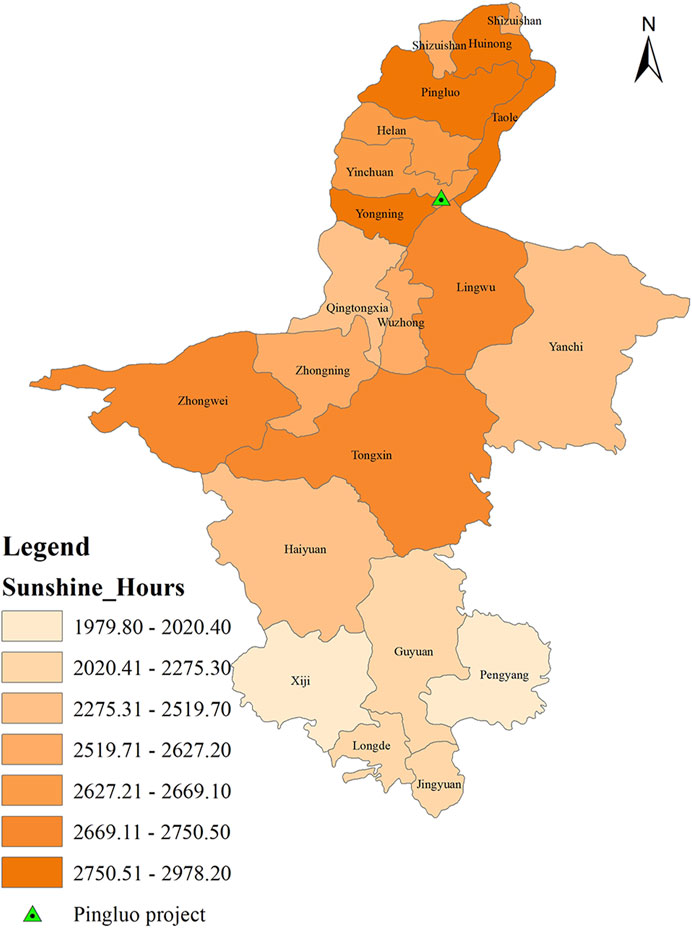
FIGURE 7. Average annual sunshine duration in Ningxia Province.
Results and Discussion
In this section, the LCOE value is calculated to analyze whether the Pingluo project can achieve grid parity in 2021 and the future situation of centralized PV grid parity in Ningxia. The effect of relevant green policies on achieving grid parity is also taken into account.
Grid Parity of the Pingluo Project in Ningxia
In this part, the LCOE value of the Pingluo project in 2021 without and with environmental benefits, respectively, is calculated based on Eq. 23 and Eq. 24 in The Development of Centralized PV: The Case of Ningxia Province in China, and it is analyzed whether this PV project can achieve grid parity in 2021.
The Pingluo project has been included in the national bidding subsidy list, so it can enjoy part of the support of state subsidies. The declared electricity price of the Pingluo project is 0.2868 CNY/kW h, and the coal-fired price in Ningxia is 0.2595 CNY/kW h. Therefore, this PV project can obtain a state subsidy of 0.0273 CNY/kW h. It can be calculated that the LCOE of the Pingluo project in 2021 is 0.4145 CNY/kW h, which is higher than the range of local coal-fired power prices. Therefore, the project cannot achieve grid parity in 2021. If the electricity price of the Pingluo project is determined to be 0.2595 CNY/kW h through market competition, which is the coal price in Ningxia, the price of 0.2595 CNY/kW h is settled by the provincial power grid and the state subsidy is 0 CNY/kW h according to the Notice on Issues Related to Feed-in-tariff Policy of PV Power Generation in 2020. The LCOE is 0.4102 CNY/kW h at this time. This is because the decline of the electricity price of the Pingluo project makes its tax costs and the LCOE decrease. The relationship among them can be seen in Eq. 17 and Figure 8. Compared with the situation with state subsidies in the calculation, the LCOE is slightly lower but still far higher than the local coal price range, so it still cannot achieve grid parity.
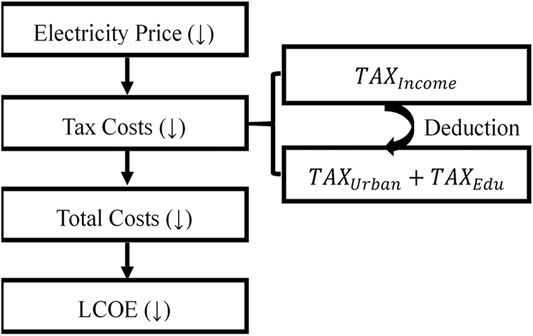
FIGURE 8. Relationship among the electricity price, tax costs, total costs, and LCOE of the Pingluo project.
Taking the nonsubsidy situation as the benchmark, the declared electricity price is continuously reduced based on the coal price until it is reduced to about 0.1661 CNY/kW h. The LCOE is 0.3956 CNY/kW h, which still cannot meet the standard of grid parity. However, the declared electricity price cannot be reduced continuously; otherwise, it will not get enough income. This is because if the electricity price of the Pingluo project drops below 0.1661 CNY/kW h, the tax costs of the project is 0 CNY/kW h according to the calculation of Eqs 13–17. It means that the costs only include initial investment and O&M costs when calculating the LCOE value at this time. Figure 9 shows the LCOE of the Pingluo project after the electricity price drops below the current coal power price. The starting point of the vertical axis is 0.2595 CNY/kW h, which is the current coal price in Ningxia. It can be seen that there is a big gap between the LCOE of the Pingluo project and the local coal-fired power price in 2021.
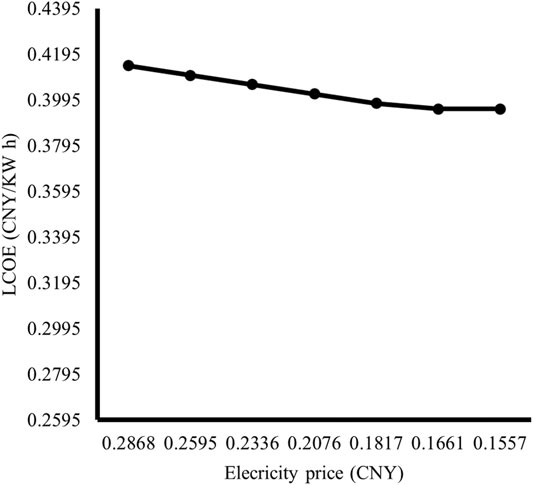
FIGURE 9. LCOE of the Pingluo project when the electricity price is gradually decreasing.
If the Pingluo project does not qualify for a subsidy in 2021 but can obtain additional benefits through the CCER transaction, the environmental benefits can reduce the costs of this centralized PV power plant in the whole life cycle to some extent. When the current coal price is used as the declared electricity price and the carbon trading price is 29.19 CNY/ton, the LCOE value of the Pingluo project is 0.3903 CNY/kW h. Although it still does not reach grid parity, the LCOE value is relatively lower than that without carbon trading.
Under the dual effects of the rising carbon price and reduction of the electricity price, the decline of LCOE is gradually more obvious than that of only electricity price decline. Until the electricity price is reduced to about 0.1661 CNY/kW h, only the rise of the carbon price can promote the decline of LCOE, as shown in Figure 10. However, CCER trading is regarded as nonoperating income and needs to pay the income tax according to the Interim Provisions on Accounting Treatment of Carbon Emission Trading (MOF, 2019). Therefore, with the rise of the carbon price, it will bring more nonoperating income, which will lead to the corresponding increase of the cost in the calculation of LCOE and weaken the cost offsetting effect of environmental benefits.
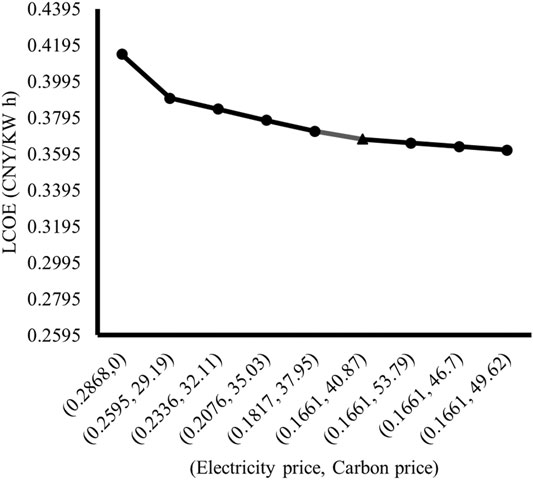
FIGURE 10. LCOE of the Pingluo project under the combined effect of decreasing electricity price and rising carbon price.
For the Pingluo project in Ningxia Province, taking into account all possible costs incurred throughout its life cycle, the LCOE value is higher than the range of local coal power prices regardless of whether environmental benefits are introduced. Therefore, it is difficult to achieve grid parity in 2021.
Grid Parity of Centralized PV Projects in Ningxia Province
Some articles calculated the LCOE and IRR of large-scale PV power stations in China in 2019 and 2020 and found that the centralized PV projects in Ningxia did not have the economy of achieving grid parity (Lou et al., 2019). Moreover, after our calculation, we find that the Pingluo project in Ningxia will not be able to achieve grid parity in 2021 either, so when the whole Ningxia region can reach grid parity needs to be further measured and analyzed.
Without Environmental Benefits
The centralized PV projects in Ningxia Province will not be affected by additional environmental policies in this scenario. According to Eq. 22, the LCOE of centralized PV projects in Ningxia Province from 2020 to 2030 is calculated, as shown in Figure 11. The LCOE value was 0.3063 CNY/kW h in 2020 and has been developing with a decreasing trend.
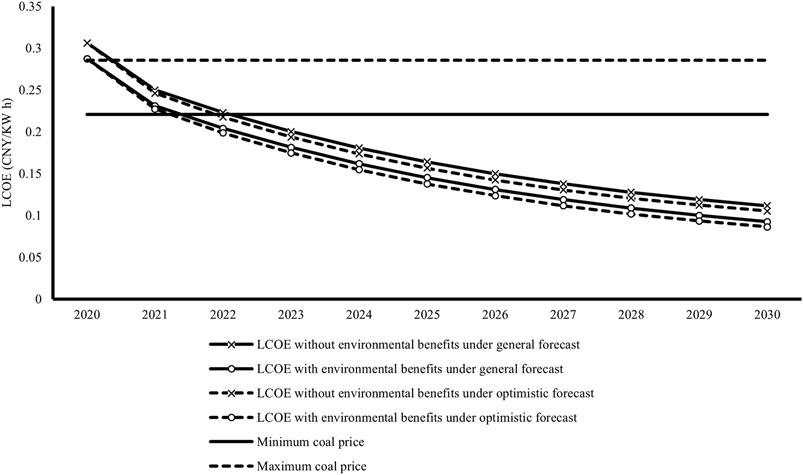
FIGURE 11. LCOE of Ningxia centralized PV in four scenarios from 2020 to 2030.
When the cumulative installed capacity in the future is generally forecasted, the LCOE will drop to 0.2499 CNY/kW h and 0.2231 CNY/kW h in 2021 and 2022, respectively, which is between the upper and lower limits of the Ningxia coal-fired power price (0.2206 CNY/kW h to 0.2855 CNY/kW h). Ningxia can achieve grid parity compared with the ceiling of coal-fired prices. However, if the coal price goes down, it is not easy to achieve grid parity. The LCOE in 2023 is 0.2002 CNY/kW h, which is lower than the minimum limit of the coal-fired price in Ningxia. Therefore, the centralized PV in Ningxia can comprehensively realize the grid parity after 2023.
When the forecast of future cumulative installed capacity is optimistic, the LCOE value is lower than the general forecast. At this time, the LCOE of centralized PV is 0.2461 CNY/kW h in 2021, which is still within the range of the coal price. However, the LCOE in 2022 will be lower than the minimum coal-fired price of 0.2206 CNY/kW h. Therefore, in the optimistic forecast of installed capacity, Ningxia’s centralized PV will have the ability to access the grid parity from 2022.
In general, if environmental benefits are not taken into account in the calculation of LCOE, the centralized PV in Ningxia will achieve grid parity in 2023 when the cumulative installed capacity is generally predicted and 1 year in advance in the optimistic forecast scenario.
With Environmental Benefits
The additional environmental benefits brought by carbon emission trading will be included in the income of power generation projects, which will lead to a reduction of the LCOE of centralized PV to some extent. According to Eq. 23, to calculate the LCOE value considering environmental benefits of Ningxia centralized PV from 2020 to 2030, it is found that the introduction of environmental benefits can indeed reduce LCOE. As shown in Figure 11, the LCOE considering environmental benefits is lower than that without environmental benefits. The LCOE with environmental benefits of Ningxia centralized PV was 0.2873 CNY/kW h in 2020, which is higher than the local coal-fired price and cannot achieve grid parity.
When the future cumulative installed capacity is the general forecast, the LCOE in 2021 is 0.2309 CNY/kW h. Therefore, only when the local coal-fired price is lower than 0.2309 CNY/kW h can the centralized PV in Ningxia realize grid parity in 2021. In 2022, LCOE will drop to 0.2041 CNY/kW h, which is smaller than the local minimum coal-fired power price. Therefore, centralized PV in Ningxia will achieve grid parity from 2022. Although the LCOE under the optimistic forecast scenario of future cumulative installed capacity is relatively lower compared with the general forecast scenario, it cannot achieve the goal of grid parity in 2021. The LCOE in 2022 will be 0.1987 CNY/kW h, which is significantly lower than the range of the local coal price. When the cumulative installed capacity is optimistically predicted, the conditions for generation side grid parity will also be met in 2022, consequently.
Therefore, the introduction of environmental benefits can not only bring additional benefits to the centralized PV projects and reduce the cost of the whole life cycle but also promote the realization of generation side grid parity (Tu et al., 2019).
Conclusion and Policy Implications
This paper analyzes whether the centralized PV power stations in Ningxia Province, the first comprehensive demonstration area of new energy in China, can achieve grid parity under four scenarios. The newly built PV power station, Pingluo project in 2020, is taken as an example, and its LCOE is calculated. In addition, the evolution of LCOE in the whole Ningxia Province is analyzed by considering the learning effect and is compared with the local coal price to determine whether it meets the requirements of grid parity.
This paper finds that the LCOE of the Pingluo project completed at the end of 2020 is much higher than the local coal-fired power price in 2021, so it cannot achieve grid parity on the generation side. Although reducing the electricity price and rising the carbon price with other conditions remain unchanged, it is still difficult to implement grid parity. The main reason is the high initial investment. The unit investment cost of the project is as high as 5.18 CNY/W, which is about twice the average investment cost. Since the Pingluo project in Ningxia Province cannot achieve grid parity in 2021, is it the same for the whole Ningxia region? Based on the prediction of Ningxia’s future cumulative installed capacity and the learning effect, the evolution of LCOE is estimated. The results mainly include three parts. First, it is difficult for centralized PV to achieve grid parity in 2021 in Ningxia under these four scenarios. If the coal electricity price is reduced in the future, it is possible to achieve generation side grid parity. Second, the introduction of environmental benefits significantly reduces the LCOE value, which can achieve the generation side grid parity in 2022. However, under the general forecast of cumulative installed capacity, if the environmental benefits are not considered, the realization of grid parity will be delayed by 1 year in 2023. Third, the LCOE of the optimistic forecast of cumulative installed capacity is lower than the general forecast under the two scenarios of without environmental benefits and with environmental benefits. Moreover, it can achieve grid parity in 2022 in the optimistic forecast.
The results give us two enlightenments or policy implications.
On the one hand, the construction of the national carbon market is improved. First, the coordination between the carbon market and the PV power generation market is strengthened, the carbon quota of PV power generation enterprises is increased, and the energy enterprises with heavy pollution to buy more carbon quotas from the clean energy enterprises are encouraged. Second, in order to simplify the calculation, the carbon price in this paper adopts the average value of the pilots. However, in fact, the carbon price has different degrees of fluctuations, which will affect the profits of PV power generation projects. Therefore, it is very important to improve the price mechanism of CCER (Tu et al., 2019). Third, PV subsidies are gradually canceled and the national carbon trading market is not yet mature. In order to encourage and guarantee the enthusiasm of the PV industry to participate in the carbon market trading, the government needs to strengthen the leadership of the carbon market (Song et al., 2020).
On the other hand, the R&D expenses are increased to promote the progress of PV technology. The evolution of LCOE is also affected by the future target value of cumulative installed capacity (Hernandez-Moro and Martinez-Duart, 2013). The larger the installed capacity is, the lower the LCOE value will be. The large-scale increase in installed capacity promotes PV projects to use more advanced technology and equipment, which brings economies of scale and significantly reduces the investment cost. Therefore, to reduce the investment cost, PV projects should appropriately expand the scale of development, pay attention to technological progress (Zhang et al., 2020a), and give play to the learning effect of learning by doing. The government should also implement the responsibility of supervision of PV power stations so that the quality and safety of PV projects can be guaranteed (Zhang and Zhang, 2020).
Although this paper analyzes the grid parity of centralized PV projects in Ningxia, it still needs to be improved. For example, the investment cost is not only affected by the single factor of cumulative installed capacity but also influenced by other factors such as technology development and material price. The multifactor learning curve model can be built to analyze the effects of more factors on the investment cost. In addition, the role of other environmental policies such as tradeable green certificates can also be considered when calculating LCOE in the future.
Data Availability Statement
The original contributions presented in the study are included in the article, and further inquiries can be directed to the corresponding author.
Author Contributions
All authors have significantly contributed to the manuscript. YaG was responsible for collecting relevant data. YiG carried out the calculation and analysis. LM guided this article. PL optimized the structure of this article.
Funding
This research was funded by the National Natural Science Foundation of China, grant number 71904042.
Conflict of Interest
The authors declare that the research was conducted in the absence of any commercial or financial relationships that could be construed as a potential conflict of interest.
Publisher’s Note
All claims expressed in this article are solely those of the authors and do not necessarily represent those of their affiliated organizations or those of the publisher, the editors, and the reviewers. Any product that may be evaluated in this article, or claim that may be made by its manufacturer, is not guaranteed or endorsed by the publisher.
Acknowledgments
The authors would like to thank Ruiyu Zhang for her writing experience. The authors also acknowledge the valuable comments of Professor Baichen Xie on this article.
Supplementary Material
The Supplementary Material for this article can be found online at: https://www.frontiersin.org/articles/10.3389/fenrg.2021.711864/full#supplementary-material
Footnotes
1https://www.xianjichina.com/special/detail_479192.html
2Carbon K line: http://k.tanjiaoyi.com/
References
Abdelhady, S. (2021). Performance and Cost Evaluation of Solar Dish Power Plant: Sensitivity Analysis of Levelized Cost of Electricity (LCOE) and Net Present Value (NPV). Renew. Energ. 168, 332–342. doi:10.1016/j.renene.2020.12.074
Aldersey-Williams, J., and Rubert, T. (2019). Levelised Cost of Energy - A Theoretical Justification and Critical Assessment. Energy Policy 124, 169–179. doi:10.1016/j.enpol.2018.10.004
Allouhi, A., Saadani, R., Buker, M. S., Kousksou, T., Jamil, A., and Rahmoune, M. (2019). Energetic, Economic and Environmental (3E) Analyses and LCOE Estimation of Three Technologies of PV Grid-Connected Systems under Different Climates. Solar Energy 178, 25–36. doi:10.1016/j.solener.2018.11.060
Bhandari, R., and Stadler, I. (2009). Grid Parity Analysis of Solar Photovoltaic Systems in Germany Using Experience Curves. Solar Energy 83 (9), 1634–1644. doi:10.1016/j.solener.2009.06.001
Brecl, K., and Topič, M. (2016). Apparent Performance Ratio of Photovoltaic Systems-A Methodology for Evaluation of Photovoltaic Systems across a Region. J. Renew. Sust. Energ. 8 (4), 043501. doi:10.1063/1.4955088
Castillo Ramírez, A., Mejía Giraldo, D., and Muñoz Galeano, N. (2017). Large-scale Solar PV LCOE Comprehensive Breakdown Methodology. Ct&f Cienc. Tecnol. Futuro 7 (1), 117–136. doi:10.29047/01225383.69
CCTAA (2010a). Enterprise Income Tax Law of the People's Republic of China. Available: http://www.cctaa.cn/flfg/flfg/2010-12-20/2924.html (Accessed July 1, 2021).
CCTAA (2010b). Regulations for the Implementation of the Enterprise Income Tax Law of the People's Republic of China. Available: http://www.cctaa.cn/flfg/flfg/2010-12-20/2981.html (Accessed July 1, 2021).
CPIA (2020). China PV Industry Development Roadmap. Available: http://www.chinapv.org.cn/road_map/927.html (Accessed December 23, 2020).
Darling, S. B., You, F., Veselka, T., and Velosa, A. (2011). Assumptions and the Levelized Cost of Energy for Photovoltaics. Energy Environ. Sci. 4 (9), 3133–3139. doi:10.1039/c0ee00698j
Ge, S., Yu, X., Zhou, D., and Sang, X. (2019). The Integrated Effect of Carbon Emissions Trading and Pollution Rights Trading for Power Enterprises-A Case Study of Chongqing. Sustainability 11 (11), 3099. doi:10.3390/su11113099
Hernández-Moro, J., and Martínez-Duart, J. M. (2013). Analytical Model for Solar PV and CSP Electricity Costs: Present LCOE Values and Their Future Evolution. Renew. Sust. Energ. Rev. 20, 119–132. doi:10.1016/j.rser.2012.11.082
Jia, X., Du, H., Zou, H., and He, G. (2020). Assessing the Effectiveness of China's Net-Metering Subsidies for Household Distributed Photovoltaic Systems. J. Clean. Prod. 262, 121161. doi:10.1016/j.jclepro.2020.121161
Karakaya, E., Hidalgo, A., and Nuur, C. (2015). Motivators for Adoption of Photovoltaic Systems at Grid Parity: A Case Study from Southern Germany. Renew. Sust. Energ. Rev. 43, 1090–1098. doi:10.1016/j.rser.2014.11.077
Lai, C. S., and McCulloch, M. D. (2017). Levelized Cost of Electricity for Solar Photovoltaic and Electrical Energy Storage. Appl. Energ. 190, 191–203. doi:10.1016/j.apenergy.2016.12.153
Lin, B., and Luan, R. (2020). Do government Subsidies Promote Efficiency in Technological Innovation of China's Photovoltaic Enterprises?. J. Clean. Prod. 254, 120108. doi:10.1016/j.jclepro.2020.120108
Liu, W., Zhang, X., Wu, Y., and Feng, S. (2020). Economic Analysis of Renewable Energy in the Electricity Marketization Framework: A Case Study in Guangdong, China. Front. Energ. Res. 8. doi:10.3389/fenrg.2020.00098
Lou, Q. H., Xie, G. H., and Li, N. N. (2019). Research on New Energy Economic Evaluation and Development Trend of New Energy Power Generation in Grid Parity Period. Electric Power 52 (12), 1–9+104. doi:10.12159/j.issn.2095-6630.2019.36.4610
MEE (2020a). Baseline Emission Factors of China's Regional Power Grid for Emission Reduction Projects in 2019. Available: http://www.mee.gov.cn/ywgz/ydqhbh/wsqtkz/202012/t20201229_815386.shtml (Accessed December 22, 2020).
MEE (2016). How Can Clean Energy Enterprises Participate in Carbon Trading Market?. Available: http://zfs.mee.gov.cn/hjjj/hjjjzcywxz/201606/t20160624_355983.shtml (Accessed December 22, 2020). doi:10.26530/oapen_611256
MEE (2020b). National Carbon Emission Trading Management Measures (For Trial Implementation). Available: http://www.mee.gov.cn/xxgk2018/xxgk/xxgk06/202011/t20201102_805822.html (Accessed December 22, 2020).
MOF (2019). Interim Provisions on Accounting Treatment of Carbon Emission Trading. Available: http://kjs.mof.gov.cn/zhengcefabu/201912/t20191223_3448268.htm (Accessed December 25, 2020).
NDRC (2019). Guiding Opinions on Deepening the Reform of Formation Mechanism of Coal Fired Power Grid Price. Available: http://www.gov.cn/xinwen/2019-10/25/content_5444655.htm (Accessed December 23, 2020).
NDRC (2013). Notice on Exerting Price Leverage to Promote Healthy Development of PV Industry. Available: https://www.ndrc.gov.cn/xxgk/zcfb/tz/201308/t20130830_963934.html (Accessed December 15, 2020).
NDRC (2011a). Notice on Improving the Policy of On-Grid Price for Solar Photovoltaic Power Generation. Available: https://www.ndrc.gov.cn/xxgk/zcfb/tz/201108/t20110801_964803.html (Accessed December 15, 2020).
NDRC (2020). Notice on Issues Related to Feed-In-Tariff Policy of PV Power Generation in 2020. Available: https://www.ndrc.gov.cn/xxgk/zcfb/tz/202004/t20200402_1225031.html (Accessed July 9, 2021).
NDRC (2011b). Notice on the Pilot Work of Carbon Emission Trading. Available: https://zfxxgk.ndrc.gov.cn/web/iteminfo.jsp?id=1349 (Accessed December 15, 2020).
NDRC (2021). The 14th Five-Year Plan for National Economic and Social Development of the People’s Republic of China. Available: https://www.ndrc.gov.cn/fggz/fzzlgh/gjfzgh/202103/t20210323_1270176.html (Accessed April 23, 2021).
NEA (2019a). Notice on Construction of Wind Power and Photovoltaic Power Generation Projects in 2019. Available: http://zfxxgk.nea.gov.cn/auto87/201905/t20190530_3667.htm (Accessed December 15, 2020).
NEA (2019b). The Photovoltaic Industry May Face Major Mechanism Innovation, and the Problem of Subsidy Gap Has Been Solved. Available: http://www.nea.gov.cn/2019-02/22/c_137842797.htm (Accessed December 15, 2020).
Ouyang, X., and Lin, B. (2014). Levelized Cost of Electricity (LCOE) of Renewable Energies and Required Subsidies in China. Energy Policy 70, 64–73. doi:10.1016/j.enpol.2014.03.030
Pillot, B., de Siqueira, S., and Dias, J. B. (2018). Grid Parity Analysis of Distributed PV Generation Using Monte Carlo Approach: The Brazilian Case. Renew. Energ. 127, 974–988. doi:10.1016/j.renene.2018.05.032
Ren, L. Z., Zhao, X. G., Yu, X. X., and Zhang, Y. Z. (2018). Cost-benefit Evolution for Concentrated Solar Power in China. J. Clean. Prod. 190, 471–482. doi:10.1016/j.jclepro.2018.04.059
SAC (2021a). Specification of Performance Evaluation for Photovoltaic Power Station. Available: http://openstd.samr.gov.cn/bzgk/gb/newGbInfo?hcno=A9D2FF863C22D770260742D71F98F43A (Accessed June 15, 2021).
SAC (2021b). Specification of Photovoltaic Power Generation Efficiency. Available: http://openstd.samr.gov.cn/bzgk/gb/newGbInfo?hcno=766561393E08C9DA8C1B722918456395 (Accessed June 15, 2021).
Song, Y., Liu, T., Ye, B., and Li, Y. (2020). Linking Carbon Market and Electricity Market for Promoting the Grid Parity of Photovoltaic Electricity in China. Energy 211, 118924. doi:10.1016/j.energy.2020.118924
Spertino, F., Leo, P. D., and Cocina, V. (2014). Which Are the Constraints to the Photovoltaic Grid-Parity in the Main European Markets?. Solar Energy 105, 390–400. doi:10.1016/j.solener.2014.03.021
Tran, T. T. D., and Smith, A. D. (2018). Incorporating Performance-Based Global Sensitivity and Uncertainty Analysis into LCOE Calculations for Emerging Renewable Energy Technologies. Appl. Energ. 216, 157–171. doi:10.1016/j.apenergy.2018.02.024
Tu, Q., Betz, R., Mo, J., and Fan, Y. (2019). The Profitability of Onshore Wind and Solar PV Power Projects in China - A Comparative Study. Energy Policy 132, 404–417. doi:10.1016/j.enpol.2019.05.041
Tu, Q., Mo, J., Betz, R., Cui, L., Fan, Y., and Liu, Y. (2020). Achieving Grid Parity of Solar PV Power in China- the Role of Tradable Green Certificate. Energy Policy 144, 111681. doi:10.1016/j.enpol.2020.111681
Vartiainen, E., Masson, G., Breyer, C., Moser, D., and Román Medina, E. (2020). Impact of Weighted Average Cost of Capital, Capital Expenditure, and Other Parameters on Future Utility‐scale PV Levelised Cost of Electricity. Prog. Photovolt Res. Appl. 28 (6), 439–453. doi:10.1002/pip.3189
Wang, Y., Zhou, S., and Huo, H. (2014). Cost and CO 2 Reductions of Solar Photovoltaic Power Generation in China: Perspectives for 2020. Renew. Sust. Energ. Rev. 39, 370–380. doi:10.1016/j.rser.2014.07.027
Xu, X., Guan, C., and Jin, J. (2018). Valuing the Carbon Assets of Distributed Photovoltaic Generation in China. Energy Policy 121, 374–382. doi:10.1016/j.enpol.2018.06.046
Yan, J., Yang, Y., Elia Campana, P., and He, J. (2019). City-level Analysis of Subsidy-free Solar Photovoltaic Electricity price, Profits and Grid Parity in China. Nat. Energ. 4 (8), 709–717. doi:10.1038/s41560-019-0441-z
Yao, Y., Xu, J.-H., and Sun, D.-Q. (2021). Untangling Global Levelised Cost of Electricity Based on Multi-Factor Learning Curve for Renewable Energy: Wind, Solar, Geothermal, Hydropower and Bioenergy. J. Clean. Prod. 285, 124827. doi:10.1016/j.jclepro.2020.124827
Yu, H. J. J., Popiolek, N., and Geoffron, P. (2016). Solar Photovoltaic Energy Policy and Globalization: a Multiperspective Approach with Case Studies of Germany, Japan, and China. Prog. Photovolt: Res. Appl. 24 (4), 458–476. doi:10.1002/pip.2560
Zhang, M. M., Zhang, C., Liu, L. Y., and Zhou, D. Q. (2020a). Is it Time to Launch Grid Parity in the Chinese Solar Photovoltaic Industry? Evidence from 335 Cities. Energy Policy 147, 111733. doi:10.1016/j.enpol.2020.111733
Zhang, M., and Zhang, Q. (2020). Grid Parity Analysis of Distributed Photovoltaic Power Generation in China. Energy 206, 118165. doi:10.1016/j.energy.2020.118165
Zhang, X., Feng, S., Zhang, H., and Yuan, J. (2020b). Developing Distributed PV in Beijing: Deployment Potential and Economics. Front. Energ. Res. 7, 11. doi:10.3389/fenrg.2019.00155
Zhang, Y. Z., Liu, J., Zhang, J. F., and Wang, C. X. (2019). Study on the Development of Renewable Energy during "Post-Subsidy Period" in China. Electric Power 52 (04), 1–7.
Zhao, Z.-Y., Chen, Y.-L., and Thomson, J. D. (2017). Levelized Cost of Energy Modeling for Concentrated Solar Power Projects: A China Study. Energy 120, 117–127. doi:10.1016/j.energy.2016.12.122
Keywords: grid parity, centralized PV, LCOE, environmental benefits, Ningxia
Citation: Mu L, Gu Y, Guo Y and Liu P (2021) The LCOE Evolution and Grid Parity Analysis of Centralized Solar Photovoltaic: A Case Study of Ningxia, China. Front. Energy Res. 9:711864. doi: 10.3389/fenrg.2021.711864
Received: 19 May 2021; Accepted: 02 August 2021;
Published: 24 September 2021.
Edited by:
Bai-Chen Xie, Tianjin University, ChinaCopyright © 2021 Mu, Gu, Guo and Liu. This is an open-access article distributed under the terms of the Creative Commons Attribution License (CC BY). The use, distribution or reproduction in other forums is permitted, provided the original author(s) and the copyright owner(s) are credited and that the original publication in this journal is cited, in accordance with accepted academic practice. No use, distribution or reproduction is permitted which does not comply with these terms.
*Correspondence: Ping Liu, MjAwMmxwQGhlYnV0LmVkdS5jbg==