 Weiling Guan1,2
 Tao Yu
- 1School of Electric Power Engineering South China University of Technology, Guangzhou, China
- 2Guangdong Provincial Key Laboratory of Intelligent Measurement and Advanced Metering of Power Grid, Guangzhou, China
With the dramatic increase of energy demand and the continuous increase of power system operation pressure, higher requirements are put forward for the development of power grid planning and optimization operation. It is important for the refinement of distribution network planning to deeply extract the characteristics of user load. First, the process of load characteristic analysis method from the user level to the industry level is proposed, which achieves the division of electricity consumption patterns of various industries, thus building a panoramic portrait of industry electricity consumption behavior. Then, by expanding the information filled in by traditional customers, the feature vector of each user is extracted, and the users' industry electricity consumption patterns are used as the label. Therefore, a method for identifying the electricity consumption pattern of the customer based on the BB-stacking model fusion framework is proposed, which yields the preliminary forecast results of customer load based on the actual load accounting results of the customers. Finally, comparative simulations with different methods verify the effectiveness of the proposed algorithm, which can provide prominent guidance for the actual distribution network planning work.
Introduction
Development of Customer Portrait
More recently, with the gradual transformation of enterprises from product oriented to user oriented in the production, it is significant for formulating marketing strategies and product design to fully understand customers and their needs (Wu et al., 2020). At present, in-depth mining of user data and research on accurate user portrait are gradually deepening. Accurate user portrait technology has been widely used in the Internet, finance, retail, operators, advertising, and other industries (Liu and Du, 2020; Zhang et al., 2020). In terms of advertising, Google uses big data to locate high-value users, which helps mobile e-commerce app to locate high-value users and push advertisements and adopts flexible data tracking methods for users of different tag categories, so that brands can achieve accurate advertising push for target users (Shan, 2018). In terms of auxiliary business decision-making, eBay carries out business circle customer group analysis, product marketability analysis, store operation analysis, personalized consumption analysis, and customer loss analysis by integrating online and offline massive data, providing decision support for commercial real estate and comprehensive big data analysis and prediction for project parties and brands (Chen et al., 2021). Obviously, user portrait technology has become an effective method to improve customer service quality and customer experience, which is an important basis for integrating high-quality resources and realizing enterprise and user value (Pitner et al., 2012; Yu et al., 2017).
In the field of electric power research, it has become a rising research direction to build user portraits in different application scenarios according to the actual needs (Qiu et al., 2017). In the early stage of the study, traditional user portraits were mainly used in the marketing portal to build user electricity sensitivity or credit portraits to guide the electricity recovery work (Sanchez et al., 2008; Han et al., 2014; Ampimah et al., 2017). To meet the requirements of demand response, the methods of establishing electricity consumption behavior tag library and realizing the portrait of different types of users' electricity consumption behavior patterns were proposed in (Qiu et al., 2017) and (Zhong et al., 2018). With the gradual popularization of new energy (Yang et al., 2016; Yang et al., 2017; Yang et al., 2018; Yang et al., 2019a; Yang et al., 2019b; Yang et al., 2020), the load change and influence mechanism on the user side are becoming more and more complex. Therefore, the user portrait method is becoming more and more important.
The above pieces of literature are all portraits of the users who have been connected to the power grid, so as to formulate appropriate strategies to guide the corresponding users to change their electricity consumption behavior. However, there is rare research on the reported customers who are not connected to the power grid. In the distribution network planning work, reference (Lian et al., 2014) makes use of the complementarity between user loads to optimize the access decision reasonably, which can effectively improve the load distribution and utilization rate of power supply equipment. Moreover, the multidimensional analysis of user load can also provide effective guidance for the optimal scheduling and control of smart grid (Yang et al., 2015; Zhang et al., 2015; Xi et al., 2016; Zhang et al., 2016; Zhang et al., 2021). However, due to the lack of research on the load of customers who are not connected, it is limited to transfer the user load of the existing distribution network. For the more common scenario of business expansion, the data information support and optimization ability are insufficient.
Research and Contribution of the Paper
In view of the above research results, the contributions of this paper can be summarized as follows:
1) Unlike the traditional single user portrait, this paper digs the power consumption behavior law of massive users, which constructs a more popularized and applied power consumption behavior portrait for industry.
2) A load forecasting method is presented, which is different from the general sense of load forecasting. Aiming at the new customers who are not connected with electricity, this paper extracts the time sequence characteristics of customer load through limited data information, which provides an effective reference for the actual distribution network planning.
3) The software integrating the above functions is developed and has been applied in engineering, which provides an effective tool for the decision-making of distribution network planners.
Portrait of Industry Electricity Consumption Behavior
In this paper, a load characteristic analysis method from user level to industry level is proposed. First, the massive users of various industries in the region are systematically analyzed and integrated. Therefore, a comprehensive and practical industry electricity consumption behavior portrait in the region is profiled. The key steps are shown in Figure 1.
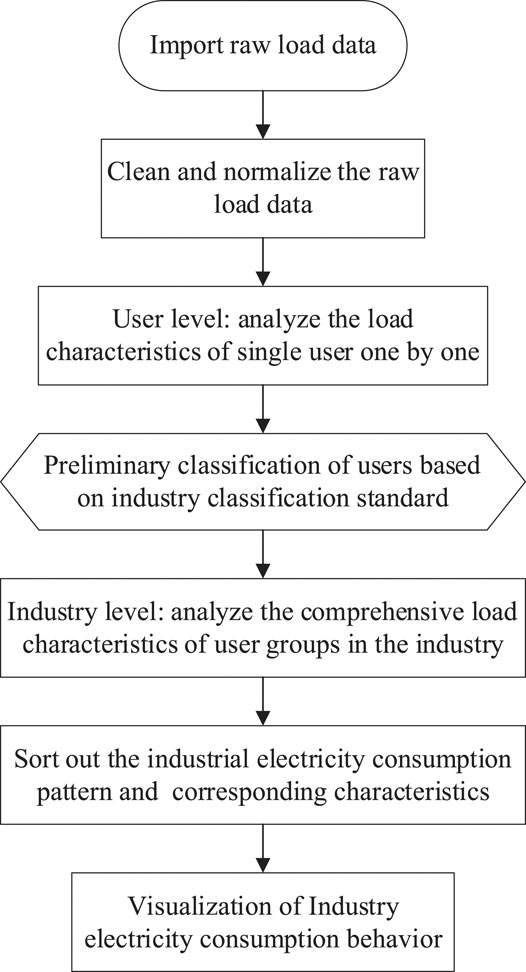
FIGURE 1. Construction process of industry electricity consumption behavior portrait.
Load Data Preprocessing
For continuous load data, Lagrange interpolation (Criscuolo et al., 1984) is used to fill the vacancy and bad data, which can play a good repair effect. For the data points that need to be filled,
where
To avoid the influence of the actual load value in the follow-up analysis process, the linear proportion normalization method is used to normalize the load data after repair, which can be expressed as
where
Load Analysis of User Level
User Load Curve Analysis
The user load curve has strong randomness, so it is difficult to ensure that the load curve of the day is typical for the user. In this paper, the time series mining method in (Lin et al., 2017) is used to extract the typical daily load curve of the user in a period of time
1) Dimensionality reduction of load data: let
where
2) Symbolic representation: the SAX method (Notaristefano et al., 2013) is used to assign symbolic values to each segment of the daily load time series after dimension reduction according to the average value of each segment and then select the optimal value
3) Frequency of statistical symbol sequence: after the symbolic representation of daily load data is completed, the frequency of various symbol sequences is counted. Then, the most common load curve forms are screened out and the abnormal load is eliminated. Suppose the most symbol sequence appears is
4) Extract typical daily load curve: stack the daily load curve corresponding to the symbol sequence with the highest frequency, and calculate the mean value to obtain the final typical load curve
where
User Load Characteristics Analysis
The user load curve can directly describe the change trend of user load in a day, and the load characteristics can more comprehensively characterize the user's electricity behavior from multiple perspectives. In this paper, user load characteristics are selected and calculated from three aspects, i.e., user load level, typical peak-valley characteristics, and load development law. The names and expression of each index are shown in Table 1.
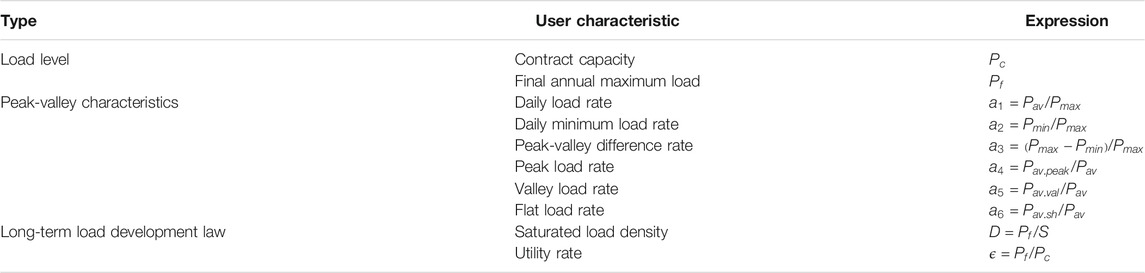
TABLE 1. Selected user load characteristics.
In Table 1, the load level indicators represent the volume of user power consumption, which is the key information in the distribution network planning. Indicators of typical peak-valley characteristics can reflect the changing trend of user load in a day with less information granularity. The index of long-term load development reflects the rule that a user's load gradually increases to saturation after access to electricity and the relationship between saturated load and its area occupied. It is an important basis for reasonable estimation of the user's load.
Preliminary Classification of Users Based on Industry Classification Standards
To serve distribution network planning, the results of single user load characteristic analysis lack universality. Thus, it is necessary to explore the general law of massive users’ load changes.
Generally, the users are classified into various industries according to the National Economic Industry Classification national standard, forming a user group in each industry, which has similarity in the long-term development law of load. In this way, the summary of the law and subsequent application is facilitated. After the preliminary classification of users is completed, due to the different characteristics of user peaks and valleys, it is necessary to further carry out industry power mode analysis and feature extraction.
Load Analysis of Industry Level
Analysis of Industry Electricity Consumption Pattern
In the same industry, each user's electricity consumption behavior is still different. The gray wolf optimized fuzzy mean clustering algorithm (GWO-FCM) with high clustering accuracy and fast computing speed in (Gao et al., 2019) is used to further subdivide the user groups in the industry. The specific process is as follows:
1) Setting parameters: set the minimum number of clusters as
2) Implement clustering algorithm: suppose that there are
3) Evaluate the clustering effect: use silhouette coefficient (SC) to evaluate the compactness and separability of clusters.
where
The mean value of the SC of all samples is calculated to evaluate the effectiveness of the clustering, which can be computed by
4) Traverse the optional range of cluster number: if the current cluster number
5) The number of clusters with the maximum mean value of the contour coefficient is selected as the optimal number of clusters
Characteristic Extraction of Industry Electricity Consumption
After completing the division of industry electricity consumption pattern, it is necessary to extract the corresponding characteristics of each electricity consumption pattern in the industry. Considering the nature of the characteristics, it is not significant to summarize and extract the load level and typical peak-valley characteristics at the industry level. Considering the actual needs of the power grid, it is of great significance to extract the long-term load development law of various electricity consumption patterns in the industry.
Nonparametric kernel density estimation (Lambert et al., 1999) is a data sample-driven method, which can fit the probability distribution of features without prior knowledge. In this paper, a nonparametric kernel density estimation method is used to fit the probability density of long-term load development characteristics, and then typical characteristics are extracted.
Taking the saturated load density as an example, suppose that there are
where
To ensure the continuity of the probability density function, the kernel function needs to be a smooth probability density function. Generally, Gaussian kernel function is often selected, which can be expressed as follows:
The point with the largest value of the probability density fitting function
where
Construction of Industry Electricity Consumption Behavior Portrait
After the load analysis from the user level to the industry level, the load curves and related characteristics of the power users and industry modes are obtained, respectively, at the user level and the industry level, which is the description of the electricity consumption behavior of the industry from different angles and at different levels.
To enable the distribution network planners to grasp the electricity consumption of various industries intuitively, massive analysis results are sorted and visualized. Then, a panoramic portrait of industry electricity consumption behavior in a region is built. The form and content of the portrait are shown in Figure 2.
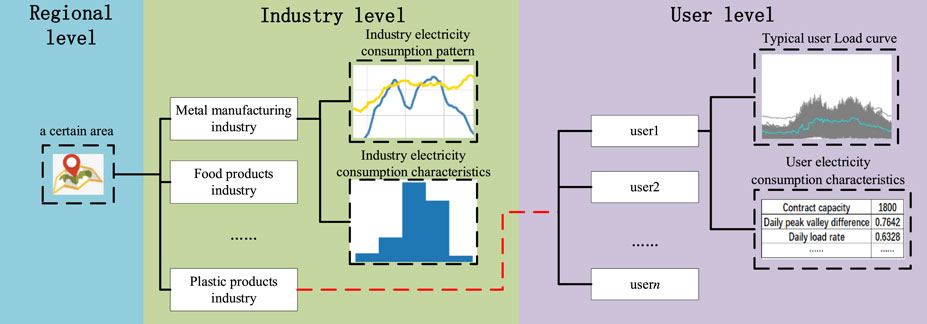
FIGURE 2. Description process of industry electricity consumption behavior.
Pattern Classification of New Customers' Electricity Consumption
In the traditional business expansion and installation, for the customers who have not been connected to the power grid, the planners are supposed to calculate the customer's load based on the customer's reported capacity and business experience, working out the business expansion and access scheme. The processing flow is extensive and lacks consideration for user load time sequence characteristics.
After the construction of a panoramic portrait of industry electricity consumption behavior in the region, if we can reasonably infer the electricity consumption pattern according to the relevant power consumption information provided by customers, it can provide more effective technical support for business decision-making of planners.
The basic flow of the electricity consumption pattern classification in this paper is shown in Figure 3. The training model obtains the electricity pattern classification ability by using the users’ characteristics as the training samples. After training the model, the corresponding characteristic vectors are extracted from the electricity consumption information of the customers and input into the classification model to obtain the electricity consumption pattern classification results of the customers.
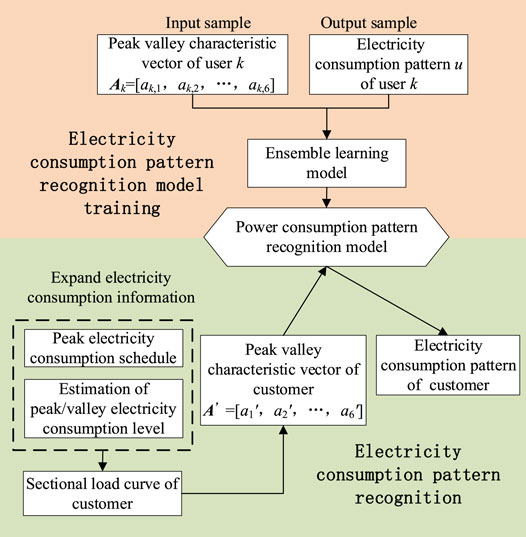
FIGURE 3. Basic process of electricity consumption pattern classification for customers.
Customer Classification Algorithm Based on BB-Stacking Model Fusion Framework
In the field of the classification problem, ensemble learning (EL) has gained the attention of a huge number of scholars, because it can make up for each single model's advantages (Wang et al., 2015). Among them, bagging (Hu et al., 2011) and boosting (Lu et al., 2006) are the most classic and widely used integration methods, which have their own characteristics in model generalization and model accuracy. Specifically, bagging builds multiple datasets in bootstrap way and trains multiple single models in parallel, integrating the output by Voting. The advantages of each model are integrated, preventing the overfitting phenomenon effectively. Boosting framework belongs to the mode of serial integration of models. The output of each model is used as the input of the lower model, and the minimum deviation is used as the loss function to continuously improve the accuracy of each model. Generally, the characteristics of the two integration methods are shown in Table 2.

TABLE 2. Characteristics and typical algorithms of bagging and boosting.
To give full play to the advantages of the two integration methods, a model fusion framework of BB-stacking (bagging and boosting in stacking) based on the stacking method is proposed. It combines the two integration methods reasonably to realize the organic trade-off between high-precision and strong generalization performance, yielding the high-precision classification of customers.
Traditional stacking is composed of the base model in the lower layer and the metamodel in the upper layer. Firstly, the initial data is divided into subdatasets by k-fold, and then the subdatasets are input into the base model for training and classification. Then the output of the lower layer is reconstructed and sent to the upper model for training and classification. The BB-stacking model fusion algorithm proposed in this paper changes the lower base model layer into the integration layer on the basis of the two-tier structure of stacking, in which bagging and boosting methods are used to preliminarily integrate the original model and then transferred to the upper metamodel to coordinate the advantages of the two integration modes, obtaining a model with higher accuracy and more stable generalization ability.
Expansion of New Customers' Electricity Consumption Information
In the traditional business process, customers provide limited information in the information filling process. To make the pattern classification of electricity consumption more accurate, this paper proposes an appropriate expansion of the electricity consumption information reported by the customers. In addition to the traditional information of electricity consumption type, electricity consumption location, and electricity consumption capacity, the peak electricity consumption time schedule, peak electricity consumption level estimation, and valley electricity consumption level estimation are added as the customer's electricity consumption information. Table 3 shows the demonstration of extended power consumption information of a customer.

TABLE 3. Extended electricity consumption information of a customer.
According to the example of extended electricity consumption information of the reported customer in Table 3, the reference load curve of the reported customer is obtained by time simulation. According to the definition of the peak-valley characteristic index in Table 1, the peak-valley characteristic vector of the customer can be calculated as the input of the electricity consumption pattern classification model.
Customer Load Forecasting
Calculation of Customer Load Level
The next step is to calculate the load level of the customers. Based on the regional industry electricity consumption behavior portrait, the corresponding method is adopted to calculate the customers’ load according to their type of electricity consumption (Yaoyao et al., 2013). The specific calculation method is as follows:
1) Commercial, nonindustrial, and residential customers
It is recommended to use the load density method to calculate the customers' load because the load level of these customers is closely related to their building area. Assuming that the classification result of the customer is industry electricity consumption pattern
where
2) Industrial customers
Generally, the load level of industrial customers often depends on the capacity of production equipment and has weak correlation with the building area. It is recommended to use the utility rate method to calculate the customer load. Similarly, assuming that the classification result of the customer is industry electricity consumption pattern
where
Forecasting of Customer Load Curve
After the customer load level estimation is completed, the load curve can be forecasted according to the electricity consumption pattern classification results of the customer in the industry. The forecasting load curve of the customer belonging to electricity consumption pattern
where
Evaluation Index of Customer Load Forecasting Results
The customer load forecasting technology is based on the industry electricity consumption behavior portrait of the region. Through the limited electricity consumption information, customer load after access is estimated. To provide guidance for planners to make customer access decisions, the accuracy of the expected results needs to be evaluated. Assuming that the actual load curve of the customer is
1) To directly reflect the maximum error level between the forecasting load curve and the actual load curve of customer, MAER is used to measure the error, which can be computed by
where
2) To ensure that ED is not affected by the actual load level of the customer, the maximum value of the actual load curve
where
Case Studies
The dataset used in this paper is the load data of distribution transformer in an economically developed city from 2015 to 2019. One measurement point data is obtained every 15 min, with a total of 96 load data points per day. From the huge dataset, the distribution transformer data with high data quality and load development to saturation are selected. Combined with the corresponding industry information identification of distribution transformer users, the data cleaning and load characteristic analysis from user level to industry level are completed. Finally, the regional industry electricity consumption behavior image of the city is constructed.
In all industries, the metal products industry accounts for the highest proportion of users, which is a typical industry in the region. Taking the metal products industry as an example, this paper analyzes and demonstrates the output results and verifies the effectiveness of the proposed method.
Display of Industry Electricity Consumption Behavior Portrait
Analysis Results of User Level Load Characteristics
1) User load curve analysis
Taking a user in the metal products industry as an example, the typical daily load curve of the user is extracted. Set the PAA segment number as 6 and the number of elements in symbol set as 4. The symbol sequence with the highest number of users is
2) User load characteristic extraction
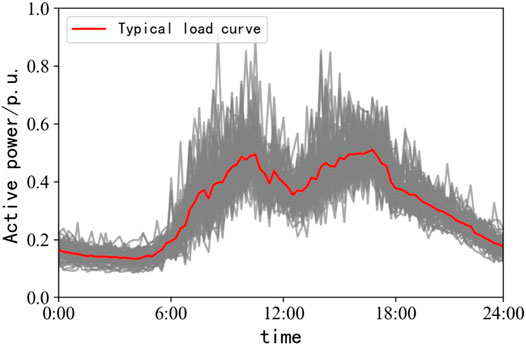
FIGURE 4. Typical load curve of a user.
Similarly, take the user as an example, collect the user's relevant loading information, and calculate the corresponding user load characteristics, as shown in Table 4. It can be found that the user has large-scale production and the daily peak-valley difference is high. From the long-term development point of view, when the user load develops to saturation, the utility rate is low.
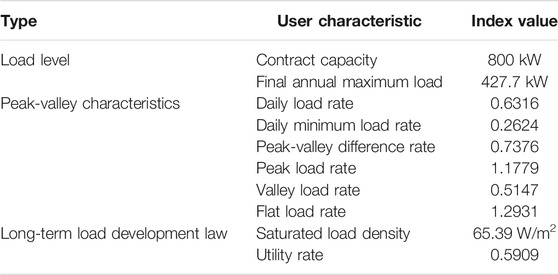
TABLE 4. Examples of user load characteristics.
Analysis Results of Industry Level Load Characteristics
1) Industry load curve analysis
After extracting the typical load curve of 2,478 users in the metal products industry, the load curve of this user group is clustered. The minimum cluster number
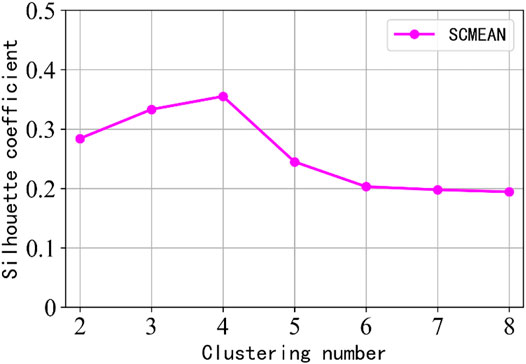
FIGURE 5. Change trend of clustering effect evaluation index.
It can be seen that the average value of SC of GWO-FCM clustering algorithm reaches the maximum when
1) Industry load characteristic extraction
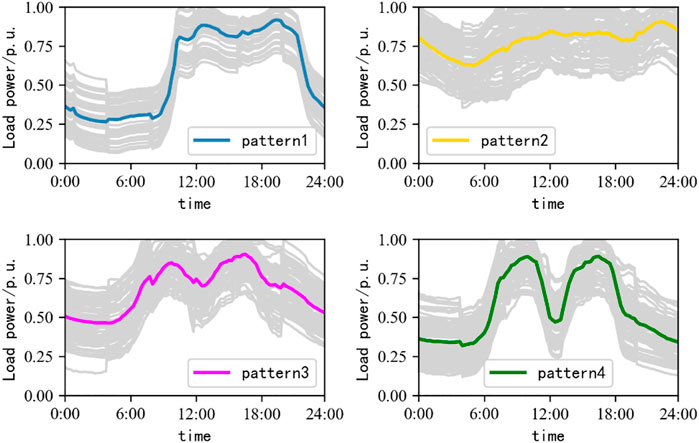
FIGURE 6. Division result of typical electricity consumption pattern in the industry.
After dividing the typical electricity consumption pattern of the industry, the characteristic extraction of the utility rate of 342 users in electricity consumption pattern one is taken as an example. The bandwidth
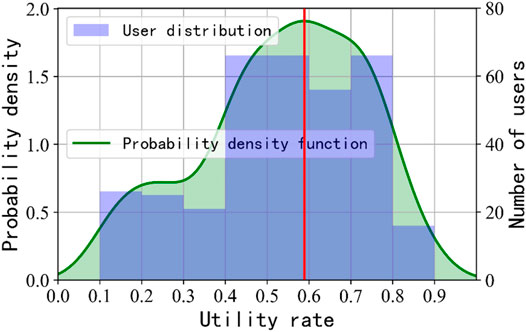
FIGURE 7. Users’ utility rate distribution and probability density function.
Customers’ Electricity Consumption Pattern Classification
To verify the effectiveness of load forecasting technology for new customers, 141 metal products’ users with complete electricity consumption data are selected as hypothetical customers. Therefore, the corresponding characteristic vectors are extracted and input into the trained BB-stacking model for electricity consumption pattern classification. In this paper, the traditional decision tree model (Safavian and Landgrebe, 1991), GRNN model (Specht, 1991), and PNN model (Oh and Pedrycz, 2002) are used to compare with the BB-stacking model. The classification accuracy under different training sample sizes is shown in Figure 8.
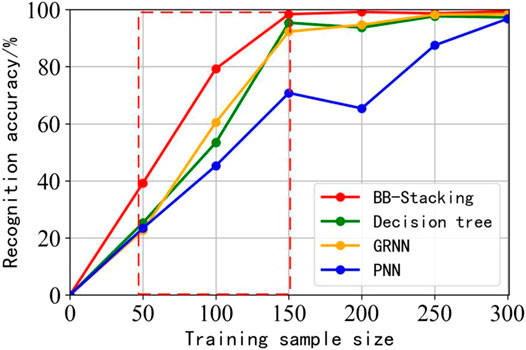
FIGURE 8. Accuracy rate trend of customer electricity consumption pattern classification.
It can be found that, in the training process, the BB-stacking classification model can achieve a better classification effect than other classification models in a small training sample size. When the training sample size increases, the BB-stacking classification model can maintain a more stable generalization ability. It is obvious that the BB-stacking classification model prevents the phenomenon of classification ability decline caused by underfitting, performing better classification effect and stability.
Analysis of Customer Load Forecast Results
After the electricity consumption pattern classification of the customers is completed, the forecasting load curves of 141 customers are obtained through Eqs 12–14 combined with the typical electricity consumption characteristics of the industry. To compare the effectiveness of various methods, the similarity between the load curve forecast results and the actual load curves is evaluated by EM and MAER, and the comparative analysis is carried out from the following two aspects.
1) Comparative analysis of different clustering numbers
Considering that the different number of clusters selected by the clustering algorithm will lead to different electricity consumption patterns, which may affect the accuracy of the forecasting results of customers, this paper uses the GWO-FCM algorithm to test the case of cluster number
2) Comparative analysis of different methods

FIGURE 9. Mean value of evaluation index on different clustering numbers.
To further study the effectiveness of the proposed customer load forecasting method, this paper compares the traditional load estimation method with the proposed method. In addition, the sectional load curve obtained by the segment simulation method in the process of electricity consumption pattern classification is compared with the proposed method in this paper.
The comparison between the load curve forecasting result of a certain customer and other methods is shown in Figure 10. It can be found that there is little difference between the maximum load level of the estimated load and the actual load curve, but there is no time sequence characteristic. To some extent, the segment simulation method reflects the time sequence characteristics of customers, but the difference is large when the load level changes. The overall trend of the load curve forecasting result is very close to the actual load curve, which can meet the optimal access requirements in the planning field considering the time sequence characteristics of customers’ load.
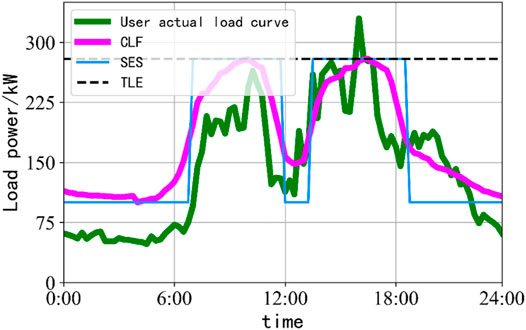
FIGURE 10. Comparison and analysis of customer load forecasting results.
Comparing the error index of actual load curve and load curve forecasting results under different methods, the mean value comparison of test samples is shown in Table 5. It can be found that the proposed method performs best in both of the two evaluation indexes. Significantly, the accuracy is greatly improved compared with the traditional load estimation method.
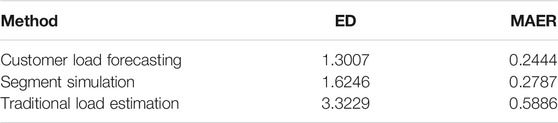
TABLE 5. Comparison of the mean value of error indexes of different methods.
Counting the two evaluation indexes of load estimation results of each hypothetical customer under different methods, two box diagrams are drawn to observe the distribution of sample indexes of each method, which are shown in Figures 11, 12. According to the box diagrams, the sample median level of the two error evaluation indexes of the traditional load estimation method is the highest, and the error fluctuation range is the widest; the results show that the segmented simulation method achieves the suboptimal effect in the two evaluation indexes, and the error fluctuation is also controlled in a small range. It is worth noting that the median of the evaluation index samples of the proposed method is the lowest, the falling range of the error index samples is the narrowest, and the fluctuation range of the algorithm performance is smaller, showing the best stability.
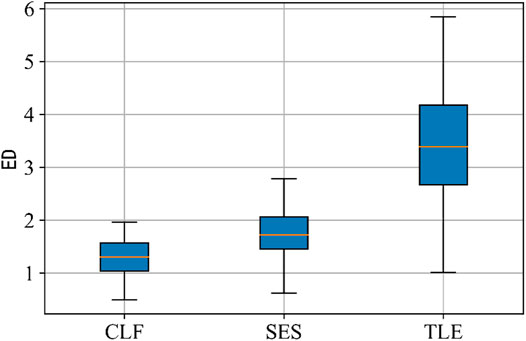
FIGURE 11. Euclidean distance (ED) of different methods.
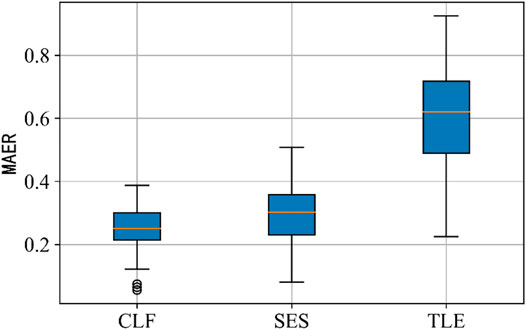
FIGURE 12. Maximum absolute error ratio (MAER) of different methods.
Conclusion
Aiming at the problem of distribution network planning refinement, in this paper, the methods for regional industry electricity consumption behavior portrait construction are proposed. Further, the load forecasting technology of new customers is studied. The main conclusions are as follows:
1) The methods for regional industry electricity consumption behavior portrait construction can fully mine the multidimensional characteristics of users in various industries, providing effective data support for distribution network planning. The division of electricity consumption pattern can comprehensively and accurately reflect the power consumption characteristics and general laws of various industries.
2) The proposed load forecasting method has a good effect on the load forecasting of the customers who are not connected to the power grid, providing effective guidance for the optimization of the customers' access decision and load scheduling (Li et al., 2021; Li and Yu, 2021). Moreover, the proposed method achieves significant performance in terms of the forecasting effect, algorithm stability, and practical application value.
Data Availability Statement
The datasets presented in this article are not readily available because regional power consumption data are subject to confidentiality requirements. Requests to access the datasets should be directed to MTA4NTI4MzA1N0BxcS5jb20=.
Author Contributions
Conceptualization, methodology, and writing—original draft, WG; data curation, DZ; investigation, HY; writing—review and editing, BP; formal analysis and visualization, YW; resources and funding acquisition, TY; supervision, KW.
Funding
The authors gratefully acknowledge the support of the Science and Technology Project supported by China Southern Power Grid (GDKJXM20172939).
Conflict of Interest
The authors declare that the research was conducted in the absence of any commercial or financial relationships that could be construed as a potential conflict of interest.
Publisher’s Note
All claims expressed in this article are solely those of the authors and do not necessarily represent those of their affiliated organizations, or those of the publisher, the editors, and the reviewers. Any product that may be evaluated in this article, or claim that may be made by its manufacturer, is not guaranteed or endorsed by the publisher.
References
Ampimah, B. C., Sun, M., Han, D., and Wang, X. (2017). Optimizing Sheddable and Shiftable Residential Electricity Consumption by Incentivized Peak and Off-Peak Credit Function Approach[J]. Appl. Energ. 210, S0306261917309716. doi:10.1016/j.apenergy.2017.07.097
Chen, T., Yin, X., Peng, L., Rong, J., and Cong, G. (2021). Monitoring and Recognizing Enterprise Public Opinion from High-Risk Users Based on User Portrait and Random Forest Algorithm[J]. Axioms 10 (2), 106. doi:10.3390/axioms10020106
Criscuolo, G., Mastroianni, G., and Occorsio, D. (1984). Uniform Convergence of Derivatives of Extended Lagrange Interpolation[J]. J. Comput. Appl. Maths. 282 (1), 669–698.
Gao, C., Wu, Y., Tang, J., Cao, H., and Chen, L. (2019). “Daily Power Load Curves Analysis Based on Grey Wolf Optimization Clustering Algorithm,” in International Seminar of Purple Mountain Forum Academic Forum, Beijing, China (Springer).
Han, Y., Shen, B., Hu, H., and Fan, F. (2014). Optimizing the Performance of Ice-Storage Systems in Electricity Load Management through a Credit Mechanism: An Analytical Work for Jiangsu, China. Energ. Proced. 61, 2876–2879. doi:10.1016/j.egypro.2014.12.327
Hu, G., Mao, Z., He, D., and Yang, F. (2011). Hybrid Modeling for the Prediction of Leaching Rate in Leaching Process Based on Negative Correlation Learning Bagging Ensemble Algorithm. Comput. Chem. Eng. 35 (12), 2611–2617. doi:10.1016/j.compchemeng.2011.02.012
Lambert, C. G., Harrington, S. E., Harvey, C. R., and Glodjo, A. (1999). Efficient On-Line Nonparametric Kernel Density Estimation. Algorithmica 25 (1), 37–57. doi:10.1007/pl00009282
Li, J., and Yu, T. (2021). A New Adaptive Controller Based on Distributed Deep Reinforcement Learning for PEMFC Air Supply System. Energ. Rep. 7, 1267–1279. doi:10.1016/j.egyr.2021.02.043
Li, J., Yu, T., Zhang, X., Li, F., Lin, D., and Zhu, H. (2021). Efficient Experience Replay Based Deep Deterministic Policy Gradient for AGC Dispatch in Integrated Energy System. Appl. Energ. 285, 116386. doi:10.1016/j.apenergy.2020.116386
Lian, H., Di, X., Shen, Z., and Feng, M. (2014). “Detailed Power Distribution Network Planning Based on the Description of Load Characteristics,” in China International Conference on Electricity Distribution, Shenzhen, China, September 23–26, 2014 (IEEE), 1759–1762.
Lin, S., Tian, E., Fu, Y., and Tang, X. (2017). Power Load Classification Method Based on Information Entropy Piecewise Aggregate Approximation and Spectral Clustering[J]. Proc. CSEE 37 (8), 2242–2252. doi:10.13334/j.0258-8013.pcsee.160279
Liu, C., and Du, J. (2020). “A User Portrait Construction Method for Financial Credit,” in Proceedings of 2020 Chinese Intelligent Systems Conference Volume II.
Lu, J., Plataniotis, K. N., Venetsanopoulos, A. N., and Li, S. Z. (2006). Ensemble-based Discriminant Learning with Boosting for Face Recognition. IEEE Trans. Neural Netw. 17 (1), 166–178. doi:10.1109/tnn.2005.860853
Notaristefano, A., Chicco, G., and Piglione, F. (2013). Data Size Reduction with Symbolic Aggregate Approximation for Electrical Load Pattern Grouping. IET Generation, Transm. Distribution 7 (2), 108–117. doi:10.1049/iet-gtd.2012.0383
Oh, S.-K., and Pedrycz, W. (2002). The Design of Self-Organizing Polynomial Neural Networks. Inf. Sci. 141 (3–4), 237–258. doi:10.1016/s0020-0255(02)00175-5
Pitner, T., Kriksciuniene, D., and Sakalauskas, V. (2012). Tracking Customer Portrait by Unsupervised Classification Techniques[J]. Transformations Business Econ. 11 (3), 167–189.
Qiu, H., Ying, T. U., and Ding, Q. (2017). Construction of Power Customer Portrait and its Credit Evaluation and Electricity Fee Risk Control Based on Tag Library System[J]. Telecommunications Sci. 1, 206–213.
Safavian, S. R., and Landgrebe, D. (1991). A Survey of Decision Tree Classifier Methodology. IEEE Trans. Syst. Man. Cybern. 21 (3), 660–674. doi:10.1109/21.97458
Sanchez, J. J., Barquin, J., Centeno, E., and López-Peña, Á. (2008). “A Multidisciplinary Approach to Model Long-Term Investments in Electricity Generation: Combining System Dynamics, Credit Risk Theory and Game Theory,” in Power & Energy Society General Meeting-conversion & Delivery of Electrical Energy in the Century (IEEE). doi:10.1109/pes.2008.4596452
Shan, X. (2018). Research on User Portrait Based on Online Review: Taking C-Trip Hotel as an Example[J]. Inf. Stud. Theor. Appl.
Specht, D. F. (1991). A General Regression Neural Network. IEEE Trans. Neural Netw. 2 (6), 568–576. doi:10.1109/72.97934
Wang, X.-Z., Xing, H.-J., Li, Y., Hua, Q., Dong, C.-R., and Pedrycz, W. (2015). A Study on Relationship Between Generalization Abilities and Fuzziness of Base Classifiers in Ensemble Learning. IEEE Trans. Fuzzy Syst. 23 (5), 1638–1654. doi:10.1109/tfuzz.2014.2371479
Wu, T., Yang, F., Zhang, D., Zhu, A., and Wan, F. (2020). “Research on Recommendation System Based on User Portrait,” in 2020 IEEE International Conference on Artificial Intelligence and Information Systems (ICAIIS) (IEEE). doi:10.1109/icaiis49377.2020.9194941
Xi, L., Yu, T., Yang, B., Zhang, X., and Qiu, X. (2016). A Wolf Pack Hunting Strategy Based Virtual Tribes Control for Automatic Generation Control of Smart Grid. Appl. Energ. 178, 198–211. doi:10.1016/j.apenergy.2016.06.041
Yang, B., Jiang, L., Wang, L., Yao, W., and Wu, Q. H. (2016). Nonlinear Maximum Power point Tracking Control and Modal Analysis of DFIG Based Wind Turbine. Int. J. Electr. Power Energ. Syst. 74, 429–436. doi:10.1016/j.ijepes.2015.07.036
Yang, B., Jiang, L., Yao, W., and Wu, Q. H. (2015). Perturbation Estimation Based Coordinated Adaptive Passive Control for Multimachine Power Systems. Control. Eng. Pract. 44, 172–192. doi:10.1016/j.conengprac.2015.07.012
Yang, B., Wang, J., Zhang, X., Yu, T., Yao, W., Shu, H., et al. (2020). Comprehensive Overview of Meta-Heuristic Algorithm Applications on Pv Cell Parameter Identification. Energ. Convers. Manage. 208, 112595. doi:10.1016/j.enconman.2020.112595
Yang, B., Yu, T., Shu, H., Dong, J., and Jiang, L. (2018). Robust Sliding-Mode Control of Wind Energy Conversion Systems for Optimal Power Extraction via Nonlinear Perturbation Observers. Appl. Energ. 210, 711–723. doi:10.1016/j.apenergy.2017.08.027
Yang, B., Yu, T., Zhang, X., Li, H., Shu, H., Sang, Y., et al. (2019). Dynamic Leader Based Collective Intelligence for Maximum Power Point Tracking of PV Systems Affected by Partial Shading Condition. Energ. Convers. Manage. 179, 286–303. doi:10.1016/j.enconman.2018.10.074
Yang, B., Zhang, X., Yu, T., Shu, H., and Fang, Z. (2017). Grouped Grey Wolf Optimizer for Maximum Power point Tracking of Doubly-Fed Induction Generator Based Wind Turbine. Energ. Convers. Manage. 133, 427–443. doi:10.1016/j.enconman.2016.10.062
Yang, B., Zhong, L., Zhang, X., Shu, H., Yu, T., Li, H., et al. (2019). Novel Bio-Inspired Memetic Salp Swarm Algorithm and Application to MPPT for PV Systems Considering Partial Shading Condition. J. Clean. Prod. 215, 1203–1222. doi:10.1016/j.jclepro.2019.01.150
Yaoyao, H. E., Qifa, X. U., Yang, S., and Yu, B. (2013). A Power Load Probability Density Forecasting Method Based on RBF Neural Network Quantile Regression[J]. Proc. CSEE 33 (1), 93–98.
Yu, X., Wang, L., Li, Y., Xin, L., Li, G., and Zhang, Z. (2017). Application Research on the Customer's Portrait of Electric Power Marketing Informatization[J]. Comput. Technol. Automation.
Zhang, H., Qin, X., and Zheng, H. (2020). Research on Contextual Recommendation System of Agricultural Science and Technology Resource Based on User Portrait[J]. J. Phys. Conf. Ser. 1693 (1), 012186. doi:10.1088/1742-6596/1693/1/012186
Zhang, X., Tan, T., Zhou, B., Yu, T., Yang, B., and Huang, X. (2021). Adaptive Distributed Auction-Based Algorithm for Optimal Mileage Based AGC Dispatch with High Participation of Renewable Energy. Int. J. Electr. Power Energ. Syst. 124, 106371. doi:10.1016/j.ijepes.2020.106371
Zhang, X., Yu, T., Yang, B., and Li, L. (2016). Virtual Generation Tribe Based Robust Collaborative Consensus Algorithm for Dynamic Generation Command Dispatch Optimization of Smart Grid. Energy 101, 34–51. doi:10.1016/j.energy.2016.02.009
Zhang, X., Yu, T., Yang, B., Zheng, L., and Huang, L. (2015). Approximate Ideal Multi-Objective Solution Q(λ) Learning for Optimal Carbon-Energy Combined-Flow in Multi-Energy Power Systems. Energ. Convers. Manage. 106, 543–556. doi:10.1016/j.enconman.2015.09.049
Zhong, C., Shao, J., Zheng, F., Zhang, K., Lv, H., and Li, K. (2018). “Research on Electricity Consumption Behavior of Electric Power Users Based on Tag Technology and Clustering Algorithm,” in 2018 5th International Conference on Information Science and Control Engineering (ICISCE). doi:10.1109/icisce.2018.00102
Keywords: industry electricity consumption behavior portrait, cluster analysis, ensemble learning framework, multidimensional electricity consumption characteristics, customer load forecasting
Citation: Guan W, Zhang D, Yu H, Peng B, Wu Y, Yu T and Wang K (2021) Customer Load Forecasting Method Based on the Industry Electricity Consumption Behavior Portrait. Front. Energy Res. 9:742993. doi: 10.3389/fenrg.2021.742993
Received: 17 July 2021; Accepted: 04 August 2021;
Published: 12 October 2021.
Edited by:
Xiaoshun Zhang, Shantou University, ChinaReviewed by:
Guiyuan Zhang, Shantou University, ChinaDa Xu, China University of Geosciences Wuhan, China
Copyright © 2021 Guan, Zhang, Yu, Peng, Wu, Yu and Wang. This is an open-access article distributed under the terms of the Creative Commons Attribution License (CC BY). The use, distribution or reproduction in other forums is permitted, provided the original author(s) and the copyright owner(s) are credited and that the original publication in this journal is cited, in accordance with accepted academic practice. No use, distribution or reproduction is permitted which does not comply with these terms.
*Correspondence: Tao Yu, dGFveXUxQHNjdXQuZWR1LmNu