 Wenli Deng
 Ping Dong
- School of Electric Power, South China University of Technology, Guangzhou, China
With the development of the electricity market, various stakeholders such as batteries, multi-microgrid (MMG), and electric vehicle (EV) clusters, can trade with either the distribution network or each other to meet their power balance needs and to maximize their profits. This paper proposes a two-level game model based on game theory to study the operation strategy of stakeholders in the distribution network. First, each stakeholder predicts its electricity demand profile. A Markov Decision Process (MDP) model of random variables is established to predict the charging and discharging power of the battery. Then, the two-level game is presented to let multi-stakeholder participate, in which different kinds of stakeholders have different game strategy limits. Additionally, suggestions for battery operation modes under different compensation coefficients are given to participate in the subsequent two-level game. An algorithm is proposed to allow stakeholders to merge or split self-adaptively based on Nondominated Sorting Genetic Algorithm II (NSGA-II) to optimize operation mode. Finally, the proposed model is applied to the PG and E69-bus distribution system and a practical 101-bus distribution system in China. The case studies show that different game strategy limits of the stakeholders will affect the distribution of the Nash equilibrium (NE) solutions. The multi-stakeholder system can better absorb regional unbalanced power through electricity transactions, and further increase the benefits of each stakeholder.
Introduction
With MMG (Wu et al., 2011; Li et al., 2013), batteries (Wang et al., 2019a), and EV clusters (Zhang et al., 2017; Li et al., 2021) connected to the distribution network, the structure and operation mode of the distribution network are becoming more complex. Meanwhile, with the development of electricity market transactions, microgrids (MGs) with distributed energy resources can trade with other stakeholders, such as EVs and batteries (Wang et al., 2017). Through diversified market competition and cooperation, the operational benefits of various stakeholders (Rui et al., 2019) and the operation efficiency of the entire system can be improved. When the interaction among multi-stakeholder involving batteries, MMG, and EV clusters is considered, how to achieve the optimal operation of the entire system under the electricity market has become a challenging problem.
In the market-oriented transactions on the load side, game theory is a common tool to solve the optimization problem of multiple decision-making entities (Lu et al., 2014). Game theory is also used widely in MG behavior strategies and pricing. When MMG are used as dispatched units, through participation in load-side market transactions and bidding games (Liu et al., 2017), a model of electricity price bidding decisions is constructed. A two-stage dynamic game (Jiang et al., 2014) is adopted to achieve optimal economic dispatch of the distribution network; meanwhile, the MGs have the best operation profits. However, the possibility of direct transactions between MMG is ignored and the enthusiasm of MGs for participating in the electricity market cannot be given fully utilized. In literature (Jalali et al., 2017), a one-leader multiple-follower model between the distribution network operator and the MMG system is constructed considering transactions between MMG. A cooperative coalition of photovoltaic MG groups is formulated in (Liu et al., 2018), which does not consider the impact of the overall unbalanced power after the coalition is formed on the external distribution network, yet considered in (Lin et al., 2017). However, the participants in the game in the above studies are either MMG or MMG and distribution networks (Lin et al., 2017). When the distribution network contains multi-stakeholder such as batteries, MMG, and EV clusters, the situation that each stakeholder gives different game strategies to participate in the transaction needs further study.
When multi-stakeholder participate in game transactions, they need to predict their power curves for the next day. In existing works of literature, the integration of storage units helps to balance the system while dealing with various sources of uncertainty in the power grid (Moazzami et al., 2018). Considering the energy storage system and distributed energy resources in the user’s house, literature (Paterakis et al., 2015) developed a detailed home energy management system structure and determined the demand response strategies to determine the optimal day-ahead home appliance dispatching. Energy storage is collaborated operation with renewable resources to decrease the vulnerability of the system against plausible fluctuations in generation or consumption and alleviate the generation cost at peak hours, then it increases the robustness and resiliency of the grid (Shen et al., 2015; Bitaraf and Rahman, 2018). However, the above studies all use traditional methods to model the uncertainties, which are complex and have poor convergence, and even difficult to solve due to the large state space. It is more effective to use Markov Decision Process (MDP) to model the uncertainty of the system. In (Shi et al., 2020), the operation of the battery is modeled as an MDP, and a Q deep neural network is embedded to approximate the optimal decision of battery, so as to deal with the problem of system voltage operation level caused by the high intermittent of renewable energy sources and the fluctuation of load demand. An MDP model for the real-time operation of the MG is established under uncertain conditions. Then, the best output of the battery is determined in the MG (Shuai et al., 2019; Zhu et al., 2019). The above studies all combine the operation of batteries with the variability and uncertainty of renewable energy sources and load in the MG or distribution network. One main challenge of the battery participating in electricity transactions is establishing an MDP model based on the influence of the temperature of the battery and determining its optimal charging and discharging strategy to participate in the two-level game to obtain maximum benefits.
Moreover, EVs mainly participate in demand response to profit (Lin et al., 2020) or charge and discharge intelligently based on time-of-use (TOU) electricity price (Wang et al., 2019b; Wang et al., 2019c). The battery is often used for peak shaving and valley filling as grid-side storage. EV clusters and batteries can be set as independent agents to trade energy in the market (Fang et al., 2020), but not always trade with the distribution network. When EV clusters and batteries are independent stakeholders after predicting the charging and discharging profile, the main problem is to develop a new framework that enables a number of stakeholders to individually and strategically choose the partners that they wish to trade with (Wang et al., 2014). Yet few papers have researched in-depth on this issue.
This paper proposes a two-level game model of multi-stakeholder in the distribution network. The upper-level game is a non-cooperative game of electricity price between the distribution network and multi-stakeholder, and the lower-level game is a cooperative game of transaction loss cost to find the optimal coalition of multi-stakeholder. An algorithm is proposed to allow stakeholders to merge or split self-adaptively based on NSGA-II to optimize operation mode. The contributions of this paper are listed as follows:
(1) An MDP model of battery is established to predict its charging and discharging power considering the influence of temperature randomness. In addition, the profitability of the battery in different compensation coefficients is analyzed, and clear guidance on the choice of battery operation mode is given.
(2) The two-level game is presented to let multi-stakeholder participate, in which different kinds of stakeholders have different game strategy limits. the convergence domain of the game system will be extended from a common two-dimensional plane to a three-dimensional space. The proposed two-level game model can be used to solve higher dimensional Nash equilibrium problems.
(3) MGs, batteries, and EV clusters are independent stakeholders in this paper. Case studies applied to the PG and E69-bus distribution system and a real 101-bus system demonstrate the effectiveness of the two-level game model, with cost reduction for the multi-stakeholder in the distribution system.
Power Prediction of Battery and EV Cluster
Before participating in the two-level game, all stakeholders need to predict their power curve of the next day. The MGs contain renewable energy sources such as wind power and photovoltaic power generation. The power prediction technology of MGs is quite mature and will not be introduced in detail here. In this paper, an MDP model is established to predict battery power considering the influence of temperature randomness on battery charging efficiency. Moreover, the charging and discharging power of the electric vehicle cluster are obtained based on the time of use electricity price under the premise of meeting the travel demand of users.
Power Prediction of Battery
Battery Model
Considering the effect of temperature on the charging efficiency during the charging process of the battery (Powell and Meisel, 2016), a random variable is introduced into the charging/discharging process of the battery. The state of charge of the battery has Markov characteristics, in which
where
The objective function is subject to the constraints as follows:
where
Markov Decision Process
MDP is a sequential optimization problem whose goal is to find a policy to maximise expected profits or minimise expected costs (Zhu et al., 2019). Let
The problem is to find the strategy from
According to the optimality principle proposed by Bellman in 1957, Bellman equation can be used to reformulate and recursively solve as:
In Equation 8, the original multi-stage optimisation problem can be decomposed into a serial of single-stage sub-problems and solved in turn. When solving the sub-problem in each stage, the latest exogenous information can also be considered to deal with the uncertainty of the system. The discount factor is set to be 1.
MDP theory is based on the setting of sub-problems according to temporal decomposition. In the temporal decomposition framework, there are four classes of elements, namely state variables, decision variables, exogenous information, and transition function. They are defined as follows:
i. State variable: The state variable is used to reflect the relationships among sub-problems in the decision-making process. The state variables of battery can be expressed as
ii. Decision variable: The decision variable is the charge/discharge power of battery:
iii. Exogenous information: The exogenous information is used to represent the stochastic factor in the decision process of battery, which is given by
iv. Transition function: The transition function is used to map the current state to the next state according to the decision and the exogenous information. The transition function between period
Solution of MDP Model
Because the MDP problem in this paper contains the calculation of expected value, it will often lead to difficulty in solving. Then the problem of curse of dimensionality is brought about. ADP uses the method of iteratively updating the approximate value function to find a strategy to make the value function approximately optimal. In the existing works, there are several methods to update the approximate value function. In this paper, the method proposed in (Zhu et al., 2019) is used to update the slopes of the value functions.
Power Prediction of EV Cluster
where
The charging and discharging strategy of EVs is determined by the following rules according to the specific time when the EV finally returns to the residential area:
For EVs Who Return During Peak Period
i. If
ii. If
For EVs Who Return During Flat Period
i. If
ii. If
iii. If
iv. If
For EVs Who Return During Valley Period
For EVs who return during valley period, they will charge immediately.
Two-Level Game Model
Upper-Level of the Game Model
Non-cooperative Model of the Upper Game
In this paper, a distribution system with stakeholders such as MMG, batteries, and EV clusters is considered. Batteries and EV clusters are energy storage systems (ESS). According to the unbalanced power, an MG with power surplus is called “the seller MG” while one with power shortage is called “the buyer MG”. An ESS is called “the seller ES”’ when discharging while one is called “the buyer ESS” when charging. An ESS without charging or discharging is called “the balanced ESS”. The open electricity market is considered, and power is allowed to be transferred between the multi-stakeholder as well as between the stakeholder and the distribution system ({DS}). Then the upper-level non-cooperative game model
where
The Participants.
The participants in the game are the seller MGs, the seller ESSs and the {DS}.
The Strategies
The Gains
The gains of the seller MGs, the seller ESSs, and the {DS} have different compositions, described as follows:
a. The gain of the seller MG includes transaction income, service charge, generation cost, and subsidy income for renewable energy power generation. The gain of the {DS} is composed of transaction income (part of the transaction with the MG), service income, and balance power income (part of the transaction with the main network) (Lin et al., 2017).
b. The gain of the seller battery is composed of transaction income, service charge, and depreciation cost.
1. Transaction income:
where
2 Service charge: The services charge
where
3 depreciation cost: the depreciation loss during battery operation is considered as follows:
where
In conclusion, the
c. The gain of the seller EV cluster is also a combination of transaction income, service charge, and operation and maintenance cost.
1. Transaction income:
where
2. Service charge: The services charge
3. Operation and maintenance cost: the cost of operating and maintaining EV clusters such as charging piles and other equipment is considered as follows:
where
In conclusion, the
The game structure is shown in Figure 1.
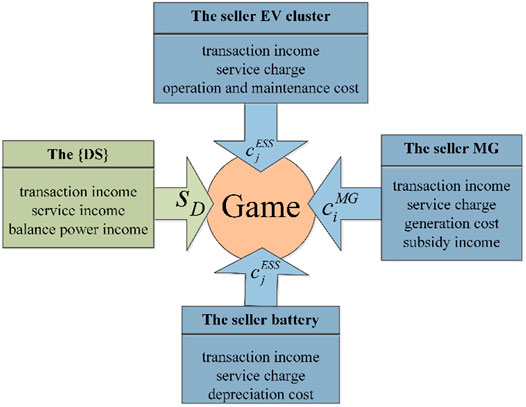
FIGURE 1. Game structure of multi-stakeholder and the {DS} transaction mode.
Electricity Trading Rules
According to the power curves predicted by all stakeholders, the transactions in the system are studied. The transaction rules are formulated as follows:
a. The seller MGs and the seller ESSs fix the price for selling electricity sale price, respectively. Additionally, the {DS} fixes the service charge.
b. With the aim of minimal cost, the buyer decides to trade with either the seller MGs, the seller ESSs or the {DS} in sequence until its demand is fulfilled.
c. First, in accordance with the principle of prioritizing the consumption of renewable energy sources, the buyers will purchase electricity from MGs, EV clusters, and finally batteries. Buyers with the largest power shortage are satisfied first.
d. When several sellers offer the same electricity price, the buyers trade with first the MGs, then the EV clusters, and finally the batteries. The seller with more power surpluses has a priority to trade with buyers.
Lower-Level of the Game Model
In the upper game, most of the NE solutions have their corresponding operation mode. However, there is a situation where participants have the same gain when they operate in the coalition mode and the non-cooperation mode. This is called ‘the selection mode’, then it turns to the lower level of the game which is a cooperative game of transaction loss cost. The final operation mode is determined by comparing the transaction loss of the stakeholders in different modes (Lin et al., 2017).
Stakeholders Operate in the Non-cooperative Mode
The non-cooperative model is an operation situation in which all stakeholders trade with the {DS}, but do not trade with each other.
In the non-cooperation mode, active power
where
where
We define the power loss cost as the
where
Stakeholders Operate in the Coalition Mode
Multi-stakeholder and the {DS} do not have direct power transactions. All stakeholders cooperate with each other to complete power transmission and form a coalition. With the coalition as a unit to conduct power transactions with the {DS}, the stakeholders within the coalition can exchange energy. At the same time, power exchange between stakeholders can avoid losses on the transformer.
In order to study further the possibility of forming a coalition and the assignment of the coalition’s cost, we define the cooperative multi-stakeholder coalition game as a pair
s.t.
where
The constraints indicate that there are a seller and a buyer in a coalition at least, and two stakeholders are possible to cooperate only if they locate nearer than the distance threshold. The system should also satisfy the line capacity constraints, voltage constraints, and power flow equation constraints. The power loss
where
The impedance loss of the transmission line and transformer loss
Therefore, we define the objective function of the lower-level of the model as follows:
The objective function represents the smallest cost of the coalition
where
Game Algorithm of Optimal Multi-Stakeholder Coalition Based on NSGA-II
After predicting the power curve through MDP, then the battery participates in the game as an independent stakeholder. In order not to omit any NE solution, the upper-level game finds the NE points by traversing the strategy combination method, the lower-level game model based on the NSGA-II allows stakeholders to merge or split self-adaptively. The overall flowchart of the algorithm is shown in Figure 2.
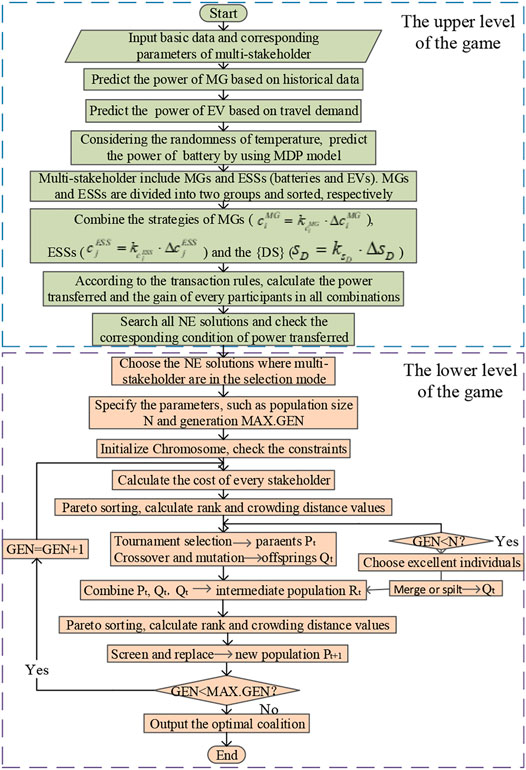
FIGURE 2. Optimal multi-stakeholder coalition algorithm based on NSGA-II.
Existence of the NE Solutions
The NE solutions are the key to the upper-level game. All the strategy combinations of participants will be enumerated so that no NE solutions will be omitted. Therefore, the strategies need to be discretised. The discrete steps are
The upper and lower limits of the strategy set have been defined above. Therefore, the discrete strategy combinations are finite. Moreover, the number of participants is also finite in this game. According to Theorem 1, the NE’s existence is ensured.
Theorem 1: (Nash 1950): In the n-player normal-form game
Optimal Coalition Algorithm Based on NSGA-II
NSGA-II is a representative multi-objective optimization algorithm and similar to the basic genetic algorithm. Its core idea is: to sort the population non-dominantly, and then obtain the virtual crowded distance of each individual in each level. On this basis, the operations of selection, crossover, mutation, and elite retention are completed. NSGA-II uses Pareto sorting to find the minimum electricity loss value of each stakeholder without increasing the power consumption of other stakeholders, such a coalition is called the optimal stakeholder coalition.
Assume that
Merge rule: Merge any collections of
Split rule: Split any coalition of
Case Studies
The MDP model of power prediction of the battery is a non-linear programming (NLP) problem, which is solved by BARON solver in GAMS. Several case studies of two-level game model for multi-stakeholder transactions are carried out by using MATLAB.
Simulation Parameters
In this section, simulations are performed to validate the proposed model. We test the proposed model on the PG and E69-bus distribution system as illustrated in Figure 3. There are 6 MGs connected randomly to nodes 30, 41, 15, 21, 53, and 69, respectively. There is an EV cluster (EV1) and a battery (battery1) at nodes 65 and 58, respectively. The EV1 has 100 EVs with a capacity of 30 kWh and rated power of 5 kW. The battery1 has a capacity of 1,000 kWh and a rated power of 200 kW. All stakeholders are interconnected through Interconnect Static Switch (ISS). The ISS is disconnected when two stakeholders are in the non-cooperative mode, and the ISS is closed when they operate in the coalition mode. The TOU electricity price of the {DS} is shown in Table 1. The values of the other parameters are shown in Table 2. The predicted power curves of the MGs and EV1 are demonstrated in Figure 4.
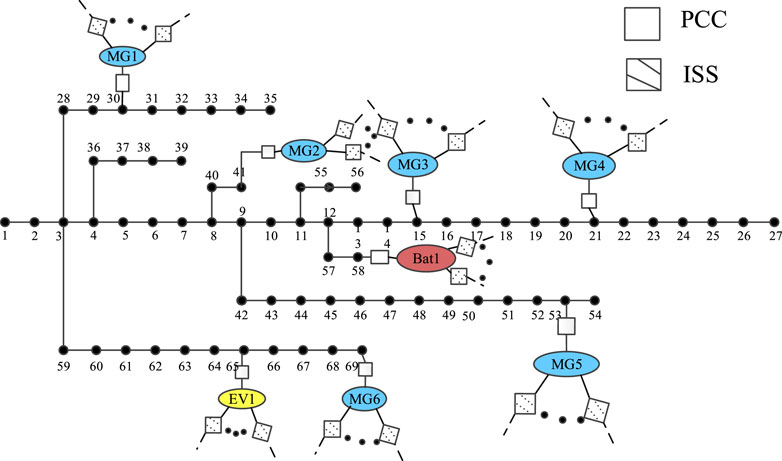
FIGURE 3. Distribution of the multi-stakeholder in PG&E69-bus distribution system.
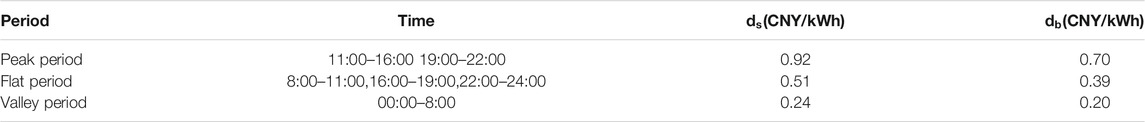
TABLE 1. TOU electricity price of the {DS}.
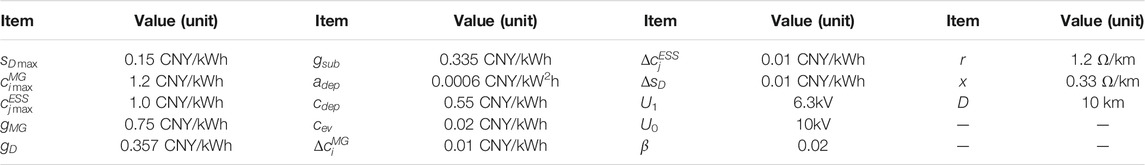
TABLE 2. value of some corresponding parameters.
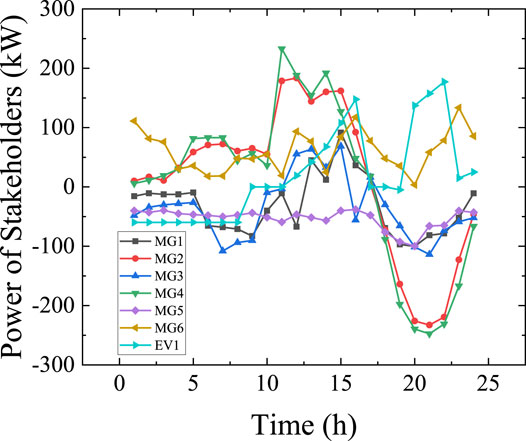
FIGURE 4. Power prediction curves of the MGs.and EV1.
Analysis of the Profits of the Battery in Different Modes
The battery is connected to the {DS} as an independent stakeholder. Figure 5A shows two operation strategies of battery. One is “grid-side energy storage mode” that the battery operates to minimize the standard deviation of the load profile in the {DS}. The other is “arbitrage mode” that the battery operates to maximize its own profits according to the TOU electricity price. The battery predicts the power curves of the two operation modes to participate in the subsequent two-level game. Ultimately, the operation mode of the battery depends on its corresponding benefit.
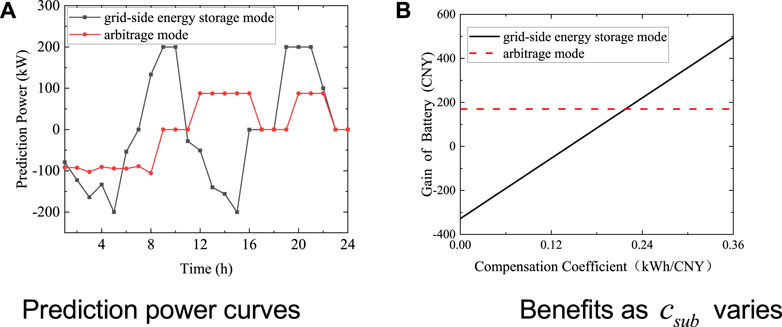
FIGURE 5. Battery operates in different modes.
In order to explore the influence of compensation coefficient on the benefit of the operation modes, the benefits of grid-side energy storage mode and arbitrage mode are compared in Figure 5B under different compensation coefficients. As the compensation coefficient
Results of battery predicted power.
The problem of maximizing the revenue of the battery is an NLP problem. The charging efficiency is a random variable affected by temperature and distributed in [0.9,0.95], and the discharge efficiency is assumed to be 1.
In the deterministic case, as shown in Figure 6A, the battery’s benefit and power curve obtained by the ADP algorithm are exactly the same as those obtained by the centralized algorithm (Wang et al., 2019b). The benefits are both 213.495 CNY. The results show that it is feasible to solve the MDP model in this paper by using the ADP algorithm.
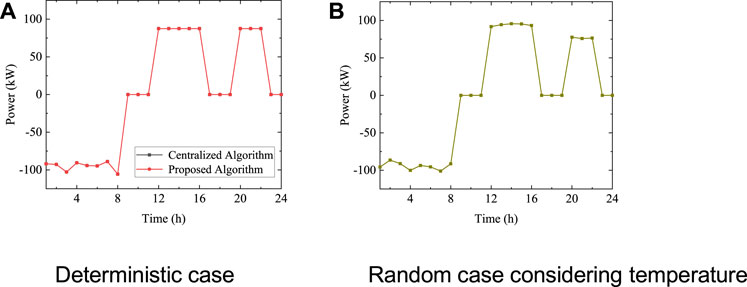
FIGURE 6. Battery operates in different modes.
In the random case, the influence of temperature on charging efficiency is considered. The proposed algorithm is used to solve random problems in multiple scenarios. The power prediction curve of the battery is shown in Figure 6B. The result shows that the MDP model and the ADP algorithm can effectively predict the charging and discharging power of the battery as an independent stakeholder in the random scenario. The result will provide strong guidance for the battery to participate in subsequent game electricity transactions.
Results Analysis of Upper-Level Game
In this paper, the two-level game works when the unbalanced power of each stakeholder is different in each time period. The subsequent game results are analyzed based on the results of
The three-dimensional distribution of NE solutions is shown in Figure 7. Most NE solutions are corresponding to non-cooperative models. There is no transaction between stakeholders, that is, the sellers sell power to the {DS} while the buyers buy power from the {DS}. The game strategies and gains will not be influenced. However, the NE point
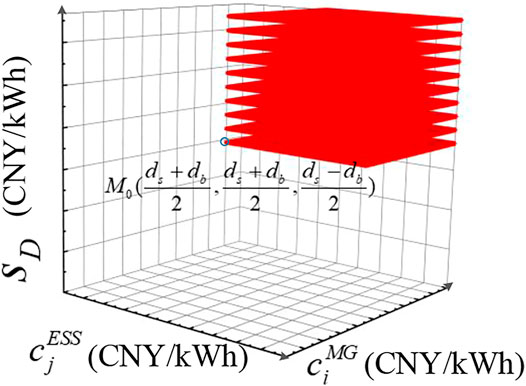
FIGURE 7. Three-dimensional distribution of NE solutions.
Service charge
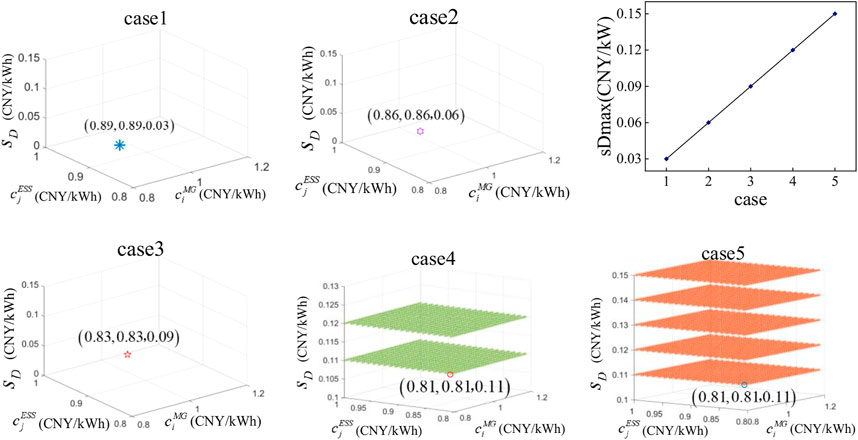
FIGURE 8. Three-dimensional distribution of the NE solutions as
The impact of
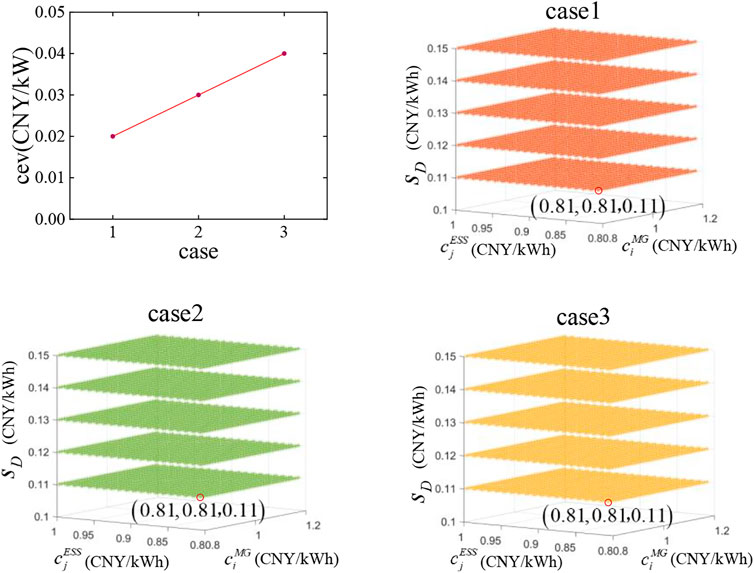
FIGURE 9. Three-dimensional distribution of the NE solutions as
Results Analysis of Lower-Level Game
In case 1, there are only MGs in the {DS}. As shown in Figure 10A, simulation results demonstrate the effectiveness of reducing the cost of power loss for any MGs joining in a coalition. Meanwhile, MG1 and MG6 form a coalition while the other MGs trade with the {DS} in the non-cooperative mode.
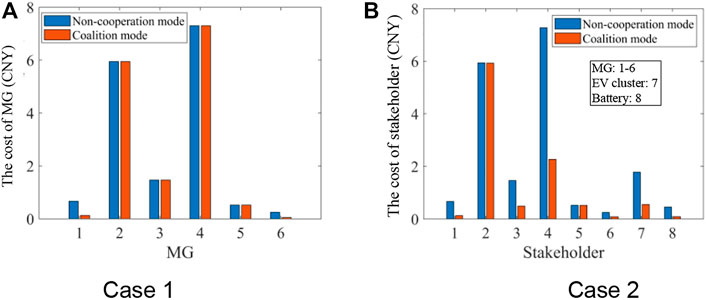
FIGURE 10. Cost comparison between non-cooperation mode and coalition mode.
Based on case 1, the independent stakeholders EV1 and battery1 connect to the {DS} and participate in power transactions in case 2. The costs of power loss of the stakeholders are shown in Figure 10B. In this case, MG2 and MG5 both trade with the {DS}; MG3 and MG6 form coalition 1 (
The comparison of the total daily operation gains of each stakeholder in different modes is shown in Table 3. In case 1, the results show that the MGs operating in the coalition mode have greatly reduced power loss cost compared with the non-cooperative mode. Thus, the total daily operation costs of the buyers will be reduced while the total daily operation gains of the sellers will be increased. In case 2, after EV1 and battery1 connecting to the {DS}, in the non-cooperative mode, the total daily operation gains of EV1 and battery1 are 460.1946 CNY and 208.9388 CNY, respectively. In the coalition mode, the total daily operation gains of EV1 and battery1 are 465.0688 CNY and 210.3351 CNY, respectively. The results indicate that the EV cluster and battery as independent stakeholders participate in power transactions to choose their own trading partners adaptively, then their gains will be increased. At the same time, due to the increase in the types and number of stakeholders, the composition of coalitions has also changed. In the meanwhile, the daily operation gains of MGs have also increased in case 2 compared with case 1.
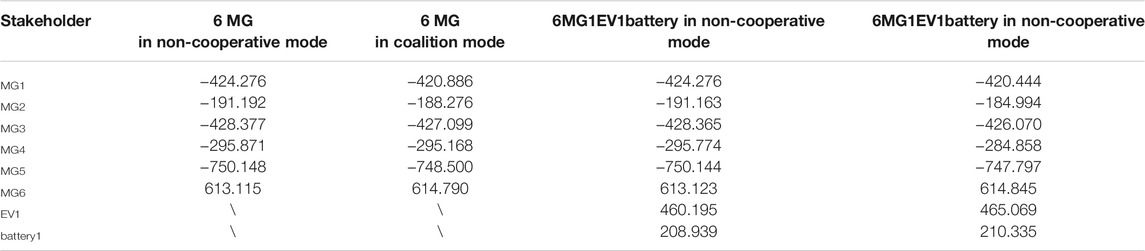
TABLE 3. total daily operation gains of every stakeholder (unit: CNY).
In order to investigate the efficiency of the proposed two-level game in the real system, a real 101-bus system located in the southeast of China is employed. The distribution of multi-stakeholder in the real 101-bus system is shown in Figure 11. The results of the cost comparison of stakeholders between non-cooperation mode and coalition mode in the real 101-bus system are shown in Figure 12. The results of coalition and cost reduction percentage are shown in Table 4. Coalition 1 is composed of MG4 and MG7. Coalition 2 is composed of MG5 and EV4. There is only EV3 in coalition 3 and EV3 trades directly with the {DS} in the non-cooperative mode. Coalition 4 is composed of MG3, MG6, battery2, and battery4. Coalition 5 is composed of MG2, MG9, MG10, and battery3. Coalition 6 is composed of MG1, MG8, and battery1. Coalition 7 is composed of EV1 and EV2. In addition to EV3 directly trading with the distribution network, other stakeholders form coalitions to trade with each other, then the cost of the transaction loss is greatly reduced. This indicates that the proposed two-level game model is suitable for multi-stakeholder transactions in a real system, and can well reduce transaction loss costs.
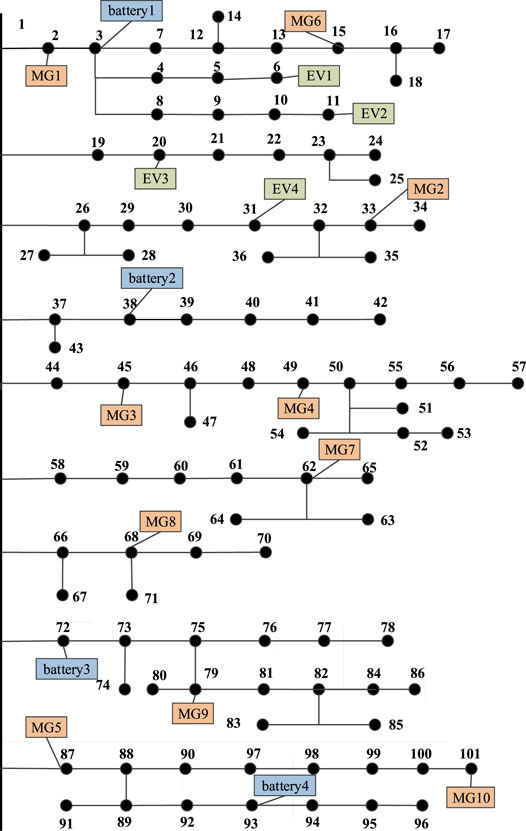
FIGURE 11. The distribution of multi-stakeholder in the real 101-bus system.
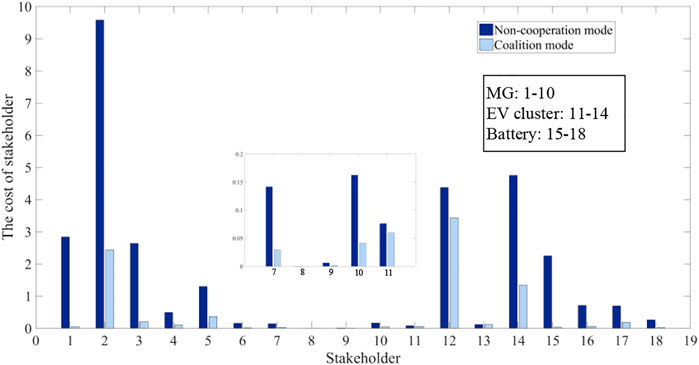
FIGURE 12. The cost comparison of stakeholders between non-cooperation mode and coalition mode.
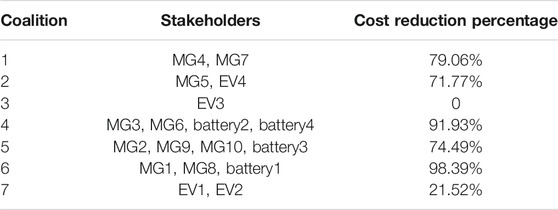
TABLE 4. The results of coalition and cost reduction percentage.
Conclusion
In this paper, a two-level game operation model of the multi-stakeholder distribution system including batteries, EV clusters, and MMGs is established. An effective algorithm is proposed to allow stakeholders to merge or split self-adaptively based on NSGA-II to solve the game model to optimize operation mode. Then, the transaction objects of each stakeholder will be decided. In the meantime, the best operation of the entire system will be achieved. The simulation results which are studied in the PG and E69-bus distribution system and a real system verify the accuracy of the proposed model. A useful reference for multi-stakeholder participating in the electricity market is provided in this paper.
(1) An MDP model established by considering the influence of temperature on the charging efficiency can effectively predict the power curve of the battery to participate in the two-level game.
(2) The gain of the battery highly depends on the choice of operation mode. The profitability of the battery in different compensation coefficients is analyzed and clear guidance on the choice of battery operation mode are given.
(3) Multi-stakeholders are considered simultaneously in the game relationships, so the distribution of NE points of the upper-level game is extended from the two-dimensional plane to the three-dimensional space. Meanwhile, the lower-level game can also find the optimal operation mode of multi-stakeholder. The proposed two-level game model can solve the multi-dimensional Nash equilibrium problem.
(4) The two-level game is verified to be effective in the PG&E69-bus distribution system and a real 101-bus system. Through batteries and EV clusters participating in the two-level game model as independent stakeholders, then all stakeholders will operate in the optimal modes to reduce the costs of transaction loss.
Data Availability Statement
The raw data supporting the conclusions of this article will be made available by the authors, without undue reservation.
Author Contributions
WD and PD conceptualized the study. XuH, XiH, and RH performed the analysis. WD wrote the original draft. PD and ML reviewed and edited the article. All authors agreed to be accountable for the content of the work.
Funding
This work was supported in part by the Provincial Natural Science Foundation of Guangdong (No.2021A1515012073) and National Natural Science Foundation of China (No.51107042).
Conflict of Interest
The authors declare that the research was conducted in the absence of any commercial or financial relationships that could be construed as a potential conflict of interest.
Publisher’s Note
All claims expressed in this article are solely those of the authors and do not necessarily represent those of their affiliated organizations, or those of the publisher, the editors and the reviewers. Any product that may be evaluated in this article, or claim that may be made by its manufacturer, is not guaranteed or endorsed by the publisher.
References
Bitaraf, H., and Rahman, S. (2018). Reducing Curtailed Wind Energy through Energy Storage and Demand Response. IEEE Trans. Sustain. Energ. 9 (1), 228–236. doi:10.1109/TSTE.2017.2724546
Fang, X., Wang, J., Yin, C., Han, Y., and Zhao, Q. (2020). “Multiagent Reinforcement Learning with Learning Automata for Microgrid Energy Management and Decision Optimization,” in 2020 Chinese Control And Decision Conference (CCDC), Hefei, China, August 22–24, 2020 (IEEE), 779–784. doi:10.1109/CCDC49329.2020.9164742
Jalali, M., Zare, K., and Seyedi, H. (2017). Strategic Decision-Making of Distribution Network Operator with Multi-Microgrids Considering Demand Response Program. Energy 141, 1059–1071. doi:10.1016/j.energy.2017.09.1410.1016/j.energy.2017.09.145
Jiang, R., Qiu, X., and Li, D. (2014). Multi-agent System Based Dynamic Game Model of Smart Distribution Network Containing Multi-Microgrid. Power Syst. Technol. 38 (12), 3321–3327. doi:10.13335/j.1000-3673.pst.2014.12.008
Li, B., Ma, Z., Hidalgo-Gonzalez, P., Lathem, A., Fedorova, N., He, G., et al. (2021). Modeling the Impact of EVs in the Chinese Power System: Pathways for Implementing Emissions Reduction Commitments in the Power and Transportation Sectors. Energy Policy 149, 111962. doi:10.1016/j.enpol.2020.111962
Li, P., Guan, X., Wu, J., and Wang, D. (2013). An Integrated Energy Exchange Scheduling and Pricing Strategy for Multi-Microgrid System. IEEE Int. Conf. IEEE Region 10, 1–5. TENCON 2013. doi:10.1109/tencon.2013.6718889
Lin, J., Dong, P., Liu, M., Huang, X., and Deng, W. (2020). Research on Demand Response of Electric Vehicle Agents Based on Multi-Layer Machine Learning Algorithm. IEEE Access 8, 224224–224234. doi:10.1109/ACCESS.2020.3042235
Lin, Y., Dong, P., Sun, X., and Liu, M. (2017). Two‐level Game Algorithm for Multi‐microgrid in Electricity Market. IET Renew. Power Generation 11 (14), 1733–1740. doi:10.1049/iet-rpg.2017.0212
Liu, N., Zhao, J., and Wang, J. (2018). A Trading Model of PV Microgrid Cluster Based on Cooperative Game Theory. Trans. China Electrotechnical Soc. 33 (8), 1903–1910. doi:10.19595/j.cnki.1000-6753.tces.151569
Liu, Y., Guo, L., and Wang, C. (2017). Optimal Bidding Strategy for Microgrids in Electricity Distribution Market. Power Syst. Technol. 41 (8), 2469–2476. doi:10.13334/j.0258-8013.pcsee.2014.29.002
Lu, Q., Chen, L., and Mei, S. (2014). Typical Applications and Prospects of Game Theory in Power System. Proc. CSEE 34 (29), 5009–5017. doi:10.13335/j.1000-3673.pst.2018.3004
Moazzami, M., Ghanbari, M., Shahinzadeh, H., Moradi, J., and Gharehpetian, G. B. (2018). “Application of Multi-Objective Grey Wolf Algorithm on Energy Management of Microgrids with Techno-Economic and Environmental Considerations,” in 2018 3rd Conference on Swarm Intelligence and Evolutionary Computation (CSIEC), Bam, Iran, March 6–8, 2018 (IEEE), 1–9. doi:10.1109/CSIEC.2018.8405408
Paterakis, N. G., Erdinc, O., Bakirtzis, A. G., and Catalao, J. P. S. (2015). Optimal Household Appliances Scheduling under Day-Ahead Pricing and Load-Shaping Demand Response Strategies. IEEE Trans. Ind. Inf. 11 (6), 1509–1519. doi:10.1109/TII.2015.2438534
Powell, W. B., and Meisel, S. (2016). Tutorial on Stochastic Optimization in Energy-Part II: An Energy Storage Illustration. IEEE Trans. Power Syst. 31 (2), 1468–1475. doi:10.1109/TPWRS.2015.2424980
Rui, T., Li, G., Wang, Q., Hu, C., Zhang, J., and Ding, J. (2019). Nash Bargaining Method for Multi-Microgrid Energy Trading in Distribution Network. Power Syst. Technol. 43 (07), 2576–2585. doi:10.13335/j.1000-3673.pst.2018.3004
Shen, X., Zhu, S., Zheng, J., Han, Y., Li, Q., and Nong, J. (2015). Active Distribution Network Planning-Operation Co-optimization Considering the Coordination of ESS and DG. Power Syst. Technol. 39 (7), 1913–1920. doi:10.13335/j.1000-3673.pst.2015.07.023
Shi, J., Zhou, W., Zhang, N., Chen, Q., Liu, J., Cao, Z., et al. (2020). Deep Reinforcement Learning Algorithm of Voltage Regulation in Distribution Network with Energy Storage System. Electric Power Construction 41 (3), 71–78. doi:10.3969/j.issn.1000-7229.2020.03.009
Shuai, H., Fang, J., Ai, X., Wen, J., and He, H. (2019). Optimal Real-Time Operation Strategy for Microgrid: An ADP-Based Stochastic Nonlinear Optimization Approach. IEEE Trans. Sustain. Energ. 10 (2), 931–942. doi:10.1109/TSTE.2018.2855039
Wang, J., Qin, J., Zhong, H., Rajagopal, R., Xia, Q., and Kang, C. (2019). Reliability Value of Distributed Solar+Storage Systems amidst Rare Weather Events. IEEE Trans. Smart Grid 10, 4476–4486. doi:10.1109/TSG.2018.2861227
Wang, J., Zhong, H., Tang, W., Rajagopal, R., Xia, Q., Kang, C., et al. (2017). Optimal Bidding Strategy for Microgrids in Joint Energy and Ancillary Service Markets Considering Flexible Ramping Products. Appl. Energ. 205, 294–303. doi:10.1016/j.apenergy.2017.07.047
Wang, Y., Ma, X., Wan, Y., Hou, X., Zheng, K., and Chen, W. (2019). Sequential Charge-Discharge Guidance Strategy for Electric Vehicles Based on Time-Sharing Charging-Discharging Margin. Power Syst. Technol. 12 (43), 4353–4361. doi:10.13335/j.1000-3673.pst.2019.0716
Wang, Y., Ma, X., Wan, Y., Hou, X., Zheng, K., and Chen, W. (2019). Sequential Charge-Discharge Guidance Strategy for Electric Vehicles Based on Time-Sharing Charging-Discharging Margin. Power Syst. Technol. 12 (43), 4353–4361. doi:10.13335/j.1000-3673.pst.2019.0716
Wang, Y., Saad, W., Han, Z., Poor, H. V., and Basar, T. (2014). A Game-Theoretic Approach to Energy Trading in the Smart Grid. IEEE Trans. Smart Grid 5, 1439–1450. doi:10.1109/TSG.2013.2284664
Wu, X., Wang, X., Lee, W. P., and Won, D. J. (2011). Optimal Management of Microgrid Using Particle Swarm Optimization Algorithm. J. Electr. Eng. Techn. 12 (4), 1329–1339. doi:10.1109/iceceng.2011.6058021
Zhang, H., Hu, Z., Xu, Z., and Song, Y. (2017). Evaluation of Achievable Vehicle-To-Grid Capacity Using Aggregate PEV Model. IEEE Trans. Power Syst. 32 (1), 784–794. doi:10.1109/TPWRS.2016.2561296
Keywords: Markov decision process, multi-stakeholder, two-level game, three-dimensional Nash equilibrium solution, Markov desicion processes, prediction power of battery
Citation: Deng W, Dong P, Liu M, Huang X, He X and He R (2021) Research on Game Operation of Multi-Stakeholder in Distribution Network in Electricity Market. Front. Energy Res. 9:744391. doi: 10.3389/fenrg.2021.744391
Received: 20 July 2021; Accepted: 17 August 2021;
Published: 06 September 2021.
Edited by:
Bin Zhou, Hunan University, ChinaReviewed by:
Minghao Wang, Hong Kong Polytechnic University, Hong Kong, SAR ChinaMiao Zhang, Guangdong University of Technology, China
Yanbo Che, Tianjin University, China
Copyright © 2021 Deng, Dong, Liu, Huang, He and He. This is an open-access article distributed under the terms of the Creative Commons Attribution License (CC BY). The use, distribution or reproduction in other forums is permitted, provided the original author(s) and the copyright owner(s) are credited and that the original publication in this journal is cited, in accordance with accepted academic practice. No use, distribution or reproduction is permitted which does not comply with these terms.
*Correspondence: Ping Dong, ZXBkcGluZ0BzY3V0LmVkdS5jbg==