 Feng Cai1,2
 Lingling Yang
 Farhad Taghizadeh-Hesary
- 1State Key Laboratory of Mining Response and Disaster Prevention and Control in Deep Coal Mines, Anhui University of Science and Technology, Huainan, China
- 2School of Safety Science and Engineering, Anhui University of Science and Technology, Huainan, China
- 3Department of Biotechnology, Hefei Technology College, Hefei, China
- 4School of Economics and Management, Huainan Normal University, Huainan, China
- 5Faculty of International Studies, Tokai University, Hiratsuka-shi, Japan
Coal quality rating can help reduce greenhouse gas emissions, solving the global warming problem. It becomes more important as the carbon neutrality by the mid-21st century agreement is accepted by 195 countries, including China. In this paper, an improved fuzzy comprehensive evaluation method is introduced for coal quality rating. The data used in this work are of the Hostolgoi coalfield of the Xinjiang Province of China. Six industrial analysis indicators are determined as evaluation factors by taking the coal samples of different coal seam depths in the mining area. The super-standard multiple methods and the double-weight super-standard weighting method are combined to form a comprehensive weight. The results show that most of the coal samples of this coal mine are at grades I–II, and the overall coal is with good-quality stability. The evaluation results can improve the coal utilization efficiency and provide scientific guidance for evaluating and exploiting coal resources in coal geological exploration.
1 Introduction
Climate change has a severe impact on different countries and regions. Extreme weather like heavy rains and floods is becoming more and more frequent in the entire world. The Paris Agreement on climate change is committed to limiting global warming. The goal of its 195 member states is to achieve a climate-neutral world by the middle of the 21st century. Unfortunately, the COVID-19 pandemic slowed the effort as the new investments in green projects reduced drastically. We need to find some new model for green recovery in the post-pandemic, including investment in low-emission projects, clean energy production, and so on (see United Nations Framework Convention on Climate Change (UNFCCC), 2021).
Coal quality rating can help reduce greenhouse gas (GHG) emissions and alleviate the global warming problem. It is a method to comprehensively evaluate the grade of coal samples by establishing a proper mathematical model based on coal quality indexes. In order to make full and reasonable use of coal resources, the coal quality for a particular purpose can be graded and evaluated according to the relevant national or industrial standards. The quality grade evaluation of coal resources in coal geological exploration can also be used for conducting mine construction, mining, processing, and utilization. Therefore, the coal evaluation provides the basis for the rational layout of the national industry and the full and rational utilization of relevant industries.
The coal evaluation is based on the coal quality data in the geological exploration data of coal resources and the mathematical model established according to the current coal quality index value. The actual quality of coal is an overall evaluation consisting of several coal quality indicators. For coal quality evaluation, however, it is common that experts are just considering the coal quality evaluation standard table, which is often far from each other. Therefore, it is necessary to build a suitable mathematical model to integrate these indicators (e.g., Mesroghli et al., 2009; Guo and Meng, 2019). In this paper, we establish an improved fuzzy comprehensive evaluation for coal quality rating. The results show that most of the coal samples of the selected coal mine are at grades I–II, and the overall coal is with good-quality stability. The evaluation results can improve the coal utilization efficiency and provide scientific guidance for evaluating and exploiting coal resources in coal geological exploration.
2 Literature Review
Our present work is related to two streams of literature, 1) coal quality rating and 2) quality evaluation method.
In the coal quality evaluation literature, Guo and Meng (2019) established a coal evaluation model to investigate the coal quality in the Xinjiang Hostolgoi coalfield using a fuzzy neural network. This method combines the fuzzy mathematical theory with the neural network structure, takes the output value of the model as the intermediate result, and determines the coal quality level by combining the membership function. This evaluation has specific requirements for the number of training samples. Li (2016) also studied the coal features in the Xinjiang Hostolgoi coalfield but focused on the coal-bearing features and coal seam correlation. Zhang et al. (2021) used a modified fluorescence alteration of multiple macerals (FAMM) method to evaluate the coking coal quality. Their results showed that the modified FAMM evaluation technique is an essential complement to the existing evaluation criteria. By a case study from India, Singh et al. (2007) investigated the impact of inertinite macerals in determining the coke quality by studying some kinds of macerals of the inertinite group. Sabar et al. (2020) found the possibility of promoting the quantity and quality of humic acids extracted from low-rank coal through mixing the chemical and fungal treatments. Unlike Zhang et al. (2021), Singh et al. (2007), and Sabar et al. (2020), our work focuses on the coal quality evaluation problems and the coal samples that come from Xinjiang, China. This paper also studies the coal characteristic of the Xinjiang coalfield but is different from Li (2016), Guo and Meng (2019), and Wu et al. (2021). Specifically, our paper establishes a coal quality evaluation model using an improved fuzzy comprehensive evaluation, which combines the super-standard multiple methods and the double-weight super-standard weighting method. Hence, from this aspect, it has novelty and contributes to the literature.
In the stream of the quality evaluation method, the commonly used mathematical methods include the artificial neural network method (Mesroghli et al., 2009), comprehensive pollution index method, gray clustering method (Rui et al., 2010), fuzzy comprehensive evaluation method (Chen et al., 2015; Wang et al., 2021; Xu et al., 2021), and analytic hierarchy process (AHP) method (Forman and Gass, 2001). Among these, the fuzzy comprehensive evaluation method is a comprehensive evaluation method based on fuzzy mathematics proposed by Lotfi Zadeh in 1965. Since then, as an evaluation method that organically combines qualitative and quantitative analyses, the fuzzy comprehensive evaluation method has been fully developed. Its accuracy is significantly higher than other evaluation methods in the quality evaluation system. For example, Rui et al. (2010) took the soil of Sanmenxia City in Henan Province as the research object, considering five factors affecting tobacco growth, to evaluate suitability using a gray clustering method. Aiming at the correlation between the building technology and economic effect, Sheng et al. (2021) proposed an evaluation system of green-building energy-saving technology and the economic effect by combining the -AHP and entropy weight method. Wei et al. (2014) evaluated the coal resources in three exploration areas of Shanxi Province. In their paper, according to the new standards and norms, the coal quality evaluation index system and evaluation index division scheme are determined for coking coal, thermal coal, and chemical anthracite coal. In their study, the weight of each index is determined by the method of the combination of the maximization of deviation and expert scoring, and the coal-resource quality-grade evaluation model is established based on the gray correlation analysis. Yan et al. (2014) used AHP and entropy weight methods to evaluate water resources’ carrying capacity comprehensively. Their results show that the overall level of the water resource-carrying capacity of Puhe River is at the critical status between overload and suitable load; the improving space is limited. Many works of literature simply used super-standard multiple methods when calculating the weight of various evaluation factors (see Zheng et al., 2019; Simpson et al., 2019; Deluz et al., 2020; Sheng et al., 2021, for example). Such fuzzy comprehensive evaluation only considers the concentration of coal resource quality analysis index but ignores the overbid index of the influence of the quality analysis index on coal quality. Meanwhile, this method of calculating weight is highly subjective.
Our study takes a mining area in Xinjiang Hostolgoi coalfield as the experimental research area and takes thermal coal as an example. According to the classification of thermal coal grades and parameter values, the study develops an improved fuzzy comprehensive evaluation method—the combination of the super-standard multiple methods and the double-weight super-standard weighting method—to calculate, and comprehensively analyze the coal quality, according to the coal of different depths.
The rest of this paper is categorized as follows: Section 2 explains the improved fuzzy comprehensive evaluation method. Section 3 presents the case study, and Section 4 concludes the paper.
3 Improved Fuzzy Comprehensive Evaluation Method
In this section, we first give the evaluation criteria and then establish the improved fuzzy comprehensive evaluation method. Finally, the coal quality rating results can be obtained by the principle of maximum membership degree. The framework of this improved fuzzy comprehensive evaluation method is shown as follows (Figure 1).
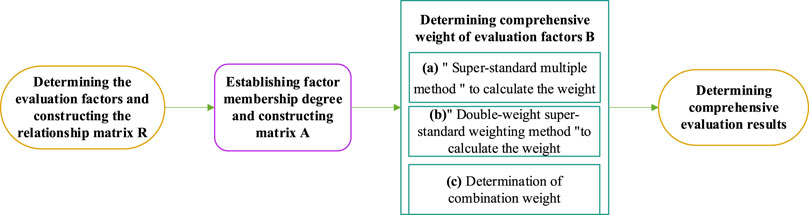
FIGURE 1. The framework of evaluation method.
In order to facilitate the comprehension, we list the key notations used in this context as following Table 1.
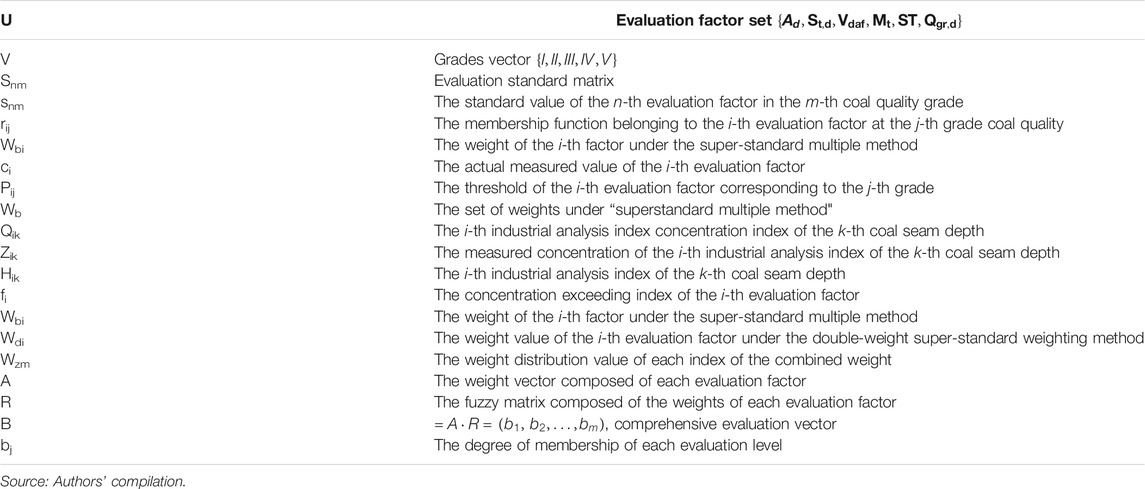
TABLE 1. Notation table.
3.1 Evaluation Criteria
This paper takes thermal coal (Cui and Wei, 2017; Schweinfurth, 2009) as the research coal type. It establishes an evaluation model based on “Coal Quality Classification” (GB/T15224-2018), “Coal Test Manual”, “Quality Standards for Coal for Power Generation Pulverized Coal Boiler” (GB7562-2018), and so on. According to national and industry standards, the thermal coal standard is divided into five grades, which mainly select six common industrial analysis indicators: ash, sulfur, volatiles, total moisture, ash melting temperature, and calorific value (see Table 2).
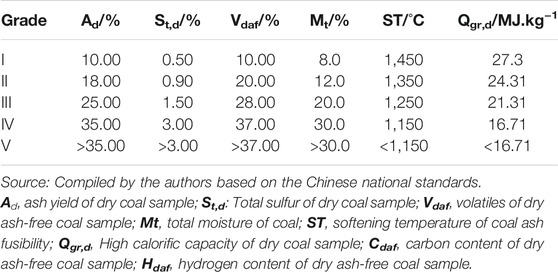
TABLE 2. Standard limits of basic items for thermal coal classification quality standards.
3.2 Building the Model
In this subsection, we introduce an improved fuzzy comprehensive evaluation for coal quality evaluation. The traditional fuzzy comprehensive evaluation models usually use super-standard multiple methods to calculate the weight. The shortcoming is that it only considers the situation where the concentration of the coal sample industrial analysis index exceeds the standard but does not consider the impact of the industrial analysis index itself on the pollution index. Compared with the traditional methods, our improved fuzzy comprehensive evaluation combines the “super-standard multiple method” and the “double-weight super-standard weighting method” to determine the comprehensive weight of each evaluation factor, which can shorten the membership gap of each evaluation grade, reduce the subjective influence, and overcome the shortcoming of the single weight method, which is too heavy on a certain index.
3.2.1 Determining the Evaluation Factors and Constructing the Relationship Matrix
We construct the evaluation factor set
According to Table 2, formulate the corresponding evaluation set
where
3.2.2 Establishing Factor Membership Degree and Constructing Matrix
Taking the corresponding value of each grade in Table 2 as the inflection point of each membership degree function, the membership function belonging to the first-grade coal quality is constructed as follows (Hou et al., 2018):
The smaller the function value, the less close the membership relationship, and the larger the function value, the closer the relationship. Establishing the membership function, and evaluating the relationship between the evaluation level and the factor attribute, the matrix R is obtained as follows:
3.2.3 Determining Comprehensive Weight of Evaluation Factors
In this paper, we use the principle of minimum relative information entropy to combine the “super-standard multiple method” and the “double-weight super-standard weighting method” to determine the comprehensive weight of each evaluation factor.
(A) “Super-standard multiple method” to calculate the weight
Let
In the formula, Wbi is the weight of the i-th factor under the “super-standard multiple method”; ci is the actual measured value of the i-th evaluation factor; Pij is the threshold of the i-th evaluation factor corresponding to the j-th grade; Pi is the average value of the i-th evaluation factor corresponding to the coal quality classification standard threshold (i = 1, 2, 3, … n).
(B) “Double-weight super-standard weighting method” to calculate the weight
① Confirmation of industrial analysis index concentration exceeding the standard index
When i = 1, 2, 3, 4,
When i = 5, 6,
In the formula, Qik is the i-th industrial analysis index concentration index of the k-th coal seam depth; Zik is the measured concentration of the i-th industrial analysis index of the k-th coal seam depth; Hik is the i-th industrial analysis index of the k-th coal seam depth. The standard limit of coal quality target, the quality classification target of the mine area, is grade III.
Generally, when Qik >0, the concentration of industrial analysis indicators exceeds the standard state; when Qik is between −0.2 and 0, the concentration of industrial analysis indicators is close to exceeding the standard state; when Qik ≤0.2, the concentration of industrial analysis index is not exceeding the standard state.
② Weight of factor evaluation
In the above formulas,
(C) Determination of Combination weight (Sun et al., 2016)
The combination weight is obtained by the above method, and its calculation formula is
In the above formula, Wzm is the weight distribution value of each index of the combined weight, where m = 1,2, … ,n.
Calculate the comprehensive weight of each evaluation factor from the measured value of each single evaluation factor and the evaluation standard; the calculation formula is
3.2.4 Determining Comprehensive Evaluation Results
The result of fuzzy comprehensive evaluation is to use the evaluation factor fuzzy matrix R and the comprehensive weight vector for a comprehensive evaluation, and then use the fuzzy operator to weigh each evaluation sample’s evaluation factors.
In the formula, bj is the degree of membership of each evaluation level, j = 1, … m; R is the fuzzy matrix composed of the weights of each evaluation factor; A is the weight vector composed of each evaluation factor.
Finally, according to the principle of maximum membership degree, which level of affiliation is the largest is determined as the final judgment grade result and is determined according to the principle of maximum affiliation. That is, if
4 Case Study
4.1 Data Source
According to the three major coal-bearing zones in the region, Xinjiang’s coal resources are forecast to have 2.19 trillion tons of prospective resources, which can be divided into 12 coalfields and 53 coal-producing areas. The coalfields with large resources and sound development and utilization conditions are mainly Zhundong, Zhunan, Tuha, Yili, Hostolgoi, and Kubai coalfields, which account for 95% of the total coal resources in Xinjiang. The Hostolgoi coalfield belongs to young bituminous coal, mainly long-flame coal and partly non-stick coal. It has the characteristics of oil-rich oil and a medium-to-high calorific value. It has good industrial power, civil coal, and gasification coal. This study used the data collected from a mining area in Xinjiang Hostolgoi coalfields (Date source: Guo and Meng, 2019), with 24 samples of different coal seam depths; see Table 3 and Figures 2–4 for more details.
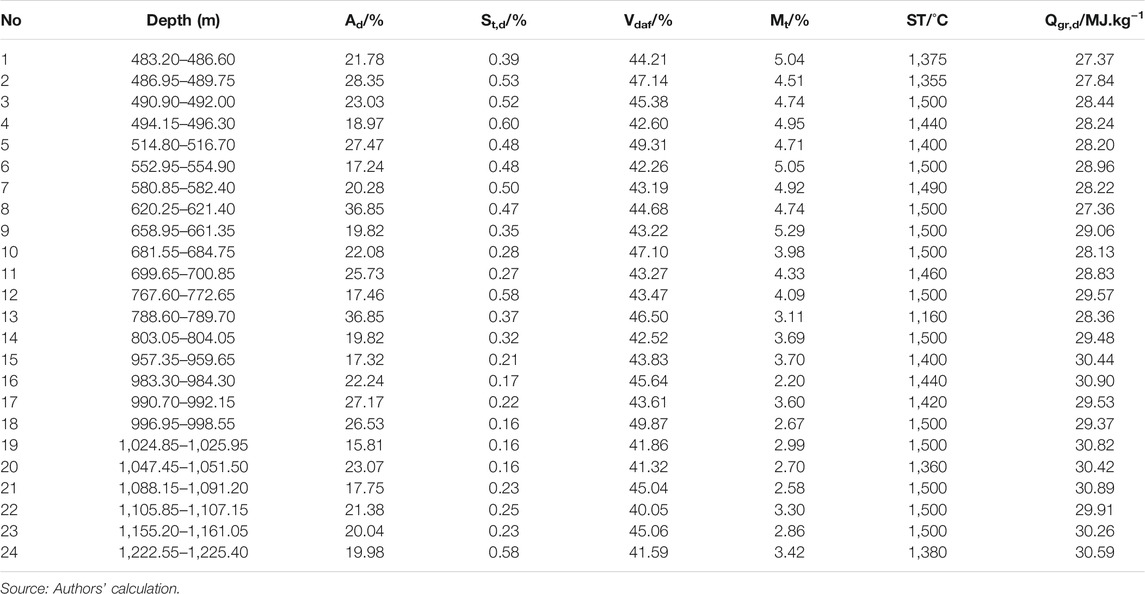
TABLE 3. Industrial coal analysis results of a ZK1005 borehole in a coal mine. Source of data: Guo and Meng (2019).
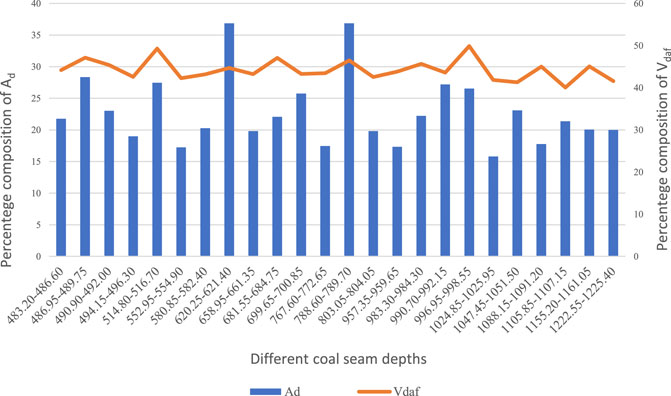
FIGURE 2. Percentage composition of Ad and Vdaf.
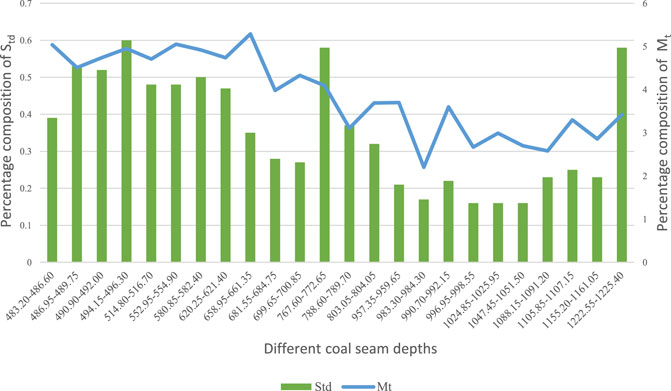
FIGURE 3. Percentage composition of Std and Mt.
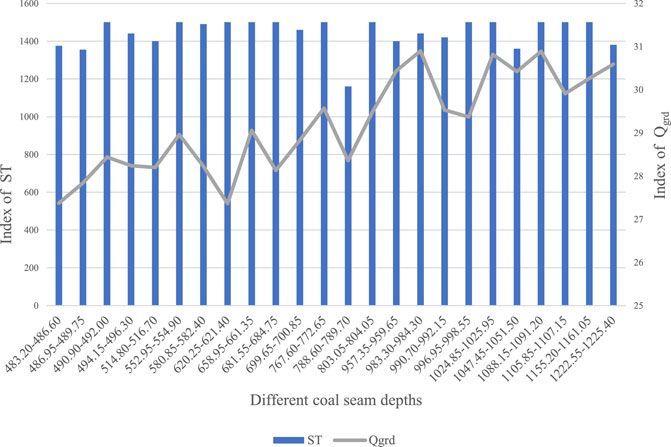
FIGURE 4. Index of ST and Qgr,d.
Note that, according to the semi-empirical formula of high calorific value derived by using the results of elemental analysis and the conversion coefficient of different base components of coal quality analysis results (Rui et al., 2010), the following conclusions can be obtained (Chen, 1981):
where the Qgr,d of the ore area was calculated by the elemental analysis data of the above samples.
4.2 Determination of the Relationship Matrix
Taking the no. 1 (see Table 3) monitoring point of the borehole as an example, the fuzzy relation matrix R is calculated according to formulas Eqs 1–4,
According to formulas Eqs 4–13, the weight values determined by different methods for 24 borehole sampling points are calculated, which are shown in Figures 5–7.
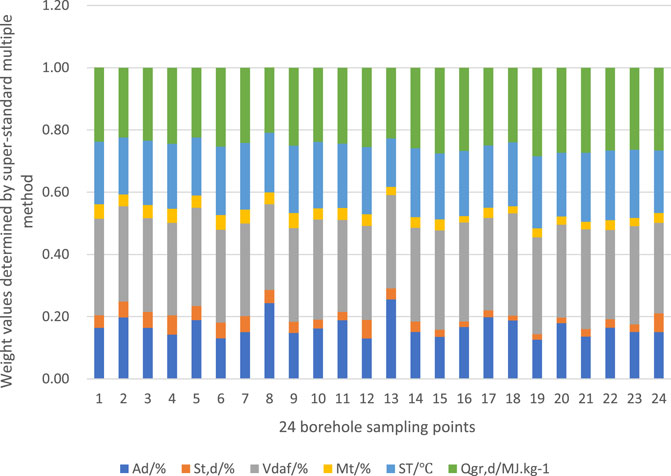
FIGURE 5. Weight values determined by super-standard multiple method.
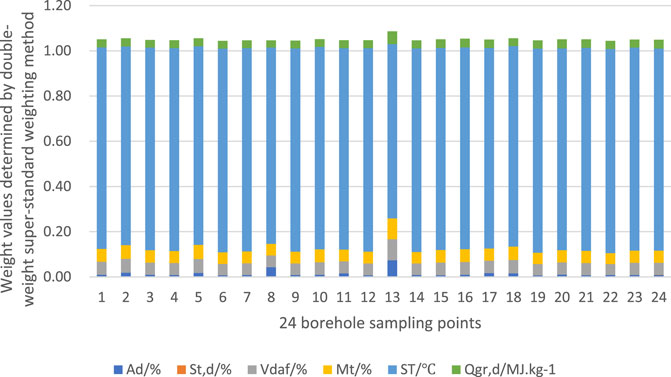
FIGURE 6. Weight values determined by double-weight super-standard weighting method.
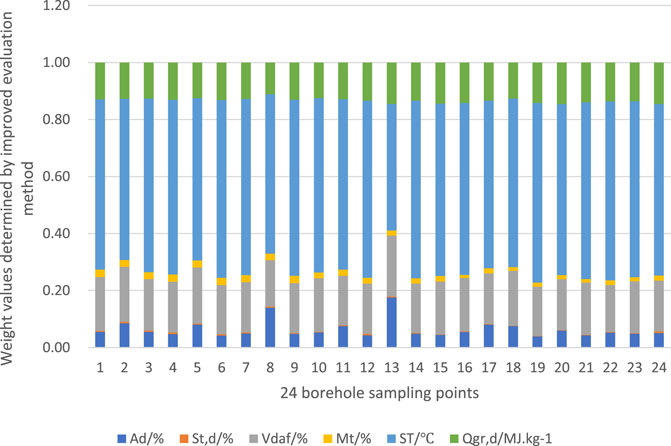
FIGURE 7. Weight values determined by the improved evaluation method.
4.3 Comparative Analysis of Models and Optimal Selection
In order to verify the accuracy and objectivity of the improved fuzzy comprehensive evaluation in the coal quality rating evaluation, this paper combines the super-standard multiple method and double-weighted super-standard weighting method. This subsection makes the comparative analysis of the evaluation results of the combined weight fuzzy comprehensive evaluation method through calculating according to the fuzzy comprehensive evaluation model [refer to formulas Eqs 14, 15], and substituting the matrix and weight vector of the monitoring points into the calculation to obtain the evaluation vector and evaluation level of 24 borehole sampling points under the methods (see Figures 8–10).

FIGURE 8. The evaluation results of the super-standard multiple method.
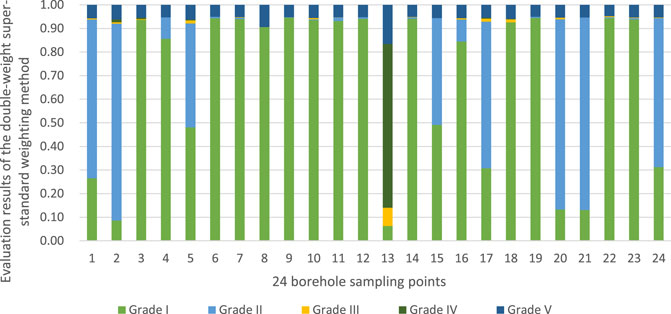
FIGURE 9. The evaluation results of the double-weight super-standard weighting method.
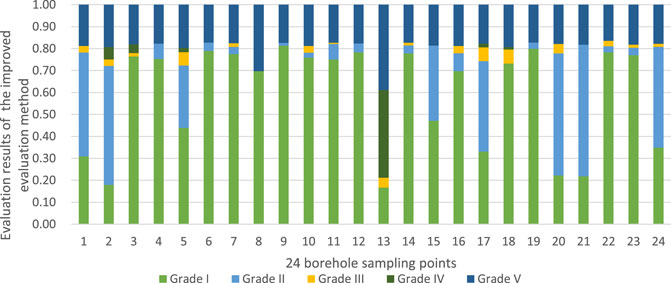
FIGURE 10. The evaluation results of the improved evaluation method.
From Figures 8–10, it can be found that
1) All of the coal samples of this coal mine are grade I to II except sample 13;
2) The sample 13 coal quality grades obtained by the three methods are all between grade IV and grade V;
3) Samples 3–12 (depth: 490.90–772.65) have good coal quality stability;
4) The results of the fuzzy comprehensive evaluation under these three weighting methods are not much different. However, there are some differences in the membership degree corresponding to each coal sample coal quality level. It is shown that the combined weight fuzzy comprehensive evaluation model is superior to the other two models.
From the perspective of grade I membership, the double-weighted super-standard weighting model is higher than the improved fuzzy comprehensive evaluation model and super-standard multiple models. The improved fuzzy comprehensive evaluation model is located between the two.
Judging from the evaluation results of 24 samples, there is no grade II coal quality for the evaluation using the super-standard multiple methods. In contrast, for the coal quality evaluation obtained by the double-weighted super-standard weighting method, the grade II coal quality accounts for 25%, which is in sharp contrast. Due to the different emphasis of the two evaluation methods, there are apparent differences in the evaluation methods, resulting in significant differences in the evaluation results.
Guo and Meng (2019) established a coal evaluation model to investigate the coal quality in the Xinjiang Hostolgoi coalfield; however, their method is based on a fuzzy neural network. Our methods are slightly more sensitive, and the present results coincide with Guo and Meng (2019) except for one sample. The results of Guo and Meng (2019) show that the coal quality rates of the coal samples in the mine are all between grade II and III, while our present results show that most of the samples are between grade I and II. Specifically, sample 13 is grade III in Guo and Meng (2019), between grade IV and grade V from our three evaluation results. The main reason is that their method is not sensitive enough. At the same time, our evaluation mechanism can well capture the coal characteristics in different depths and overcome the shortcomings of the single weight method.
5 Conclusion and Policy Recommendation
This paper applies an improved fuzzy comprehensive evaluation to build an optimal coal quality evaluation and rating model. Compared with the super-standard multiple methods and the double-weighted super-standard weighting method, the improved fuzzy comprehensive evaluation can shorten the membership gap of each evaluation grade, reduce the subjective influence, and overcome the shortcomings of the single weight method, which is too heavy on a certain index. When calculating the weights of evaluation factors, the use of this improved fuzzy comprehensive evaluation method inherits the advantages of the traditional fuzzy comprehensive evaluation model. It overcomes the shortages of the double-weighted super-standard weighting model. It highlights the impact of the industrial analysis index itself, ignoring the relationship between various factors. At the same time, it also avoids the super-standard multiple fuzzy comprehensive evaluation model to highlight the shortcomings of industrial analysis index concentration.
Through a case study of Hostolgoi coalfield in Xinjiang, of the 24 sampling points in the mining area, 17 sampling points are grade I, 6 sampling points are grade II, and only 1 sampling point is grade IV. From a practical point of view, as a young coal mine, the overall quality of coal is better and is a high-quality power coal mine. This case recommends that the competent authorities should supervise the coal mining enterprises to classify coal more accurately through different evaluation methods, including the fuzzy comprehensive evaluation model. Therefore, the improved fuzzy comprehensive evaluation results are more in line with the real situation, and the evaluation of coal quality has a specific scientific and feasibility. It can reflect the state of coal quality under the joint action of multiple factors and guide the mining, processing, and utilization of coal resources in the process of coal geological exploration.
Under the combined impact of the global COVID-19 pandemic and the targets of energy conservation and emission reduction, on the one hand, the economic trend continues to decline, and on the other hand, the price of coal continues to rise; the traditional way of coal use is not conducive to economic development, so the graded use of coal becomes more and more critical. The improved fuzzy comprehensive evaluation proposed in this paper can help countries assess the quality of coal more objectively and scientifically. This will help countries use coal more efficiently and then reduce the GHG emissions in line with the sustainable development goals (Lu et al., 2019; 2020a; 2020b; 2021a; 2021b; 2021c; Yoshino et al., 2021).
Practically, it is necessary to further increase the evaluation model accuracy, which cannot be decoupled for the improved fuzzy comprehensive evaluation method. Therefore, coal’s heavy metal element content in the mining area will be further studied in future research. The coupling and mutual proof with industrial analysis indexes will be carried out to further illustrate the feasibility of the evaluation model.
Data Availability Statement
The original contributions presented in the study are included in the article/supplementary material, further inquiries can be directed to the corresponding authors.
Author Contributions
Conceptualization, FC; Data curation, LY; Formal analysis, FC and LY; Investigation, FT-H; Methodology, FC; Project administration, YY; Software, FC; Validation, FT-H; Writing - original draft, FC, LY and YY; Writing - review and editing, YY and FT-H.
Funding
This paper is supported by University Key Project of Natural Science Foundation of Anhui Province (No. KJ2021A1389); Program of Hefei Technology College (No. 2021KJB16); the Collaborative Innovation Project of Universities in Anhui Province (No. GXXT-2020-057); Key Project of Natural Science Foundation of Higher Education in Anhui Province (Research on the modification of coal surfactant and its biodegradation, Foundation of Anhui Educational Committee, 2022); Key Project of University Humanities and Social Science in Anhui Province (No.SK2019A0102); Program for State Key Laboratory of Mining Response and Disaster Prevention and Control in Deep Coal Mines (No. SKLMRDPC20ZZ02); Program for Innovative Research Team of Huainan Normal University (No. XJTD202001); and the Grant-in-Aid for Excellent Young Researcher of the Ministry of Education of Japan (MEXT).
Conflict of Interest
The authors declare that the research was conducted in the absence of any commercial or financial relationships that could be construed as a potential conflict of interest.
Publisher’s Note
All claims expressed in this article are solely those of the authors and do not necessarily represent those of their affiliated organizations, or those of the publisher, the editors, and the reviewers. Any product that may be evaluated in this article, or claim that may be made by its manufacturer, is not guaranteed or endorsed by the publisher.
References
Chen, W. (1981). Calculation of the Coal Calorific Value in China by Industrial Analysis and Elemental Analysis. Coal Conversion 1981 (S1), 60–70. (in Chinese).
Chen, J.-F., Hsieh, H.-N., and Do, Q. H. (2015). Evaluating Teaching Performance Based on Fuzzy AHP and Comprehensive Evaluation Approach. Appl. Soft Comput. 28, 100–108. doi:10.1016/j.asoc.2014.11.050
Cui, H., and Wei, P. (2017). Analysis of thermal Coal Pricing and the Coal price Distortion in China from the Perspective of Market Forces. Energy Policy 106, 148–154. doi:10.1016/j.enpol.2017.03.049
Deluz, C., Nussbaum, M., Sauzet, O., Gondret, K., and Boivin, P. (2020). Evaluation of the Potential for Soil Organic Carbon Content Monitoring with Farmers. Front. Environ. Sci. 8, 113. doi:10.3389/fenvs.2020.00113
Forman, E. H., and Gass, S. I. (2001). The Analytic Hierarchy Process-An Exposition. Operations Res. 49 (4), 469–486. doi:10.1287/opre.49.4.469.11231
Guo, F., and Meng, Y. (2018). Research of Evaluation on Coal Quality Based on Fuzzy Neural Network. Mathematics in Practice and Theory 49 (7), 1–8. (in Chinese). doi:10.3969/j.issn.2095-3771.2012.02.025
Hou, Y., Zhou, Z., Wang, L., Zhang, S., and Feng, Q. (2018). Improved Fuzzy Comprehensive Evaluation Method-Based Study on Water Quality Evaluation in Karst Mountain Area. Water Resour. Hydropower Eng. 49 (7), 129–135. (in Chinese). doi:10.13928/j.cnki.wrahe.2018.07.017
Li, H. (2016). Coal-bearing Features and Coal Seams Correlation in Shajihai No.3 Minefield, Hostolgoi Coalfield, Xinjiang. Coal Geology. China 28 (6), 14–17. doi:10.3969/j.issn.1674-1803.2016.06.03
Lu, S., Bai, X., Li, W., and Wang, N. (2019). Impacts of Climate Change on Water Resources and Grain Production. Technol. Forecast. Soc. Change 143, 76–84. doi:10.1016/j.techfore.2019.01.015
Lu, S. B., Zhang, X., and Tang, Y. (2020a). Evolutionary Analysis on Structural Characteristics of Water Resource System in Basins of Northern China. Sustain. Develop. 28, 800–812. doi:10.1002/sd.2031
Lu, S., Li, J., Xiao, B., and Guo, M. (2020b). Analysis of Standard Accounting Method of Economic Compensation for Ecological Pollution in Watershed. Sci. Total Environ. 737, 138157. doi:10.1016/j.scitotenv.2020.138157
Lu, S., Lian, Z., Sun, H., Wu, X., Bai, X., and Wang, C. (2021a). Simulating Trans-boundary Watershed Water Resources Conflict. Resour. Pol. 73, 102139. doi:10.1016/j.resourpol.2021.102139
Lu, S., Lu, W., Shao, W., Xue, Y., and Taghizadeh-Hesary, F. (2021b). The Transboundary Ecological Compensation Construction Based on Pollution Rights: Ways to Keep the Natural Resources Sustained. Resour. Pol. 74, 102401. doi:10.1016/j.resourpol.2021.102401
Lu, S., Zhang, X., Peng, H., Skitmore, M., Bai, X., and Zheng, Z. (2021c). The Energy-Food-Water Nexus: Water Footprint of Henan-Hubei-Hunan in China. Renew. Sustain. Energ. Rev. 135, 110417. doi:10.1016/j.rser.2020.110417
Mesroghli, S., Jorjani, E., and Chelgani, S. (2009). Estimation of Gross Calorific Value Based on Coal Analysis Using Regression and Artificial Neural Networks. Int. J. Coal Geology. 79 (1-2), 49–54. doi:10.1016/j.coal.2009.04.002
Rui, G., Hong-bo, Q., Hui, Z., Yong-shi, S., and Chen-Yanchun, (2010. “Soil Suitability Evaluation for Tobacco Based on Grey Cluster Analysis,” in Computer and Computing Technologies in Agriculture III. CCTA 2009. IFIP Advances in Information and Communication Technology. Editors D. Li, and C. Zhao (Berlin, Heidelberg: Springer). Vol. 317. doi:10.1007/978-3-642-12220-0_77
Sabar, M. A., Ali, M. I., Fatima, N., Malik, A. Y., Jamal, A., Liaquat, R., et al. (2020). Evaluation of Humic Acids Produced from Pakistani Subbituminous Coal by Chemical and Fungal Treatments. Fuel 278, 118301. doi:10.1016/j.fuel.2020.118301
Schweinfurth, S. P. (2009). “An Introduction to Coal Quality,” in The National Coal Resource Assessment Overview. Editors B. S. Pierce, and K. O. Dennen. Reston, VA: US Geological Survey Professional Paper.
Sheng, X., Lu, H., and Du, F. (2021). Economic Benefit Evaluation System of green Building Energy Saving Building Technology Based on Entropy Weight Method. Front. Energ. Res. 9, 212. doi:10.3389/fenrg.2021.622237
Simpson, G. B., Badenhorst, J., Jewitt, G. P. W., Berchner, M., and Davies, E. (2019). Competition for Land: the Water-Energy-Food Nexus and Coal Mining in Mpumalanga Province, South Africa. Front. Environ. Sci. 7, 86. doi:10.3389/fenvs.2019.00086
Singh, A., Singh, M., Sharma, M., and Srivastava, S. (2007). Microstructures and Microtextures of Natural Cokes: a Case Study of Heat-Affected Coking Coals from the Jharia coalfield, India. Int. J. Coal Geology. 71 (2-3), 153–175. doi:10.1016/j.coal.2006.08.006
Sun, X., Zhou, Z., Huang, Z., Chen, S., and Zhang, S. (2016). An Optimized Fuzzy Comprehensive Evaluation Model for Assessment of Soil Heavy Metal Contamination in tea Production parks of Karst Mountainous Regions. Carsologica Sinica 35 (3), 282–290. (in Chinese).
United Nations Framework Convention on Climate Change (UNFCCC) (2021). United Nations Climate Change Annual Report 2020. Avaialable at: https://unfccc.int/sites/default/files/resource/UNFCCC_Annual_Report_2020.pdf.
Wang, G., Xiao, C., Qi, Z., Meng, F., and Liang, X. (2021). Development Tendency Analysis for the Water Resource Carrying Capacity Based on System Dynamics Model and the Improved Fuzzy Comprehensive Evaluation Method in the Changchun City, China. Ecol. Indicators 122, 107232. doi:10.1016/j.ecolind.2020.107232
Wei, Y., Cao, D., Wang, T., Li, Y., Zhang, A., and Huang, C. (2014). High Quality Grade Evaluation Method of Coal Resources. Coal Engineering 46 (1), 125–128. ((in Chinese)). doi:10.11799/ce201401039
Wu, Z., Pan, P., Chen, J., Liu, X., Miao, S., and Yu, P. (2021). Mechanism of Rock Bursts Induced by the Synthetic Action of "roof Bending and Rock Pillar Prying" in Subvertical Extra-thick Coal Seams. Front. Earth Sci. 1102. doi:10.3389/feart.2021.737995
Xu, X., Nie, C., Jin, X., Li, Z., Zhu, H., Xu, H., et al. (2021). A Comprehensive Yield Evaluation Indicator Based on an Improved Fuzzy Comprehensive Evaluation Method and Hyperspectral Data. Field Crops Res. 270, 108204. doi:10.1016/j.fcr.2021.108204
Yoshino, N., Taghizadeh-Hesary, F., and Otsuka, M. (2021). Covid-19 and Optimal Portfolio Selection for Investment in Sustainable Development Goals. Finance Res. Lett. 38, 101695. doi:10.1016/j.frl.2020.101695
Keywords: improved fuzzy comprehensive evaluation, comprehensive weight, coal quality evaluation, coal, China, Xinjiang
Citation: Cai F, Yang L, Yuan Y and Taghizadeh-Hesary F (2022) The Application of an Improved Fuzzy Comprehensive Evaluation in Coal Quality Rating: The Case Study of China. Front. Energy Res. 9:752472. doi: 10.3389/fenrg.2021.752472
Received: 03 August 2021; Accepted: 10 December 2021;
Published: 13 January 2022.
Edited by:
Joni Jupesta, Research Institute of Innovative Technology for the Earth, JapanReviewed by:
Baiquan Lin, China University of Mining and Technology, ChinaMuhammad Abubakr Naeem, Massey University Business School, New Zealand
Ehsan Rasoulinezhad, University of Tehran, Iran
Copyright © 2022 Cai, Yang, Yuan and Taghizadeh-Hesary. This is an open-access article distributed under the terms of the Creative Commons Attribution License (CC BY). The use, distribution or reproduction in other forums is permitted, provided the original author(s) and the copyright owner(s) are credited and that the original publication in this journal is cited, in accordance with accepted academic practice. No use, distribution or reproduction is permitted which does not comply with these terms.
*Correspondence: Lingling Yang, eWxsQGh0Yy5lZHUuY24=; Farhad Taghizadeh-Hesary, ZmFyaGFkQHRzYy51LXRva2FpLmFjLmpw