 Bingbing Xia1
 Qiyue Huang
- 1Ningbo Polytechnic, Ningbo, China
- 2Xi’an Jiaotong University, School of Electrical Engineering, Xi’an, China
Wind energy has been connected to the power system on a large scale with the advantage of little pollution and large reserves. While ramping events under the influence of extreme weather will cause damage to the safe and stable operation of power system. It is significant to promote the consumption of renewable energy by improving the power prediction accuracy of ramping events. This paper presents a wind power prediction model of ramping events based on classified spatiotemporal network. Firstly, the spinning door algorithm builds parallelograms to identify ramping events from historical data. Due to the rarity of ramping events, the serious shortage of samples restricts the accuracy of the prediction model. By using generative adversarial network for training, simulated ramping data are generated to expand the database. After obtaining sufficient data, classification and type prediction of ramping events are carried out, and the type probability is calculated. Combined with the probability weight, the spatiotemporal neural network considering numerical weather prediction data is used to realize power prediction. Finally, the effectiveness of the model is verified by the actual measurement data of a wind farm in Northeast China.
1 Introduction
As one of the renewable sources of energy, wind energy has the advantages of large reserves and little pollution (Vargas et al., 2019). The new power system with wide access to wind energy has become a heated topic at home and abroad in recent years. However, the randomness and volatility of wind energy in nature, especially ramping events under the influence of extreme weather, bring huge challenges to the planning, and dispatching of power systems (Chun et al., 2009; ZongheGao et al., 2013; Zhang, 2017). This will not only increase operating costs and energy consumption, but also lead to the phenomenon of “abandonment of wind”, resulting in a waste of resources (Chun et al., 2009; Zhang, 2017; Xie et al., 2019). Therefore, improving the prediction accuracy of the ramping power is of great significance to the safe and stable operation of the new power system.
From the time scale, power prediction methods can be divided into ultra short-term prediction, short-term prediction, medium-term prediction, and long-term prediction (Oh and Wang, 2020). Among them, the ultra-short-term prediction is mainly used for the control of wind turbines, the short-term prediction is made for the scheduling of the power grid, the medium-term prediction is used for the arrangement of large-scale maintenance, and the long-term prediction is designed for the evaluation of the site selection of the wind farm (Khosravi et al., 2013; Qin, 2018). In principle, it can be divided into physical methods, time series methods, and artificial intelligence methods. Among them, Ma Yanhong combined neural network and Bayesian rules to make ultra-short-term predictions for Jiuquan Wind Power Base (Ma and Wang, 2013). On the basis of NWP, Fan Gaofeng developed a prediction system with a good human-machine interface based on artificial neural networks, and realized a seamless connection with energy management (Fan et al., 2008). C. Wan proposed a wind power prediction strategy that combines artificial neural network and genetic algorithm. Through the improvement of the algorithm, the calculation efficiency and prediction accuracy have been improved (Wan et al., 2014). In short, artificial learning methods can better consider non-linear factors, and have adaptive and self-learning capabilities, but they have higher requirements for the quantity and quality of training data.
This paper presents a wind power prediction model of ramping events based on classified spatiotemporal network (CSN). Firstly, the spinning door algorithm is used to extract effective ramping events from the historical database. Due to the rarity of extreme weather and the lack of sample data of ramping events, the reliability of prediction is restricted. The database is expanded by using the generative adversarial network model. The generator generates and simulates the ramping data according to the characteristic value of the input ramping data. The discriminator distinguishes between historical data and simulated data. After the confrontation training, the generator can generate the simulated ramping data with high similarity, and then realize the expansion of the ramping database. After that, the association rules mining algorithm is used to mine the data set frequently. The ramping events are classified by clustering algorithm, and the type probability of the next ramping event is calculated according to the correlation analysis. Combined with weight information and weather characteristics, the spatiotemporal neural network model is used to predict the ramping power. Taking the wind power dataset of a certain region in Northwest China as the basis, the feasibility of the proposed model is verified through simulated experiments.
2 Data Processing and Evaluation Index
This chapter is to conduct qualitative and quantitative analysis on history data, summarize the evaluation indexes of commonly-used prediction methods, and lay a theoretical foundation for the research. Firstly, the optimal spinning door algorithm is used to extract effective ramping events from redundant data to form an effective ramping event set. Then, the feature set with spatiotemporal correlation is obtained by feature extraction. In order to ensure the accuracy of power prediction, all the feature sets are standardized to get the optimal power. Finally, two indexes of evaluation are introduced, namely, the prediction accuracy of ramping events and the prediction accuracy of power waveform.
2.1 Spinning Door Algorithm
Spinning door algorithm (SDA) is a kind of compression algorithm, which can find key points by building parallelogram, and then realize data compression (Erdem and Shi, 2011; Liu et al., 2018a). By using the spinning door algorithm, the ramping up and down events can be identified (Faris et al., 2018). Figure 1 shows the quadrilateral construction principle of spinning door algorithm. Construct parallelogram 1–3, all points are in the quadrilateral. When the parallelogram 4 with points B, C, and D outside the quadrilateral is constructed, the search ends. At this time, points A, B, C and D can be regarded as a ramping-up event. The optimized spinning door algorithm is an improvement of the spinning door algorithm, which can adapt to the ramping recognition under different time scales, and integrate the adjacent events with the same direction and similar slope, so as to determine the ramping events (Huang et al., 2019; Zhang et al., 2019). The recognition result is shown in Figure 2.
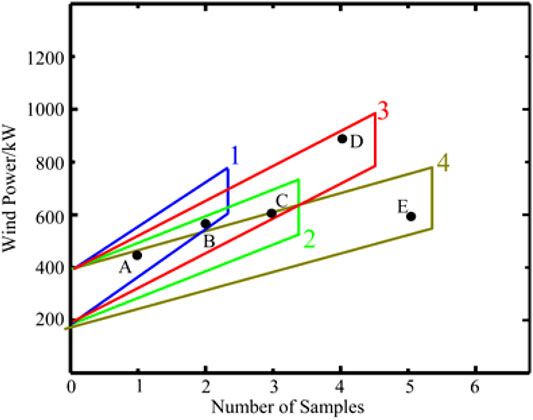
FIGURE 1. The principle of spinning door algorithm.
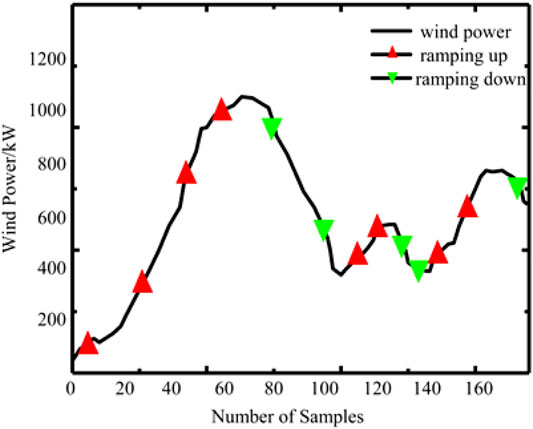
FIGURE 2. Diagram for identifying ramping events.
The algorithm takes an interval (i, j) in the wind power time series, and k (i < k < j) is any time in the interval. The objective function P is constructed as follows:
where,
2.2 Feature Extraction
In order to better explore the characteristics of the ramping database data and improve the prediction accuracy, the feature extraction of power ramping events identified by the optimized spinning door algorithm is carried out (Ronay et al., 2017; Naik et al., 2018). The ramping power
There is spatial correlation between different feature types. And there is a temporal connection between the data at different times. Therefore, such feature sets can be modeled as spatiotemporal data. The feature extraction method can be used not only for power waveform, but also for meteorological factors, such as wind speed, temperature, pressure, and so on.
2.3 Standardization Treatment
Because the units of different types of data and different features of the same type of data are different, the scale difference is too large (He et al., 2016). In order to ensure the accuracy of power prediction, it is necessary to standardize the data. Standardize the attributes of all data points, that is, transfer to a specific data interval, such as [−1, 1]. In order to prevent the influence of noise points on the standardization, median and absolute standard deviation are used to standardize the data.
where,
2.4 Performance Evaluation
In this paper, critical success index
where,
3 Prediction Model Based on Classified Spatiotemporal Network
3.1 Flow Chart of Prediction Model
Deep learning is an important branch of machine learning. It improves the ability to extract data features by building a more profound and complex neural network architecture (Yan et al., 2018; Abedinia et al., 2020). Compared with the traditional shallow neural network, deep learning can extract the deeper sub-features contained in the data through a network hierarchical structure by a series of nonlinear changes, so as to achieve classification or prediction (Liu et al., 2019; Wang et al., 2019). Convolutional neural networks (CNN) specializes in extracting spatial information features of data, and recurrent neural networks (RNN) is good at extracting time series feature information of data (Ji et al., 2017). The spatiotemporal neural network first uses CNN to extract the spatial features of the data, and then uses long-short term memory (LSTM) units or GPUs to extract the temporal dimensional features of the data (Dowell and Pinson, 2016; Shahid et al., 2020). This paper takes weather forecast information into account, and proposes a classified spatiotemporal network model that considers the numerical weather prediction (NWP) data. The model can extract preprocessed historical wind power data and NWP spatial information, and then transfer the extracted spatial features to the bidirectional GPU module to extract timing features. Finally, the classic data splicing method of deep learning is used to integrate historical wind power and NWP feature information, and is input to the fully connected layer for power prediction. The flow chart of the prediction model is shown in Figure 3.
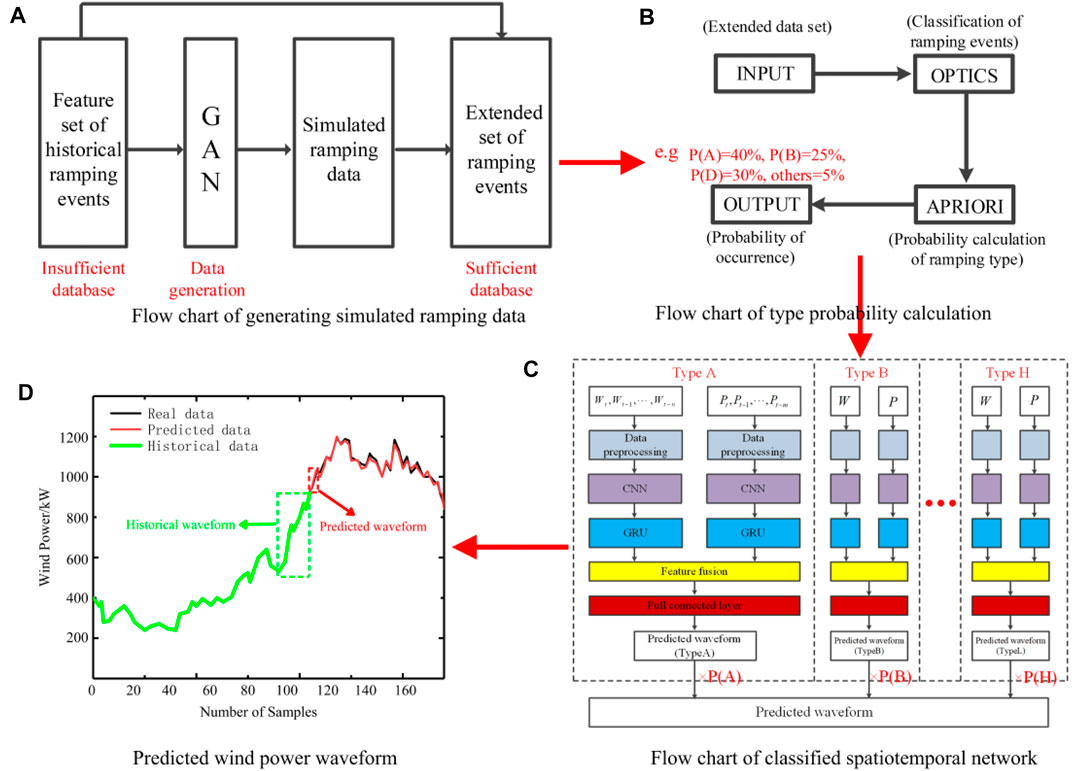
FIGURE 3. Flow chart of the prediction model based on classified spatiotemporal network. (A) Flow chart of generating simulated ramping data, (B) Flow chart of type probability calculation, (C) Flow chart of classified spatiotemporal network, and (D) Predicted wind power waveform.
3.2 The Structure of Generative Adversarial Network
In light of the problems of low accuracy and poor reliability caused by insufficient ramping samples in traditional method, a new data generation method is proposed. Generative adversarial network (GAN) is used to generate simulated ramping data, which is an important part of the proposed power prediction scheme (Yu et al., 2019). The simulated ramping data are generated by confrontation training. Enrich the sample number of prediction model and improve the accuracy of prediction. The generator G in the generation countermeasure network mainly generates data, using two 3 × 3 convolution kernel and 64 feature mapping convolution layers, and then use batch standardization layer and relu as activation function; The discriminator D mainly distinguishes the data, including 8 convolution layers, uses step convolution to reduce the image resolution, and finally calculates the probability of sample classification through two dense and one sigmoid activation function. The whole network structure is completed in tensorflow framework.
To enlarge the database, a generative adversarial network is used to create simulated ramping event considering historical data and meteorological data. The increase in the sample of ramping events provides conditions for sufficient training of the spatiotemporal neural network and lays the foundations for the improvement of the prediction accuracy of wind power.
3.3 Type Classification of Ramping Events Based on Data Mining
After the data expansion of GAN, the number of ramping event set samples is enough to support high-precision ramping power prediction. It can be seen from the previous article that ramping data has four important attributes. The single attribute statistical characteristics of ramping events can be obtained by ramping detection of wind power data. On this basis, the multi-attribute statistical model of ramping events is obtained by multi-attribute clustering. In this paper, we select these important attributes and use the sorting recognition clustering structure options algorithm for data mining. By sorting the distance of the output points, clusters of any shape can be detected, and the robustness of the input parameters can be guaranteed. It is suitable for multi-attribute joint statistical characteristics detection of wind power ramping events. The output results of options algorithm ensure that the close points are together, which can classify the basic patterns of ramping events. 400 ramping up and 400 ramping down events are selected for type classification, and the results are as shown in Table 1. All ramping events are divided into 8 types according to ramping speed, ramping time and ramping direction. After the classification of ramping events is realized, the type of ramping events can be predicted.
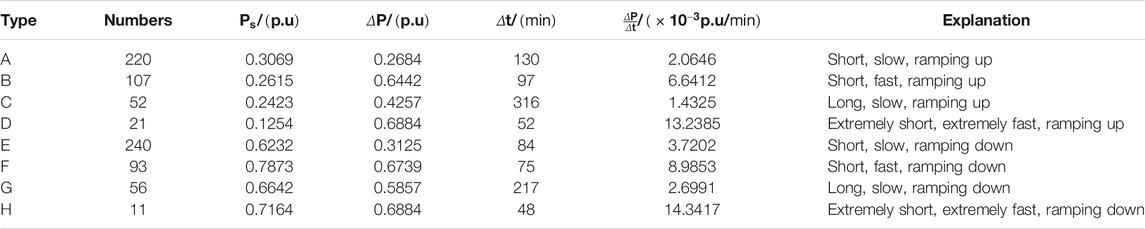
TABLE 1. The classification of ramping events.
3.4 Prediction on the Type of Ramping Events
In the wind power prediction, the autocorrelation of wind power is often used to predict the power series. However, in the traditional ramping prediction model, there is a lack of similar autocorrelation statistical model of wind power ramping events (Chang et al., 2019). In this paper, apriori algorithm is used to mine frequent patterns of ramping events, and the autocorrelation statistical model of ramping events is established. After type classification of ramping events, probability prediction is carried out according to the autocorrelation of recent ramping events.
Taking the frequent binominal set as an example, the probability of the next ramping event of type B, which occurs after the ramping event A, is shown in the formula.
where,
In order to improve the prediction accuracy and reduce the amount of calculation, frequent trinomial set is used to predict the ramping events. According to the autocorrelation, the probability of possible ramping types can be calculated respectively, as shown in the figure below.
In the Figure 4, the last two ramping events are both type A by using type classification, and the type probability of the next ramping event is calculated according to the autocorrelation. The possible ramping events and the probability of occurrence can be seen. Among them,
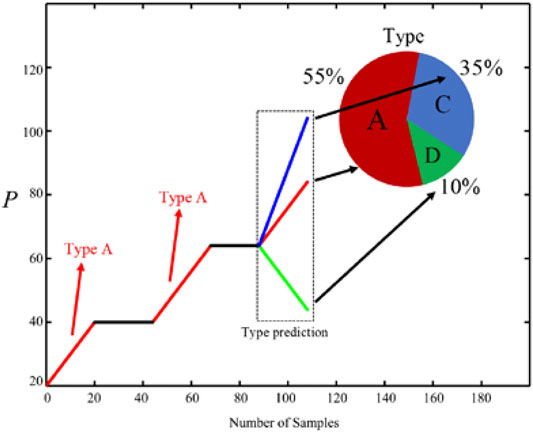
FIGURE 4. Type prediction of ramping events.
3.5 Model of Spatiotemporal Neural Network
After feature extraction and standardization of historical ramping data, feature set can be obtained. There is a spatial connection between different types of features, while there is a temporal connection between the same type of feature data. Therefore, such a feature set can be used in power prediction. Since each feature set has four different variables, each input sample is a 4 × N matrix.
This paper not only uses power data as input, but also takes weather factors into account. It calculates the correlation between meteorological factors and wind power ramping. It can be seen that wind speed, temperature, and air pressure have the greatest correlation. NWP data is added to the model, and the feature extraction, and standardization are also carried out to form a sample set. There are 12 different features in the meteorological feature set, so each input sample is a 12 × N matrix.
In this paper, based on spatiotemporal neural network, CNN, and GRU models are used to extract the eigenvalues of the input data to achieve power prediction. The process is shown in the Figure 5.
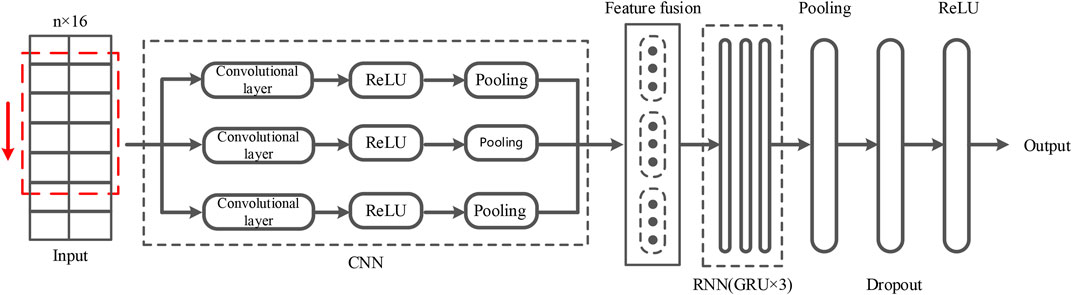
FIGURE 5. The structure of spatiotemporal neural network.
In the figure, CNN of three convolution kernels with different sizes is used to extract feature, and then three vectors can be obtained after linear rectification function and one-dimensional pooling operation. After feature fusion, the spatial feature vector can be extracted. Then it is input to the three-layer GRU unit to extract the time sequence features of the vector value. Finally, after pooling, dropout, and ReLU functions, the output power prediction waveform is obtained.
To further improve the accuracy of power prediction, the spatiotemporal neural network is trained according to the event type. After sufficient sample training, we can get 8 different spatiotemporal neural networks which are highly correlated with the ramping type A to H. After the prediction of ramping types based on data mining, the probability weights of different types of ramping events are calculated. After the classification of spatiotemporal neural network power prediction, combined with the weight data, a comprehensive power prediction waveform can be obtained.
Because this spatiotemporal neural network is a model considering NWP data, in the process of classification and prediction, the spatial features of historical ramping data and NWP data are extracted respectively, and then transferred to GRU module to extract time series information. Finally, the feature fusion method is used to splice all the feature information and input it to the full connection layer to realize the power prediction.
4 Experimental Results and Analysis
In this paper, the actual data of a wind farm with a rated capacity of 45 MW in China is used as a test case to verify the effectiveness of the proposed method. The time of data is from 2018 to 2020, and the measurement interval is 5 min 80% of the entire data set is used as the training set, and the remaining 20% is used as the test set.
4.1 Similarity Comparison
In order to verify the reliability of the classification of ramping events, a quantitative comparison of the similarity of different types of ramping events, and ramping events of the same type from different data sources are carried out. The distance function is used as the evaluation index, and the similarity is inversely proportional to the distance between data objects. The distance function is as follows:
where,
Taking the above ramping event as an example, the Euclidean distance of different data sources and different types of climbing are calculated in Table 2.
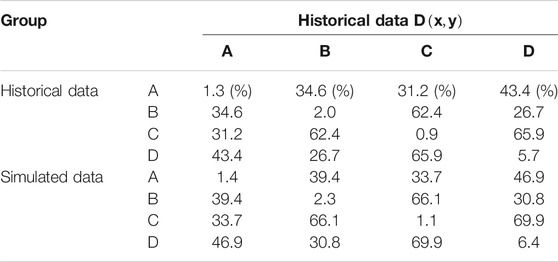
TABLE 2. The similarity between simulated data and historical data.
To present the actual number of simulated data and historical data, and to analyze the error rate of simulated data, we made some experiments to verify the reliability. By increasing the proportion of simulated data, the reliability of power prediction is calculated. Historical and simulated data sets are used as the input of the prediction model, and the number of simulated data and historical data are changed. Then MAPE and RMSE are calculated respectively. The data is shown in Table 3.
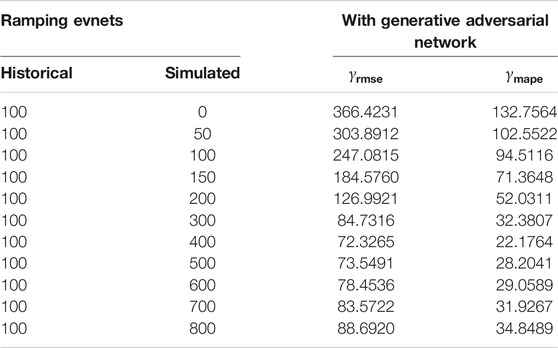
TABLE 3. Prediction effect of different proportions of simulated data.
It can be seen that the accuracy of prediction will be gradually improved by increasing the number of simulated data. However, when the simulated data is too large, the accuracy of the prediction algorithm will be limited to a certain extent. And when the simulate data is close to 80%, the effect of the promotion algorithm is the best.
4.2 Evaluation of Ramping Events Prediction
At present, support vector regression (SVR), back propagation (BP), and Elman neural networks have been widely used for wind farm prediction. Based on structural risk minimization, SVR has strong robustness (Chang et al., 2019). BP neural network is a classical neural network, which has a fast learning speed, and is widely used in many fields (Liu et al., 2018b). The structure of Elman neural network is similar to BP, but the output of its hidden layer is connected with the input, which plays an important role in the global optimization of the network (Lu et al., 2015; Wang et al., 2017). In this paper, a wind power ramping prediction model based on classified spatiotemporal neural network is proposed and established, compared with the previous methods mentioned. In the sample set, 500 ramping data and 500 non-ramping data are chosen experiments. The misjudgment of ramping events is shown Figure 6.
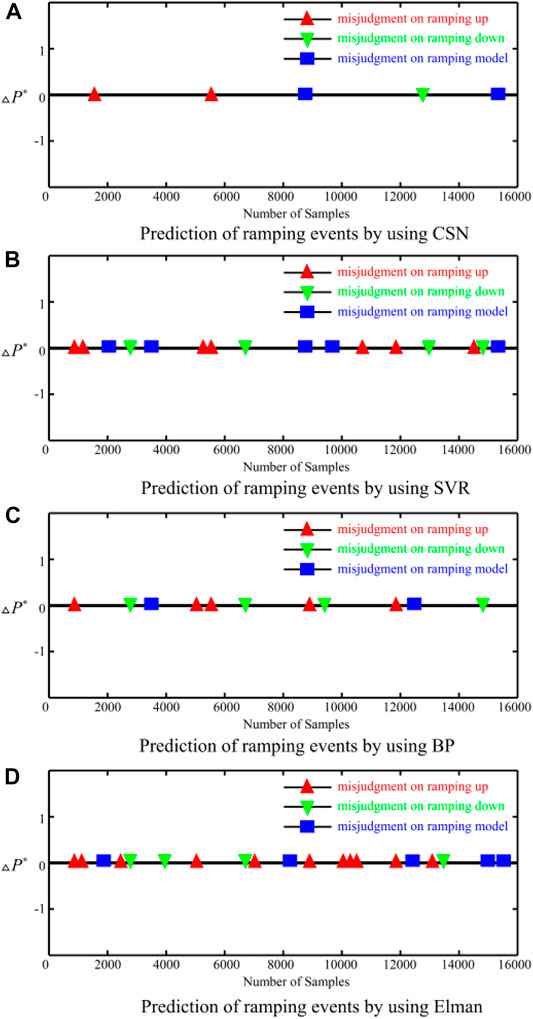
FIGURE 6. Misjudgments of ramping events in the wind farm. (A) Prediction of ramping events by using CSN, (B) Prediction of ramping events by using SVR, (C) Prediction of ramping events by using BP, and (D) Prediction of ramping events by using Elman.
It can be seen from the statistics of ramping data that the proposed method has the lowest error rate and the best effect. To evaluate the effect of ramping events prediction, the
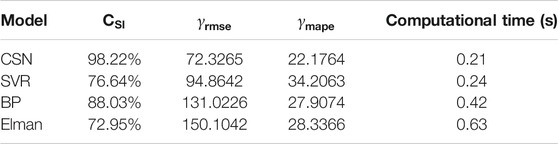
TABLE 4. Prediction evaluation of ramping events.
CSN, SVR, BP, and Elman are used to predict the ramping events. It can be found that the CSN method has the highest prediction accuracy, which is approximately 99%, while the accuracy of other methods is only about 80%. It also has the smallest error and a higher accuracy. The simulation experiment results prove that the wind power prediction algorithm based on the classified spatiotemporal network realizes accurate prediction on ramping power waveform. Figure 7 shows the comparison of power waveform prediction.
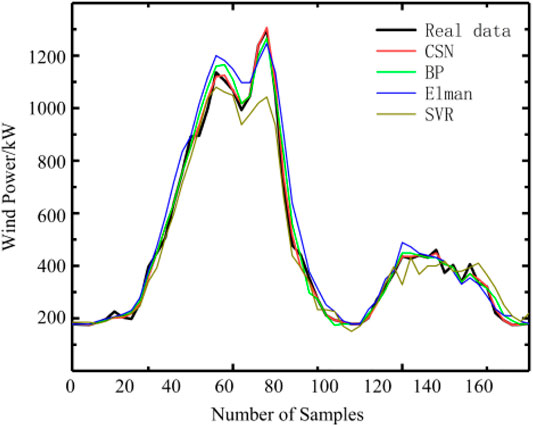
FIGURE 7. Comparison of power waveform prediction.
5 Conclusion
In this paper, a wind power ramping prediction model based on classified spatiotemporal network (CSN) is proposed. The innovation points are as follows:
1) Valid ramping events are extracted from historical data based on spinning door algorithm. According to the waveform characteristics of ramping events and weather characteristics, a historical ramping feature set is constructed.
2) Generative adversarial network is proposed to generate data to enrich the set of historical ramping events’ feature. Adequate feature database provides a guarantee for adequate training and can improve the efficiency of prediction.
3) After the database is expanded, data mining algorithm is adopted to predict the climbing type. Then, the classified spatiotemporal neural network is used to predict the power according to the weight. Compared with traditional methods, the prediction and training quality is better and the efficiency is higher.
Data Availability Statement
The raw data supporting the conclusion of this article will be made available by the authors, without undue reservation.
Author Contributions
BX was responsible for the writing, revision, picture drawing and other related work of the paper. QH was responsible for experimental simulation, paper guidance. HW was responsible for data collection. LY was responsible for data sorting and table drawing.
Conflict of Interest
The authors declare that the research was conducted in the absence of any commercial or financial relationships that could be construed as a potential conflict of interest.
Publisher’s Note
All claims expressed in this article are solely those of the authors and do not necessarily represent those of their affiliated organizations, or those of the publisher, the editors and the reviewers. Any product that may be evaluated in this article, or claim that may be made by its manufacturer, is not guaranteed or endorsed by the publisher.
Acknowledgments
This is a project Supported by Scientific Research Fund of Zhejiang Provincial Education Department (Y202147365).
References
Abedinia, O., Bagheri, M., Naderi, M. S., and Ghadimi, N. (2020). A New Combinatory Approach for Wind Power Forecasting. IEEE Syst. J. 14, 4614–4625. doi:10.1109/JSYST.2019.2961172
Chang, Z., Zhang, Y., and Chen, W. (2019). Electricity price Prediction Based on Hybrid Model of Adam Optimized LSTM Neural Network and Wavelet Transform. Energy 187, 115804. doi:10.1016/j.energy.2019.07.134
Chun, L., Gaofeng, F., and Weisheng, W. (2009). Combined Prediction Model of Wind Farm Output Power. Power Syst. Technol. 33 (13), 74–79.
Dowell, J., and Pinson, P. (2016). Very-Short-Term Probabilistic Wind Power Forecasts by Sparse Vector Autoregression. IEEE Trans. Smart Grid 7, 763–770. doi:10.1109/TSG.2015.2424078
Erdem, E., and Shi, J. (2011). ARMA Based Approaches for Forecasting the Tuple of Wind Speed and Direction. Appl. Energ. 88 (4), 1405–1414. doi:10.1016/j.apenergy.2010.10.031
Fan, G. F., Wang, W. S., and Liu, C. (2008). Short Term Prediction System of Wind Power Based on Artificial Neural Network[J]. Power Syst. Technology (22), 72–76.
Faris, H., Mafarja, M. M., Heidari, A. A., Aljarah, I., Al-Zoubi, A. M., Mirjalili, S., et al. (2018). An Efficient Binary Salp Swarm Algorithm with Crossover Scheme for Feature Selection Problemsficient Binary Salp Swarm Algorithm with Crossover Scheme for Feature Selection Problems. Knowledge-Based Syst. 154, 43–67. doi:10.1016/j.knosys.2018.05.009
He, Y., Xu, Q., Wan, J., and Yang, S. (2016). Short-term Power Load Probability Density Forecasting Based on Quantile Regression Neural Network and triangle Kernel Function. Energy 114, 498–512. doi:10.1016/j.energy.2016.08.023
Huang, N., Wu, Y., Cai, G., Zhu, H., Yu, C., Jiang, L., et al. (2019). Short-Term Wind Speed Forecast with Low Loss of Information Based on Feature Generation of OSVD. IEEE Access 7, 81027–81046. doi:10.1109/access.2019.2922662
Ji, G. L., Yuan, Y., and Huang, J. H. (2017). Combined Model Based on EEMD-HS-SVM for Short-Term Wind Power Prediction. Renew. Energ. Resour. 35 (8), 1121–1228.
Khosravi, A., Nahavandi, S., and Creighton, D. (2013). Prediction Intervals for Short-Term Wind Farm Power Generation Forecasts. IEEE Trans. Sustain. Energ. 4 (3), 602–610. doi:10.1109/tste.2012.2232944
Liu, H., Mi, X., and Li, Y. (2018). Smart Multi-step Deep Learning Model for Wind Speed Forecasting Based on Variational Mode Decomposition, Singular Spectrum Analysis, LSTM Network and ELM. Energ. Convers. Management 159, 54–64. doi:10.1016/j.enconman.2018.01.010
Liu, Y., Guan, L., Hou, C., Han, H., Liu, Z., Sun, Y., et al. (2019). Wind Power Short-Term Prediction Based on LSTM and Discrete Wavelet Transform. Appl. Sci. 9 (6), 1108. doi:10.3390/app9061108
Liu, Z., Hajiali, M., Torabi, A., Ahmadi, B., and Simoes, R. (2018). Novel Forecasting Model Based on Improved Wavelet Transform, Informative Feature Selection, and Hybrid Support Vector Machine on Wind Power Forecasting. J. Ambient Intell. Hum. Comput 9 (6), 1919–1931. doi:10.1007/s12652-018-0886-0
Lu, N., Liu, Y., and Liu, Y. (2015). Application of Support Vector Machine Model in Wind Power Prediction Based on Particle Swarm Optimization. Discrete Continuous Dyn. Syst. 8 (6), 1267–1276. doi:10.3934/dcdss.2015.8.1267
Ma, Y., Wang, N., Ma, M., Liu, G., and Zhao, L. (2013). Neural Network Based Ultra Short Term Wind Power Prediction Method for Jiuquan Wind Power Base[J]. Electric Power Construction 34 (09), 1–5.
Mi, X.-W., Liu, H., and Li, Y.-F. (2017). Wind Speed Forecasting Method Using Wavelet, Extreme Learning Machine and Outlier Correction Algorithm. Energ. Convers. Management 151, 709–722. doi:10.1016/j.enconman.2017.09.034
Naik, J., Dash, S., Dash, P. K., and Bisoi, R. (2018). Short Term Wind Power Forecasting Using Hybrid Variational Mode Decomposition and Multi-Kernel Regularized Pseudo Inverse Neural Network. Renew. Energ. 118, 180–212. doi:10.1016/j.renene.2017.10.111
Oh, E., and Wang, H. (2020). Reinforcement-Learning-Based Energy Storage System Operation Strategies to Manage Wind Power Forecast Uncertainty. IEEE Access 8, 20965–20976. doi:10.1109/access.2020.2968841
Qin, B. S. (2018). “Research of the Wind Speed and Power Forecasting Bangsed on the Actual Measured Date,”. M.S. thesis (Jilin, China: Dept. Northeast Electric Power Univ.).
Ronay, A. K., Li, Y.-F., Vitelli, V., and Zio, E. (2017). Adequacy Assessment of a Wind-Integrated System Using Neural Network-Based Interval Predictions of Wind Power Generation and Load. Int. J. Elect. Power Energ. Syst. 95, 213–226.
Shahid, F., Zameer, A., Mehmood, A., and Raja, M. A. Z. (2020). A Novel Wavenets Long Short Term Memory Paradigm for Wind Power Prediction. Appl. Energ. 269, 115098. doi:10.1016/j.apenergy.2020.115098
Vargas, S. A., Esteves, G. R. T., Maçaira, P. M., Bastos, B. Q., Cyrino Oliveira, F. L., and Souza, R. C. (2019). Wind Power Generation: A Review and a Research Agenda. J. Clean. Prod. 218, 850–870. doi:10.1016/j.jclepro.2019.02.015
Wan, C., Xu, Z., Pinson, P., Dong, Z. Y., and Wong, K. P. (2014). Probabilistic Forecasting of Wind Power Generation Using Extreme Learning Machine. IEEE Trans. Power Syst. 29 (3), 1033–1044. doi:10.1109/tpwrs.2013.2287871
Wang, S.-X., Li, M., Zhao, L., and Jin, C. (2019). Short-term Wind Power Prediction Based on Improved Small-World Neural Network. Neural Comput. Applic 31 (7), 3173–3185. doi:10.1007/s00521-017-3262-7
Wang, Z., Wang, B., Liu, C., and Wang, W. s. (2017). Improved BP Neural Network Algorithm to Wind Power Forecast. J. Eng. 2017 (13), 940–943. doi:10.1049/joe.2017.0469
Xie, W., Zhang, P., Chen, R., and Zhou, Z. (2019). A Nonparametric Bayesian Framework for Short-Term Wind Power Probabilistic Forecast. IEEE Trans. Power Syst. 34 (1), 371–379. doi:10.1109/tpwrs.2018.2858265
Yan, J., Xu, C., Liu, Y., Han, S., and Li, L. (2018). Short-term Wind Power Prediction Method Based on Wind Speed Cloud Model in Similar Day. Automat. Electr. Power Syst. 42 (6), 53–59. doi:10.7500/AEPS20170605001
Yu, R., Gao, J., Yu, M., Lu, W., Xu, T., Zhao, M., et al. (2019). LSTM-EFG for Wind Power Forecasting Based on Sequential Correlation Features. Future Generation Computer Syst. 93, 33–42. doi:10.1016/j.future.2018.09.054
Zang, H., Liang, Z., Guo, M., Qian, Z., Wei, Z., and Sun, G. (2016). “Short-term Wind Speed Forecasting Based on an EEMD-CAPSO-RVM Model,” in Proceeding of the 2016 IEEE PES Asia-Pacific Power and Energy Engineering Conference (APPEEC), Xi'an, China, 25-28 Oct. 2016 (IEEE), 439–443. doi:10.1109/APPEEC.2016.7779542
Zhang, C. (2017). “Research on Some Issues of Short-Term Wind Speed Forecasting for Wind Farms,” . Ph.D. dissertation (Nanjing, China: Dept. Southeast Univ.).
Zhang, Y., Sun, H., and Guo, Y. (2019). Wind Power Prediction Based on PSO-SVR and Grey Combination Model. IEEE Access 7, 136254–136267. doi:10.1109/access.2019.2942012
Keywords: spinning door algorithm, generative adversarial network, spatiotemporal neural network, ramping events, wind power prediction
Citation: Xia B, Huang Q, Wang H and Ying L (2022) Wind Power Prediction in View of Ramping Events Based on Classified Spatiotemporal Network. Front. Energy Res. 9:754274. doi: 10.3389/fenrg.2021.754274
Received: 06 August 2021; Accepted: 09 December 2021;
Published: 06 January 2022.
Edited by:
Liansong Xiong, Nanjing Institute of Technology (NJIT), ChinaCopyright © 2022 Xia, Huang, Wang and Ying. This is an open-access article distributed under the terms of the Creative Commons Attribution License (CC BY). The use, distribution or reproduction in other forums is permitted, provided the original author(s) and the copyright owner(s) are credited and that the original publication in this journal is cited, in accordance with accepted academic practice. No use, distribution or reproduction is permitted which does not comply with these terms.
*Correspondence: Qiyue Huang, MjAxOTAwMUBuYnB0LmVkdS5jbg==