 Moumita Roy
 Sukrampal Yadav
 Sunil A. Patil
- Department of Earth and Environmental Sciences, Indian Institute of Science Education and Research Mohali (IISER Mohali), Manauli, India
Biogas is one of the promising futuristic renewable energy sources with enormous market potential. However, the presence of CO2 lowers down the calorific value of biogas. Hence, various biogas upgradation technologies are under intense investigation to increase the methane content to the desired level. This study reports on enhancing methane content in biogas through CO2 sequestration into acetic acid via microbial electrosynthesis (MES) process. The previously enriched mixed chemolithoautotrophic microbial culture dominated by Acetobacterium spp. used CO2 present in the biogas as the sole carbon source. After establishing a stable performing biocathode at a fixed cathodic potential of −1 V (vs. Ag/AgCl) through batch mode operation, biogas was fed continuously at different feed rates, viz., 0.5, 0.3, and 0.2 ml/min to the cathode chamber. The highest feed rate of 0.5 ml/min was least effective both for methane content increment (from 61 ± 3% to 86 ± 2%) and acetic acid titer (1.5 ± 0.5 g/L; 0.107 ± 0.02 g/L/d.). In comparison, the lowest flow rate of 0.2 ml/min was the most effective for the intended process (methane upgradation from 62 ± 7% to 93 ± 3% and acetic acid titer 3.4 ± 0.6 g/L produced at 0.24 ± 0.04 g/L/d rate). Both acetic acid bioproduction and biogas upgradation occurred best at an Ecell of 3.3 ± 0.35 V at the low feed rate. A maximum of 84 ± 7%, 57 ± 10% and 29 ± 2% coulombic, carbon and energetic efficiencies, respectively, were achieved in acetic acid. Cyclic voltammograms of biocathodes revealed the decrease in hydrogen evolution potential and increased bioelectrocatalysis, thereby suggesting the contribution of microbes in the process. Acetobacterium, which is known for CO2 fixation, was found to be the dominant microbial genus in biogas fed reactors. The demonstrated approach not only offers the advantage of obtaining two products, one in the bulk phase and the other in the off-gas, it also validates the applicability of the bioelectrochemical biogas upgradation technology.
1 Introduction
According to the World Energy Forum, fossil fuel sources will be exhausted by the next 10 decades due to the unquenchable global energy demand (Weiland, 2010; Sahota et al., 2018). Since energy is the pillar of globalization, its demand is increasing exponentially with time. Under these circumstances and for sustainable growth, immediate measures need to be taken to rapidly implement renewable energy. Among various sources, biogas is a promising source to meet the world’s importunate energy demand. It has a great potential to evolve as an alternative fuel for vehicles or to meet the ever-growing electricity demand and is increasingly gaining preference throughout the globe. For example, CNG fueled buses are already operating in the United States. Over 2,200 digesters are currently operational for biogas production in the United States (Biogas Industry Market Snapshot | American Biogas Council). Due to the price increase of gasoline in Europe and North America, more inclination is visible for biomethane (Engerer and Horn, 2010). About 42 million anaerobic digesters produce around 13 million m3 biogas in China. By the end of 2030, Germany will be producing near about 10 billion m3 biogas. In India, 4.9 million digesters with a two million m3 biogas production capacity are present (Thiruselvi et al., 2021). India has planned to target renewable energy at 275 gigawatts by the end of 2027 (Thiruselvi et al., 2021). Several initiatives have also been taken up by the Indian Government like the Sustainable Alternative toward Affordable Transportation (SATAT) initiative to secure the off-take of compressed biomethane, the National Policy on Biofuels (2018) for financing as well as fiscal incentives, and Motor vehicles rule to promote the usage of BioCNG in motor vehicles. Climate Change Levy of United Kingdom and Finland provide tax exemption for energy from renewable sources. These data suggest the prominence of biogas in renewable energy development programs across the globe.
The key challenge in using biogas as fuel is its low calorific value due to the presence of CO2. For instance, the upgraded BioCNG (around 52,000 kJ/kg) has around 2.5-fold higher calorific value than untreated biogas containing ∼55% methane (around 19,500 kJ/kg) (Dere et al., 2017). Hence, biogas upgradation is essential to make it a high-quality fuel. To this end, several technologies based on absorption, adsorption, and membrane separation approaches have come up over the years (Kadam and Panwar, 2017; Angelidaki et al., 2018; Sahota et al., 2018; Thiruselvi et al., 2021). Water scrubbing is the most feasible, but it is not considered economical and sustainable due to high capital costs and freshwater requirements. Apart from water scrubbing, pressure swing absorption and chemical adsorption are also established techniques, but they are complex processes with high investment costs (Sahota et al., 2018). More sustainable approaches to biogas upgradation are thus constantly explored. Microbial electrosynthesis (MES) is one of the microbial electrochemical technologies (METs) in which electricity-driven CO2 reduction is enabled with the help of microbial catalysts. Based on the nature and extent of electrochemical interactions between the working electrode and microbial catalysts, METs are broadly categorized into two groups, namely primary and secondary METs (Schröder et al., 2015). In primary METs, a prominent functional connection between the microbial catalysts and working electrode exists via direct or mediated electron transfer. In secondary METs, electrochemistry is indirectly linked to the microbial process, for instance, through the electrochemical control of parameters such as metabolite concentration and pH. In most MES processes, including the present study, microorganisms catalyze the target reactions via direct and/or mediated electron transfer mechanisms by forming biofilm at the cathode surface and planktonic growth in the bulk phase (Patil et al., 2015a; Labelle et al., 2020). Using this technique, CO2 from the biogas can be converted to value-added products like methane, acetic acid, butyric acid, propionic acid, and the methane concentration can be enhanced. The most attractive part of the MES process is the CO2 utilization instead of just removal. In one approach, the microbial electrolysis process is integrated with anaerobic digesters, and CO2 is microbially reduced to methane. Significant work has been done on coupling MES with anaerobic digestion (AD) with different reactor designs and operational conditions (Sravan et al., 2020; Wang et al., 2021). Biogas is fed to the MES reactors in another approach, and CO2 is reduced to methane through hydrogenotrophic, acetoclastic, or methylotrophic pathways (Evans et al., 2019).
Limited work has been done on utilizing CO2 from biogas to produce organic acids or other products via MES (Jourdin et al., 2015b; Das and Ghangrekar, 2018; Kokkoli et al., 2018). The previous MES studies with biogas feedstock mostly focused on value-added product formation, specifically acetic acid, and barely on enhancing methane content. The present study aimed to investigate the MES applicability for biogas upgradation through CO2 conversion into acetic acid. After establishing a batch mode process, the effect of different biogas feed rates was studied for the upgradation of biogas along with the production of acetic acid. The cyclic voltammetry and the genomic analyses of the biocathode were conducted to shed light on the bioelectrochemical processes and microorganisms involved in the bioproduction process.
2 Materials and Methods
2.1 Microbial Inoculum Source and Cultivation Conditions
A previously enriched chemolithoautotrophic mixed microbial culture dominated by Acetobacterium spp. was used as the inoculum source (Roy et al., 2021). For the MES experiments, a minimal medium with pH 7 was used. It contained K2HPO4 (5.35 g/L), KH2PO4 (2.62 g/L), NH4Cl (0.25 g/L), KCl (0.5 g/L), CaCl2⋅2H2O (0.15 g/L), MgCl2⋅2H2O (0.6 g/L), trace metal solution (1 ml/L), selenium-tungstate solution (1 ml/L), vitamin solution (2.5 ml/L), 2-bromoethanesulfonate (6.4 g/L), Na2S⋅9H2O (0.3 g/L), and resazurin (0.5 ml/L from a 0.1% stock solution) (Roy et al., 2021). It was cultivated and maintained with CO2 and H2 (H2:CO2 ratio was 4:1) as the sole carbon and energy sources, respectively, under anaerobic conditions at 28 ± 2°C. An active culture was inoculated in the cathode chamber of MES reactors to have 0.25 OD600 in suspension during the start-up phase.
2.2 Biogas Sampling and Characterization
The biogas was collected from an operational and well-maintained anaerobic sewage treatment plant (Phase 3, Panchkula, Haryana). A vacuum pump (Model N86 KT.45.18; KNF pump) was used to collect biogas in 6 L passivated SilcoCan steel canisters (Restek, United States). A Teflon gas tubing was used to collect the biogas as it can withstand high temperature (>180°C) and pressure (>40 psi). A PTFE filter (0.2 µm) was used in the front of the tubing to restrict the particulate matter from the biogas from entering the canister. At the same time, the moisture content was minimized with the help of a moisture trap installed in gas tubing where magnesium perchlorate was used as the moisture-absorbing reagent. The biogas samples were analyzed by GC with TCD (Agilent 490 Micro GC, Analysis and Calculations). The major components of biogas were methane (60 ± 2%), CO2 (28 ± 5%), and N2 (10 ± 2%). A trace amount of H2S was also present in the sample. 1 ± 0.1% O2 was also observed, which was most likely present due to manual sampling error.
2.3 MES Reactor Setup and Experiments
Custom-made double-chambered glass reactors with an empty bed volume of 700 ml (350 ml each chamber) were used for this study. The catholyte was the same as mentioned in Microbial Inoculum Source and Cultivation Conditions and the anolyte was 0.5 M Na2SO4 with pH 2.5 (adjusted with 1 M H2SO4). The experiments were conducted in three-electrode configuration mode under potentiostatically controlled conditions (VSP300, BioLogic Science Instruments, France). The working volume was 250 ml. A graphite plate with 10 cm2 and dimensionally stable mixed metal oxide coated titanium plate with 7.5 cm2 projected surface area were used as working (cathode) and counter (anode) electrodes, respectively. The anode and cathode chambers were separated by a 117 Nafion proton exchange membrane (Sigma-Aldrich). Water oxidation/oxygen evolution and CO2 reduction reactions take place in the anode and cathode chambers, respectively. The cathode material and proton exchange membrane were pretreated as described elsewhere (Roy et al., 2021). All MES experiments were performed in duplicate at an incubation temperature of 28 ± 2°C. The performance of the duplicate reactors for reported parameters was reproducible and very close; therefore average data has been presented in all the figures. The electrode potential data are reported against Ag/AgCl (3.5 M KCl) reference electrode (0.205 V vs. SHE). The experimental setup and the reactions in MES reactors are illustrated in Supplementary Figure S1. Two types of control experiments were conducted. These include biotic open circuit potential (OCP) experiment (with all media components and carbon source but not electrically connected, i.e., no electron/energy source), and abiotic connected (with all the components and electrically connected but uninoculated) experiment.
Activation polarization was performed at −0.6 V before inoculation or starting the main experiment for electrochemical activation of the electrodes, membrane, and electrolyte. A constant potential of −1.0 V vs. Ag/AgCl was applied at the cathode to facilitate H2-based bioproduction by using the chronoamperometry (CA) technique. The reduction current response was monitored at a constant time interval (5 min). Cyclic voltammetric analysis was conducted for two cycles within a potential window of −1.4 and −0.2 V at a constant scan rate of 1 mVs−1 at different experimental conditions, i.e., before inoculation, after inoculation, and at the end of each biogas feed condition. The data of the second cycle was used for analysis.
2.4 Biogas Feeding
In the first phase, 30 ml of CO2 containing biogas (with the composition stated in Biogas Sampling and Characterization) was added to the catholyte daily to establish a stable performing biocathode. The CO2 present in the biogas got dissolved in the form of bicarbonate at pH 7. This was the sole carbon source for the microbes. A gas displacement assembly was attached to the reactor’s outlet to maintain the pressure condition inside the reactors. After the completion of two batch cycles, the biogas was fed in a continuous flow mode at different feed rates, viz., 0.5, 0.3 and 0.2 ml/min using the mass flow controllers (MFCs, Alicat/MCM-100SCCM-D) in the second phase. The MFC calibration was carried out with the air by the manufacturer (Alicat Scientific). The correction factors were applied for different gases depending on their viscosity, density, and compressibility. The standards used for calibrations were NIST (National Institute of Standards and Technology) traceable. The volumetric flow of the off-gas from MFCs was measured to confirm the used flow rates with the help of a water displacement assembly, and it was found to be the same. The volumetric flows of the off-gas from the microbial electrosynthesis reactors were also measured intermittently at each experimental condition and were found to be marginally lower than the applied feed rates. For instance, in the case of 0.5 ml/min biogas feed rate, the off-gas flow was about 0.47 ml/min. Similar trends were observed in other gas feed rates. The effect of different feed rates was evaluated on methane content increase as well as acetic acid production after acclimatization of the reactors for at least 2 days at each feed rate.
2.5 Analysis and Calculations
The bulk phase and gas samples from MES reactors were taken at a regular interval of 2 days. To assess the gas composition in the headspace and to know the methane concentration, the gas analysis was done by GC-TCD (Agilent 490 Micro GC) equipped with three channels for different gases [Channel 1: Column- Molecular sieve for H2, carrier gas- Ar; Channel 2: Column- Molecular sieve for O2, N2, CO and CH4, carrier gas–He; Channel 3: Column- Pora plot U for CO2 and H2S, carrier gas–He]. The bulk phase organics (C1-C4 organic acids and alcohols) analysis by HPLC (Agilent 1260 Infinity II, RID Detector, Hiplex H column, 5 µM H2SO4 as mobile phase, flow rate 0.5 ml/min, Temperature 50°C) was performed to evaluate the efficiency of microbes to produce organics from CO2 in biogas. Additionally, monitoring of microbial growth via OD measurements at 600 nm (Photo-lab 7600 UV-VIS spectrophotometer) and pH (Oakton PC2700) in the bulk phase was done. Different parameters, such as product titer, production rates (normalized by cathode surface area and catholyte volume), coulombic efficiency (electron recovery into organic products), carbon recovery efficiency (Das et al., 2018) and energetic efficiency were calculated as described in supplementary section S1 (Patil et al., 2015b). Since the methane content increase was not directly related to energy consumption in this study, we did not consider it in CE and EE calculations.
2.6 Microbial Community Analysis
To understand the microbial communities developed at the biocathode and in the bulk phase, V3-V4 16S amplicon sequencing-based analysis was conducted. For this, the genomic DNA of the inoculum source and from two duplicate MES reactors named R1 and R2 (biocathode and bulk phase) was isolated on the completion of the electrosynthesis experiments using QIAGEN DNeasy PowerSoil Pro Kit. Further DNA quantification was done by Nanodrop (Genova Nano—4359). Agarose gel electrophoresis (1%) was also performed to assess the integrity of the isolated genomic DNA. Since V3-V4 regions of 16S rRNA are the most conserved regions, they were amplified using specific V3 Forward (341F: 5′-GCCTACGGGNGGCWGCAG-3′) and V4 Reverse (805R: 5′-ACTACHVGGGTATCTAATCC-3′) primers. Again 2% agarose gel electrophoresis was performed to analyze the amplified products. Later, Illumina MiSeq 2,500 platform at Eurofins Genomics India Pvt. Ltd. (Bangalore, India) was used for amplicon sequencing. Trimmomatric v0.38 was used for trimming the adaptor and primers sequences. FLASH v1.2.11 was run for alignment as well as selecting the operational taxonomic unit (OTU). At last, the OTU products were run through the Silva database to find the most similar OTU hits using the Qiime1 pipeline and R packages for visualization. The raw amplicon sequences have been submitted to NCBI short read archive under bio-project PRJNA659908.
3 Results and Discussion
3.1 Biocathode Development Through Batch Mode Operation
In order to form an efficient biocathode for CO2 utilization, the biogas was first supplied in a fed-batch mode. Since the enriched mixed culture contained chemolithoautotrophic microbes (Roy et al., 2021), immediate organics production, in particular, acetic acid, was detected from the start of the experiment (Figure 1).
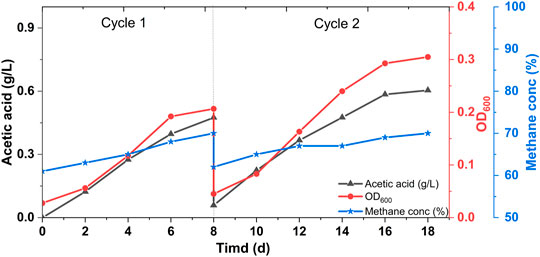
FIGURE 1. Microbial growth (in terms of OD600), acetic acid and methane concentration profiles of the MES reactors fed with biogas in batch mode experiments.
Since the inoculum source contains mainly Acetobacterium spp. that follow the Wood-Ljungdahl pathway for CO2 fixation, microbial growth and acetic acid concentration are directly correlated. The maximum titer achieved was 0.6 ± 0.1 g/L with a production rate of 0.06 ± 0.001 g/L/d (Figure 1). Along with the acetic acid production increase in the methane content was also evident. As a result of microbial CO2 utilization from biogas, the methane concentration increased from 61 ± 3% to 71 ± 2% (Figure 1). These observations are close to the previously reported data on MES from biogas (Das and Ghangrekar, 2018). The volumetric measurement of the off-gas was not performed regularly in this study. It is important to take into account the changes in the off-gas volume during continuous experiments for the optimization and development of such processes. The batch mode operation and consistent acetic acid production for two consequent cycles suggested biocathode development with biogas feed. No microbial growth and acetic acid production were observed in control MES reactors (Supplementary Figure S2).
3.2 MES Experiments in a Continuous Mode Operation
After developing stable performing biocathodes in a fed-batch mode operation (Biocathode Development Through Batch Mode Operation), biogas was fed at different feed rates in a continuous mode. In all cases, instant microbial growth and acetic acid production were observed (Figure 2), implying successful acclimatization of the biocathode (Marshall et al., 2012). A trace amount of formic acid (up to 0.120 g/L) was also detected. As microbial growth is directly linked with organics production, the OD and acetic acid titer data correlated well (Ragsdale, 2008). Compared to the batch mode operation, the acetic acid production was considerably higher in the case of continuous feed operation. It is mainly due to the unlimited and more CO2 supply to the microbes in the continuous mode than a limited and less CO2 availability in the batch mode operation. With the highest biogas feed rate of 0.5 ml/min, the maximum acetic acid titer reached to 1.5 ± 0.5 g/L with a volumetric production rate of 0.107 ± 0.02 g/L/d and a cathode surface area-based rate of 27 ± 9 g/m2/d after 14 days (Figure 2A). The acetic acid production was leveled off after 10 days. For 0.3 ml/min feed rate, the maximum acetic acid titer was 2.5 g/L with a production rate of 0.17 ± 0.3 g/L/d and a cathode surface area-based rate of 46 ± 7 g/m2/d (Figure 2B). The maximum acetic acid titer of 3.4 g/L was achieved with the lowest feed rate of 0.2 ml/min (Figure 2C). It was produced at 0.23 ± 0.04 g/L/d volumetric and 60 ± 11 g/m2/d cathode surface-based rates. The acetic acid titer tends to increase with the decrease in biogas feed rates based on a 2-fold higher titer at 0.2 ml/min feed rate than 0.5 ml/min. This can be attributed to the retention and thereby microbial utilization of both CO2 and H2 (produced at the cathode) in reactors for a longer duration at the lower feed rates.
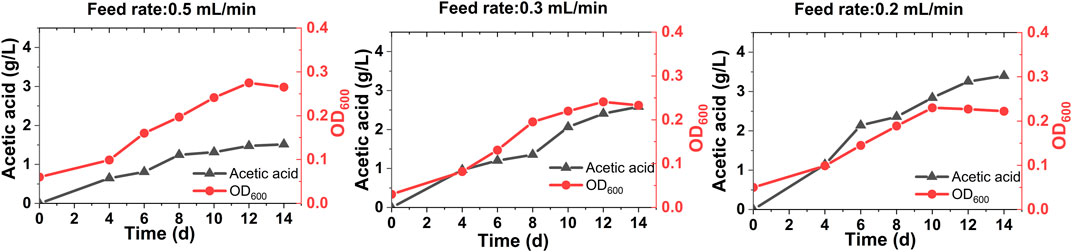
FIGURE 2. Acetic acid production and growth (as OD600) profiles of the MES reactors fed with biogas in a continuous mode at different feed rates of 0.5 ml/min (A), 0.3 ml/min (B) and 0.2 ml/min (C).
3.3 Biogas Upgradation
The methane concentration in the off-gas was analyzed at a regular time interval in a continuous mode operation. No methane upgradation was observed in the case of control MES reactors (Supplementary Figure S2). Irrespective of the feed rates, an increase in methane content was prominent in all cases (Figure 3). Since microbes utilized CO2 present in biogas as the sole carbon source, the methane content started to get enriched from the very beginning of the reactor operation at different feed rates.
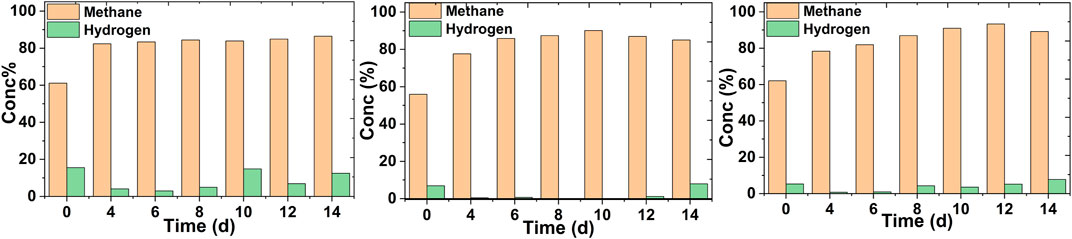
FIGURE 3. Methane concentration profiles in the off-gas of the MES reactors fed with biogas continuously at different feed rates of 0.5 ml/min (A), 0.3 ml/min (B) and 0.2 ml/min (C).
At the highest feed rate, the methane concentration increased from 62 ± 3 to 82 ± 2% on the 4th day (Figure 3A) and remained within that range thereafter. A maximum methane concentration of 84 ± 2% was observed on the 14th day. The hydrogen concentration was mostly about 12% in the off-gas. Most of the hydrogen was getting flushed out in the off-gas due to the higher feed rate. A significant increase in the methane content from 55 ± 6 to 90 ± 4% was seen at a 0.3 ml/min feed rate after the 10th day (Figure 3B). Hydrogen was mostly utilized in this particular case and was detected when methane concentration was lower. The highest methane concentration was observed with the lowest feed rate after the 12th day (from 62 ± 4 to 93 ± 3%) (Figure 3C). After that, the methane concentration remained almost at the same level. The hydrogen concentration remained at a low level (<7%) in this case. The methane concentration enhancement was pronounced in the case of both 0.3 and 0.2 ml/min feed rates. This can be justified by the fact that at lower feed rates, microbes are able to utilize most of the carbon source for growth and acetic acid production (MES Experiments in a Continuous Mode Operation). With the goal of futuristic green fuel, a combination of hydrogen and methane can be more promising (Nanthagopal et al., 2011).
3.4 Electrochemical Analysis of the Biocathodes
In the case of control MES reactors, the reduction current was almost negligible (Supplementary Figure S3). A significant increase in reduction current was observed with all feed rates, and it was maximum for the lowest feed rate. These observations align well with the acetic acid production data (Supplementary Section S4, Supplementary Figure S4). Cyclic voltammograms (CVs) were recorded at different experimental conditions. The blank CV was performed before inoculation, and the inoculated and biocathode CVs were performed just after microbial source inoculation and at the end of the cycle, respectively. No redox peaks in the blank CV indicate the absence of any redox-active moieties at the cathode surface or in the catholyte in the uninoculated condition (Figure 4). By comparing blank CV with biocathode CV, it can be seen that the H2 evolution potential of biocathode is higher than the bare cathode (−0.95 V). For different feed rates of 0.5, 0.3 and 0.2 ml/min, the H2 evolution potentials are −0.92, −0.77 and −0.76 V. The shift is most prominent (∼0.2 V) in case of the lower feed rates (Figure 4C). This observation aligns well with the acetic acid production and methane upgradation data (Figures 2, 3).
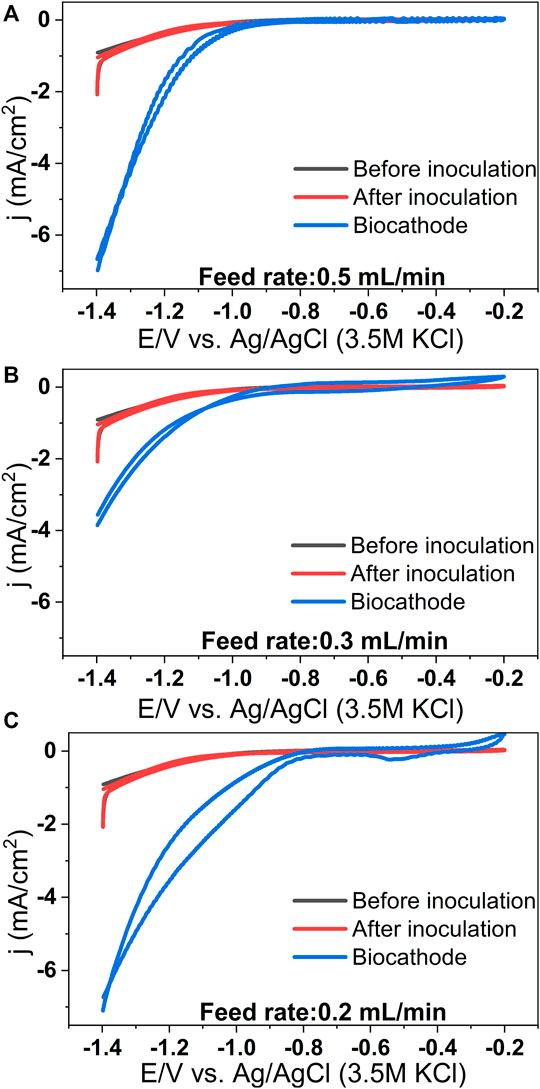
FIGURE 4. Representative cyclic voltammograms recorded at different conditions for the MES reactors operated at biogas feed rates of 0.5 ml/min (A), 0.3 ml/min (B) and 0.2 ml/min (C). (Scan rate: 1 mV/s).
The shift in H2 evolution potential suggests lowering of the H2 evolution over-potential at the biocathode due to the presence of microbes. Moreover, the reduction current drawn at any cathode potential is higher in the case of biocathode than the abiotic cathode due to the presence of microbial catalysts. For instance, at −1 V, the current density (in mA/cm2) of biocathodes are −0.3 (for 0.5 ml/min), −0.4 (for 0.3 ml/min), and −1.2 (for 0.2 ml/min) in comparison to −0.08 mA/cm2 of the bare cathode. Similar findings have been reported for CO2 reducing biocathodes earlier (Jiang et al., 2013; Jourdin et al., 2015a; Patil et al., 2015a; Bajracharya et al., 2015). The improved electrocatalytic activity and decreased H2 evolution overpotential can be attributed to microbial activity at the cathode of the MES systems (Rozendal et al., 2008; Jourdin et al., 2015a; Patil et al., 2015a).
3.5 Lower Biogas Feed Rate Favors Efficient Bioproduction and Methane Enrichment
3.5.1 Biogas Upgradation and Acetic Acid Bioproduction
Based on the observations of this study, it is evident that the lower biogas feed rate promotes better bioproduction and methane content increase. High feed rates ensure non-limiting carbon supply in the reactor. At the same time, it decreases the retention time of gases in the bulk phase. As a result, the CO2 (present in the biogas) remains for a short time in the reactor. On the other hand, though carbon supply decreases with the lower feed rate, the retention time of gases is more in the bulk phase. In the case of higher feed rates, the H2 produced in the cathode also gets removed readily from the system. It can influence the performance of acetogens that use H2 as the energy source for CO2 reduction. Hence, an optimum trade-off between the flow rate and key production parameters needs to be established through dedicated process optimization studies for the continuously fed systems. With the lower feed rate, a maximum titer of 3.4 ± 0.6 g/L was achieved along with a methane upgradation to 93 ± 3%. These values are comparable with the previous studies conducted with biogas. For example, 98% methane upgradation was reported via electromethanogensis by Bo and coworkers in a single chamber reactor which was coupled with an anaerobic digester (Bo et al., 2014). Liu et al. have also reported 96% methane upgradation by coupling electromethanogensis with anaerobic digester (Liu et al., 2016). Even 97% and higher methane concentrations have been achieved with modified reactor set up (Luo and Angelidaki, 2012; Jin et al., 2017; Kokkoli et al., 2018). In terms of acetic acid titer, this study is at par with previous studies with biogas as a carbon source (Das et al., 2021).
3.5.2 Coulombic Efficiency
Coulombic efficiency (CE) is the percentage of electrons recovered in the target product (Bajracharya et al., 2015; Patil et al., 2015b). A higher CE portrays an efficient MES system where microbes are able to utilize most of the electrons for product formation. In this study, coulombic efficiencies were quite comparable in all three conditions (Table 1). The highest CE of 90 ± 1% in acetic acid was achieved at 0.3 ml/min along with 0.7 ± 0.03% and 3.2 ± 1.1% electron recovery in H2 and biomass respectively. With the lowest feed rate, the CE was 84 ± 7% in acetic acid, 2.7 ± 0.6% in biomass and 0.5 ± 0.04% in H2. At the high feed rate the CE achieved in acetic acid, biomass and H2 was 82 ± 1% 3.7 ± 1.8% and 1.7 ± 0.03%, respectively. These data suggest an efficient electron recovery in acetic acid at all conditions.
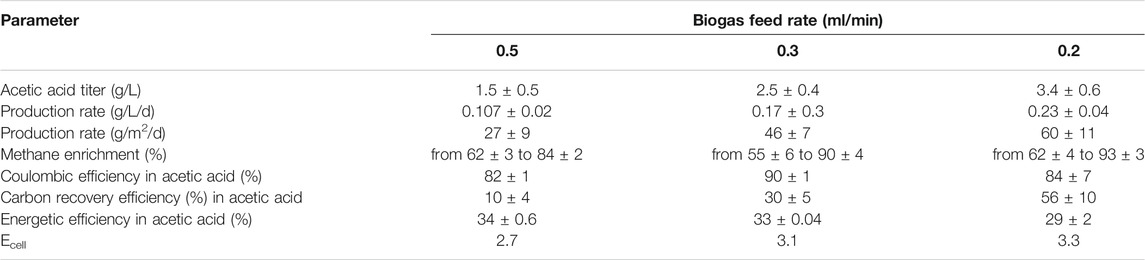
TABLE 1. Comparison of key production parameters at different biogas feed rates.
3.5.3 Carbon Recovery Efficiency
Carbon recovery efficiency (CRE) is an important parameter to estimate carbon sequestration in the form of the produced organic product. In this study, CO2 was mainly recovered in the form of acetic acid. From Table 1, it is clear that CRE is reversely proportional to the biogas feed rate. The maximum carbon recovery of 56 ± 10% was obtained with the lowest feed rate followed by 30 ± 5% for 0.3 ml/min and 10 ± 4% at 0.5 ml/min. Similar findings were also reported by Das and coworkers, where 20% CRE was reported with the high biogas feed rates of 3.5 ml/min (Das et al., 2020).
3.5.4 Energetic Efficiency
Energetic efficiency (EE) elucidates the overall energy requirement of the MES system. It helps to determine the overall operational cost of the MES system. EE is one of the critical bottlenecks that limit the effectiveness of the MES process (Prévoteau et al., 2020). The higher the EE, the better efficient the MES system will be to produce the product of interest. In this study around 34 ± 0.6%, 33 ± 0.04%, and 29 ± 2% energetic efficiency was achieved at 0.5, 0.3 and 0.2 ml/min biogas feed rates, respectively (Table 1). A similar range (35–42%) has been observed in previous MES studies but with pure CO2 feed (Labelle and May, 2017).
When comparing the overall efficiencies, it is clear that though a lower feed rate of 0.2 ml/min leads to better CRE, in terms of CE and EE, higher feed rates outperformed the lower feed rate. These observations suggest a trade-off among efficiencies at different feed rates, which needs to be understood better and optimized through further research.
3.6 Microbial Community Data
Acetobacterium, Desulfovibrio, Sulfurospirillum, and Lentimicrobium genera dominated the mixed culture (Figure 5). The relative sequence abundance of different microbial genera changed according to conditions. For example, the relative abundance of Acetobacterium increased in the MES reactors (38 ± 3%) compared to the inoculum source (9%). The relative sequence abundance of Sulfurospirillum was prominent in the inoculum source (16%) and bulk phase of reactors (12 ± 1%) but less at the cathodes (3 ± 2%). In the MES reactors, Acetobacterium spp. was the most dominant genus with a relative abundance of 18 ± 2% in the bulk phase and 19 ± 2% on the biocathode. This genus is known as acetogens for its H2 and CO2 fixing abilities into acetic acid (Ragsdale, 2008). Its primary function is to fix CO2 through the Wood-Ljungdahl pathway for energy conservation and synthesize acetyl-CoA and biomass (Labelle et al., 2020). This genus played a likely role in acetic acid production in this study (MES Experiments in a Continuous Mode Operation). Another dominant genus Sulfurospirillum is microaerophilic, which means that they can scavenge small amounts of O2 that may get transferred from the anode to the cathode chamber. Thus anaerobic conditions in the MES reactors can be maintained (Goris et al., 2014). As they can oxidize acetic acid using O2 as the electron acceptor, the acetic acid titer may decrease slightly (Labelle et al., 2020). As there are more chances of O2 presence in the bulk phase, its abundance is higher in the bulk phase compared to the cathode.
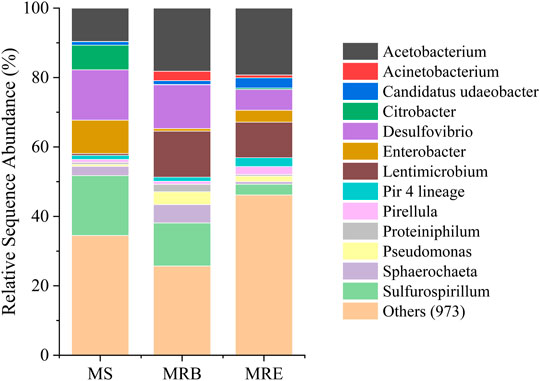
FIGURE 5. 16S rRNA sequencing-based microbial community composition at the genus level in the CO2 fixing microbial inoculum source (MS) used in microbial electrosynthesis (MES) experiments, along with the MES biocathode (MRE) and MES bulk phase (MRB) samples. For MRE and MRB, the average data of duplicates are presented.
Desulfovibrio was one of the dominant genera in this study, with a relative abundance of 14%, 12 ± 1%, and 6 ± 2% at the inoculum source, bulk phase, and biocathode, respectively. These sulfate reducers are capable of direct electron transfer (Aulenta et al., 2012). They can also facilitate H2 and formate production with the help of cytochromes, hydrogenases, and formate dehydrogenase (Labelle et al., 2020). These can then be utilized as an energy source by the acetogens present in the MES system. Lentimicrobium genus was found to be dominant in the MES reactors. In the inoculum source, its relative abundance was only 0.5%. Its relative abundance increased to 13 ± 1% and 10 ± 1% in the MES reactor bulk phase and biocathode, respectively. It is a genus of strict anaerobic bacterium previously reported in biogas upgradation studies (González-Cortés et al., 2021). It has also been reported for acetic acid production under certain conditions (Sun et al., 2016). Apart from these genera, Pseudomonas was also present at a low relative abundance of up to ∼3.5 ± 0.5% in bulk phase and ∼1.5 ± 1% in biocathode. It is known for hydrogen production via electron transfer through redox mediators as well as hydrogenase enzymes and has been reported in bioelectrochemical reactors (Mateos et al., 2019). Some other bacterial genera, namely, Pirellula, Sphaerochaeta and Enterobacter, were also observed in very low abundances, whose role is not very clear in MES systems.
4 Conclusion
This study demonstrates that efficient biogas upgradation through CO2 conversion into acetic acid can be achieved via MES. The lower biogas feed rates performed best in terms of methane upgradation as well as acetic acid production. A considerable decrease in H2 evolution potential and increase in reduction current suggested the role of microbes in the electrocatalysis process. Acetobacterium spp. and Desulfovibrio spp. dominated both the bulk phase as well as biocathode. The demonstrated biogas upgradation approach offers the advantage of obtaining two products in different phases: one in the bulk phase (acetic acid) and the other in the off-gas (methane). It puts us one step forward for direct utilization of MES for onsite biogas upgradation.
Data Availability Statement
The datasets presented in this study can be found in online repositories. The names of the repository/repositories and accession number(s) can be found below: https://www.ncbi.nlm.nih.gov/, PRJNA659908.
Author Contributions
SAP conceived the study and MR contributed to the design of the study. MR conducted the experiments and wrote the first draft of the manuscript. SY contributed to data analysis and wrote the microbial community section of the manuscript. All authors contributed to manuscript revision, read, and approved the submitted version.
Funding
All authors acknowledge the financial support by the Department of Biotechnology (DBT), Government of India, through project no. BT/PR28914/BCE/8/1441/2018.
Conflict of Interest
The authors declare that the research was conducted in the absence of any commercial or financial relationships that could be construed as a potential conflict of interest.
Publisher’s Note
All claims expressed in this article are solely those of the authors and do not necessarily represent those of their affiliated organizations, or those of the publisher, the editors and the reviewers. Any product that may be evaluated in this article, or claim that may be made by its manufacturer, is not guaranteed or endorsed by the publisher.
Acknowledgments
The authors thank the authorities of the sewage treatment plant (Phase 3, Panchkula, Haryana) for biogas samples. MR and SY are grateful to IISER Mohali for the Ph.D. scholarship. All authors are grateful to Mr. Prathamesh Balasaheb Pol for his experimental assistance. The technical support by Dr. Vinayak Sinha and his research team in collecting the biogas samples is highly appreciated.
Supplementary Material
The Supplementary Material for this article can be found online at: https://www.frontiersin.org/articles/10.3389/fenrg.2021.759678/full#supplementary-material
References
Angelidaki, I., Treu, L., Tsapekos, P., Luo, G., Campanaro, S., Wenzel, H., et al. (2018). Biogas Upgrading and Utilization: Current Status and Perspectives. Biotechnol. Adv. 36, 452–466. doi:10.1016/j.biotechadv.2018.01.011
Aulenta, F., Catapano, L., Snip, L., Villano, M., and Majone, M. (2012). Linking Bacterial Metabolism to Graphite Cathodes: Electrochemical Insights into the H2-Producing Capability of Desulfovibrio Sp. ChemSusChem 5, 1080–1085. doi:10.1002/cssc.201100720
Bajracharya, S., Ter Heijne, A., Dominguez Benetton, X., Vanbroekhoven, K., Buisman, C. J. N., Strik, D. P. B. T. B., et al. (2015). Carbon Dioxide Reduction by Mixed and Pure Cultures in Microbial Electrosynthesis Using an Assembly of Graphite Felt and Stainless Steel as a Cathode. Bioresour. Tech. 195, 14–24. doi:10.1016/j.biortech.2015.05.081
Bo, T., Zhu, X., Zhang, L., Tao, Y., He, X., Li, D., et al. (2014). A New Upgraded Biogas Production Process: Coupling Microbial Electrolysis Cell and Anaerobic Digestion in Single-Chamber, Barrel-Shape Stainless Steel Reactor. Electrochem. Commun. 45, 67–70. doi:10.1016/j.elecom.2014.05.026
Das, S., and Ghangrekar, M. M. (2018). Value Added Product Recovery and Carbon Dioxide Sequestration From Biogas Using Microbial Electrosynthesis. Indian J. Exp. Biol. 56, 470–478.
Das, S., Chatterjee, P., and Ghangrekar, M. M. (2018). Increasing Methane Content in Biogas and Simultaneous Value Added Product Recovery Using Microbial Electrosynthesis. Water Sci. Technol. 77, 1293–1302. doi:10.2166/wst.2018.002
Das, S., Das, I., and Ghangrekar, M. M. (2020). Role of Applied Potential on Microbial Electrosynthesis of Organic Compounds through Carbon Dioxide Sequestration. J. Environ. Chem. Eng. 8, 104028. doi:10.1016/j.jece.2020.104028
Das, S., Das, S., and Ghangrekar, M. M. (2021). Application of TiO2 and Rh as Cathode Catalyst to Boost the Microbial Electrosynthesis of Organic Compounds through CO2 Sequestration. Process Biochem. 101, 237–246. doi:10.1016/j.procbio.2020.11.017
Dere, A. J., Kalbande, S. R., and Khambalkar, V. P. (2017). Recent Review on Biogas Production from Different Waste. Int.J.Curr.Microbiol.App.Sci. 6, 3452–3457. doi:10.20546/ijcmas.2017.610.407
Engerer, H., and Horn, M. (2010). Natural Gas Vehicles: An Option for Europe. Energy Policy 38, 1017–1029. doi:10.1016/j.enpol.2009.10.054
Evans, P. N., Boyd, J. A., Leu, A. O., Woodcroft, B. J., Parks, D. H., Hugenholtz, P., et al. (2019). An Evolving View of Methane Metabolism in the Archaea. Nat. Rev. Microbiol. 17, 219–232. doi:10.1038/s41579-018-0136-7
González-Cortés, J. J., Almenglo, F., Ramírez, M., and Cantero, D. (2021). Simultaneous Removal of Ammonium from Landfill Leachate and Hydrogen Sulfide from Biogas Using a Novel Two-Stage Oxic-Anoxic System. Sci. Total Environ. 750. 141664 doi:10.1016/j.scitotenv.2020.141664
Goris, T., Schubert, T., Gadkari, J., Wubet, T., Tarkka, M., Buscot, F., et al. (2014). Insights into Organohalide Respiration and the Versatile Catabolism ofSulfurospirillum Multivoransgained from Comparative Genomics and Physiological Studies. Environ. Microbiol. 16, 3562–3580. doi:10.1111/1462-2920.12589
Jiang, Y., Su, M., Zhang, Y., Zhan, G., Tao, Y., and Li, D. (2013). Bioelectrochemical Systems for Simultaneously Production of Methane and Acetate from Carbon Dioxide at Relatively High Rate. Int. J. Hydrogen Energ. 38, 3497–3502. doi:10.1016/j.ijhydene.2012.12.107
Jin, X., Zhang, Y., Li, X., Zhao, N., and Angelidaki, I. (2017). Microbial Electrolytic Capture, Separation and Regeneration of CO2 for Biogas Upgrading. Environ. Sci. Technol. 51, 9371–9378. doi:10.1021/acs.est.7b01574
Jourdin, L., Freguia, S., Donose, B. C., and Keller, J. (2015a). Autotrophic Hydrogen-Producing Biofilm Growth Sustained by a Cathode as the Sole Electron and Energy Source. Bioelectrochemistry 102, 56–63. doi:10.1016/j.bioelechem.2014.12.001
Jourdin, L., Grieger, T., Monetti, J., Flexer, V., Freguia, S., Lu, Y., et al. (2015b). High Acetic Acid Production Rate Obtained by Microbial Electrosynthesis from Carbon Dioxide. Environ. Sci. Technol. 49, 13566–13574. doi:10.1021/acs.est.5b03821
Kadam, R., and Panwar, N. L. (2017). Recent Advancement in Biogas Enrichment and its Applications. Renew. Sustain. Energ. Rev. 73, 892–903. doi:10.1016/j.rser.2017.01.167
Kokkoli, A., Zhang, Y., and Angelidaki, I. (2018). Microbial Electrochemical Separation of CO2 for Biogas Upgrading. Bioresour. Tech. 247, 380–386. doi:10.1016/j.biortech.2017.09.097
Labelle, E. V., and May, H. D. (2017). Energy Efficiency and Productivity Enhancement of Microbial Electrosynthesis of Acetate. Front. Microbiol. 8, 756. doi:10.3389/fmicb.2017.00756
Labelle, E. V., Marshall, C. W., and May, H. D. (2020). Microbiome for the Electrosynthesis of Chemicals from Carbon Dioxide. Acc. Chem. Res. 53, 62–71. doi:10.1021/acs.accounts.9b00522
Liu, W., Cai, W., Guo, Z., Wang, L., Yang, C., Varrone, C., et al. (2016). Microbial Electrolysis Contribution to Anaerobic Digestion of Waste Activated Sludge, Leading to Accelerated Methane Production. Renew. Energ. 91, 334–339. doi:10.1016/j.renene.2016.01.082
Luo, G., and Angelidaki, I. (2012). Integrated Biogas Upgrading and Hydrogen Utilization in an Anaerobic Reactor Containing Enriched Hydrogenotrophic Methanogenic Culture. Biotechnol. Bioeng. 109, 2729–2736. doi:10.1002/bit.24557
Marshall, C. W., Ross, D. E., Fichot, E. B., Norman, R. S., and May, H. D. (2012). Electrosynthesis of Commodity Chemicals by an Autotrophic Microbial Community. Appl. Environ. Microbiol. 78, 8412–8420. doi:10.1128/AEM.02401-12
Mateos, R., Sotres, A., Alonso, R. M., Morán, A., and Escapa, A. (2019). Enhanced CO2 Conversion to Acetate through Microbial Electrosynthesis (MES) by Continuous Headspace Gas Recirculation. Energies 12, 3297. doi:10.3390/en12173297
Nanthagopal, K., Subbarao, R., Elango, T., Baskar, P., and Annamalai, K. (2011). Hydrogen Enriched Compressed Natural Gas (HCNG): A Futuristic Fuel for Internal Combustion Engines. Therm. Sci. 15 (4), 1145–1154. doi:10.2298/TSCI100730044N
Patil, S. A., Arends, J. B. A., Vanwonterghem, I., Van Meerbergen, J., Guo, K., Tyson, G. W., et al. (2015a). Selective Enrichment Establishes a Stable Performing Community for Microbial Electrosynthesis of Acetate from CO2. Environ. Sci. Technol. 49, 8833–8843. doi:10.1021/es506149d
Patil, S. A., Gildemyn, S., Pant, D., Zengler, K., Logan, B. E., and Rabaey, K. (2015b). A Logical Data Representation Framework for Electricity-Driven Bioproduction Processes. Biotechnol. Adv. 33, 736–744. doi:10.1016/j.biotechadv.2015.03.002
Prévoteau, A., Carvajal-Arroyo, J. M., Ganigué, R., and Rabaey, K. (2020). Microbial Electrosynthesis from CO2: Forever a Promise? Curr. Opin. Biotechnol. 62, 48–57. doi:10.1016/j.copbio.2019.08.014
Ragsdale, S. W. (2008). Enzymology of the Wood-Ljungdahl Pathway of Acetogenesis. Ann. N. Y. Acad. Sci. 1125, 129–136. doi:10.1196/annals.1419.015
Roy, M., Yadav, R., Chiranjeevi, P., and Patil, S. A. (2021). Direct Utilization of Industrial Carbon Dioxide with Low Impurities for Acetate Production via Microbial Electrosynthesis. Bioresour. Tech. 320, 124289. doi:10.1016/j.biortech.2020.124289
Rozendal, R. A., Jeremiasse, A. W., Hamelers, H. V. M., and Buisman, C. J. N. (2008). Hydrogen Production with a Microbial Biocathode. Environ. Sci. Technol. 42, 629–634. doi:10.1021/es071720+
Sahota, S., Shah, G., Ghosh, P., Kapoor, R., Sengupta, S., Singh, P., et al. (2018). Review of Trends in Biogas Upgradation Technologies and Future Perspectives. Bioresour. Tech. Rep. 1, 79–88. doi:10.1016/j.biteb.2018.01.002
Schröder, U., Harnisch, F., and Angenent, L. T. (2015). Microbial Electrochemistry and Technology: Terminology and Classification. Energy Environ. Sci. 8, 513–519. doi:10.1039/c4ee03359k
Sravan, J. S., Sarkar, O., and Mohan, S. V. (2020). Electron-regulated Flux towards Biogas Upgradation - Triggering Catabolism for an Augmented Methanogenic Activity. Sustain. Energ. Fuels 4, 700–712. doi:10.1039/c9se00604d
Sun, L., Toyonaga, M., Ohashi, A., Tourlousse, D. M., Matsuura, N., Meng, X.-Y., et al. (2016). Lentimicrobium Saccharophilum Gen. nov., Sp. nov., a Strictly Anaerobic Bacterium Representing a New Family in the Phylum Bacteroidetes, and Proposal of Lentimicrobiaceae Fam. Nov. Int. J. Syst. Evol. Microbiol. 66, 2635–2642. doi:10.1099/ijsem.0.001103
Thiruselvi, D., Kumar, P. S., Kumar, M. A., Lay, C.-H., Aathika, S., Mani, Y., et al. (2021). A Critical Review on Global Trends in Biogas Scenario with its Up-Gradation Techniques for Fuel Cell and Future Perspectives. Int. J. Hydrogen Energ. 46, 16734–16750. doi:10.1016/j.ijhydene.2020.10.023
Wang, H., Du, H., Zeng, S., Pan, X., Cheng, H., Liu, L., et al. (2021). Explore the Difference between the Single-Chamber and Dual-Chamber Microbial Electrosynthesis for Biogas Production Performance. Bioelectrochemistry 138, 107726. doi:10.1016/j.bioelechem.2020.107726
Keywords: biocathode, Acetobacterium, methane, electricity-driven bioproduction, bioelectrochemical systems (BES)
Citation: Roy M, Yadav S and Patil SA (2021) Biogas Upgradation Through CO2 Conversion Into Acetic Acid via Microbial Electrosynthesis. Front. Energy Res. 9:759678. doi: 10.3389/fenrg.2021.759678
Received: 16 August 2021; Accepted: 20 October 2021;
Published: 03 November 2021.
Edited by:
Uwe Schröder, University of Greifswald, GermanyReviewed by:
Falk Harnisch, Helmholtz Centre for Environmental Research (UFZ), GermanyMohammad Zain Khan, Aligarh Muslim University, India
Copyright © 2021 Roy, Yadav and Patil. This is an open-access article distributed under the terms of the Creative Commons Attribution License (CC BY). The use, distribution or reproduction in other forums is permitted, provided the original author(s) and the copyright owner(s) are credited and that the original publication in this journal is cited, in accordance with accepted academic practice. No use, distribution or reproduction is permitted which does not comply with these terms.
*Correspondence: Sunil A. Patil, c3VuaWxAaWlzZXJtb2hhbGkuYWMuaW4=, c3VuaWxtaWNybzEyQGdtYWlsLmNvbQ==