 Xiangpeng Meng
 Yuanyuan Liu1*
 Bin Wu
- 1Key Laboratory of Beam Technology of Ministry of Education, College of Nuclear Science and Technology, Beijing Normal University, Beijing, China
- 2Department of Physics, Beijing Normal University, Beijing, China
To address the urgent need for the retrospective assessment of the health conditions of people with a history of appreciable radon exposure, a novel technique that directly measures the characteristic γ-rays emitted from Pb-210 in the living skull was developed. Since the first pioneering study in 1968, this technique has experienced continued advancement over more than half a century, where the limit of detection of Pb-210 is a common criterion to assess the performance of the measuring devices. However, researchers have defined the limit of detection in assorted ways, and the measurement conditions often greatly differ from study to study, both of which significantly challenge interstudy comparisons and obscure how various factors make their impacts. In this work, we reanalyze the reported results in the literature according to the minimum detectable activity (MDA) defined by Currie and investigate the effects of key elements therein. Firstly, we focus on the reported background count rates and analyze their dependence on detector’s energy resolution and active area. Secondly, we turn to the reported calibration factors and conduct analysis in the same manner. Thirdly, we calculate MDA for each study and monitor its dependence on the active area of detector and measurement duration. In the limit of the largest achievable active area (∼75000 mm2), it is found that the asymptotic MDA is approximately 6 (4) Bq and 15 (11) Bq under 30 (60) min measurement using NaI-CsI scintillator and HPGe semiconductor detectors, respectively. Finally, we discuss these asymptotic MDA in the context of estimated Pb-210 activity in the skull resulted from a hypothetical history of radon exposure.
Introduction
Radon (Rn-222) is a rare gas with radioactivity. It is derived from uranium decay series and is widely present in nature. In particular, radon is enriched in basements and mines, where air circulation is commonly poor and the environment is surrounded by soils or rocks that contain high concentrations of uranium (∼thousands of Bq/m3) (Cevik et al., 2010; Cevik et al., 2011; Somlai et al., 2011; Meng et al., 2015; Fijałkowska Lichwa, 2016; Sahu et al., 2016; Sun et al., 2020; Kojo et al., 2021). Once radon is inhaled, the alpha particles emanating from the radon and its daughters inevitably deposit energy in the lungs, thereby causing radiation damage to the lung tissues (Black et al., 1968; Blanchard et al., 1969; Wahl et al., 2000; Momcilovic et al., 2001; Pillalamarri et al., 2013). The cumulative effects of such radiation damage from long-term living or working in a high radon environment greatly increase the risk of lung cancer (WHO, 2009). This is arguably the leading reason why the probability of lung cancer among miners is much higher than that of the general public. Accordingly, the World Health Organization (WHO) has listed radon as a class I carcinogen and identified it as the second leading cause of lung cancer, next only to smoking.
It is thus desirable to determine the potential alpha energy exposure (PAEE) of individuals with a history of substantial radon exposure, e.g., miners, so that retrospective assessments of their health conditions can be performed in a timely manner. Currently, the dominant method of reconstructing PAEE relies on two factors, namely radon concentration onsite and the estimated duration of exposure (UNSCEAR, 2019; Tomasek, 2020). For example, the working level month (WLM) represents the cumulative exposure of an individual working 170 h in total in an environment with an emission of 1.3 × 10⁵ MeV potential alpha energy per liter from short-lived daughters of radon (Black et al., 1968; Blanchard et al., 1969). However, this method suffers from large uncertainties because radon activity in the environment often strongly fluctuates over time and locations, the human respiration rate may differ significantly among individuals, and residence time in a high radon environment often depends on subjective recollection, which may considerably deviate from reality (Laurer et al., 1993).
In contrast, reconstructing the cumulative radon intake of a tested person based on the direct measurement of Pb-210 activity in the living skull is a very promising, cutting-edge method. Its scientific basis can be briefly described as follows: Pb-210 is a relatively stable nuclide formed after short-term decay of Rn-222, and its half-life is ∼22 years, as shown in Figure 1. Since lead is a chemical congener of calcium, its biodynamic characteristics in the human body are very similar to those of Ca (ICRP, 1993; Dantas et al., 2006); hence, the Pb-210 formed from the decay of radon that has been inhaled shall ultimately transport to the bones and distribute evenly among them. In other words, the bones can act as a good “dosimeter” (Laurer et al., 1999), and the activity of Pb-210 contained therein directly reflect individual’s cumulative exposure to radon. Among the many bones, the skull has the largest surface area (Estrada et al., 1993), accounting for approximately 13–15% of the total bone mass (ICRP, 1975; Wahl et al., 2000). Moreover, its upper epidermis is relatively thin, and the difference between individuals is small. Therefore, it is the best choice for Pb-210 activity measurement in vivo (Cohen et al., 1977).
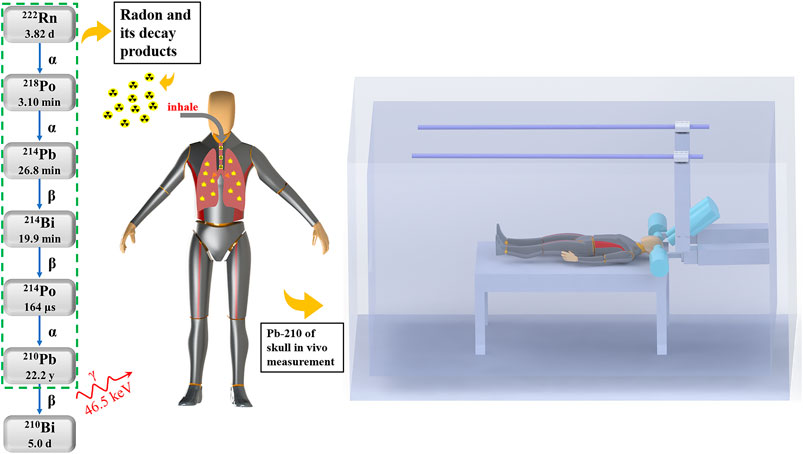
FIGURE 1. Schematic diagrams of the radon decay chain, inhalation of radon and its decay products, and the Pb-210 in vivo measurement device, where four high purity germanium (HPGe) detectors are positioned around the head of a tested person inside the shielding room.
Admittedly, there are indeed potentially large uncertainties underlying this approach, because there can be assorted sources contributing to the Pb-210 activity in the skull other than radon (Laurer et al., 1999). However, we are strong confident that this approach promises great potential for the following three reasons: Firstly, the associated uncertainty can be reasonably suppressed through carefully setting up the control group for measurements; secondly, the Pb-210 activity originating from other sources becomes trivial comparing to radon when the person of interest had been subject to substantial radon exposure (see Discussion for more details). Thirdly, in many cases, the Pb-210 in vivo measurement could be the only viable measure to reconstruct one’s radon intake, as the radon concentration may not be available.
In 1968, Eisenbud et al. first verified the feasibility of this idea by directly measuring the characteristic γ-rays emitted by Pb-210 in the living skull of miners (Eisenbud et al., 1969). Following this pioneering study, the technique of Pb-210 in vivo measurements has attracted considerable interests from researchers all around the world and enjoyed continued advancement in the past 50 years (Cohen et al., 1973; Cohen et al., 1977; Zheng et al., 1992; Estrada et al., 1993; Laurer et al., 1993; Scheler et al., 1998; Wahl et al., 2000; Muikku et al., 2003; Dantas et al., 2006; Dantas et al., 2007; Pillalamarri et al., 2013). It is generally consent that the detection of Pb-210 in vivo is extremely subject to the background interference because the activity of Pb-210 in the skull is often very low (∼10 Bq) (Wahl et al., 2000; Dantas et al., 2007), the branching ratio of γ decay is as low as 4.25%, and the energy of released γ-rays is only 46.5 keV, thereby characterizing poor penetrating capability. Consequently, researchers often adopt the limit of detection to assess the sensitivity of their measuring devices. Nonetheless, throughout the literature, researchers have defined the limit of detection in a variety of ways (Altshuler et al., 1963; Isenhour et al., 1964; Kirkpatrick et al., 2013; Done et al., 2016), which severely compound the interstudy comparison and obscure how various factors make their impacts. To unravel this challenge, we resort to the concept of minimum detectable activity (MDA) defined by Currie (Currie, 1968) and reanalyze the data reported in the literature. The results presented in this work clearly demonstrate how key factors, such as detector’s active area and energy resolution, background level, and measurement time, influence MDA and thus shed light on the future direction for further improvement.
The rest of this article is organized as follows: in MDA Derivation, we demonstrate the derivation of MDA and identify the critical factors therein; in Results and Discussion, we present the key figures from the literature and reanalyze the reported data; we make concluding remarks in Conclusion.
MDA Derivation
The derivation of MDA was described in detail in Currie’s classical article (Currie, 1968), which we briefly recapitulate below. We note that the MDAISO defined by the ISO standard has also been widely used in many studies (ISO, 2010). Comparing with Currie’s MDA, the ISO standard takes the uncertainty in the calibration factor into account. In this regard, MDAISO is admittedly more rigorous. Nonetheless, there are two reasons for adopting MDACurrie in our study: First, among the studies focusing on Pb-210 in vivo measurement, the uncertainty in the calibration factor was mostly not considered and thus not documented in the publication. Consequently, it become impractical to employ MDAISO in our study. Second, it has been pointed out by Kirkpatrrick that two definitions of MDA yield quite similar results when the uncertainty in the calibration factor is smaller than 10% (Kirkpatrrick et al., 2013). Because it is common to employ an anthropomorphic phantom enclosing Pb-210 with activity up to 5,000 Bq for calibration, the resultant uncertainty in the calibration factor should be fairly small. Hence, we consider two definitions of MDA should lead to essentially the same results.
Let’s imagine a general scenario, where a surveyor needs to rely on a certain measurement system to detect radiation from a sample with unknown radioactivity. First, the surveyor needs to determine the background level under the measurement conditions. Because the processes of nuclear decay, particle transportation, and radiation detection all characterize random features, the results of each measurement differ statistically. By measuring the background several times with equal measurement duration of tb, the arithmetic average of multiple measurement results and their variance can be computed, which are denoted
where it is assumed that the background statistics obey the Poisson distribution, and the principle of error propagation is used.
In the next step, the surveyor needs to perform measurements under the presence of the sample with measurement duration of ts and analyze if it contains radioactivity. Two types of errors may occur. The first type of error is misjudging that the sample is radioactive whereas in reality it isn’t. The critical level LC is a threshold set to avoid such errors under a certain confidence level. To be more specific, it equals to the upper limit of the background count under the confidence of 1−α, as shown in Figure 2, and can be expressed as below:
where k1-α represents the abscissa corresponding to the confidence interval 1−α on the standard normal distribution. The second type of error is misjudging that the sample is not radioactive whereas in reality it is. The detection limit LD is a threshold set to avoid such errors under a certain confidence level. In the similar manner, it equals to the lower limit of the total count (including background and sample) under the 1−β confidence level, as shown in Figure 2, and can be expressed as follows:
where μs represents the actual net count resulted from the sample, and k1-β has the same meaning as k1-α. Setting μs= LD and α = β leads to the following equation:
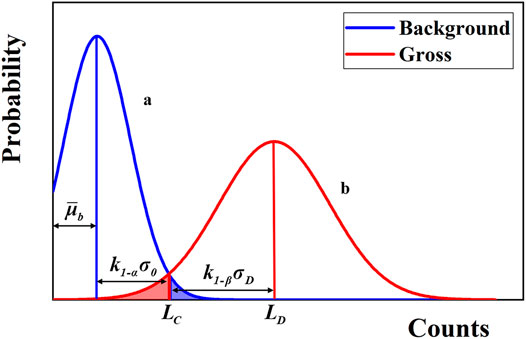
FIGURE 2. Schematic diagram of two types of errors. The Gaussian-shaped curves in blue and red represents the probability distributions of counting statistics for measurements on background and sample (under the same background), respectively. The shaded parts denote the probability of the first (blue) and second (red) type of errors, respectively.
Finally, MDA is defined by converting the decision limit LD through the calibration factor ν, namely:
where η is the probability of the sample emitting the characteristic γ-ray to be measured in one decay (i.e., branching ratio), and ε is the detection efficiency of the γ-rays by the measuring system. Note that the calibration factor ν equals to the product of η and ε. MDA thus represents the minimum activity of the sample that can be recognized by the measuring device with confidence level of k1−α through counting the characteristic γ-rays emanating from the sample under the measurement conditions including duration, detection efficiency, and background.
It should be noted that tb can be different from ts, but then the average and standard deviation of the background count need to be normalized according to ts. In addition, researchers often use single measurement to estimate the background and set the confidence level to be 95%. Under these circumstances,
Equation 6 is arguably the most commonly used expression in the field of radiation detection.
In addition to the MDA listed above, researchers also employed other quantities to evaluate the limit of detection including
The application of these various measures for limit of detection apparently causes great difficulties for comparisons among studies as shown next.
Results and Discussion
Table 1 summarizes the key features from the studies focusing on Pb-210 in vivo measurements (Eisenbud et al., 1969; Cohen et al., 1973; Cohen et al., 1977; Zheng et al., 1992; Estrada et al., 1993; Scheler et al., 1998; Wahl et al., 2000; Haninger et al., 2002; Dantas et al., 2007), including characteristics of detectors, measurement time ts, calibration factor v, and background count rate Nb.
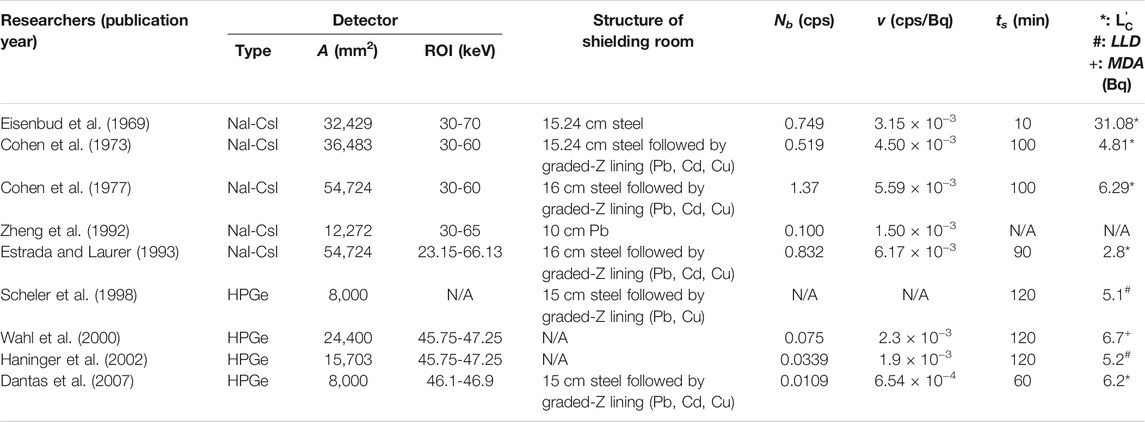
TABLE 1. Key features from the studies focusing on Pb-210 in vivo measurements.
It is first noticed that two types of detectors were commonly employed, namely NaI-CsI scintillator detectors and high-purity germanium (HPGe) semiconductor detectors. Because they characterize drastically distinct energy resolution, the region-of-interest (ROI) and its corresponding width in the measurement spectrum are dramatically different. To be more precise, the full width at the half maximum (FWHM) of the scintillator detector is ∼9 keV at 46.5 keV, and that of the semiconductor detector is ∼0.6 keV at 46.5 keV. As a result, the width of ROI for NaI-CsI detector is approximately 40 keV, whereas that for HPGe detector is roughly 2 keV. Besides energy resolution, two types of detectors also differ considerably in active area A; it is common that scintillator detectors often characterize much larger active area than HPGe detectors. On average, the active area for the studies employing NaI-CsI detectors is 4.4 × 104 mm2 while that for HPGe detectors is 2.8 × 104 mm2.
The width of ROI and active area are two critical factors that affect the limit of detection. Under a fixed level of background, it can be understood that a wider ROI would necessarily lead to a higher background count rate Nb and equivalently the background count
In addition to the detector factors, the duration of measurement also plays a considerable role. We see the measurement time varies widely among studies and is commonly set to more than 1 h. Furthermore, as shown in Table 1, researchers also employed various quantities to measure the limit of detection. In Comparison of MDA Among Studies, we rely on the reported data and unify these measures according to the MDA derived in the prior section. Moreover, we demonstrate the evolution of MDA under the variation of detector’s active area and the length of measurement.
Analysis of Background Count Rate Nb
Equation 6 clearly indicates that MDA largely depends on the radiation background. Table 1 shows that the background count rate Nb widely differs between the studies employing NaI-CsI and HPGe detectors, which is on the order of ∼10−1 and ∼10−2 cps, respectively. Such a difference is attributable to three factors, namely inherent background level, width of the ROI, and active area of detectors. We assess the influence of each factor below.
First, we normalize the background count rate by the active area of detectors as follows,
K1 thus represents the background count rate per active area of the detector, and the results are depicted in Figure 3A. It is directly recognizable that the K1 from various studies are again divided into two groups based on the types of detectors, where K1 for NaI-CsI detectors illustrated in blue is much higher than that of the HPGe detector shown in red, yielding the magnitude of ∼10−5 cps/mm2 and ∼10−6 cps/mm2, respectively.
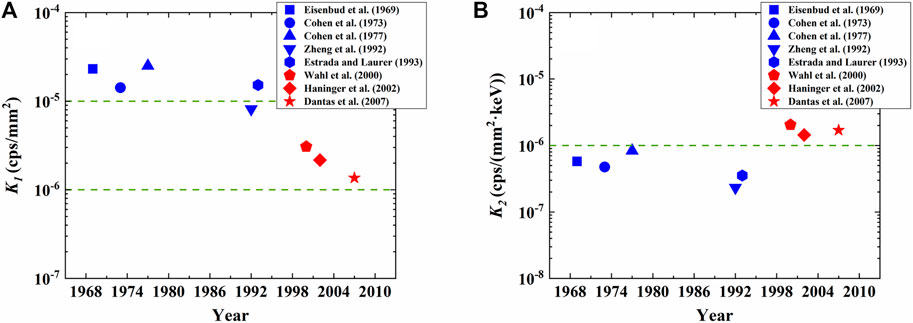
FIGURE 3. Dependence of background count rate on active area and width of ROI for various studies. In panel (A), K1 represents the background count rate per active area; in panel (B), K2 represents background count rate per active area per ROI energy.
We next normalize the K1 by the width of ROI (∆E) as follows,
K2 thus typifies the background count rate per unit area of the detector per ROI energy. It should be noted that in order to create a low radiation background environment for in vivo measurement, a shielding room made of thick metallic wall is commonly employed, as shown in Figure 1 and Table 1. Therefore, K2 mainly reflects the background level inside the shielding room, because the characteristic features that are unique to different types of detectors are mostly removed. The results shown in Figure 3B suggest that K2 from various studies is very close, characterizing the magnitude of ∼10−6 cps/(mm2·keV). This observation indicates that the background levels inside the shielding rooms are approximately the same. This is because a ∼15 cm thick steel or ∼10 cm Pb can attenuate the γ-rays from environment by 99% and the benefit of further increasing wall’s thickness is very limited (Verplancke, 1992; Cannizzaro et al., 1997; Mrdja et al., 2019). In this regard, it would be necessary to resort to other routes to further suppress background, such as active shielding through muon veto techniques (Semkow et al., 2002).
Analysis of the Calibration Factor v
In addition to the background count rate, the MDA is also strongly dependent on the detection efficiency through the calibration factor v. Because the energy of the γ-rays emitted by Pb-210 is low, only 46.5 keV, the intrinsic efficiency of the NaI-CsI (Leone et al., 2011; Meng et al., 2021) and HPGe detectors (Pillalamarri et al., 2019; Turko et al., 2020) in this energy range is very high, close to 100%. Therefore, the detection efficiency here refers to the absolute detection efficiency, which is mainly determined by the active area of the detector.
To assess the influence of active area, we follow the same normalization method to define the detection efficiency per active area of the detector, as listed below:
The results shown in Figure 4 indicate that K3 are approximately the same across various studies, showing the magnitude of ∼10−7 cps/(Bq−1·mm−2). This observation indicates that there is no significant difference between NaI-CsI and HPGe detectors in the capability of detecting Pb-210.
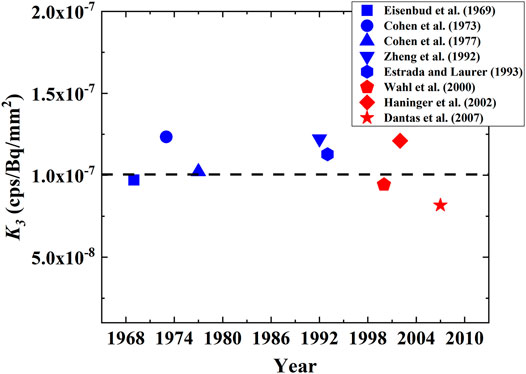
FIGURE 4. Dependence of efficiency calibration factor on the active area of detector. K3 represents detection efficiency per active area.
Comparison of MDA Among Studies
In this section, we seek to make a fair interstudy comparison by employing Currie’s MDA as the unanimous criterion of quantifying the limit of detection and to evaluate the dependence of MDA on the active area and measurement duration. We introduce K1 and K3 defined in prior sections into Eq. 6 and assume a 95 % confidence level, which gives the following expression,
The calculation results are illustrated in Figure 5, where panel (A) corresponds to 30 min measurement while panel (B) is for 1 h measurement; furthermore, each line denotes different studies and reflects the evolution of MDA in response to the variation of active area of detectors; in addition, the solid symbols represent the active areas reported in the original studies.
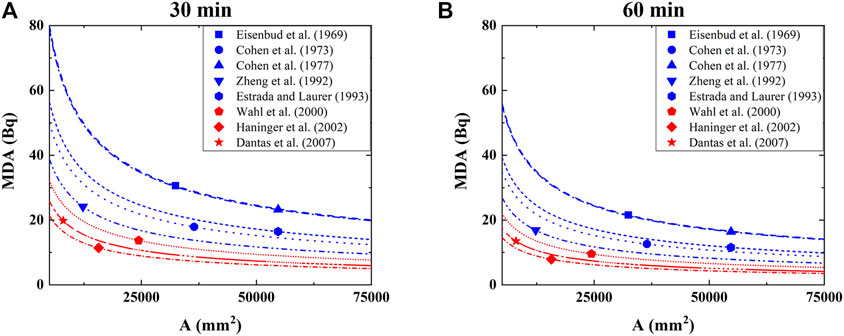
FIGURE 5. The dependence of MDA on the active area of detector and measurement time, where the filled symbols represent the active areas reported in the original studies.
Firstly, the lines corresponding to NaI-CsI detectors generally characterize higher MDA than those employing HPGe detectors under the same active area and measurement duration. Secondly, the lines are self-similar showing steep drop in the beginning and then gradually saturate as active area A continuously increases. Qualitatively speaking, when the active area of detectors has reached certain size, e.g. ∼25,000 mm2, lowering MDA by further expanding the active area of detectors becomes highly inefficient. Note that the effective surface area of the head excluding the section connected to the neck is estimated to be ∼75,000 mm2, based on which one can infer the lowest MDA achievable for each study. Under the 30 min measurement, the lowest achievable MDA using NaI-CsI detectors and HPGe detectors are ∼15 and ∼6 Bq, respectively, while under 1 h measurement, they are ∼11 and ∼4 Bq, respectively. Increasing the measurement time indeed leads to the decrease in MDA, but the benefit is not so significant. Moreover, withholding a person in the testing position for too long would necessarily place considerable mental as well as physical stress to that person. Therefore, unless absolutely necessary, the duration should not exceed ∼30 min for each measurement. Interestingly, Estrada and Laurer employed multiple separated 30 min measurements (Estrada et al., 1993), which we consider is a wise practice to lower MDA.
Discussion
It is informative to consider the MDA in the context of potential Pb-210 activity in the skull of individuals, who had a substantial radon exposure history, denoted Askull. To this end, we refer to the model by Eisenbud et al., which assumes that the tested person is subject to a continuous exposure to radon with fixed concentration. Mathematically, it is shown below,
where Ap is the activity of Pb-210 deposited in skull per WLM, λeff is the biodynamic half-life of Pb-210 in bone, W is the average exposure of workers per month in terms of WLM, T is time since the first exposure, and f is the weight fraction of skull in bones. Following references (Eisenbud et al., 1969; Laurer et al., 1999), we assign Ap = 0.31 Bq/WLM, λeff= 16 years, and f = 15%. Furthermore, for simplicity, we assume the decays of radon and daughters are always in equilibrium, and that the individual has been maintaining 8 h per day in the environment with fixed radon concentration.
One can imagine that there can be a variety of sources leading to Pb-210 activity other than radon, such as diet. Laurer et al. has reported the estimation on the contributions from these sources (Laurer et al., 1999), which we replot in Figure 6A; the green line represents the contribution from food and water, while the red line denotes that from radon. We have successfully repeated the prediction on radon with the model listed in Eq. 13, and found that the radon concentration is as low as 84 Bq/m3, which is much lower than the concentration commonly studied in similar works. Therefore, by assuming that the radon concentration is 3,700 Bq/m3 instead, we replot predicted Pb-210 activity in the skull as a function of exposure time in Figure 6B, where the contribution from sources other than radon are copied from Figure 6A. It is evident that the radon becomes the dominant source of Pb-210 activity in this scenario.

FIGURE 6. Estimated Pb-210 activity in skull originating from various source as a function of exposure time. In (A), the data are extracted from Laurer et al. (1999), where the radon concentration is estimated to be ∼84 Bq/m3; based on the same model, in conjunction with the assumed radon concentration of 3,700 Bq/m3, the Pb-210 activity from various sources are presented in (B) comparing to the asymptotically achievable MDAs using NaI-CsI (blue) and HPGe (red) detectors under the measurement time of 30 min (dashed) and 1 h (dot-dashed).
For comparison, the asymptotically achievable MDA using NaI-CsI (blue) and HPGe (red) detectors under the measurement time of 30 min and 1 h are superimposed as dashed and dot-dashed lines, respectively. Note that the active area of detectors is assumed to be 75,000 mm2.
Under 30 min measurement, the device relying on NaI-CsI detectors can barely detect the presence of Pb-210 activity for individuals who had more than 30 years of exposure; by extending the measurement time to 1 h, those with more than 20 years of exposure can be recognized. In contrast, by relying on the HPGe detectors, the individuals, who had more than 5–8 years of exposure, can be identified. Therefore, a lower MDA resulted from employing HPGe detectors instead of NaI-CsI detectors can lead to a much earlier recognition of heavy radon exposure by 10–20 years, which is critical for retrospective assessment on lung cancer risks in a timely manner.
Conclusion
In this work, we refer to the studies focusing on the Pb-210 in vivo measurements and reanalyze the reported data therein to understand how several key factors influence the limit of detection.
Firstly, we focus on the reported background count rates and analyze their dependence on detector’s energy resolution and active area. It is found that the background level inside the shielding room of respective studies is almost the same, which can be rationalized by the saturating capability of metallic walls in suppressing the background through attenuating environmental γ-rays. It is largely due to difference in detector's energy resolution and active area that leads to the considerable differences in background count rates across various studies.
Secondly, we turn to the reported calibration factors and conduct analysis in the same manner. It is found that the detection efficiency is linearly dependent on the active area and is independent on the type of detectors.
Thirdly, we calculate MDA for each study and demonstrate its dependence on the active area of detector and measurement duration. In the limit of the largest achievable active area (∼75,000 mm2), it is found that the asymptotic MDA is approximately 6 (4) Bq and 15 (11) Bq under 30 (60) min measurement using NaI-CsI scintillator and HPGe semiconductor detectors, respectively.
Finally, we discuss these asymptotic MDA in the context of model-estimated Pb-210 activity in the skull resulted from a hypothetical history of radon exposure. It is suggested that a lower MDA would be beneficial to recognize an individual’s radon exposure in an earlier stage, which is critical for retrospective assessment on lung cancer risks in a timely manner.
Author Contributions
XM conducted the research and wrote the paper, YL designed the research, BW supervised the study and co-wrote the paper, JC provided guidance throughout the research, LW raised valuable questions that helps improving the paper, YW and NS provided good suggestions for data analysis.
Funding
This work is supported by the Central University Basic Scientific Research Business Expenses Special Funds under the project name of Research on Applied Physics under Low Radiation Background (Grant No. 2018NTST07) and 2021 Nuclear and Radiation Safety Technic Evaluation Project, Ministry of Ecology and Environment (NSCCG 2021-052).
Conflict of Interest
The authors declare that the research was conducted in the absence of any commercial or financial relationships that could be construed as a potential conflict of interest.
Publisher’s Note
All claims expressed in this article are solely those of the authors and do not necessarily represent those of their affiliated organizations, or those of the publisher, the editors and the reviewers. Any product that may be evaluated in this article, or claim that may be made by its manufacturer, is not guaranteed or endorsed by the publisher.
References
Altshuler, B., and Pasternack, B. (1963). Statistical Measures of the Lower Limit of Detection of a Radioactivity Counter. Health Phys. 9, 293–298. doi:10.1097/00004032-196303000-00005
Black, S. C., Archer, V. E., Dixon, W. C., and Saccomanno, G. (1968). Correlation of Radiation Exposure and lead-210 in Uranium Miners. Health Phys. 14 (2), 81–93. doi:10.1097/00004032-196802000-00001
Blanchard, R. L., Archer, V. E., and Saccomanno, G. (1969). Blood and Skeletal Levels of 210Pb-210Po as a Measure of Exposure to Inhaled Radon Daughter Products. Health Phys. 16 (5), 589–596. doi:10.1097/00004032-196905000-00006
Cannizzaro, F., Greco, G., Raneli, M., Spitale, M. C., and Tomarchio, E. (1997). Study of Background Characteristics of a Low-Level HPGe Spectrometer with Passive Shielding in Various Configurations. Nucl. Instrum. Meth. A. 390 (1), 167–174. doi:10.1016/S0168-9002(97)00313-6
Cevik, U., Damla, N., Kobya, A. I., Celik, A., and Kara, A. (2010). Radiation Dose Estimation and Mass Attenuation Coefficients of marble Used in Turkey. Ann. Nucl. Energ. 37 (12), 1705–1711. doi:10.1016/j.anucene.2010.07.011
Cevik, U., Kara, A., Celik, N., Karabidak, M., and Celik, A. (2011). Radon Survey and Exposure Assessment in Karaca and Çal Caves, Turkey. Water Air Soil Pollut. 214, 461–469. doi:10.1007/s11270-010-0437-6
Cohen, N., Jaakkola, T., and Wrenn, M. E. (1973). Lead-210 Concentrations in the Bone, Blood and Excreta of a Former Uranium Miner. Health Phys. 24 (6), 601–609. doi:10.1097/00004032-197306000-00001
Cohen, N., Spitz, H. B., and Wrenn, M. E. (1977). Estimation of Skeletal burden of "Bone-Seeking" Radionuclides in Man from In Vivo Scintillation Measurements of the Head. Health Phys. 33, 431–441. doi:10.1097/00004032-197711000-00009
Currie, L. A. (1968). Limits for Qualitative Detection and Quantitative Determination. Application to Radiochemistry. Anal. Chem. 40, 586–593. doi:10.1021/ac60259a007
Dantas, A. L. A., Dantas, B. M., and Lipsztein, J. L. (2006). A Method for Analyzing Low Statistics High Resolution Spectra from 210Pb in Underground Coal Miners from Brazil. J. Radioanal. Nucl. Chem. 269 (2), 435–439. doi:10.1007/s10967-006-0404-2
Dantas, A. L. A., Dantas, B. M., Lipsztein, J. L., and Spitz, H. B. (2007). In Vivo measurements of 210Pb in Skull and Knee Geometries as an Indicator of Cumulative 222Rn Exposure in a Underground Coal Mine in Brazil. Radiat. Prot. Dosimetry 125 (1-4), 568–571. doi:10.1093/rpd/ncl387
Done, L., and Ioan, M.-R. (2016). Minimum Detectable Activity in Gamma Spectrometry and its Use in Low Level Activity Measurements. Appl. Radiat. Isot. 114, 28–32. doi:10.1016/j.apradiso.2016.05.004
Eisenbud, M., Laurer, G. R., Rosen, J. C., Cohen, N., Thomas, J., and Hazle, A. J. (1969). In Vivo measurement of lead-210 as an Indicator of Cumulative Radon Daughter Exposure in Uranium Miners. Health Phys. 16 (5), 637–646. doi:10.1097/00004032-196905000-00011
Estrada, J. J. S., and Laurer, G. R. (1993). A Method to Obtain Subject Background for Low-Level In Vivo Measurements of the Head. Health Phys. 65 (3), 306–312. doi:10.1097/00004032-199309000-00010
Fijałkowska–Lichwa, L. (2016). Extremely High Radon Activity Concentration in Two Adits of the Abandoned Uranium Mine 'Podgórze' in Kowary (Sudety Mts., Poland). J. Environ. Radioactivity 165, 13–23. doi:10.1016/j.jenvrad.2016.08.016
Haninger, T., Wahl, W., Salonen, L., Rahola, T., Kucheida, D., and Roth, P. (2002). In Vivo measurements on the Human Skull for Retrospective Assessment of Individual Intakes of Natural Radionuclides. Int. Congress Ser. 1225, 95–100. doi:10.1016/S0531-5131(01)00539-8
ICRP (1993). Age-dependent Doses to Members of the Public from Intake of Radionuclides: Part 2. Ingestion Dose Coefficients. A Report of a Task Group of Committee 2 of the International Commission on Radiological Protection. Ann. ICRP 23 (3-4), 1–167.
ICRP (1975). Report of the Task Group on Reference Man, 23. Oxford: ICRP Publication. Pergamon Press.
Isenhour, T. L., and Morrison, G. H. (1964). A Computer Program to Optimize Times of Irradiation and Decay in Activation Analysis. Anal. Chem. 36 (6), 1089–1092. doi:10.1021/ac60212a040
ISO (2010). ISO 11929 Determination of the Characteristic Limits (Decision Threshold, Detection Limit and Limits of the Confidence Interval) for Measurements of Ionizing Radiation - Fundamentals and Application. Geneva.
Kirkpatrick, J. M., Venkataraman, R., and Young, B. M. (2013). Minimum Detectable Activity, Systematic Uncertainties, and the ISO 11929 Standard. J. Radioanal. Nucl. Chem. 296 (2), 1005–1010. doi:10.1007/s10967-012-2083-5
Kojo, K., Laine, J.-P., Turtiainen, T., and Kurttio, P. (2021). Radon in Finnish Underground Mines 2011-2019. J. Radiol. Prot. doi:10.1088/1361-6498/ac08f0
Laurer, G. R., Estrada, J. J. S., and Cohen, N. (1999). Lung Exposure from Inhalation of Radon Progeny. Health Phys. 76 (4), 380–387. doi:10.1097/00004032-199904000-00005
Laurer, G. R., Gang, Q. T., Lubin, J. H., Yao, J., Kan, C. S., Xian, Y. S., et al. (1993). Skeletal 210Pb Levels and Lung Cancer Among Radon-Exposed Tin Miners in Southern China. Health Phys. 64 (3), 253–259. doi:10.1097/00004032-199303000-00003
Leone, D., and Breustedt, B. (2011). Simulation of Phoswich Detectors Using MCNPX and EGSNRC. Radiat. Prot. Dosimetry 144 (1-4), 402–406. doi:10.1093/rpd/ncq507
Meng, D., Xi, P. P., Ma, Y. H., Shen, F., Fu, C. M., and Zhang, Z. L. (2015). Measurement of 222Rn and its Decay Daughters in Uranium Mines. Radiat. Prot. 35 (3), 180–187.
Meng, X., Liu, Y., Wu, B., Cheng, J., Wang, L., Wang, Y., et al. (2021). Assessment of Radiation Background Suppression Using Phoswich Detectors for In Vivo Pb-210 Measurements: A Simulation Study. Nucl. Techn., 1–8. doi:10.1080/00295450.2021.1945358
Momčilović, B., Alkhatib, H. A., Duerre, J. A., Cooley, M., Long, W. M., Harris, T. R., et al. (2001). Environmental lead-210 and Bismuth-210 Accrue Selectively in the Brain Proteins in Alzheimer Disease and Brain Lipids in Parkinson Disease. Alzheimer Dis. Associated Disord. 15 (2), 106–115. doi:10.1097/00002093-200104000-00012
Mrdja, D., Bikit, K., Bikit, I., Slivka, J., Nemes, T., Nikolov, J., et al. (2019). Optimization of the HPGe Detector Passive Shields by Monte-Carlo Simulations. Nucl. Instr. Methods Phys. Res. Section A: Acc. Spectrometers, Detectors Associated Equipment 929, 76–83. doi:10.1016/j.nima.2019.03.041
Muikku, M., Rahola, T., Pusa, S., Salonen, L., Wahl, W., Roth, P., et al. (2003). Estimation of Human Exposure to Natural Radionuclides by Using In Vivo Skull Measurements. Radiat. Prot. Dosimetry 105 (1-4), 615–618. doi:10.1093/oxfordjournals.rpd.a006313
Pillalamarri, I., and Jagam, P. (2019). A Solution for 40K Interference from K Internal to the Human Body, in an Underground High Sensitivity Whole Body Counter at the Waste Isolation Pilot Plant, Carlsbad, NM, USA. Journal of Radiation Research and Applied Sciences 10 (4), 320–326. doi:10.1016/j.jrras.2017.07.004
Pillalamarri, I., Jagam, P., and Lykken, G. I. (2013). Internal Dosimetry of 210Pb in the Human Cranium: Preliminary Results from Instrumentation Needs for In Vivo Counting in a Low-Background Underground Counting Facility. Radiat. Prot. Dosimetry 157 (1), 6–10. doi:10.1093/rpd/nct109
Sahu, P., Panigrahi, D. C., and Mishra, D. P. (2016). A Comprehensive Review on Sources of Radon and Factors Affecting Radon Concentration in Underground Uranium Mines. Environ. Earth Sci. 75 (7). doi:10.1007/s12665-016-5433-8
Scheler, R., Dettmann, K., and Brose, J. (1998). Retrospective Estimation of Exposure to Short-Lived 222Rn Progeny by Measurements of 210Pb in the Skull. Radiat. Prot. Dosimetry 79 (1-4), 129–132. doi:10.1093/oxfordjournals.rpd.a032375
Semkow, T. M., Parekh, P. P., Schwenker, C. D., Khan, A. J., Bari, A., Colaresi, J. F., et al. (2002). Low-background Gamma Spectrometry for Environmental Radioactivity. Appl. Radiat. Isot. 57 (2), 213–223. doi:10.1016/s0969-8043(02)00085-4
Somlai, J., Hakl, J., Kávási, N., Szeiler, G., Szabó, P., and Kovács, T. (2011). Annual Average Radon Concentration in the Show Caves of Hungary. J. Radioanal. Nucl. Chem. 287 (2), 427–433. doi:10.1007/s10967-010-0841-9
Sun, L., Wang, X. C., Pan, Y., Cui, H. X., Wu, Y. Y., and Liu, J. X. (2020). Investigation and Analysis of Radon Concentration in a Mining Area in Yunnan Province. Chin. J. Radiol. Health 29 (1), 57–60. doi:10.13491/j.issn.1004-714X.2020.01.013
Tomasek, L. (2020). Lung Cancer Lifetime Risks in Cohort Studies of Uranium Miners. Radiat. Prot. Dosim. 191 (2), 171–175. doi:10.1093/rpd/ncaa143
Turko, J., Pillalamarri, I., and Jagam, P. (2020). GEANT4 Simulations of Cosmic Muon Background in CEMRC BEGe Lung Detectors and Detection Sensitivity Optimization of Trans-uranic Radionuclides. J. Radiat. Res. Appl. Sci. 13 (1), 111–120. doi:10.1080/16878507.2019.1711341
UNSCEAR (2019). UNSCEAR 2019 Report. Annex B: Lung Cancer from Exposure to Radon. New York: United Nations: UNSCEAR.
Verplancke, J. (1992). Low Level Gamma Spectroscopy: Low, Lower, Lowest. Nucl. Instrum. Meth. A. 312 (1), 174–182. doi:10.1016/0168-9002(92)90149-X
Wahl, W., Haninger, T., Kucheida, D., Roth, P., and Paretzke, H. G. (2000). Study of Long-Term Radon Progeny in Humans for Retrospective Evaluation of Radon Exposure. J. Radioanal. Nucl. Ch. 243 (2), 447–450. doi:10.1023/A:1016078115609
WHO (2009). WHO Handbook on Indoor Radon: A Public Health Perspective. Geneva: World Health Organization.
Keywords: Pb-210, MDA, NaI-CsI, HPGe, in vivo measurement
Citation: Meng X, Liu Y, Wu B, Cheng J, Wang L, Wang Y and Su N (2021) Minimum Detectable Activity of Pb-210 in Skull From In vivo Measurements: Insights From the Literature. Front. Energy Res. 9:759850. doi: 10.3389/fenrg.2021.759850
Received: 17 August 2021; Accepted: 20 September 2021;
Published: 06 October 2021.
Edited by:
Mingfei Yan, RIKEN, JapanReviewed by:
Rong Zhou, Sichuan University, ChinaAyhan Kara, Giresun University, Turkey
Qiuju Guo, Peking University, China
Copyright © 2021 Meng, Liu, Wu, Cheng, Wang, Wang and Su. This is an open-access article distributed under the terms of the Creative Commons Attribution License (CC BY). The use, distribution or reproduction in other forums is permitted, provided the original author(s) and the copyright owner(s) are credited and that the original publication in this journal is cited, in accordance with accepted academic practice. No use, distribution or reproduction is permitted which does not comply with these terms.
*Correspondence: Yuanyuan Liu, eXlsaXVAYm51LmVkdS5jbg==; Bin Wu, Ynd1NkBibnUuZWR1LmNu