 Yacine Khetib1,2*
 Hala M. Abo-Dief3Abdullah K. Alanazi3Hussein A. Saleem4,5
 S. Mohammad Sajadi6,7
 Mohsen Sharifpur8,9*
- 1Mechanical Engineering Department, Faculty of Engineering, King Abdulaziz University, Jeddah, Saudi Arabia
- 2Center Excellence of Renewable Energy and Power, King Abdulaziz University, Jeddah, audi Arabia
- 3Department of Chemistry, College of Science, Taif University, Taif, Saudi Arabia
- 4Mining and Metallurgical Engineering Department, Faculty of Engineering, Assiut University, Assiut, Egypt
- 5Mining Engineering Department, Faculty of Engineering, King Abdulaziz University, Jeddah, Saudi Arabia
- 6Department of Nutrition, Cihan University-Erbil, Kurdistan Region, Iraq
- 7Department of Phytochemistry, SRC, Soran University, KRG, Soran, Iraq
- 8Department of Mechanical and Aeronautical Engineering, University of Pretoria, Pretoria, South Africa
- 9Department of Medical Research, China Medical University Hospital, China Medical University, Taichung, Taiwan
In this article, alumina/water nanofluid (NF) flow in a heatsink (H-S) with wavy microchannels (W-MCs) is simulated. The H-S is made of aluminum containing four similar parts. Each part has an inlet and outlet. Constant heat flux is applied on the bottom of the H-S. The study is based on two-phase (T-P) mixture and single-phase (S-P) models to determine the difference between these two types of simulations. FLUENT software and the control volume method were used for simulations. The volume control method is employed to solve equations. The effective variables include the volume fraction 0 < φ < 5% of alumina and Reynolds number (Re) 300 < Re < 1800. The maximum H-S bottom temperature, the required amount of pumping power (PP), the temperature uniformity, and the heat resistance of the H-S are the outputs studied to simulate the S-P and T-P models. The results show that the use of the T-P model has less error in comparison with the experimental data than the S-P model. An increment in the Re and φ reduces the maximum temperature (M-T) of the H-S. The S-P model, especially at a higher value of φ, leads to a lower M-T value than the T-P model. The S-P model shows a 0.5% greater decrease than the T-P model at the Reynolds number of 300 by enhancing the volume percentage of nanoparticles (NPs) from 1 to 5%. Temperature uniformity is improved with Re and φ. The reduction of H-S thermal resistance with Re and φ is the result of this study. Adding NPs to water, especially at higher amounts of φ, enhances the required PP. The T-P model predicts higher PP than the S-P one, especially at a high value of φ. The T-P model shows 4% more PP than the S-P model at Re = 30 and a volume fraction of 4%.
Introduction
Heatsinks (H-Ss) are widely used in various industries such as electronics and electrical industries, solar industries, military industries, aerospace, etc. H-Ss are employed to prevent the temperature enhancement of electronic components in different devices (Nakayama, 1986). Electronic components need to be cooled so that the components are not damaged. They are heated during the operation and power consumption and therefore need to be cooled (Alihosseini et al., 2020). These parts are used in many devices. The H-Ss play a pivotal role, and many researchers have studied their performance (SohelMurshed and Nieto de Castro, 2017; Zhao et al., 2019; Qi et al., 2020a; Cheng et al., 2021; Pordanjani et al., 2021; Tian et al., 2021). The purpose of these studies has been to enhance the thermal efficiency of the H-S and thus reduce the temperature of the electronic components on which the H-S is installed. Researchers have used different base fluids for their studies (Choi et al., 2012; Zhang et al., 2020a). Air has gained a lot of attention due to its availability and cheapness, but due to its limited cooling capacity, it is not suitable for parts with very high processing power. However, various researchers have used air as a H-S working fluid (Khattak and Ali, 2019; Elsayed et al., 2020). Kalbasi (2021) introduced a new H-S using phase-change material (PCM) and air-adopted with electrical equipment. He used the characteristics of PCM and air to remove heat and keep the temperature of the electronic device low.
Nowadays, nanotechnology and the use of devices in micro- and nanoscales are widely used in various applied industries with different scientific fields (Li et al., 2019; Zhang et al., 2020b; Zhang et al., 2020c; Guan et al., 2020; Zhang et al., 2021). Due to the limited cooling capacity of air, some researchers have used various liquids, including water, to cool the H-S. One of the fluids that is widely used as a coolant is nanofluids (NFs) (Afrand et al., 2014; Aghakhani et al., 2019; HajatzadehPordanjani et al., 2019; Toghyani et al., 2019; Ghalandari et al., 2020). NFs have better thermal properties, especially thermal conductivity, than their base fluids (Esfe et al., 2019; Eshgarf et al., 2020; ShahsavarGoldanlou et al., 2020; Yan et al., 2020; Maleki et al., 2021; Pordanjani and Aghakhani, 2021). Various researchers have used NFs in different fields of heat transfer (Aybar et al., 2015; Ghodsinezhad et al., 2016; Sharifpur et al., 2016; Aghakhani et al., 2020; Shi et al., 2021), including closed enclosures, heat exchangers, solar energy, etc. (Giwa et al., 2020; Osman et al., 2019; Esfe et al., 2018; Shahsavani et al., 2018). Numerous articles have been presented on the use of NFs in H-Ss (Saeed and Kim, 2018; Awais and Kim, 2020; Qi et al., 2020b; Tariq et al., 2020; Yang et al., 2020).
Single-phase (S-P) and two-phase (T-P) mixture models can be used to simulate the cooling performance of NFs in different equipment (Shadloo et al., 2020; SafdariShadloo, 2021). The possible difference in the results of using these methods encouraged a group of researchers to simulate various problems using these models and compare the results with experimental data (MokhtariMoghari et al., 2011; Göktepe et al., 2014). In the above-mentioned articles, considering NF flow in various heat exchangers, the S-P model has been used to model the NF flow; however, the researchers have rarely employed the T-P method to simulate the performance of NF. In one of these articles, Akbari et al. (2012) analyzed the cooling performance of water–Al2O3 NF in a tube using these two schemes. It was reported that the outcomes of the T-P method are more consistent with the experimental data. In another study, Moraveji and Ardehali (2013) compared the results of two methods and revealed the superior performance of the T-P method compared to the S-P one.
Due to the wide range of applications of H-Ss in the applied industry, a large number of studies have been conducted in this field. The reason for researchers' attention to H-Ss is their widespread use and importance in industries. This study aims to enhance the thermal efficiency of H-Ss by changing their geometry. On the other hand, the use of NFs in recent decades has been very much considered by researchers due to the challenge of using S-P or T-P models in recent years (Peng et al., 2020; Ahmadi et al., 2020; Ahmadi et al., 2020; Giwa et al., 2021; Bagherzadeh et al., 2019). In the present article, the effect of using alumina/water NF flow in a H-S with wavy walls is numerically investigated. One of the innovations of this work is the comparison of S-P and T-P schemes in the H-S. H-S temperature, temperature uniformity, pumping power (PP), and heat resistance of H-S at different values of Re and φ are studied. The effective variables are Reynolds number (Re) and φ when S-P and T-P models are employed. In summary, the effect of S-P and T-P modeling of NFs in a H-S with wavy walls is the innovation of the present work.
Problem Description
The H-S is a rectangle structure of four similar parts made of aluminum, as shown in Figure 1. The dimensions of the H-S, including its thickness, wall thickness, and the dimensions of the inlets and outlets can be seen in Figure 1. A constant heat flux of 1 MW/m2 is applied to the bottom of the H-S. The heat flux is applied to the enclosure with a surface area of 111.6 mm2, which is located under the microchannels. The wavy microchannel (W-MC) walls are designed to be corrugated to enhance heat transfer. Alumina/water NF flows in the middle of the W-MCs. By changing φ from 0 to 5%, the thermal efficiency of the H-S is evaluated using the T-P and S-P models.
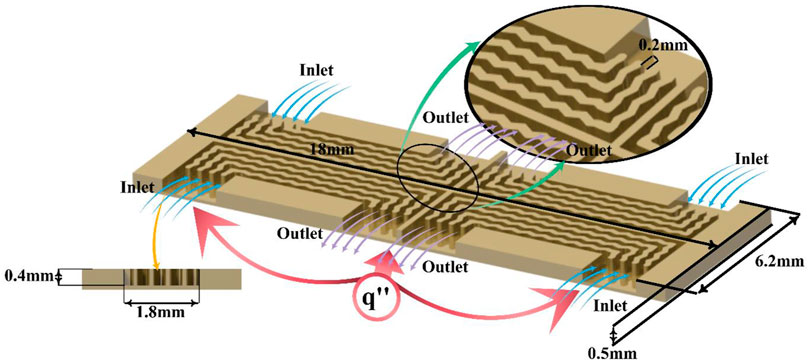
FIGURE 1. Details of the H-S geometry.
Governing Equations
S-P Model Equations
The equations governing fluid flow within the H-S, as S-P for the laminar and continuous flow of incompressible Newtonian fluid, are as follows. These equations include mass, momentum, and energy conservation (Akbari et al., 2011):
where,
where, the indices p and f refer to nanoparticles (NPs) and the base fluid, respectively, and
The equation of thermal conductivity, which depends on the diameter of NPs, is expressed as follows (Teng et al., 2010):
where d is the diameter of NPs equal to 40 nm, ω is the mass percentage of NPs, and T is the temperature. Other properties of water and alumina NPs are given in Table 1.

TABLE 1. Thermophysical properties of water and
T-P Mixture Model Equations
The T-P model solves mass, momentum, and energy conservation equations for the mixture as a volume percentage equation for the second phase (Akbari et al., 2012; Moraveji and Ardehali, 2013). Then, the relative velocities are calculated using the equations. Relative equations are defined as follows:
Conservation of mass:
Conservation of momentum:
where the index m represents the mixture. In the above equations, the mean velocity values of the mixture and density can be expressed as follows:
Conservation of energy:
Volumetric percentage:
It should be pointed out that the S-P model equations (Eq. 6 and Eq. 7) are used for the thermal conductivity and viscosity models in the T-P model. Drift velocity expressed for the second phase and can be calculated using the following equation for the kth phase:
Slip velocity, or relative velocity, is defined as the secondary phase velocity depending on the primary phase.
The gravitational acceleration is also defined as follows:
where the heat transfer is by natural convection, and the gravitational acceleration is considered in the equations.
Boundary Conditions
It should be pointed out that the no-slip boundary condition is applied to the walls. In the H-S, which is made of aluminum (
Numerical Method and Validation
To simulate the problem, geometry is first generated and meshed by mesh software. The generated mesh type is tetrahedral. The control volume method is employed for numerical solution, and the SIMPLE algorithm is used to couple the velocity and pressure fields. The second-order upwind model is used to solve the equations of momentum and energy. The convergence criterion used for all equations is set to 10−5. A PC with CPU i7 and 8-GB DDR4 RAM had been used to solve the equations. The approximate time of the runs varied from 150 to 200 min depending on the Reynolds number. The mesh generated on the geometry is evaluated for S-P and T-P models. Different results are examined for different numbers of the grid point, and eventually, the grid with 1,552,680 elements is selected as the optimal one. Figure 2 demonstrates the average temperature of the H-S for various numbers of elements at two Re, when φ = 5% for T-P and S-P models.
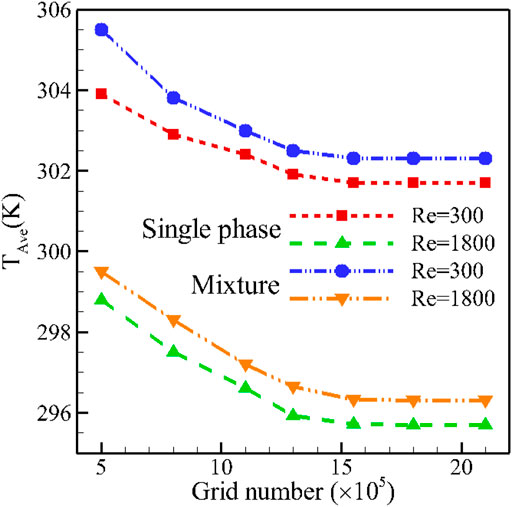
FIGURE 2. The impact of the number of grid elements on the
For the validation, the results are compared with two other articles to investigate the accuracy of the S-P and T-P models using the thermal conduction model and the selected viscosity. The verification is performed using numerical simulations of Moraveji and Ardehali (2013) and experimental data of Ho and Chen (2013). The results of the comparison are provided in Figure 3. As can be seen, the differences between the results are small, particularly with experimental results, and the results are more promising. The maximum error for the S-P model was observed for Re = 655 compared to the experimental data of Ho and Chen (2013). The maximum error of the S-P model was 4.1% and that of the T-P one was 1.9% at Re = 1,300.
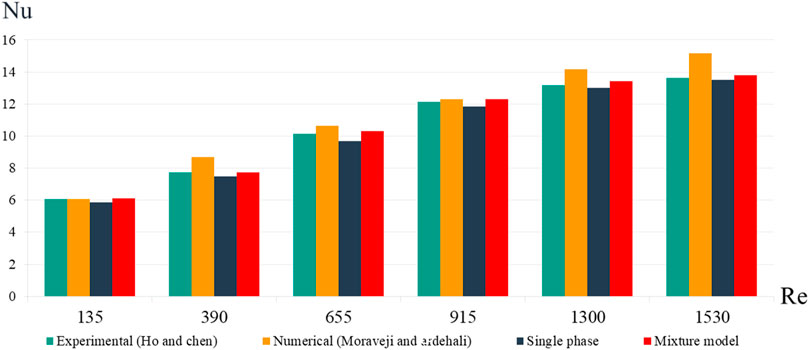
FIGURE 3. Comparison of the average Nusselt number between the present study, an experimental work (Ho and Chen, 2013), and a numerical one (Moraveji and Ardehali, 2013).
Besides, the value of the local heat transfer coefficient is compared between the present work and that of Kim et al. (2009) for two different channel lengths (Table 2). The comparison table shows that the simulation results are reasonable due to a maximum error of 5.5% between the present work and the experimental data.

TABLE 2. Local heat transfer coefficient for two channel lengths: comparison between the present work and the work of Kim et al. (2009).
Results and Discussion
It is necessary to measure the error of both S-P and T-P models with a valid reference to determine which method is more accurate with respect to the experimental data.
Table 3 shows the error values of T-P and S-P models compared with the experimental model of Ho and Chen (2013). It can be seen that the amount of error between the T-P model and the experimental work is less than the S-P one. It is generally seen that the amount of simulation error at lower amounts of Re is lower for both models than for high values of Re. Finally, it is found that the T-P model leads to better results in the W-MCs than the S-P one.
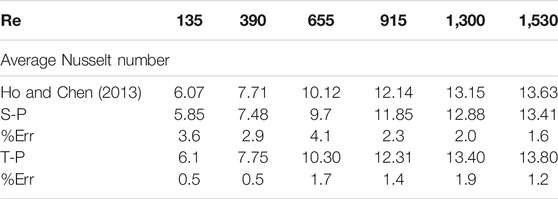
TABLE 3. Comparison of the result between the S-P and T-P models with the experimental data Ho and Chen (2013).
Figure 4 presents contours on the middle plane of the H-S for various amounts of Re for water/
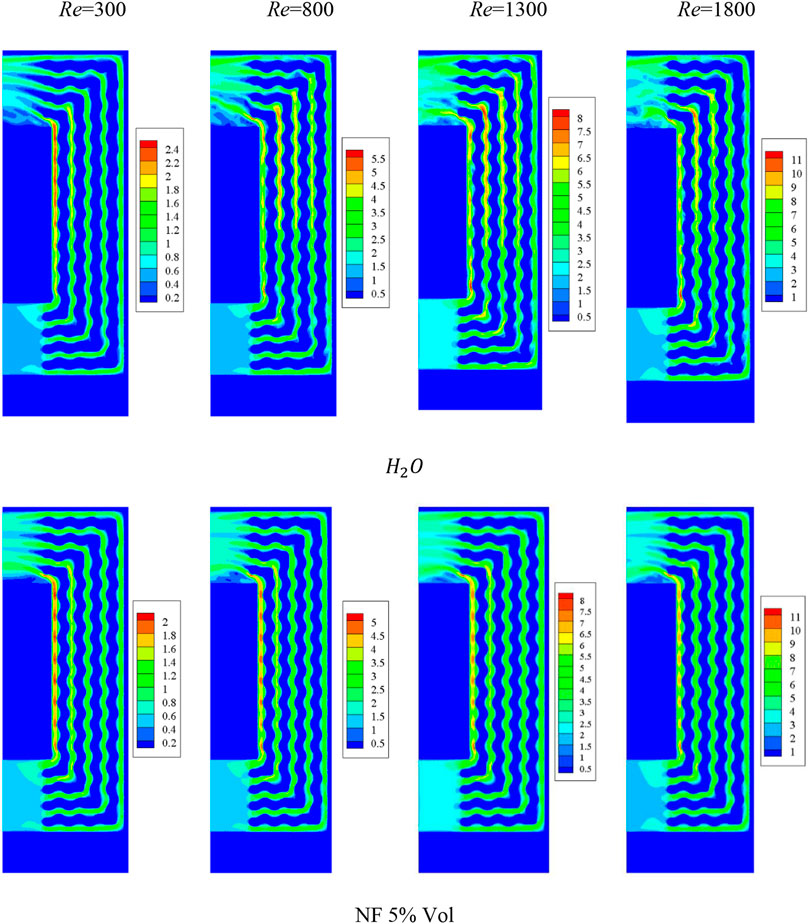
FIGURE 4. Velocity contours on the middle plane of the H-S for various amounts of Re for water/
Figure 5 demonstrates the velocity vector for the NF flow at Re = 1800. This figure clearly displays the motion direction of the fluid. It can be observed that the fluid is directed toward the W-MCs after entering, and the velocity in the internal W-MC is higher than in other regions. This channel has a higher velocity because of its shorter passage to the outlet and less energy loss in the fluid due to its viscosity. In sharp corners, the velocity variations are more noticeable. In the W-MC, the velocity is enhanced in its spiral parts.
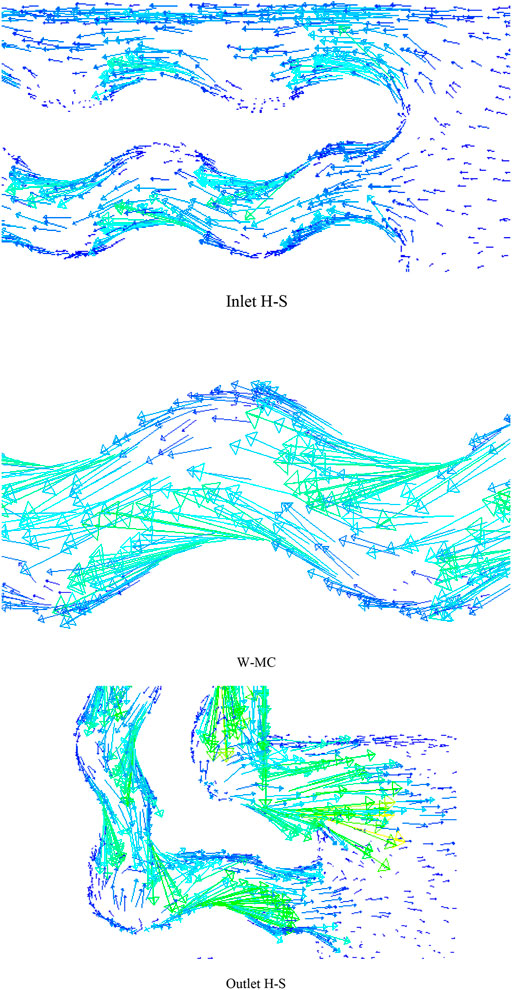
FIGURE 5. Velocity vector of the NF flow for Re = 1800.
Figure 6 shows the maximum temperature (M-T) of the H-S at different values of Re when φ = 2% for T-P and S-P simulation models. It can be seen that an increment in the Re reduces the M-T for both types of NF models. Also, an enhancement in the φ has the same effect. For T-P simulation, the mixture model is used, and for the S-P model, the expressed relationships for viscosity and temperature-dependent thermal conductivity are used. It can be seen that at low amounts of φ, the difference between the S-P and T-P models is low, but the amount of temperature difference is enhanced with enhancing φ. The temperature value obtained by the T-P method is slightly lower than that achieved from the S-P one, which is more accurate due to the validation of the T-P model.
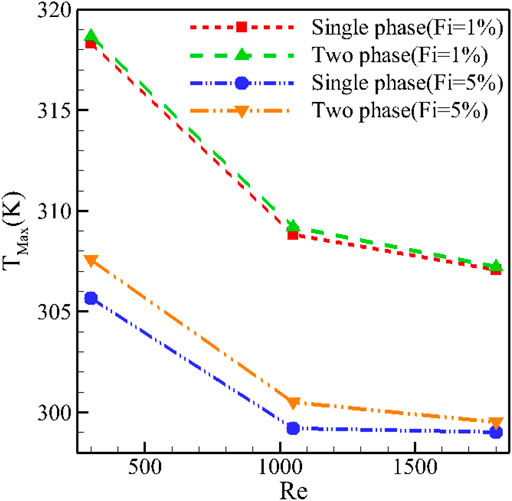
FIGURE 6. Maximum H-S temperature at different values of Re when φ = 2% for the T-P and S-P simulation models.
Figure 7 shows the temperature uniformity at the H-S bottom at different values of Re when φ = 2% for the T-P and S-P simulation models. The amount of temperature uniformity depends on the M-T and minimum temperature of H-S. As the Re is enhanced, the amount of Teta is reduced, which means better temperature uniformity. Enhancing the φ has the same result. The reduction in the M-T is the most important reason for the increase in temperature uniformity. It can be seen that the difference between the simulations using the T-P and S-P models when φ = 0.05 is more noticeable. In the S-P model, the results are dependent on the viscosity and thermal conductivity models, and changing the viscosity and thermal conductivity models can change the results.
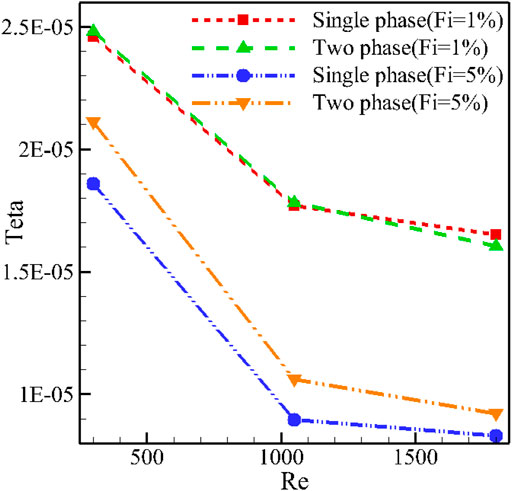
FIGURE 7. Temperature uniformity at the H-S bottom at different values of Re when φ = 2% for the T-P and S-P simulation models.
Figure 8 shows the H-S thermal resistance at different amounts of Re and two values of φ for the T-P and S-P simulation models. It can be seen that the enhancement in Re reduces the amount of heat resistance of the H-S. The addition of more NPs has the same effect. A reduction in the average temperature of the H-S with Re and φ reduces the heat resistance of the H-S. It can be observed that there is a difference in the simulation results of the S-P and T-P models, which is higher at larger amounts of φ. Of course, the difference between the T-P and S-P models is more noticeable at lower magnitudes of Re. At lower flow rates, the effect of NF on heat transfer is higher, and as a result, the effect of NF simulation is more noticeable.
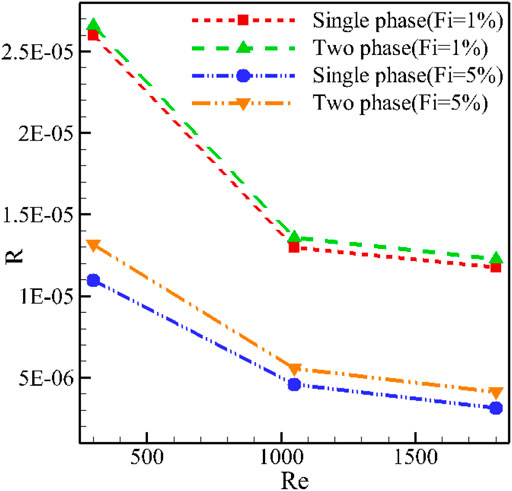
FIGURE 8. H-S thermal resistance at different amounts of Re and two values φ for the T-P and S-P simulation models.
Figure 9 shows PP at different values of Re when φ = 2% for T-P and S-P simulation models. An increment in the Re means an enhancement in the volume flow rate of the fluid, leading to intensification in the amount of power required by the pump. The addition of NPs in both NF models enhances the viscosity, so the shear stress in the fluid is increased, and more power is required for the NF pumping. Since the effect of adding NPs to the fluid is much less than the variations of Re on the PP, the effect of the S-P or T-P model on the PP is low. However, at high fluid velocities and at values of Re where the shear stress has a more significant effect, the effect of the S-P and T-P models is more visible. At high values of Re, for example, 1800, the role of the type of viscosity is more important. In this respect, at Re = 1800, the difference between the results is more remarkable. The value expressed by the T-P model for PP is more significant than the S-P one.
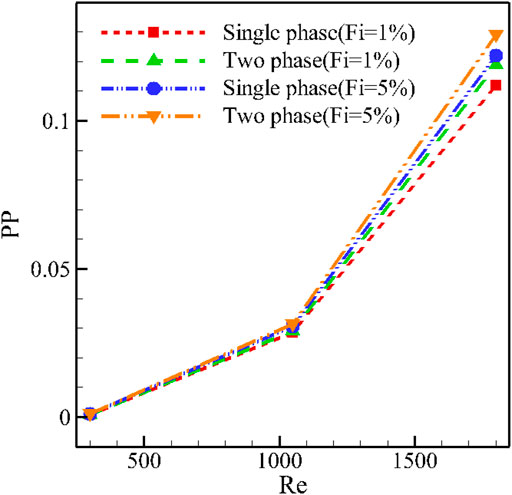
FIGURE 9. PP at different values of Re when φ = 2% for the T-P and S-P simulation models.
Conclusion
This article simulated the water/alumina NF flow in a H-S with W-MC using S-P and T-P models. By changing the Re and φ, the M-T, H-S temperature uniformity, thermal resistance, and PP were studied. The results of numerical analysis and comparison of two models demonstrated the following:
1) In general, the error percentage of using the T-P mixer model is lower than the S-P method, but the error of both methods is enhanced compared to the experimental data by increasing φ.
2) An increment in the Re and φ reduces the M-T in the H-S. The S-P method predicts a lower M-T than the T-P one. At Re of 300, an increment in the volume percentage of NPs from 1 to 5% reduces the maximum H-S temperature by 3.9 and 3.4% for the S-P and T-P models, respectively.
3) An enhancement in the flow rate and the use of thicker NF provide better temperature uniformity in the H-S. The S-P method predicts a better amount of temperature uniformity than the T-P model.
4) An increment in the φ and the Re reduces the thermal resistance of the H-S. The T-P mixer model shows higher thermal resistance than the S-P one.
5) At low NF velocities, an enhancement in the φ and the type of phase model do not have a considerable effect on the PP, while at higher velocities, the addition of NPs enhances the PP, and the T-P model has a higher prediction than the S-P one. Enhancing the volume percentage of NPs from 1 to 5% increases the amount of PP by 24 and 28% for the S-P and T-P models, respectively, when Re = 300.
Data Availability Statement
The raw data supporting the conclusion of this article will be made available by the authors, without undue reservation.
Author Contributions
YK: Methodology, Writing-original draft HA-D: Conceptualization, Software AA: Review and Editing HS: Validation SS: Review and Editing MS: Conceptualization, Review and Editing.
Funding
This work was supported by the Taif University Researchers Supporting grant number (TURSP-2020/266) of Taif University, Taif, Saudi Arabia.
Conflict of Interest
The authors declare that the research was conducted in the absence of any commercial or financial relationships that could be construed as a potential conflict of interest.
Publisher’s Note
All claims expressed in this article are solely those of the authors and do not necessarily represent those of their affiliated organizations, or those of the publisher, the editors and the reviewers. Any product that may be evaluated in this article, or claim that may be made by its manufacturer, is not guaranteed or endorsed by the publisher.
Acknowledgments
The authors gratefully acknowledge financial support from the German Research Foundation (DFG).
References
Afrand, M., Farahat, S., Nezhad, A. H., Ali Sheikhzadeh, G., and Sarhaddi, F. (2014). 3-D Numerical Investigation of Natural Convection in a Tilted Cylindrical Annulus Containing Molten Potassium and Controlling it Using Various Magnetic fields. Jae 46, 809–821. doi:10.3233/jae-141975
Aghakhani, S., Ghasemi, B., Hajatzadeh Pordanjani, A., Wongwises, S., and Afrand, M. (2019). Effect of Replacing Nanofluid Instead of Water on Heat Transfer in a Channel with Extended Surfaces under a Magnetic Field. Int. J. Numer. Methods Heat Fluid Flow. 29(4). doi:10.1108/hff-06-2018-0277
Aghakhani, S., Pordanjani, A. H., Afrand, M., Sharifpur, M., and Meyer, J. P. (2020). Natural Convective Heat Transfer and Entropy Generation of Alumina/water Nanofluid in a Tilted Enclosure with an Elliptic Constant Temperature: Applying Magnetic Field and Radiation Effects. Int. J. Mech. Sci. 174, 105470. doi:10.1016/j.ijmecsci.2020.105470
Ahmadi, A. A., Arabbeiki, M., Ali, H. M., Goodarzi, M., and Safaei, M. R. (2020). Configuration and Optimization of a Minichannel Using Water-Alumina Nanofluid by Non-dominated Sorting Genetic Algorithm and Response Surface Method. Nanomaterials 10 (5), 901. doi:10.3390/nano10050901
Ahmadi, M. H., Mohseni-Gharyehsafa, B., Ghazvini, M., Goodarzi, M., Jilte, R. D., and Kumar, R. (2020/02/01 2020). Comparing Various Machine Learning Approaches in Modeling the Dynamic Viscosity of CuO/water Nanofluid. J. Therm. Anal. Calorim. 139 (4), 2585–2599. doi:10.1007/s10973-019-08762-z
Akbari, M., Galanis, N., and Behzadmehr, A. (2011). Comparative Analysis of Single and Two-phase Models for CFD Studies of Nanofluid Heat Transfer. Int. J. Therm. Sci. 50, 1343–1354. doi:10.1016/j.ijthermalsci.2011.03.008
Akbari, M., Galanis, N., and Behzadmehr, A. (2012). Comparative Assessment of Single and Two-phase Models for Numerical Studies of Nanofluid Turbulent Forced Convection. Int. J. Heat Fluid Flow 37, 136–146. doi:10.1016/j.ijheatfluidflow.2012.05.005
Alihosseini, Y., Zabetian Targhi, M., Heyhat, M. M., and Ghorbani, N. (2020). Effect of a Micro Heat Sink Geometric Design on Thermo-Hydraulic Performance: A Review. Appl. Therm. Eng. 170, 114974. doi:10.1016/j.applthermaleng.2020.114974
Awais, A. A., and Kim, M.-H. (2020). Experimental and Numerical Study on the Performance of a Minichannel Heat Sink with Different Header Geometries Using Nanofluids. Appl. Therm. Eng. 171, 115125. doi:10.1016/j.applthermaleng.2020.115125
Aybar, H. Ş., Sharifpur, M., Azizian, M. R., Mehrabi, M., and Meyer, J. P. (2015). A Review of Thermal Conductivity Models for Nanofluids. Heat Transfer Eng. 36, 1085–1110. doi:10.1080/01457632.2015.987586
Bagherzadeh, S. A., D’Orazio, A., Karimipour, A., Goodarzi, M., and Bach, Q.-V. (2019). A Novel Sensitivity Analysis Model of EANN for F-MWCNTs-Fe3O4/EG Nanofluid thermal Conductivity: Outputs Predicted Analytically Instead of Numerically to More Accuracy and Less Costs. Physica A: Stat. Mech. its Appl. 521, 406–415. doi:10.1016/j.physa.2019.01.048
Cheng, H., Li, T., Li, X., Feng, J., Tang, T., and Qin, D. (2021). Facile Synthesis of Co9S8 Nanocages as an Electrochemical Sensor for Luteolin Detection. J. Electrochem. Soc. 168, 087504. doi:10.1149/1945-7111/ac1813
Choi, J., Jeong, M., Yoo, J., and Seo, M. (2012). A New CPU Cooler Design Based on an Active Cooling Heatsink Combined with Heat Pipes. Appl. Therm. Eng. 44, 50–56. doi:10.1016/j.applthermaleng.2012.03.027
Elsayed, M. L., Mesalhy, O., Kizito, J. P., Leland, Q. H., and Chow, L. C. (2020). Performance of a Guided Plate Heat Sink at High Altitude. Int. J. Heat Mass Transfer 147, 118926. doi:10.1016/j.ijheatmasstransfer.2019.118926
Esfe, M. H., Esfandeh, S., Afrand, M., Rejvani, M., and Rostamian, S. H. (2018). Experimental Evaluation, New Correlation Proposing and ANN Modeling of thermal Properties of EG Based Hybrid Nanofluid Containing ZnO-DWCNT Nanoparticles for Internal Combustion Engines Applications. Appl. Therm. Eng. 133, 452–463. doi:10.1016/j.applthermaleng.2017.11.131
Eshgarf, H., Kalbasi, R., Maleki, A., Shadloo, M. S., and karimipour, A. (2020). A Review on the Properties, Preparation, Models and Stability of Hybrid Nanofluids to Optimize Energy Consumption. J. Therm. Anal. Calorim. 144, 1959–1983. doi:10.1007/s10973-020-09998-w
Ghalandari, M., Maleki, A., Haghighi, A., Safdari Shadloo, M., Alhuyi Nazari, M., and Tlili, I. (2020). Applications of Nanofluids Containing Carbon Nanotubes in Solar Energy Systems: A Review. J. Mol. Liquids 313, 113476. doi:10.1016/j.molliq.2020.113476
Ghodsinezhad, H., Sharifpur, M., and Meyer, J. P. (2016). Experimental Investigation on Cavity Flow Natural Convection of Al 2 O 3 -water Nanofluids. Int. Commun. Heat Mass Transfer 76, 316–324. doi:10.1016/j.icheatmasstransfer.2016.06.005
Giwa, S. O., Sharifpur, M., Goodarzi, M., Alsulami, H., and Meyer, J. P. (2021). Influence of Base Fluid, Temperature, and Concentration on the Thermophysical Properties of Hybrid Nanofluids of Alumina-Ferrofluid: Experimental Data, Modeling through Enhanced ANN, ANFIS, and Curve Fitting. J. Therm. Anal. Calorim. 143 (6), 4149–4167. doi:10.1007/s10973-020-09372-w
Giwa, S. O., Sharifpur, M., and Meyer, J. P. (2020). Experimental Study of Thermo-Convection Performance of Hybrid Nanofluids of Al2O3-MWCNT/water in a Differentially Heated Square Cavity. Int. J. Heat Mass Transfer 148, 119072. doi:10.1016/j.ijheatmasstransfer.2019.119072
Göktepe, S., Atalık, K., and Ertürk, H. (2014). Comparison of Single and Two-phase Models for Nanofluid Convection at the Entrance of a Uniformly Heated Tube. Int. J. Therm. Sci. 80, 83–92. doi:10.1016/j.ijthermalsci.2014.01.014
Guan, H., Huang, S., Ding, J., Tian, F., Xu, Q., and Zhao, J. (2020). Chemical Environment and Magnetic Moment Effects on point Defect Formations in CoCrNi-Based Concentrated Solid-Solution Alloys. Acta Materialia 187, 122–134. doi:10.1016/j.actamat.2020.01.044
Hajatzadeh Pordanjani, A., Aghakhani, S., Afrand, M., Mahmoudi, B., Mahian, O., and Wongwises, S. (2019). An Updated Review on Application of Nanofluids in Heat Exchangers for Saving Energy. Energ. Convers. Manage. 198, 111886. doi:10.1016/j.enconman.2019.111886
Ho, C. J., and Chen, W. C. (2013). An Experimental Study on thermal Performance of Al2O3/water Nanofluid in a Minichannel Heat Sink. Appl. Therm. Eng. 50, 516–522. doi:10.1016/j.applthermaleng.2012.07.037
Kalbasi, R. (2021). Introducing a Novel Heat Sink Comprising PCM and Air - Adapted to Electronic Device thermal Management. Int. J. Heat Mass Transfer 169, 120914. doi:10.1016/j.ijheatmasstransfer.2021.120914
Khanafer, K., and Vafai, K. (2011). A Critical Synthesis of Thermophysical Characteristics of Nanofluids. Int. J. Heat Mass Transfer 54, 4410–4428. doi:10.1016/j.ijheatmasstransfer.2011.04.048
Khattak, Z., and Ali, H. M. (2019). Air Cooled Heat Sink Geometries Subjected to Forced Flow: A Critical Review. Int. J. Heat Mass Transfer 130, 141–161. doi:10.1016/j.ijheatmasstransfer.2018.08.048
Kim, D., Kwon, Y., Cho, Y., Li, C., Cheong, S., Hwang, Y., et al. (2009). Convective Heat Transfer Characteristics of Nanofluids under Laminar and Turbulent Flow Conditions, Curr. Appl. Phys. 9, No. 2, e119-e123. doi:10.1016/j.cap.2008.12.047
Li, X., Shi, T., Li, B., Chen, X., Zhang, C., Guo, Z., and Zhang, Q. (2019). Subtractive Manufacturing of Stable Hierarchical Micro-nano Structures on AA5052 Sheet with Enhanced Water Repellence and Durable Corrosion Resistance. Mater. Des. 183, 108152. doi:10.1016/j.matdes.2019.108152
Maleki, A., Elahi, M., Assad, M. E. H., Alhuyi Nazari, M., Safdari Shadloo, M., and Nabipour, N. (2021). Thermal Conductivity Modeling of Nanofluids with ZnO Particles by Using Approaches Based on Artificial Neural Network and MARS. J. Therm. Anal. Calorim. 143, 4261–4272. doi:10.1007/s10973-020-09373-9
Esfe, M. H., Esfandeh, S., Amiri, M. K., and Afrand, M., (2019). A Novel Applicable Experimental Study on the thermal Behavior of SWCNTs(60%)-MgO(40%)/EG Hybrid Nanofluid by Focusing on the thermal Conductivity, Powder Tech. 342, 998–1007.
Mokhtari Moghari, R., Akbarinia, A., Shariat, M., Talebi, F., and Laur, R. (2011). Two Phase Mixed Convection Al2O3-Water Nanofluid Flow in an Annulus. Int. J. Multiphase Flow 37, 585–595. doi:10.1016/j.ijmultiphaseflow.2011.03.008
Moraveji, M. K., and Ardehali, R. M. (2013). CFD Modeling (Comparing Single and Two-phase Approaches) on thermal Performance of Al2o3/water Nanofluid in Mini-Channel Heat Sink. Int. Commun. Heat Mass Transfer 44, 157–164. doi:10.1016/j.icheatmasstransfer.2013.02.012
Nakayama, W. (1986). Thermal Management of Electronic Equipment: A Review of Technology and Research Topics, Appl Mech Reviews. 39(12):1847-1868. doi:10.1115/1.3149515
Osman, S., Sharifpur, M., and Meyer, J. P. (2019). Experimental Investigation of Convection Heat Transfer in the Transition Flow Regime of Aluminium Oxide-Water Nanofluids in a Rectangular Channel. Int. J. Heat Mass Transfer 133, 895–902. doi:10.1016/j.ijheatmasstransfer.2018.12.169
Peng, Y., Parsian, A., Khodadadi, H., Akbari, M., Ghani, K., Goodarzi, M., et al. (2020). Develop Optimal Network Topology of Artificial Neural Network (AONN) to Predict the Hybrid Nanofluids thermal Conductivity According to the Empirical Data of Al2O3 - Cu Nanoparticles Dispersed in Ethylene Glycol, Physica A: Stat. Mech. its Appl. 549, 124015. doi:10.1016/j.physa.2019.124015
Pordanjani, A. H., Aghakhani, S., Afrand, M., Sharifpur, M., Meyer, J. P., Xu, H., et al. (2021). Nanofluids: Physical Phenomena, Applications in thermal Systems and the Environment Effects- a Critical Review. J. Clean. Prod. 320, 128573. doi:10.1016/j.jclepro.2021.128573
Pordanjani, A. H., and Aghakhani, S. (2021). Numerical Investigation of Natural Convection and Irreversibilities between Two Inclined Concentric Cylinders in Presence of Uniform Magnetic Field and Radiation. Heat Transfer Eng., 1–21. doi:10.1080/01457632.2021.1919973
Qi, C., Chen, T., Tu, J., and Yan, Y. (2020). Effects of Metal Foam on Exergy and Entropy of Nanofluids in a Heat Sink Applied for thermal Management of Electronic Components. Int. J. Energ. Res 44, 10628–10651. doi:10.1002/er.5703
Qi, C., Li, K., Li, C., Shang, B., and Yan, Y. (2020). Experimental Study on thermal Efficiency Improvement Using Nanofluids in Heat Sink with Heated Circular cylinder. Int. Commun. Heat Mass Transfer 114, 104589. doi:10.1016/j.icheatmasstransfer.2020.104589
Saeed, M., and Kim, M.-H. (2018). Heat Transfer Enhancement Using Nanofluids (Al2O3-H2o) in Mini-Channel Heatsinks. Int. J. Heat Mass Transfer 120, 671–682. doi:10.1016/j.ijheatmasstransfer.2017.12.075
Safdari Shadloo, M. (2021). Application of Support Vector Machines for Accurate Prediction of Convection Heat Transfer Coefficient of Nanofluids through Circular Pipes. Hff 31 (8), 2660–2679. doi:10.1108/hff-09-2020-0555
Shadloo, M. S., Rahmat, A., Karimipour, A., and Wongwises, S. (2020). Estimation of Pressure Drop of Two-phase Flow in Horizontal Long Pipes Using Artificial Neural Networks. J. Energ. Resour. Tech. 142 (11). 112110. doi:10.1115/1.4047593
Shahsavani, E., Afrand, M., and Kalbasi, R. (2018). Using Experimental Data to Estimate the Heat Transfer and Pressure Drop of Non-newtonian Nanofluid Flow through a Circular Tube: Applicable for Use in Heat Exchangers. Appl. Therm. Eng. 129, 1573–1581. doi:10.1016/j.applthermaleng.2017.10.140
Shahsavar Goldanlou, A., Badri, M., Heidarshenas, B., Hussein, A. K., Rostami, S., and Safdari Shadloo, M. (2020). Numerical Investigation on Forced Hybrid Nanofluid Flow and Heat Transfer inside a Three-Dimensional Annulus Equipped with Hot and Cold Rods: Using Symmetry Simulation. Symmetry 12, 1873. doi:10.3390/sym12111873
Sharifpur, M., Yousefi, S., and Meyer, J. P. (2016). A New Model for Density of Nanofluids Including Nanolayer. Int. Commun. Heat Mass Transfer 78, 168–174. doi:10.1016/j.icheatmasstransfer.2016.09.010
Shi, C., Zhang, X., Zhang, X., Chen, P., and Xu, L. (2021). Ultrasonic Desulfurization of Amphiphilic Magnetic-Janus Nanosheets in Oil-Water Mixture System. Ultrason. Sonochem. 76, 105662. doi:10.1016/j.ultsonch.2021.105662
Sohel Murshed, S. M., and Nieto de Castro, C. A. (2017). A Critical Review of Traditional and Emerging Techniques and Fluids for Electronics Cooling. Renew. Sust. Energ. Rev. 78, 821–833. doi:10.1016/j.rser.2017.04.112
Tariq, H. A., Anwar, M., Malik, A., and Ali, H. M. (2020). Hydro-thermal Performance of normal-channel Facile Heat Sink Using TiO2-H2o Mixture (Rutile–Anatase) Nanofluids for Microprocessor Cooling. J. Therm. Anal. Calorim. 145. 2487–2502. 10.1007/s10973-020-09838-x.
Teng, T.-P., Hung, Y.-H., Teng, T.-C., Mo, H.-E., and Hsu, H.-G. (2010). The Effect of Alumina/water Nanofluid Particle Size on thermal Conductivity. Appl. Therm. Eng. 30, 2213–2218. doi:10.1016/j.applthermaleng.2010.05.036
Tian, M.-W., Rostami, S., Aghakhani, S., Goldanlou, A. S., and Qi, C. (2021). A Techno-Economic Investigation of 2D and 3D Configurations of Fins and Their Effects on Heat Sink Efficiency of MHD Hybrid Nanofluid with Slip and Non-slip Flow. Int. J. Mech. Sci. 189, 105975. doi:10.1016/j.ijmecsci.2020.105975
Toghyani, S., Afshari, E., Baniasadi, E., and Shadloo, M. S. (2019). Energy and Exergy Analyses of a Nanofluid Based Solar Cooling and Hydrogen Production Combined System. Renew. Energ. 141, 1013–1025. doi:10.1016/j.renene.2019.04.073
Yan, S.-R., Aghakhani, S., and Karimipour, A. (2020). Influence of a Membrane on Nanofluid Heat Transfer and Irreversibilities inside a Cavity with Two Constant-Temperature Semicircular Sources on the Lower wall: Applicable to Solar Collectors. Phys. Scr. 95, 085702. doi:10.1088/1402-4896/ab93e4
Yang, L., Huang, J.-n., Mao, M., and Ji, W. (2020). Numerical Assessment of Ag-Water Nano-Fluid Flow in Two New Microchannel Heatsinks: Thermal Performance and Thermodynamic Considerations. Int. Commun. Heat Mass Transfer 110, 104415. doi:10.1016/j.icheatmasstransfer.2019.104415
Zhang, L., Zhang, M., You, S., Ma, D., Zhao, J., and Chen, Z. (2021). Effect of Fe3+ on the Sludge Properties and Microbial Community Structure in a Lab-Scale A2O Process. Sci. Total Environ. 780, 146505. doi:10.1016/j.scitotenv.2021.146505
Zhang, L., Zheng, J., Tian, S., Zhang, H., Guan, X., Zhu, S., et al. (2020). Effects of Al3+ on the Microstructure and Bioflocculation of Anoxic Sludge. J. Environ. Sci. 91, 212–221. doi:10.1016/j.jes.2020.02.01
Zhang, M., Zhang, L., Tian, S., Zhang, X., Guo, J., Guan, X., and Xu, P. (2020). Effects of Graphite particles/Fe3+ on the Properties of Anoxic Activated Sludge. Chemosphere 253, 126638. doi:10.1016/j.chemosphere.2020.126638
Zhang, X., Sun, X., Lv, T., Weng, L., Chi, M., Shi, J., and Zhang, S. (2020). Preparation of PI Porous Fiber Membrane for Recovering Oil-Paper Insulation Structure. J. Mater. Sci. Mater. Electronmaterials Electronics 31 (16), 13344–13351. doi:10.1007/s10854-020-03888-5
Keywords: nanofluid, heatsink, two-phase mixture model, single-phase model, microchannel
Citation: Khetib Y, Abo-Dief HM, Alanazi AK, Saleem HA, Sajadi SM and Sharifpur M (2021) Simulation of Alumina/Water Nanofluid Flow in a Micro-Heatsink With Wavy Microchannels: Impact of Two-Phase and Single-Phase Nanofluid Models. Front. Energy Res. 9:760201. doi: 10.3389/fenrg.2021.760201
Received: 17 August 2021; Accepted: 09 September 2021;
Published: 18 October 2021.
Edited by:
Cong Qi, China University of Mining and Technology, ChinaReviewed by:
Mostafa S. Shadloo, Institut National des Sciences Appliquées de Rouen, FranceAdnan Saeed, Huazhong University of Science and Technology, China
Copyright © 2021 Khetib, Abo-Dief, Alanazi, Saleem, Sajadi and Sharifpur. This is an open-access article distributed under the terms of the Creative Commons Attribution License (CC BY). The use, distribution or reproduction in other forums is permitted, provided the original author(s) and the copyright owner(s) are credited and that the original publication in this journal is cited, in accordance with accepted academic practice. No use, distribution or reproduction is permitted which does not comply with these terms.
*Correspondence: Mohsen Sharifpur, bW9oc2VuLnNoYXJpZnB1ckB1cC5hYy56YQ==