- 1School of Management, Xi’an Jiaotong University, Xi’an, China
- 2National Science Library, Chinese Academy of Sciences, Beijing, China
- 3College of Safety Science and Engineering, Liaoning Technical University, Fuxin, China
- 4Academy of Mathematics and Systems Science, Chinese Academy of Sciences, Beijing, China
- 5School of Economics and Management, University of Chinese Academy of Sciences, Beijing, China
- 6Center for Forecasting Science, Chinese Academy of Sciences, Beijing, China
Electricity demand forecasting plays a fundamental role in the operation and planning procedures of power systems, and the publications related to electricity demand forecasting have attracted more and more attention in the past few years. To have a better understanding of the knowledge structure in the field of electricity demand forecasting, we applied scientometric methods to analyze the current state and the emerging trends based on the 831 publications from the Web of Science Core Collection during the past 20 years (1999–2018). Employing statistical description analysis, cooperative network analysis, keyword co-occurrence analysis, co-citation analysis, cluster analysis, and emerging trend analysis techniques, this study gives a comprehensive overview of the most critical countries, institutions, journals, authors, and publications in this field, cooperative networks relationships, research hotspots, and emerging trends. The results can provide meaningful guidance and helpful insights for researchers to enhance the understanding of crucial research, emerging trends, and new developments in electricity demand forecasting.
Introduction
Nowadays, electricity is the most critical energy and plays an indispensable role in many fields. In recent years, a large number of researchers have proved that the accuracy of electricity demand forecasting is the basis of power system planning and operation (Raza and Khosravi, 2015; Kuster et al., 2017). Accurate electricity demand forecasting can not only ensure the reliable operation of power systems but also have an excellent cost-saving potential for power corporations (Al-Ghandoor et al., 2009).
With the increase of electricity demand and the rapid development of artificial intelligence, electricity demand forecasting has attracted more and more attention, and new research methods, emerging trends, and new developments have emerged at the same time (Alfares and Nazeeruddin, 2002). A lot of forecasting techniques and researches have been proposed and applied in electricity load forecasting (Hippert et al., 2001; Bourdeau et al., 2019), and support vector regression (Mohandes, 2002; Sousa et al., 2014) and ANN (Bhattacharyya and Thanh, 2004; Cavallaro, 2005) are widely used in recent years. In addition, more and more hybrid models are applied in electricity load forecasting. Mohan et al. (2018) applied dynamic mode decomposition (DMD) to extract the spatiotemporal dynamic characteristics of power loads that change with time and forecasted future electric load. Al-Musaylh et al. (2019) presented a hybrid model that including multivariate adaptive regression, and multiple linear regression, artificial neural network models to forecast short-term electricity demand in Australia.
In the past, many scholars had reviewed the methods, techniques, and methods of evaluation in the field of electricity demand forecasting. Shao et al. (2017) conducted decomposition methods for electricity demand forecasting and presented that Empirical mode decomposition and wavelet decomposition are the most popular technique. Kuster et al. (2017) presented a review that revealed that artificial neural networks, multivariate regression, time series analysis, and multiple linear regression are popular and effective methods for electricity and electricity forecasting. Hong et al. (2016) offered a summary of the recent research progress about probabilistic energy forecasting and introduced the Global Energy Forecasting Competition 2014 with load forecasting. However, previous review studies focused on the techniques and methods already used in power load forecasting and very little research has analyzed the collaborative relationship, new developments, and emerging trends of electricity demand prediction and visualized the knowledge map of the field.
Scientometrics is a crucial method to explore the scientific research rules, identify research trends, and evaluate the development of the field (Kim and Chen, 2015; Olawumi and Chan, 2018). Yu and Xu (2017) analyzed the current status of carbon emissions trading and discussed future research trends by the scientometric method. Olawumi and Chan (2018) evaluated the research development status of institutions, countries, and journals in the research field. Niazi and Hussain (2011) evaluated all sub-domains of agent-based computing and found agent-based computing extensive in other dominos.
With the rapid growth of attention and publications for electricity demand forecasting, it is necessary and urgent to summarize the current situation and analyze the collaborative relationship, new developments, and emerging trends of electricity demand forecasting. According to Web of Science (WoS), about 831 papers related to electricity demand forecasting have been published in the last 20 years (1999–2018), but no research has been performed to analyze and visualize the overall knowledge structure of this topic. Therefore, the purpose of this study is to assess the research on electricity demand forecasting and seek an overview of the structure of the relevant information. In this study, scientometrics analysis is performed in the electricity demand forecasting domain, and software named CiteSpace is utilized to analyze and visualize the emerging trends. CiteSpace, invented by Chen Chaomei, is a particularly popular software of scientometrics that can be used to identify knowledge areas and emerging trends in a visual form (Lairmore et al., 2000; Chen, 2006). In recent years, CiteSpace has attracted the interest of many scholars and has been applied to many fields. Chen et al. (2014) used published literature to investigate new developments and emerging trends in the field of regenerative medicine. Yang et al. (2018) comprehensively analyzed the status of PM2.5 research and found the frontiers of research in this field. Fang et al. (2018) examined the interaction between climate change and tourism and described the research characteristics of the field in the past 25 years.
The structure of this article is as follows: Methodology gives the source and search strategy of publications. Basic summary of electricity demand forecasting research introduces the basic summary of electricity demand forecasting research. In Cooperative structure in the field of power demand forecasting, this study visualizes the cooperation network of authors, institutions, and countries/regions. Active topics and emerging trends analyzes the active topics and emerging trends in electricity demand forecasting, including keyword analysis and co-citation analysis. Conclusions gives comprehensive conclusions and discussions.
Methodology
This section provides the search strategy of data. For the searched phrase in Web of Science (WoS), some articles perform an exact search on a certain phrase, such as Yu and Xu (2017), and some articles perform an exact search on multiple phrases and merge the results, such as Chen (2017). Searching with inexact themes requires that the query words do not have to appear consecutively, which gets a large number of publications that are not related to the search subject. It is worth noting that this article searches precise themes and non-precise titles. This article focuses on a more subdivided field, and the number of related articles is little. Searching with precise themes will ignore indispensable publications in this field and affect the conclusion of this article seriously. To improve the recall rate and avoid retrieving a large number of irrelevant publications, this article adopts the strategies of searching with precise themes and inexact titles. To ensure the accuracy of publications being retrieved, this study culled out irrelevant publications through means of manual screening.
The data used for analysis in our research is downloaded from WoS, and the search strategy followed is below:
1) TS=(“electric* load forecast*” OR “electric* load predict*” OR “electric* demand forecast*” OR “electric* demand predict*" OR “electric* consumption forecast*” OR “electric* consumption predict*” OR “power load forecast*” OR “power load predict*” OR “power demand forecast*” OR “power demand predict*” OR “power consumption forecast*” OR “power consumption predict*” OR “grids load forecast*” OR “grids load predict*”) OR TI=(electric* load forecast* OR electric* load predict* OR electric* demand forecast* OR electric* demand predict* OR electric* consumption forecast* OR electric* consumption predict* OR power load forecast* OR power load predict* OR power demand forecast* OR power demand predict* OR power consumption forecast* OR power consumption predict* OR grids load forecast* OR grids load predict*)
2) Databases = Science Citation Index Expanded (SCI-EXPANDED) and Social Sciences Citation Index (SSCI)
3) Timespan = “1999–2018”
4) Document types = “article” or “review”
5) Literature type = “English”; 901 publications are retrieved, and 70 publications that were not related to electricity demand forecasting were deleted through means of manual screening. Finally, 831 publications were downloaded on October 18, 2019.
Basic Summary of Electricity Demand Forecasting Research
This section provides statistical analysis from five parts, including distribution of time, subject categories, high-yield journals, high-yield institutions, high-yield authors, and highly cited publications in electricity demand forecasting.
The Distribution of Publications
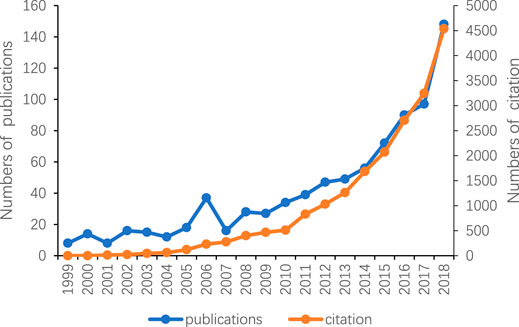
Figure 1 shows that the number of publications in electricity demand forecasting is increasing over the past 20 years, from eight publications in 1999 to 148 publications in 2018, with steady growth in 199–2009 and rapid growth in 2010–2018. The publications have been cited 19,506 times from 1999 to 2018. The number of citations is increasing, year by year, and has similar growth trends with the numbers of publications. From this, it can be seen that electricity demand forecasting has received more and more attention, especially in the last decade.
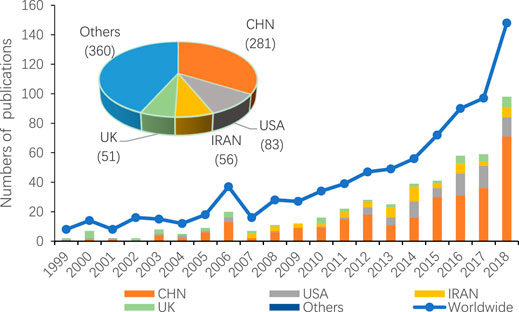
Figure 2 shows that China, the United States, Iran, and the United Kingdom are the main countries publishing papers in this field. China is the country with the most publications, especially after 2015, the number of publications in China exceeds the sum of the United Kingdom, the United States, and Iran. It should be noted that the publications of Taiwan and Hong Kong are included in China. The numbers of publications in the United States and the United Kingdom are both fluctuating. Iran has published its first publication in 2007, and Iran has published more than three papers each year. In 1999–2018, China published 33.81% (281) of the total publications in electricity demand forecasting, the US for 9.99% (83), Iran for 6.74% (56), and the United Kingdom for 6.14% (51).
Subject Categories
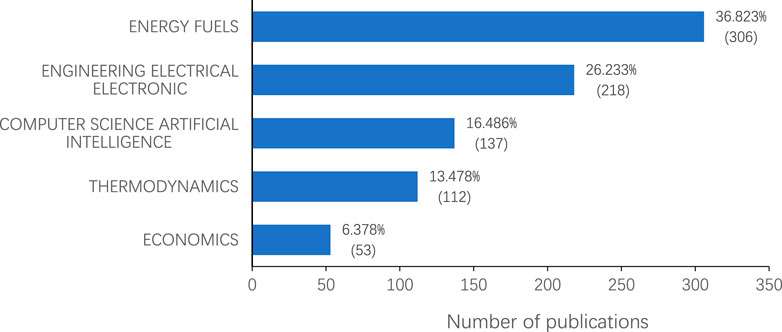
Figure 3 shows that electricity demand forecasting is a cross-disciplinary research area, including energy fuels accounting for 36.82% (306), engineering electrical electric accounting for 26.23% (218), computer science artificial intelligence accounting for 16.49% (137), thermodynamics accounting for 13.48% (112) and economics accounting for 6.38% (53).
High-Yield Journals
199 journals published papers in electricity demand forecasting from 1999 to 2018 in our dataset. Table 1 lists the top 10 journals, and it can be seen that energy and power are areas of most significant concern to the top 10 journals. “Energy” is the highest yield journal with 81 publications, followed by “Energies”, “International Journal of Electrical Power Energy Systems”, “Applied Energy”, “Energy Conversion and Management”, “Electric Power Systems Research”, “Energy and Buildings”, “International Journal of Forecasting”, “IEEE Transactions on Power Systems”, and “Lecture Notes in Computer Science”. In the top 10 journals, the impact factor of “Energy”, “Applied Energy”, “Energy Conversion and Management”, and “IEEE Transactions on Power Systems” are all more than 5.
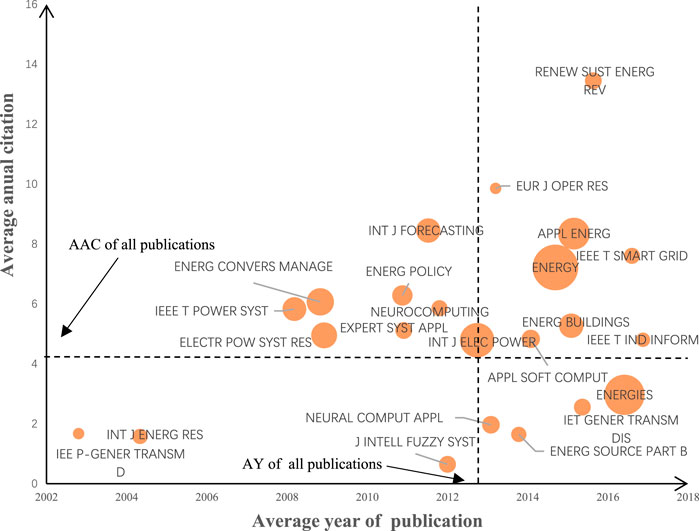
Figure 4 shows the distribution of leading journals in electricity demand forecasting. There are 29 journals in Figure 4 and each of them published at least five publications. We denoted with
Figure 4 shows the number of publications, publication time, and citations of significant journals in this field. The journals in the 1, 2, and 4 quadrants are worthy of our attention, especially the journals in the first quadrant, whose publications had been cited more in recent years (such as “Renewable and Sustainable Energy Reviews”, “European Journal of Operational Research”, “Applied Energy”, “IEEE Transactions on Smart Grid”, “Energy”, “Energy and Buildings”, “Applied Soft Computing”, “IEEE Transactions on Industrial Informatics”). The journals in the second quadrant are likely to publish much-watched publications by 2012. Journals in the fourth quadrant published articles with low citations recently, but their articles may become hotspots in the future. There are some journals, such as “Energy” and “Energies”, had published the most publications in this field.
High-Yield Institutions
848 institutions published papers in electricity demand forecasting from 1999 to 2018. Table 2 lists the top 10 institutions, it can be seen that five of the top 10 institutions come from China and China also published the largest number of articles, which is also the same conclusion as Figure 2. North China Electric Power University is the highest yield Institution with 57 publications, followed by Lanzhou University, University of North Carolina, Islamic Azad University, Oriental Institute of Technology, Electricite de France edf, University of Tehran, University of Oxford, Dongbei University of Finance Economics, and Hefei University of Technology.
High-Yield Authors
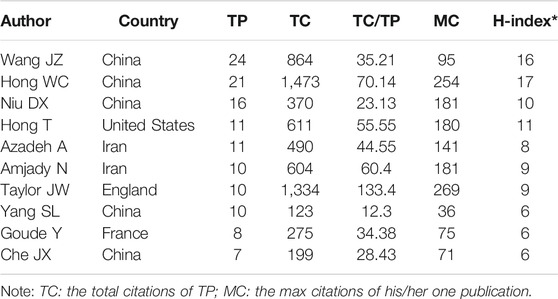
Table 3 shows high-yield authors, published the most publications in this field, mainly from China, the United States, Iran, England, and France. Table 3 shows that Wang JZ had published the most articles in this field, with 24 publications. Hong WC is the most cited author, with a total of 1,473 citations, and had 17 publications that had been cited more than 17 times. The publications of Taylor JW have cited an average of 133.4 times, and the maximum number of citations of his publications was cited 269 times.
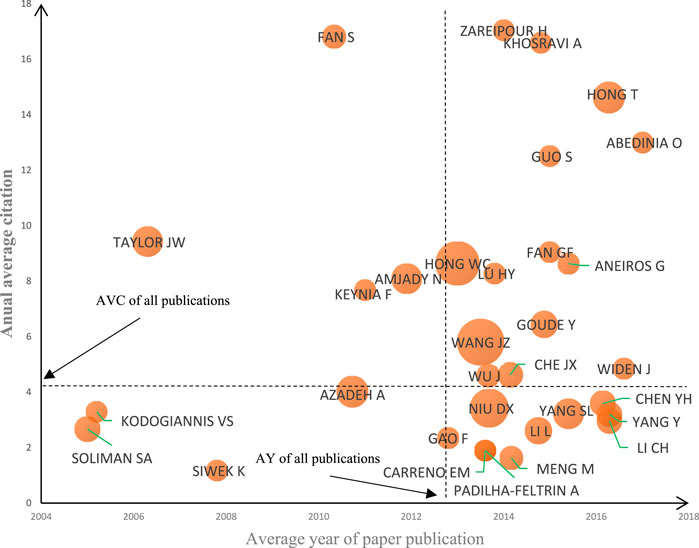
Figure 5 shows the distribution of leading authors in electricity demand forecasting. There are 32 authors in Figure 5 and each of them published at least five publications. Similar to Figure 4,
Figure 5 shows the number of publications, publication time, and citations of leading authors in this field. The authors in the 1, 2, and 4 quadrants are worthy of our attention, especially the authors in the first quadrant, whose articles have received extensive attention in recent years, such as Zareipourh, Khosravia, Hong T, Abediniao, and Guo S. The authors of the second quadrant is likely to publish a much-watched article by 2012. Authors of the fourth quadrant recently published articles with low attention, but their articles may become hotspots in the future. There are also some authors, such as Hong WC, Wang JZ, and Hong T, who published the most publications in this field.
Highly Cited Publications
The top 10 highly cited publications are shown in Table 4. Only the article published by Li et al. (2013) on “Knowledge-Based Systems” was published after 2009. Others were published before 2009. Among them, Taylor JW, Hong WC, and other authors are shown in Figure 5. It is worth noting that Alfares HK; Nazeeruddin M and Taylor JW had paid little attention to this field after 2009. These articles are an essential foundation in this field and are helpful for researchers to understand the important basics of this field. Alfares and Nazeeruddin (2002) offered a review and categorization of electricity demand forecasting techniques. They classified these techniques into nine categories and discussed these technique’s advantages and disadvantages.
Table 5 shows the top 10 publications with the highest average citations per year. Only the article published by Hahn et al. (2009) in “European Journal of Operational Research” was published in 2009. Others were published after 2013. Among them, Hong Tao, Guo Sen, Fan Shu, and other authors are shown in Figure 5. It is worth noting that the publications with the highest average citations per year are mainly published in the past 5 years, indicating that the electricity demand forecasting may have received more attention in the near future, or new developments have appeared. Hong and Fan (2016) offered a review of probabilistic power load forecasting and introduced the methodologies, techniques, applications, evaluation methods, and future research needs.
Cooperative Structure in the Field of Power Demand Forecasting
Author Cooperation Network
The author’s cooperative network shows the cooperation of all authors in the 831 papers in the field of electricity demand forecasting. The node size is proportional to the number of the author’s publications, and the connection between nodes represents the author’s cooperative relationship. The thickness of the connection represents the strength of the cooperation between the authors. The color of the connection between nodes and nodes corresponds to the time when the cooperation first appeared. The change of connection’s color from cool, such as blue and green, to warm, such as yellow, indicates the change of time from early to recent.
There are 2,143 nodes and 3,561 edges in the author’s cooperation network. Obviously, there are many scholars involved in the field of electricity demand forecasting, but most of them only cooperate in a small scope. Many small independent networks of cooperation have not formed extensive cooperation. There is also a large independent cooperation network in the cooperative network. This study extracted the four largest cooperative networks from the author’s cooperation network, as shown in Figure 6.
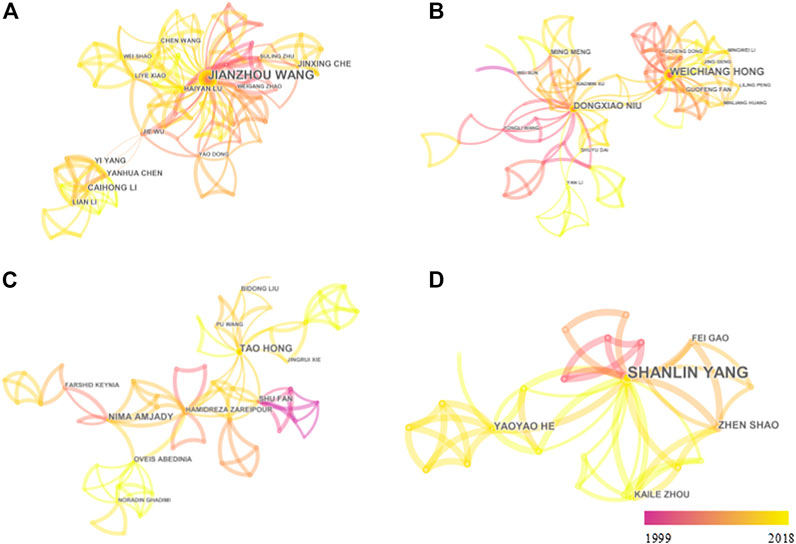
FIGURE 6. Author cooperation network in electricity demand forecasting (A, B, C, D represent the four largest cooperative networks).
Figure 6A shows the four largest cooperative networks, with 74, 70, 53, and 24 nodes in each of the four networks. Part a of Figure 6B is the largest cooperative network with 74 nodes. Among them, Jianzhou Wang, Caihong Li, Yang Yi, Lian Li, Chen Wang, Weigang Zhao, Jie Wu, and other authors constitute a research cluster based on Lanzhou University. Part b of Figure 6C is the second network with 70 nodes. Among them, Dongxiao Niu, Ming Meng, and other authors constitute the research cluster based on North China Electric Power University. Weichang Hong, Guofeng Fan, Liling Peng, and other authors. It constitutes a research cluster based on the Pingdingshan Normal University of Jiangsu Normal University. Part c of Figure 6D is the third network with 53 nodes. Among them, Tao Hong, Bidong Liu, Pu Wang, Jingrui Xie, and other authors, who are researchers at the University of South Carolina, constitute a research cluster. Nima Amjady, Oveis Abedinia, and other authors, who are researchers at the University of Semnan, constitute a research cluster, and authors such as Shu Fan and Hamidreza Zareipour, who are researchers at the University of Calgary, constitute a research cluster. Authors such as Fei Gao, Shanlin Yang, Yaoyao He, Zhen Shao, and Kaile Zhou, who are researchers at Hefei University of Science and Technology, constitute a research cluster. Other scholars with a large number of publications and extensive cooperation include Azadeh A of Tehran University; Goude Y of the University of Paris-Sud; Taylor JW of Oxford University. Although there are many participants, there are more networks of less than 10 partners in the cooperation network, indicating that cooperation in the field of electricity demand forecasting is lack.
Institutional Cooperation Network
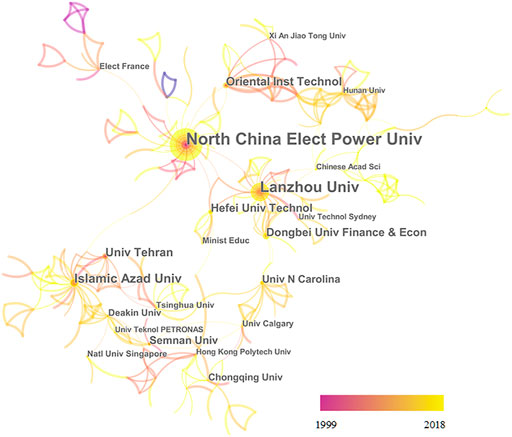
The institutional cooperative network in electricity demand forecasting has 859 nodes and 894 edges. Figure 7 shows the largest independent network in the institutional cooperation network, with 217 nodes. North China Electric Power University and Lanzhou University are the leading contributors to the cooperation in this field and have published the most articles. 10 institutions that have more than 10 connections were listed: North China Electric Power University (57), Lanzhou University (35), Islamic Azad University (18), Oriental Institute of Technology (15), University of Tehran (14), Hefei University of Technology (13), Dongbei University of Finance and Economics (13), University of Oxford (12), Semnan University (11), University of North Carolina (10). Most institutions in this field are located in China, and there is more cooperation between domestic institutions and transnational institutions. The cooperators of Lanzhou University in China are mainly the University of Chinese Academy of Sciences, Hefei University of Science and Technology, Dongbei University of Finance and Economics. It is worth noting that Wang Jinzhou is a highly productive author in this field, and he has worked at Lanzhou University and Dongbei University of Finance and Economics, which also indicates the cooperative relationship between Lanzhou University and Dongbei University of Finance and Economics. The University of Tehran and Islamic Azad University are the main partners of each other, and both of them are located in Iran. Besides, cross-border cooperation is widespread, with Lanzhou University, University of Technology, Tsinghua University, and Semnan University cooperating with each other. At the same time, it is evident that compared with the author’s cooperation network, and the institutional cooperation network is closer.
Country/Region Cooperation Network
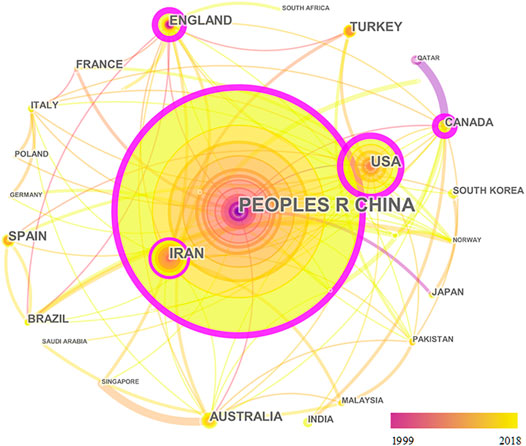
The countries cooperative network for electricity demand forecasting has 37 nodes and 89 edges (deleting links with fewer than two). Figure 8 shows the largest connected network that contains 30 countries/regions. The top 10 countries are the People’s Republic of China, the USA, Iran, England, Turkey, Spain, Australia, Brazil, Canada. From Figure 8, it can be found that China is the largest contributor to the country’s cooperation network in this field. The main partners of China are the United States (16), Australia (8) and Canada (8), the United Kingdom (7), and Japan (4). The figures in parentheses indicate the number of articles published in cooperation between the two countries. The main partners of the United States are China (15), Italy (3), Pakistan (3), and Poland (3). The main partners of Iran are Australia (3), Malaysia (3), Canada (2), United Kingdom (2), and Hungary (2). The main partners of the UK are China (7), France (3), Brazil (2), Singapore (2), and the United States (2).
Active Topics and Emerging Trends
Co-Occurrence Network
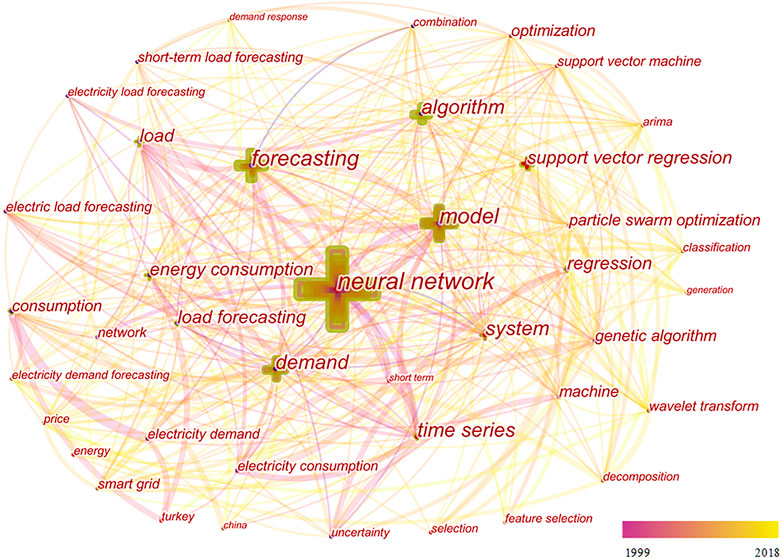
Keywords are a clear sign of the critical content of research. Co-occurrence analysis is used to analyze the number of occurrences of a pair of words within the same literature and measure the relationship between different publications. The burst detection of keywords is often applied to reveal the emergence of hotspots and active topics. Figure 9 shows a keyword co-occurrence network for electricity demand forecasting. For ease of observation, Figure 9 only retains nodes where the co-occurrence frequency is greater than 10. The keyword co-occurrence network is intricate and complex, and the nodes are closely related. It mainly presents the nouns and methods used in this field. The keywords with occurrence frequency higher than 100 are neural network (351), model (190), forecasting (170), demand (127), system (125), algorithm (123), and time series (109). It can be found that the left part of Figure 9 mostly refers to the main terms related to electricity demand forecasting such as forecasting, load, demand, consumption, etc., and the main methods involved in electricity demand forecasting are the neural network, model, algorithm, support vector regression, regression, etc.
Table 6 shows 17 keywords with the highest bursts, and their strength, begin time and end time. The red line in Table 6 represents the specific time period for keywords burst. This study found that the neural network is the keyword with the most strength (9.4035), and its duration is as long as 9 years (1999–2007), which indicates that the neural network is one of the most essential basic methods in this field. At the same time, the larger keywords detected by burst are mostly methods. The reason is that the field is too narrow, and the research is more concentrated in this field. On the other hand, the new hotspots in this field are mostly referred to as the improvement of methods.
Co-Citation Network Analysis
Co-citation network analysis is an analysis tool, usually used to examine a large number of documents and reveal the knowledge map of a scientific discipline. In co-citation networks, some key nodes are easily identified because of their prominent structure and characteristics.
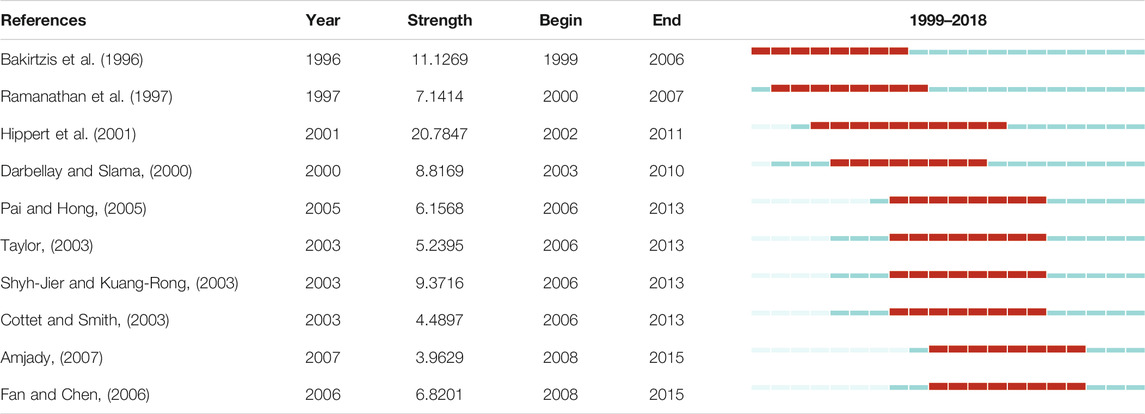
The publication with citation bursts represents it has attracted special attention in this field for a period of time. Table 7 shows that the top-ranked references by bursts were published by Hippert et al. (2001), with bursts strength of 20.7847. The second one was Bakirtzis et al. (1996), with bursts strength of 11.1269.
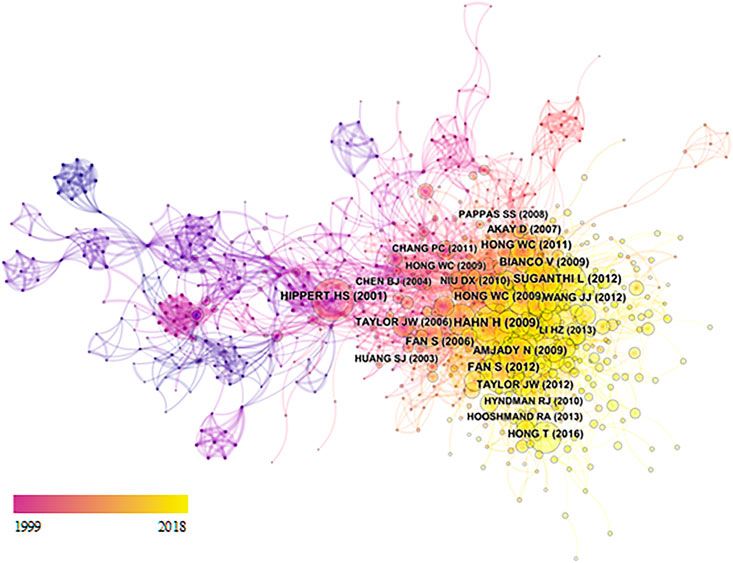
There are 875 nodes and 4,429 edges in Figure 10. The development history and research Frontier in this field, and the crucial articles in this field are mainly concentrated after 2009, which also shows that the articles in this field have experienced explosive growth in recent 10 years. The authors of crucial articles overlap with a large number of high-yield and high-cited authors in the field, such as Hong Tao, Fan S, Taylor JW, and so on. Hippert et al. (2001) reviewed articles published from 1991 to 1999 to assess the practical application of neural networks in short-term electricity load forecasting, and evaluate the design and testing of the neural networks presented in these papers critically. So it becomes a key node in the network. Taylor et al. (2006) assessed the forecast accuracy of short-term electricity demand forecasting with six univariate methods. Fan and Hyndman (2012) proposed a semiparametric model to estimate the impact of electricity demand data on model variables. Hong (2011) proposed an electricity demand forecasting method combining chaotic artificial bee colony algorithm and a seasonal recursive support vector regression model. Suganthi and Samuel (2012) reviewed various energy demand prediction models, such as regression, time series, fuzzy logic, ARIMA, support vector regression, and neural networks.
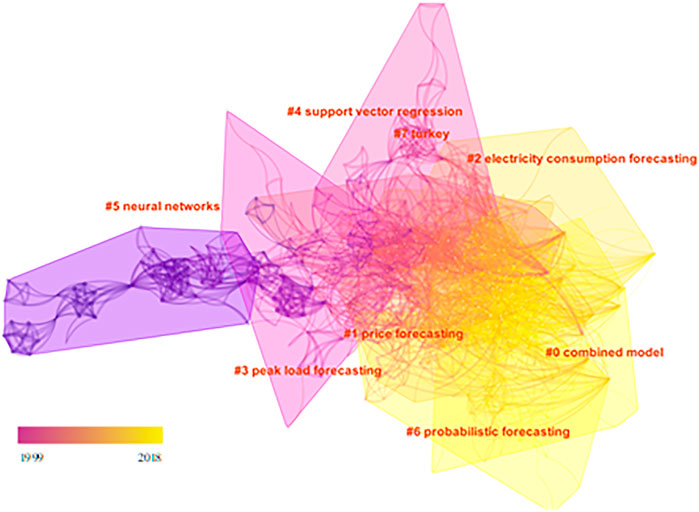
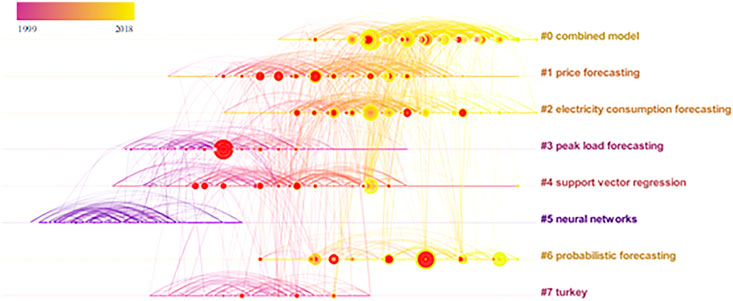
It is obvious that the network has six clusters of a combined model, price forecasting, electricity consumption forecasting, peak load forecasting, support vector regression, neural networks, probabilistic forecasting, and turkey in Figure 11. Figure 12 is a line graph of the co-citation of the literature, similar to the keyword timeline. It shows the time evolution process of the six clusters. From the results, the earliest cluster is neural networks, and it’s also the same as the keyword timeline visualization results, which illustrates the importance of neural networks in this field. The combined model is the largest cluster, which has been continuously appearing since 2004, indicating that the research Frontier is a hybrid model. Price forecasting, electricity consumption forecasting, peak load forecasting, and probabilistic forecasting reflect the main content of this field. Price forecasting and peak load forecasting are the contents of early attention. Probabilistic forecasting and electricity consumption forecasting are more concerned in recent years. Support vector regression shows that it is one of the important methods in the field. Turkey was the main cluster between 1998 and 2008, indicating that during this period turkey’s power forecasting was an area of concern. From the clustering results, the changes in the method of the field and changes in the content of the research. In particular, it is pointed out that the recent research method hotspot is the combined model.
In Table 8, Size represents the number of articles in a cluster, and there are 140 articles in the cluster (#0). Silhouette is a measure of a cluster’s homogeneity, and the closer its value is to 1, the more homogeneous it is. Mean (Year) represents the average year of publications in a cluster, and it is used to evaluate the average time when the cluster appears. All silhouettes of eight clusters are greater than 0.99, which means the clustering results are reliable.
Conclusion
This study offered a bibliometric and visualization analysis on electricity demand forecasting based on 831 publications retrieved from the Web of Sciences. A basic summary, integrated knowledge maps, hot topics, and emerging trends of electricity demand forecasting are presented by statistical description analysis, cooperative network analysis, keyword co-occurrence analysis, co-citation analysis, cluster analysis, and emerging trend analysis techniques. Some interesting and useful conclusions are as follows.
First, electricity demand forecasting has received more and more attention, the numbers of citations and publications are increasing rapidly, especially in the last decade. “Energy fuels”, which account for 36.82%, is the largest subject category in the electricity demand forecasting research area. “Energy” is the highest yield journal with 81 publications, followed by “Energies”, “International Journal of Electrical Power Energy Systems” and “Applied Energy”. “Renewable and Sustainable Energy Reviews”, “European Journal of Operational Research” and “Applied Energy”, are of constant interest to researchers in this field recently. North China Electric Power University, Lanzhou University, University of North Carolina, Islamic Azad University and Oriental Institute of Technology is the top five yield Institution. Wang Jianzhou, which publishing 24 articles in the field, is the most high-yield author, followed by Hong Weichang, Niu Dongxiao, and Hong Tao. In recent years, the publications of Zareipourh, Khosravia, Hong, Abediniao, and Guo have attracted much attention, and the publications of Fan have attracted lots of attention all the time. The top 10 highly cited publications were mainly published before 2009 but the top 10 publications with the highest average citations per year were mainly published after 2013. The reason may be that earlier publications were the essential foundation of this field and got a lot of citations, and recent publications were the current research focus and got more citations recently.
Second, there are 2,143 scholars involved in the field of electricity demand forecasting but most of them only cooperate in a very small scope and almost cooperate with authors in the same institution. The largest cooperative networks were formed with Wang Jianzhou, who is the largest Structural hole in the cooperative networks. North China Electric Power University, Lanzhou University, Islamic Azad University, Oriental Institute of Technology, and the University of Tehran are the five most irreplaceable productive institutions and contributors in the field of electricity demand forecasting. The People’s Republic of China (including Taiwan, Hong Kong, and Macau), United States, Iran, England, and Turkey are the five most significant contributors to country/region cooperation networks.
Third, combined model, neural network, and support vector regression are the main methods in electricity load forecasting, and support vector regression, combined model, and wavelet transform are hotspots methods. Price forecasting, electricity consumption forecasting, peak load forecasting, and probabilistic forecasting are primary researches in electricity demand forecasting. Probabilistic forecasting and electricity consumption forecasting are hotspots.
The basic situation of subject classification, journals, authors, institutions, countries, and highly cited papers in the electricity demand forecasting can be figured out based on the research of this study. At the same time, the collaboration of countries/regions, institutions, and authors is also studied in our study. Furthermore, emerging trends and new developments in this field are also discussed in this research. The results of this research provide a comprehensive description of electricity demand forecasting and are helpful for scholars to maintain the development of this field.
The limitations of our study are that, due to the limits of co-citation analysis in citespace, the literature in our paper are only retrieved from the core database of WoS, document types are limit in “article” or “review”, and literature type are limit in “English”, which may make some significant literature have been overlooked.
Data Availability Statement
The original contributions presented in the study are included in the article/Supplementary Material, further inquiries can be directed to the corresponding author.
Author Contributions
DY: Conceptualization, Methodology, Software, Formal analysis, Writing-original draft preparation. JG: Conceptualization, Resources, Funding acquisition. JL: Methodology, Software, Formal analysis. SW: Supervision, Project administration, Funding acquisition. SS: Conceptualization, Methodology, Writing–original draft.
Funding
This research work was partly supported by the National Natural Science Foundation of China under Grants No. 72101197 and No. 71988101, and by the Fundamental Research Funds for the Central Universities under Grant No. SK2021007.
Conflict of Interest
The authors declare that the research was conducted in the absence of any commercial or financial relationships that could be construed as a potential conflict of interest.
Publisher’s Note
All claims expressed in this article are solely those of the authors and do not necessarily represent those of their affiliated organizations, or those of the publisher, the editors and the reviewers. Any product that may be evaluated in this article, or claim that may be made by its manufacturer, is not guaranteed or endorsed by the publisher.
Supplementary Material
The Supplementary Material for this article can be found online at: https://www.frontiersin.org/articles/10.3389/fenrg.2021.771433/full#supplementary-material.
References
Ahmad, A. S., Hassan, M. Y., Abdullah, M. P., Rahman, H. A., Hussin, F., Abdullah, H., et al. (2014). A Review on Applications of ANN and SVM for Building Electrical Energy Consumption Forecasting. Renew. Sustainable Energ. Rev. 33, 102–109. doi:10.1016/j.rser.2014.01.069
Akay, D., and Atak, M. (2007). Grey Prediction With Rolling Mechanism for Electricity Demand Forecasting of Turkey. Energy. 32, 1670–1675. doi:10.1016/j.energy.2006.11.014
Al-Ghandoor, A., Jaber, J. O., Al-Hinti, I., and Mansour, I. M. (2009). Residential Past and Future Energy Consumption: Potential Savings and Environmental Impact. Renew. Sustainable Energ. Rev. 13, 1262–1274. doi:10.1016/j.rser.2008.09.008
Al-Musaylh, M. S., Deo, R. C., Adamowski, J. F., and Li, Y. (2019). Short-Term Electricity Demand Forecasting Using Machine Learning Methods Enriched With Ground-Based Climate and ECMWF Reanalysis Atmospheric Predictors in Southeast Queensland, Australia. Renew. Sustainable Energ. Rev. 113, 109293. doi:10.1016/j.rser.2019.109293
Alfares, H. K., and Nazeeruddin, M. (2002). Electric Load Forecasting: Literature Survey and Classification of Methods. Int. J. Syst. Sci. 33, 23–34. doi:10.1080/00207720110067421
Amjady, N. (2007). Short-term Bus Load Forecasting of Power Systems by a New Hybrid Method. IEEE Trans. Power Syst. 22, 333–341. doi:10.1109/Tpwrs.2006.889130
Bakirtzls, A. G., Petridls, V., Klartzis, S. J., Alexladls, M. C., and Malssls, A. H. (1996). A Neural Network Short Term Load Forecasting Model for the Greek Power System. IEEE Trans. Power Syst. 11, 858–863. doi:10.1109/59.496166
Bhattacharyya, S. C., and Thanh, L. T. (2004). Short-Term Electric Load Forecasting Using an Artificial Neural Network: Case of Northern Vietnam. Int. J. Energ. Res. 28, 463–472. doi:10.1002/er.980
Boroojeni, K. G., Amini, M. H., Bahrami, S., Iyengar, S. S., Sarwat, A. I., and Karabasoglu, O. (2017). A Novel Multi-Time-Scale Modeling for Electric Power Demand Forecasting: From Short-Term to Medium-Term Horizon. Electric Power Syst. Res. 142, 58–73. doi:10.1016/j.epsr.2016.08.031
Bourdeau, M., Zhai, X. q., Nefzaoui, E., Guo, X., and Chatellier, P. (2019). Modeling and Forecasting Building Energy Consumption: A Review of Data-Driven Techniques. Sustainable Cities Soc. 48, 101533. doi:10.1016/j.scs.2019.101533
Bunn, D. W. (2000). Forecasting Loads and Prices in Competitive Power Markets. Proc. IEEE. 88, 163–169. doi:10.1109/5.823996
Cavallaro, F. (2005). Electric Load Analysis Using an Artificial Neural Network. Int. J. Energ. Res. 29, 377–392. doi:10.1002/er.1054
Chen, C. (2006). CiteSpace II: Detecting and Visualizing Emerging Trends and Transient Patterns in Scientific Literature. J. Am. Soc. Inf. Sci. 57, 359–377. doi:10.1002/asi.20317
Chen, C., Dubin, R., and Kim, M. C. (2014). Emerging Trends and New Developments in Regenerative Medicine: a Scientometric Update (2000 - 2014). Expert Opin. Biol. Ther. 14, 1295–1317. doi:10.1517/14712598.2014.920813
Chen, C. (2017). Science Mapping: A Systematic Review of the Literature. J. Data Info Sci. 2, 1–40. doi:10.1515/jdis-2017-0006
Cottet, R., and Smith, M. (2003). Bayesian Modeling and Forecasting of Intraday Electricity Load. J. Am. Stat. Assoc. 98, 839–849. doi:10.1198/016214503000000774
Darbellay, G. A., and Slama, M. (2000). Forecasting the Short-Term Demand for Electricity. Int. J. Forecast. 16, 71–83. doi:10.1016/S0169-2070(99)00045-X
Fan, S., and Chen, L. (2006). Short-term Load Forecasting Based on an Adaptive Hybrid Method. IEEE Trans. Power Syst. 21, 392–401. doi:10.1109/Tpwrs.2005.860944
Fan, S., and Hyndman, R. J. (2012). Short-Term Load Forecasting Based on a Semi-Parametric Additive Model. IEEE Trans. Power Syst. 27, 134–141. doi:10.1109/Tpwrs.2011.2162082
Fang, Y., Yin, J., and Wu, B. (2018). Climate Change and Tourism: a Scientometric Analysis Using CiteSpace. J. Sustainable Tourism. 26, 108–126. doi:10.1080/09669582.2017.1329310
Hahn, H., Meyer-Nieberg, S., and Pickl, S. (2009). Electric Load Forecasting Methods: Tools for Decision Making. Eur. J. Oper. Res. 199, 902–907. doi:10.1016/j.ejor.2009.01.062
Hippert, H. S., Pedreira, C. E., and Souza, R. C. (2001). Neural Networks for Short-Term Load Forecasting: A Review and Evaluation. IEEE Trans. Power Syst. 16, 44–55. doi:10.1109/59.910780
Hong, T., and Fan, S. (2016). Probabilistic Electric Load Forecasting: A Tutorial Review. Int. J. Forecast. 32, 914–938. doi:10.1016/j.ijforecast.2015.11.011
Hong, T., Pinson, P., Fan, S., Zareipour, H., Troccoli, A., and Hyndman, R. J. (2016). Probabilistic Energy Forecasting: Global Energy Forecasting Competition 2014 and beyond. Int. J. Forecast. 32, 896–913. doi:10.1016/j.ijforecast.2016.02.001
Hong, W.-C. (2011). Electric Load Forecasting by Seasonal Recurrent SVR (Support Vector Regression) With Chaotic Artificial Bee colony Algorithm. Energy. 36, 5568–5578. doi:10.1016/j.energy.2011.07.015
Hsu, C.-C., and Chen, C.-Y. (2003). Applications of Improved Grey Prediction Model for Power Demand Forecasting. Energ. Convers. Management. 44, 2241–2249. doi:10.1016/S0196-8904(02)00248-0
Kaboli, S. H. A., Fallahpour, A., Selvaraj, J., and Rahim, N. A. (2017). Long-Term Electrical Energy Consumption Formulating and Forecasting via Optimized Gene Expression Programming. Energy. 126, 144–164. doi:10.1016/j.energy.2017.03.009
Kim, M. C., and Chen, C. (2015). A Scientometric Review of Emerging Trends and New Developments in Recommendation Systems. Scientometrics. 104, 239–263. doi:10.1007/s11192-015-1595-5
Kuster, C., Rezgui, Y., and Mourshed, M. (2017). Electrical Load Forecasting Models: A Critical Systematic Review. Sustainable Cities Soc. 35, 257–270. doi:10.1016/j.scs.2017.08.009
Lairmore, M. D., Albrecht, B., D'souza, C., Nisbet, J. W., Ding, W., Bartoe, J. T., et al. (2000). In Vitroandin VivoFunctional Analysis of Human T Cell Lymphotropic Virus Type 1 pX Open Reading Frames I and II. AIDS Res. Hum. Retroviruses. 16, 1757–1764. doi:10.1089/08892220050193272
Li, H.-z., Guo, S., Li, C.-j., and Sun, J.-q. (2013). A Hybrid Annual Power Load Forecasting Model Based on Generalized Regression Neural Network With Fruit Fly Optimization Algorithm. Knowledge-Based Syst. 37, 378–387. doi:10.1016/j.knosys.2012.08.015
Mohammadi, M., Talebpour, F., Safaee, E., Ghadimi, N., and Abedinia, O. (2018). Small-Scale Building Load Forecast Based on Hybrid Forecast Engine. Neural Process. Lett. 48, 329–351. doi:10.1007/s11063-017-9723-2
Mohan, N., Soman, K. P., and Sachin Kumar, S. (2018). A Data-Driven Strategy for Short-Term Electric Load Forecasting Using Dynamic Mode Decomposition Model. Appl. Energ. 232, 229–244. doi:10.1016/j.apenergy.2018.09.190
Mohandes, M. (2002). Support Vector Machines for Short-Term Electrical Load Forecasting. Int. J. Energ. Res. 26, 335–345. doi:10.1002/er.787
Niazi, M., and Hussain, A. (2011). Agent-Based Computing From Multi-Agent Systems to Agent-Based Models: a Visual Survey. Scientometrics. 89, 479–499. doi:10.1007/s11192-011-0468-9
Olawumi, T. O., and Chan, D. W. M. (2018). A Scientometric Review of Global Research on Sustainability and Sustainable Development. J. Clean. Prod. 183, 231–250. doi:10.1016/j.jclepro.2018.02.162
Pai, P.-F., and Hong, W.-C. (2005). Forecasting Regional Electricity Load Based on Recurrent Support Vector Machines With Genetic Algorithms. Electric Power Syst. Res. 74, 417–425. doi:10.1016/j.epsr.2005.01.006
Quan, H., Srinivasan, D., and Khosravi, A. (2014). Short-term Load and Wind Power Forecasting Using Neural Network-Based Prediction Intervals. IEEE Trans. Neural Netw. Learn. Syst. 25, 303–315. doi:10.1109/TNNLS.2013.2276053
Ramanathan, R., Engle, R., Granger, C. W. J., Vahid-Araghi, F., and Brace, C. (1997). Short-run Forecasts of Electricity Loads and Peaks. Int. J. Forecast. 13, 161–174. doi:10.1016/S0169-2070(97)00015-0
Raza, M. Q., and Khosravi, A. (2015). A Review on Artificial Intelligence Based Load Demand Forecasting Techniques for Smart Grid and Buildings. Renew. Sustainable Energ. Rev. 50, 1352–1372. doi:10.1016/j.rser.2015.04.065
Shao, Z., Chao, F., Yang, S.-L., and Zhou, K.-L. (2017). A Review of the Decomposition Methodology for Extracting and Identifying the Fluctuation Characteristics in Electricity Demand Forecasting. Renew. Sustainable Energ. Rev. 75, 123–136. doi:10.1016/j.rser.2016.10.056
Shyh-Jier, H., and Kuang-Rong, S. (2003). Short-Term Load Forecasting via ARMA Model Identification Including Non-Gaussian Process Considerations. IEEE Trans. Power Syst. 18, 673–679. doi:10.1109/tpwrs.2003.811010
Sousa, J. C., Jorge, H. M., and Neves, L. P. (2014). Short-Term Load Forecasting Based on Support Vector Regression and Load Profiling. Int. J. Energ. Res. 38, 350–362. doi:10.1002/er.3048
Suganthi, L., and Samuel, A. A. (2012). Energy Models for Demand Forecasting-A Review. Renew. Sustainable Energ. Rev. 16, 1223–1240. doi:10.1016/j.rser.2011.08.014
Taylor, J. W., and Buizza, R. (2002). Neural Network Load Forecasting With Weather Ensemble Predictions. IEEE Trans. Power Syst. 17, 626–632. doi:10.1109/Tpwrs.2002.800906
Taylor, J. W., De Menezes, L. M., and Mcsharry, P. E. (2006). A Comparison of Univariate Methods for Forecasting Electricity Demand up to a Day Ahead. Int. J. Forecast. 22, 1–16. doi:10.1016/j.ijforecast.2005.06.006
Taylor, J. W. (2003). Short-term Electricity Demand Forecasting Using Double Seasonal Exponential Smoothing. J. Oper. Res. Soc. 54, 799–805. doi:10.1057/palgrave.jors.2601589
Yang, S., Sui, J., Liu, T., Wu, W., Xu, S., Yin, L., et al. (2018). Trends on PM2.5 Research, 1997-2016: a Bibliometric Study. Environ. Sci. Pollut. Res. 25, 12284–12298. doi:10.1007/s11356-018-1723-x
Keywords: electricity demand forecasting, scientometric, visualization, citespace, knowledge mapping
Citation: Yang D, Guo J-e, Li J, Wang S and Sun S (2021) Knowledge Mapping in Electricity Demand Forecasting: A Scientometric Insight. Front. Energy Res. 9:771433. doi: 10.3389/fenrg.2021.771433
Received: 06 September 2021; Accepted: 27 September 2021;
Published: 14 October 2021.
Edited by:
Jian Chai, Xidian University, ChinaReviewed by:
Wendong Yang, Shandong University of Finance and Economics, ChinaTong Niu, Zhengzhou University, China
Copyright © 2021 Yang, Guo, Li, Wang and Sun. This is an open-access article distributed under the terms of the Creative Commons Attribution License (CC BY). The use, distribution or reproduction in other forums is permitted, provided the original author(s) and the copyright owner(s) are credited and that the original publication in this journal is cited, in accordance with accepted academic practice. No use, distribution or reproduction is permitted which does not comply with these terms.
*Correspondence: Shaolong Sun, c3Vuc2hhb2xvbmdAeGp0dS5lZHUuY24=
 Dongchuan Yang
 Ju-e Guo
 Jie Li
 Shouyang Wang
 Shaolong Sun