 Anselme Andriamahery1*
 Md. Qamruzzaman2*†
- 1School of Economics and Management, Hubei Polytechnic University, Huangshi, China
- 2School of Business and Economics, United International University, Dhaka, Bangladesh
The motivation of the study is to gauge the role of renewable energy consumption (REC), energy innovation (EI), and total trade (TR) on environmental sustainability (ES) in selected MENA (Middle East and North Africa) countries for the period 1980–2018 under the assumption of environmental Kuznets curve (EKC). The study implemented several econometrical tools, including structural break unit root test, Bayer–Hanck combined cointegration test, autoregressive distributed lag (ARDL), nonlinear ARDL, and Granger causality test under error correction term. Variables properties test detected that all the variables are stationary after the first difference but neither exposed to stationary after the second difference. The test statistics of the combined cointegration test documented a long-run association between ES, RE, EI, and TR, which is valid for both countries concerned. Regarding EKC concern, study findings with ARDL and nonlinear ARDL validated the EKC hypothesis for Tunisia and Morocco. Finally, the direction causality test documented unidirectional causality between renewable energy and ES, trade and ES, but the feedback hypothesis holds between EI and ES. We can advocate for specific sectoral environmental reforms in Tunisia and Morocco and suggest continuous environmentally friendly technologies by combining study findings. At the same time, subsidies on nonrenewable energy should be reduced, and green trade policies to help advance sustainable development should be implemented.
Introduction
The interest in balancing economic growth and environmental degradation stems from the UN conferences in Stockholm, Sweden (1972), and Rio de Janeiro, Brazil (1992), both of which took place before the UN conference on climate change in Montreal, Canada. Many conference participants agreed that the human-perceived environmental issues are both a global problem and a mutual problem requiring international cooperation. Environmental degradation is a result of economically driven development that ignores environmental sustainability (ES) factors. These issues will harm future economic growth because of the finite carrying capacity of natural resources and the environment and the fact that they are being ignored (Nathaniel, 2021a).
The nexus between economic growth and carbon emission has been extensively discussed in the existing literature. Grossman and Krueger (1995) and Grossman and Helpman (1991) were the first to investigate such issues. They reported that economic progress leads to environmental degradation, followed by subsequent environmental improvement, later termed environmental Kuznets curve (EKC) (Panayotou, 1993). The EKC hypothesis considers the association between a deterioration in environmental quality and environmental pollution, especially in recent years. The economic–environmental connection is complicated and multidimensional. According to Everett (2010), economic development has three environmental impacts. First, economic development has a detrimental impact on the environment as increased output and consumption lead to increased environmental deterioration. Second, the transition from agriculture to industries that degrade the environment caused a change in the balance of producing manufactured products toward providing services. Third, the technical effect–technological advancements contribute to changes in the environmental impact of manufacturing, such as increases in energy efficiency.
Furthermore, Panayotou (1993) indicated that economic growth has three distinct effects over carbon emissions/environmental pollution: scale, technical and structural, and scale effects. The scale effects explain that given a certain level of technology, in order to achieve economic goals, energy consumption leads to higher emissions. The structural effect narrates that structural transformation during economic development affects environmental degradation as higher-polluting industries are replaced by low-polluting industries, reducing carbon emissions during the manufacturing process. Finally, the technical effects explain that despite achieving economic expansion, carbon emissions during manufacturing are reduced mainly due to technological innovation and progress. However, there is a higher focus on investigating the association between greenhouse gas emissions and cleaner energy sources. Bölük and Mert (2015) incorporated an empirical strategy to review the role of renewable energy (RE) while investigating the EKC hypothesis to conclude that environmental degradation has a significant correlation with economic and industrial policies, and clean energy sources are crucial to ensure environmental quality. Recent economic literature has further explored such associations to claim that carbon emissions are significantly lowered after introducing RE into the energy mix (Bashir et al., 2021a).
The novelty of this study lies in the following aspects. First, since its inception, the concept of EKC has been extensively considered and investigated with different macro aspects predominately preferred to carbon emission, energy consumption (Solarin et al., 2017), and environmental quality (Yu et al., 2019). The EKC hypothesis establishes that increasing wealth increases pollution in the early stages of economic growth until the connection between the two variables becomes negative. This phenomenon arises when a nation improves its energy efficiency, RE production, and environmental consciousness, all of which contribute to forming an inverted U-shaped connection between income and pollution. To our best knowledge, this is the first ever study to investigate the EKC hypothesis with ES, RE consumption (REC), total trade (TR), and energy innovation (EI) in Morocco and Tunisia.
Second, according to existing literature, a growing number of researchers have invested time and efforts in exposing the key detriments for achieving ES by lowing carbon emission in the ecosystem with the integration of clean energy (Nathaniel, 2021b; Meo, 2021). Green energy inclusion in terms of energy reliance transition from fossil fuel to renewable sources has established the prime measures in mitigating adversity in environmental degradation. This study contributed to the existing literature by offering fresh insight regarding the role of RE, EI, and TR in achieving the focused goal of ES. Even though all those factors have been separately utilized in different studies, we incorporated all three factors in a single equation for the first time.
Third, we investigated the EKC hypothesis by applying symmetric and asymmetric frameworks following Pesaran et al. (2001) and Shin et al. (2014). In recent literature, the asymmetric assessment has gained apex attention in every aspect of macro fundamental assessment, even in the case of environmental assessment. The motivation for including asymmetric investigation is to document the possible nonlinear association over the conventional perception of the linear relationship. In reality, because of macro fundamental behavior and the effects of globalization in economic and finance, the existing belief is under tremendous pressure. Therefore, in empirical assessment, thorough nonlinear framework has received particular attention due to diversity in empirical findings. We, in the study, assess the role of RE, EI, and TR on ES with EKC under the nonlinear framework and firmly believe that the innovation of empirical findings opens an alternative thinking process for formulating environmental policies and reshapes the existing literature macro policies implementation. Our study findings validated the EKC in Morocco and Tunisia with symmetric and asymmetric assessment. Regarding variable elasticity to ES, the study suggested that RE and environmental innovation mitigate environmental degradation by reducing carbon emissions.
The current study investigates the EKC hypothesis for Morocco and Tunisia. Because of the shift from central planning toward free-market economic reforms, they are among the fastest-growing economies in the Middle East and North Africa (MENA) region. In recent decades, both Tunisia and Morocco have accelerated structural reforms to restructure and liberalize economic and financial sectors to achieve economic goals through Structural Adjustment Programs (Bashir et al., 2020). The opening of the domestic economy was also accelerated as the European Union (EU) became a major trading partner for both countries through multiple accords (73.18% and 72% for Tunisia and Morocco, respectively). Furthermore, both countries have become the preferred destination of foreign direct investment (FDI) in the MENA region. As a result, both countries compete to become the most attractive environment for foreign investors through a qualified workforce, developed infrastructure, stable economic policies, and better political stability than the rest of the MENA countries (Hussain and Dogan, 2021). Other channels might also be explored to examine the interrelation between Morocco and Tunisia’s economies, such as imports, FDI flows, and financial linkages.
The aim of the study was to evaluate the role of RE, EI, and trade on ES with the EKC hypothesis for Morocco and Tunisia from 1980 to 2018. The study applied both symmetry and symmetry assessment in the empirical model following Pesaran et al. (2001) and Shin et al. (2014). Study findings found long-run association in an empirical model, according to Bayer and Hanck’s (2013) combined cointegration test. The asymmetric long-run association has been established with the cointegration test under nonlinear assessment. Regarding the magnitudes from RE, EI, and TR to ES, the study documented statistically significant adverse effects of RE and TR on ES, implying reduced carbon emission into the ecosystem. At the same time, trade liberalization positively augmented the process of environmental degradation with excessive carbon emission.
The remainder of this article is organized in the following sections: literature review outlines the association between carbon emissions, foreign trade, economic growth, REC, and EI. Section 3 outlines empirical model and econometric strategy; section 4 narrates empirical findings, and section 5 details concluding remarks and conclusion.
Literature Review
Since the industrial revolution, there has been a steady increase in global carbon emissions mainly due to increasingly higher reliance on fossil fuels to achieve economic transformation. Consequently, global emission levels have reached more than 36 billion tons, 1.6 times higher than that in 1990. Furthermore, this has also contributed to the rise of global average temperature in recent decades (Karl et al., 2015; Bashir et al., 2021b), adversely affecting humans and other species alike. Consequently, there is greater awareness to investigate the association between carbon emissions and global climate change. Academic researchers and policymakers have paid significant attention to assessing how carbon emissions affect climate change in different economic demographics. In order to achieve economic goals, the global energy supply has reached 13.7 billion tons of oil equivalent, and fossil fuels contributed to more than 80% of total energy consumption. In comparison, despite having low carbon emissions and recent environmental reforms, the share of RE sources is still less than 20%, which is even significantly lower in developing economies and is an effective alternative to reduce environmental degradation from carbon emissions (Talbi et al., 2020).
Current economic literature has extensively discussed the linkage between trade, RE, economic growth, innovation in environmental technologies, and carbon emission. A portion of research projects has investigated the inner relationship among CO2 emissions as a measure of ES and the variables above. Mhenni (2005) empirically explored the EKC hypothesis using generalized method of moments methodology from 1980 to 1997; the researcher examined carbon emissions, vehicles, and fertilizer concentration to conclude that the EKC hypothesis is not proven for environmental pollutants. Chebbi et al. (2011) relied on a concentration empiricalapproach to examine how trade openness, per-capita CO2 emissions, and economic growth influence each other. The empirical findings specified that carbon emissions, trade openness, and economic growth Granger cause one another; further analysis forecasted short-run causal association among trade openness and carbon emissions. In an earlier study, Belloumi (2009) researched how economic growth is influenced by energy consumption through the Johansen cointegration approach to indicate the bidirectional causal association between economic growth and energy consumption in the long run. Fodha and Zaghdoud (2010) also used the causality analysis approach to analyze how economic policies and carbon emissions influence the environmental deterioration in developing economies. The application of Vector Error Correction Model (VECM) and Johansen causality analysis indicated unidirectional causal association from economic growth to carbon emissions in short- and long-run empirical findings. Taking into account the empirical nexus, we reported the literature findings with three subgroups.
First, the pursuit of more remarkable economic development is inextricably linked to energy security and environmental degradation. Energy is a necessary input for economic activity; nevertheless, excessive energy use puts more strain on the environment, via either by-product pollutants or the depletion of natural resources. Economic growth should be accomplished in sustainability while efforts are made to protect the environment to preserve its usefulness for future generations. The EKC hypothesizes that economic growth, rather than being detrimental to the environment, improves environmental indicators, ultimately leading to sustainable development. Khan et al. (2020) assess the role of RE on trade and environment quality in Nordic counties from 2001 to 2018 by applying cross-sectional dependency, panel unit root tests, and dynamic CCE. Study findings reveal positive influence running from REC to trade liberalization and environmental quality. As far as policy intention is concerned, the study advocated that RE integration in the economy offers economic sustainability through domestic trade expansion, environmental quality improvement, and an eco-friendly ecosystem. Busu and Nedelcu (2021) investigate the role of clean energy on the ES of EU countries. Study findings documented a negative, statistically significant association in empirical nexus, suggesting that clean energy integration through biofuel and RE is directly connected with reducing CO2 level in another study. Shafiei and Salim (2014) documented a positive role between non-RE and carbon emission and negative association between RE and CO2. Ben Jebli et al. (2016) investigated the EKC hypothesis by taking into account the role of renewable and non-REC on the environment of 25 Organisation for Economic Cooperation and Development (OECD) countries for the period 1980–2018. Empirical estimation with FMOLS validated the EKC hypothesis and established a positive association between non-REC and environmental degradation. The summary of the literature survey focusing on RE and the environment is displayed in Table 1.
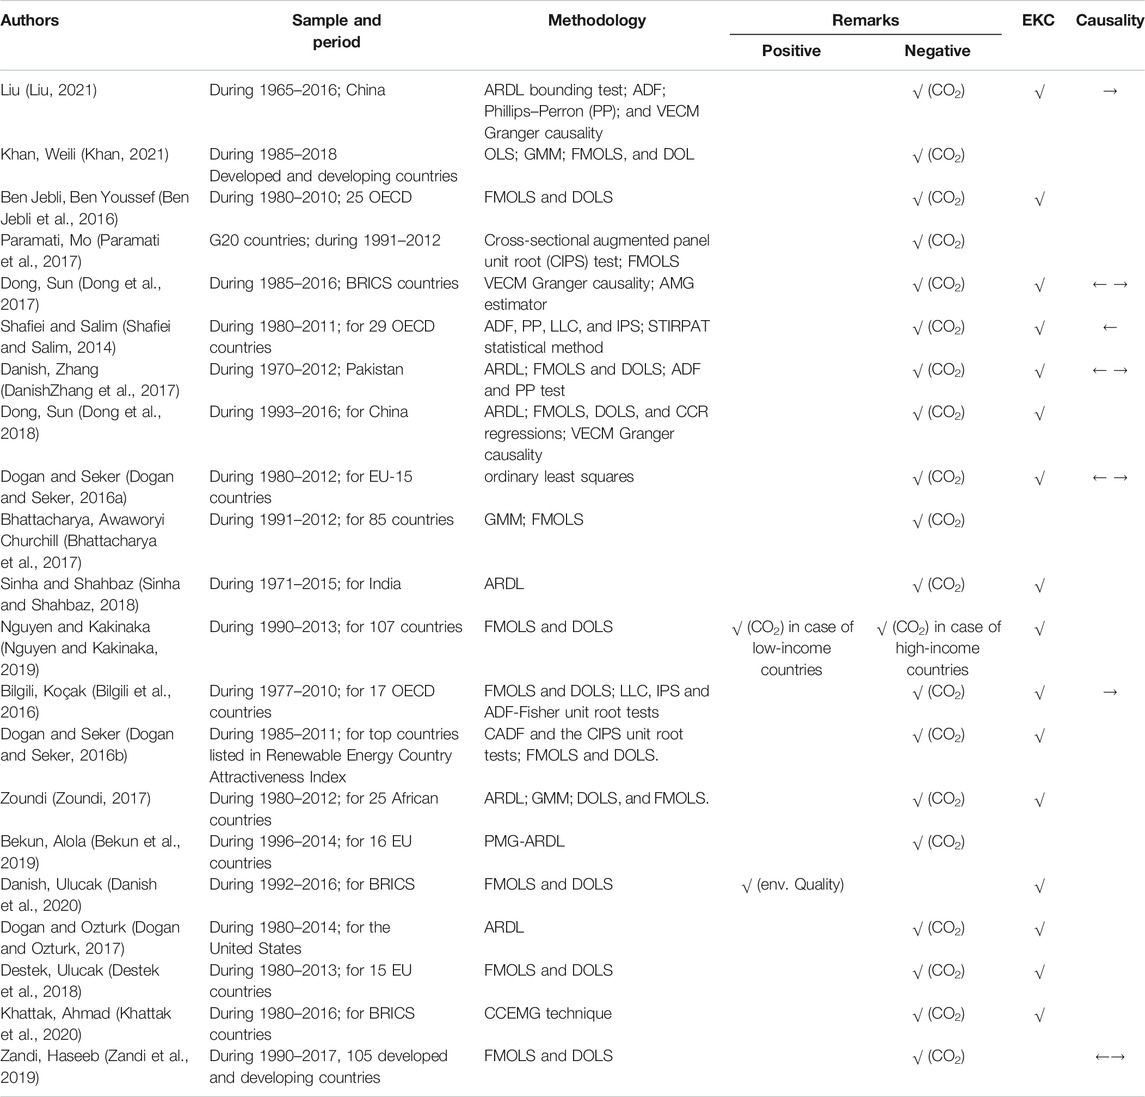
TABLE 1. Summary of literature survey: nexus between RE and environment.
Second, environmental degradation is a significant problem in economics and has garnered substantial attention from various academics and economists over the last few decades. Countries are confronted with severe global warming issues as a result of the continued rise in carbon emissions. Numerous causes that contribute to the environmental deterioration have been discovered lately, and governments are attempting to address these issues that affect environmental quality. Environmental deterioration has been a significant concern for nations globally in recent years as carbon emissions have increased. Environmental sustainability is a critical issue for nations; yet, the discussion about the role of innovation and institutions in achieving ES is still insufficient. There is a dearth of knowledge about how countries may accomplish both economic development and environmental protection. Innovation is seen as a successful strategy as it improves energy efficiency and produces greener products, thus lowering carbon emissions. Mongo et al. (2021) investigated the impact of environmental innovation on environmental degradation by taking a panel of 15 EU nations over 23 years by using autoregressive distributed lag (ARDL) in panel form. The study established a positive impact in reducing carbon emission in the long run, but rebound effects were revealed in the short run.
Third, according to economic theory, trade liberalization between nations with varying levels of environmental protection can lead to pollution-intensive industries concentrating in countries with lower environmental regulations. This impact is known as the pollution haven effect, and it is the most contentious area of discussion when it comes to TL and the environment. In the economic literature, there is no consensus on whether the pollution haven effect exists. Suppose one country internalizes the social cost of the environment and does not include the environment in international commerce. In that case, the last country has a comparative advantage in items with high environmental costs (Copeland and Taylor, 1994). The linking between trade openness and environmental quality has been extensively studied via the EKC paradigm by examining the relationship between per-capita income and inequality (Grossman and Krueger, 1995). According to the EKC theory, transitional nations may achieve sustainable economic development after reaching a certain level of per-capita income.
In addition, trade openness is a key element in assisting transitional countries to simultaneously reduce carbon dioxide emissions and increase economic development via a combination of size, composition, and method impacts. Moreover, trade openness can be viewed as a critical element affecting environmental quality and regulatory compliance. Numerous studies have been conducted to determine the effect of trade openness on CO2 emissions. According to Antweiler et al. (2001), trade openness can impact environmental quality via scale, composition, and technique effects. The influence of trade openness on environmental quality may be classified into three categories: size, composition, and method (Grossman and Helpman, 1991). Economic development resulting from trade results in a rise in pollutant emissions due to increased energy consumption and cross-border transportation services. The composition effect is brought about by a company’s decision to specialize in a particular industry to gain a competitive edge. This impact varies by competitive advantage source. Because of trade liberalization, the technique’s impact results from technology flowing into less-developed nations (Copeland and Taylor, 2001).
In the existing literature, two lines of evidence have suggested regarding the role of trade openness and environmental degradation. First, a growing number of researchers advocated the positive role of trade openness on environmental degradation (Managi et al., 2009), Ahmar and del Val (2020; Yu et al., 2019; and Park et al. (2018). In a study, Ling et al. (2015) postulated that trade openness offering technological efficiency positively correlated with environmental quality by lower carbon emission in the ecosystem. It is due to trade openness-led innovation increasing technical effects and reducing scale effects in aggregate output. The second line of empirical studies established an adverse association between trade and environmental degradation (Nasir and Ur Rehman [2011], Shahbaz et al. [2017]; and Zameer et al [2020]). In a study, Dean (2002) pustulated that trade harms pollution emissions, resulting in environmental deterioration. However, it also lowers pollution emission growth via the income effect, resulting in a beneficial impact on the environment. The summary of literature survey is displayed in Table 2.
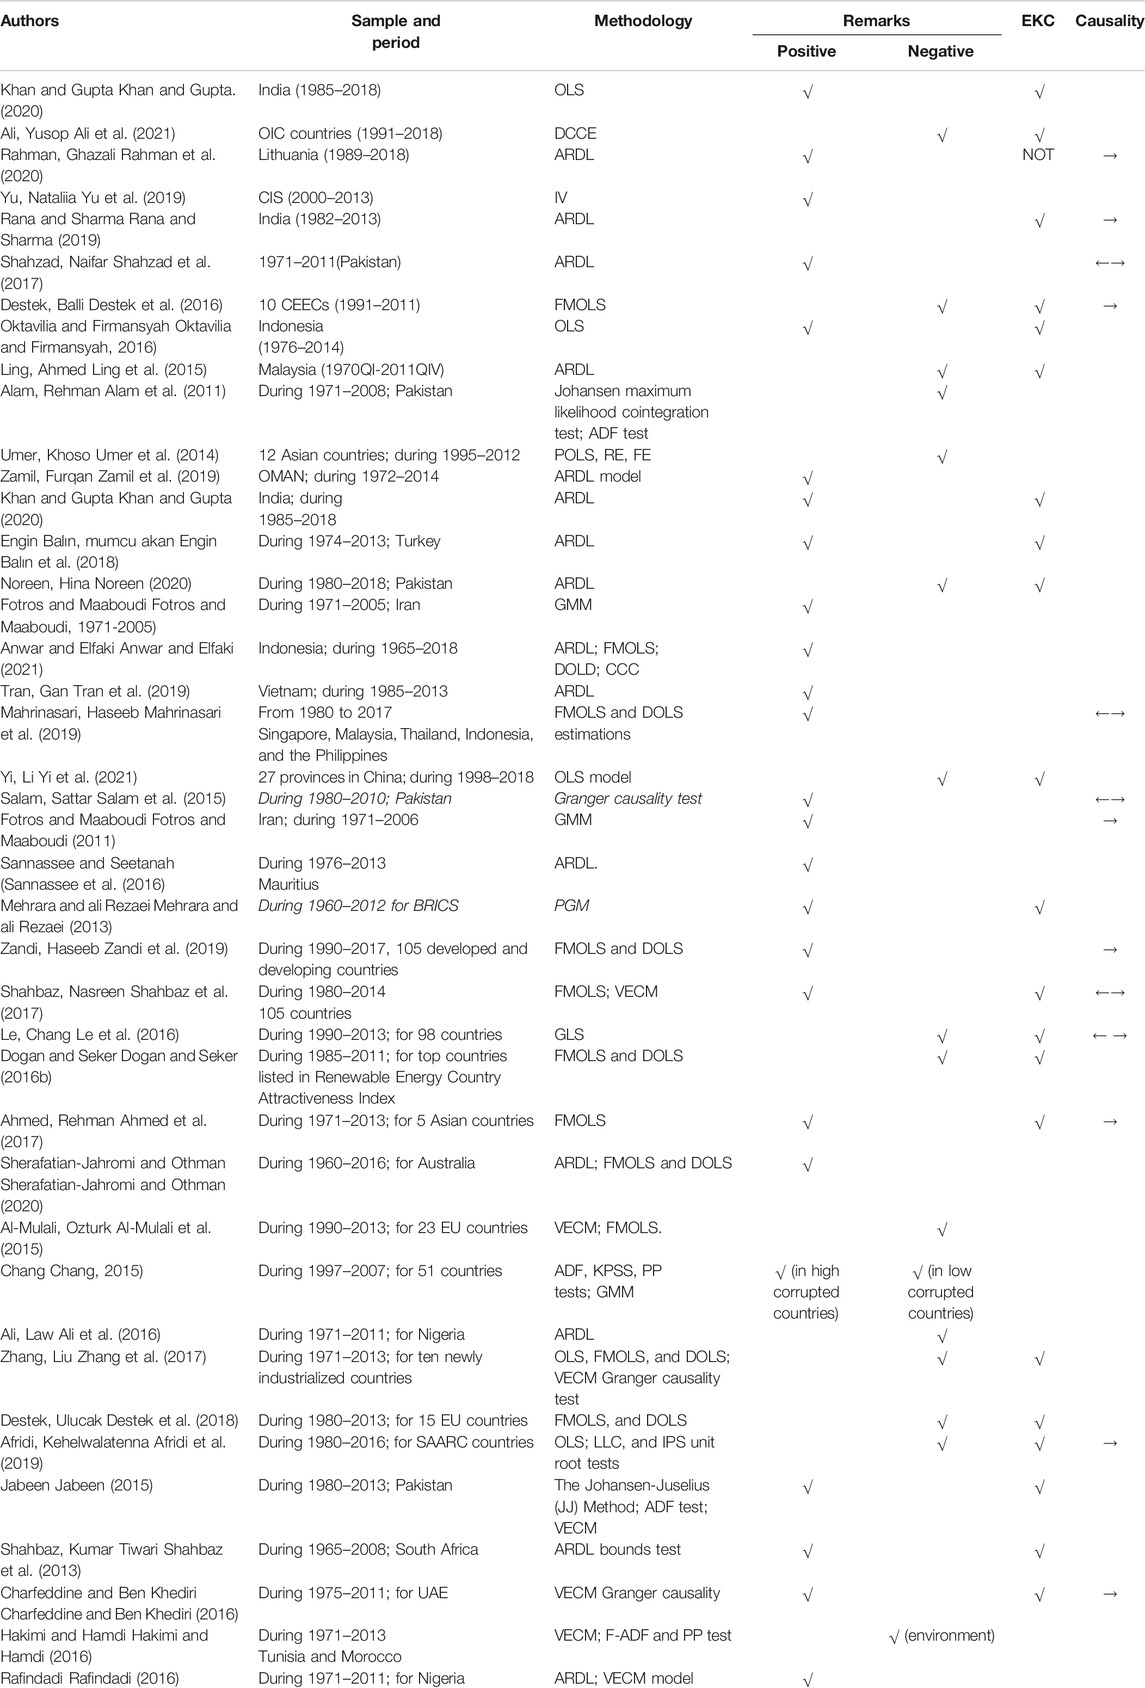
TABLE 2. Summary of literature survey: nexus between trade and environment
Conceptual Model and Proposed Hypothesis of the Study
Current economic literature has extensively discussed the linkage between trade, RE, economic growth, innovation in environmental technologies, and carbon emission. A portion of research projects has investigated the inner relationship among CO2 emissions and the variables mentioned previously. Mhenni (2005) empirically explored the EKC hypothesis using GMM methodology from 1980 to 1997; the researcher examined carbon emissions, vehicles, and fertilizer concentration to conclude that the EKC hypothesis is not proven for environmental pollutants. Chebbi et al. (2011) relied on a concentration empirical approach to examine how trade openness, per-capita CO2 emissions, and economic growth influence each other. The empirical findings specified that carbon emissions, trade openness, and economic growth Granger cause one another; further analysis forecasted short-run causal association among trade openness and carbon emissions. In an earlier study, Belloumi (2009) researched how economic growth is influenced by energy consumption through the Johansen cointegration approach to indicate the bidirectional causal association between economic growth and energy consumption in the long run. Fodha and Zaghdoud (2010) also used the causality analysis approach to analyze how economic policies and carbon emissions influence the environmental deterioration in developing economies. The application of VECM and Johansen causality analysis indicated unidirectional causal association from economic growth to carbon emissions in short- and long-run empirical findings. The present study does not concentrate on detecting ES factors in Tunisia and Morocco but instead on evaluating the effects of REC, EI, and TR on ES.
Figure 1 exhibits the conceptual framework and the possible causal hypothesis of the study, which is to be tested in the empirical investigation:
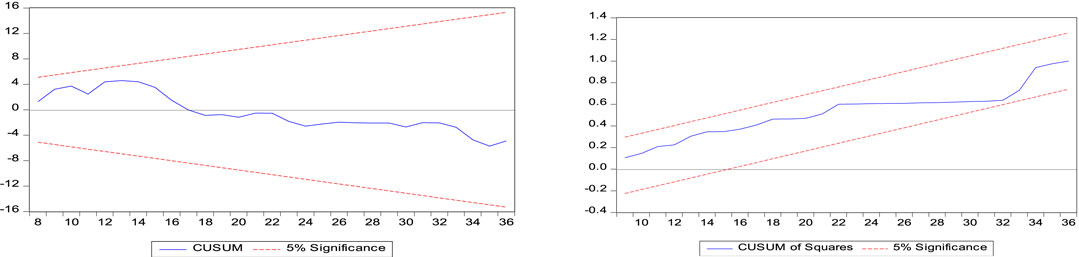
FIGURE 1. Linear ARDL CUSUM and CUSUMSQ graphs (Morocco).
Data and Model
Descriptive Statistics and Model Specification
The current study utilized time-series data from 1980 to 2018 for Tunisia and Morocco. As a dependent variable, ES is measured by carbon emission per capital extracted from British Petroleum. As independent variables, the study considered REC, EI, TR, and economic growth (Y) and all the data were extracted from world development indications published by World Bank (2021). We convert selected variables into natural logarithm form to normalize the data and arrive at reliable and consistent estimates (Nathaniel, 2020).
The present research used the log model to examine the EKC hypothesis and the impact of RE, EI, and international commerce in promoting ES in Tunisia and Morocco. The following empirical model is to be implemented.
In the equation mentioned previously,
The pursuit of economic progress has put extra pressure on energy consumption and infrastructure development, which has led to significant environmental challenges in CO2 emissions. In addition, we include
The descriptive statistics of research variables is displayed in Table 3. Elementary assessment reveals that the mean value of ES measured by carbon emission in Morocco (Tunisia) is 13.3057 (1.0296) falls between 26.8992 and 9.6058 (1.7998 and 0.5439); the variable for RE measured by REC as a percent of total consumption that exposed the mean value is 3.602237 (48.32269) falls between 4.038096 and 3.227796 (58.65286 and 36.02122). EI proxied by green patent application reveals the mean value of 10.37888 (7.134816), which falls between 15.59 and 2.37 (11.24 and 2.8). The sum of export and import was used for measuring the effects of TR with the mean value of 53.6197 (32.28183), which falls between 110.5771 and 26.2567 (55.79372 and 12.21927), and the mean value of economic growth is 6574.143 (864.388), which falls between 15974.64 and 1330.757 (2100.751 and 296.4352).
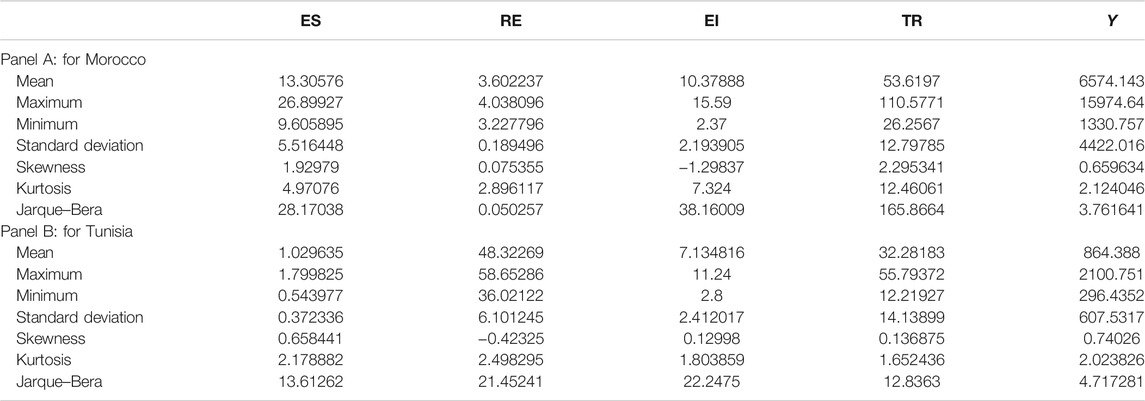
TABLE 3. Descriptive statistics of reserch variales.
Estimation Strategy
Unit Root Test
Time-series databases’ empirical model assessments persistently seek to detect the research units’ order of integration for appropriate econometric model selection (Jia, 2021). Following the existing literature trend of variables properties evaluation, the study performed several unit root tests to establish the order of integration in research units, such as the ADF: augmented dickey fuller test P-P: phillips perron test GS-ADF: KPSS: Kwiatkowski–Phillips–Schmidt–Shin (KPSS) tests. Furthermore, the study implements unit root test with unknown structural break test following Zivot and Andrews (Zivot and Andrews, 2002).
Bayer and Hanck Cointegration Test
In recent period detecting the long-run association among variables, research has been extensively applying the newly introduced cointegration test commonly known as combine cointegration, familiarized by Bayer and Hanck (2013) over conventional cointegration tests such as those of Engle and Granger (1987), Johansen (1991), and Banerjee et al. (1998). Bayer and Hanck (2013) offered a cointegration test with a combination existing cointegration test with joint test statistics. The advantage of the combined cointegration test is consistency and reliability in estimating the tested coefficient, implying that aggregation of several cointegration tests eliminates the inherent limitation in conventional testing procedures that are short and limited. Following Bayer and Hanck (2013), the combination of the computed significance level (p value) of the individual cointegration test in this article is in Fisher’s formula as follows:
The possible p values of several individual cointegration tests to be extracted from Engle and Granger (1987), Johansen (1995), Peter Boswijk (1994), and Banerjee et al. (1998) PEG, PJOH, PBO, and PBDM, respectively. To get evidence regarding the long-run association, the calculated F statistics has to be greater than the critical value proposed by Bayer and Hanck (2013) and is the rejection of the null hypothesis “no cointegration.”
Symmetry and Asymmetry ARDL
We performed extensive unit root analysis to begin the econometric analysis as it is a prerequisite for cointegration and causality analysis. After confirming the variables’ integration order of the ARDL and nonlinear autoregressive distributed lag (NARDL) methodologies, that is, data series is stationary at level or first difference, we applied nonlinear and linear cointegration analyses.
We have selected asymmetric (nonlinear) and symmetric (linear) ARDL approaches for the principal empirical analysis. The primary reason for selecting these methodologies is that ARDL and NARDL are flexible and can be used where variables are integrated at level or first difference and suitable for small samples. ARDL requires appropriate lag selection as it can be used to eliminate the issue of endogeneity. Furthermore, a suitable lag length can address the occurrence of multicollinearity in the asymmetric ARDL (Shin et al., 2014). The application of ARDL provides us with long- and short-run empirical results, all together, and the lagged ECT provides information about long-run equilibrium’s convergence. Bearing this in mind, we transform Eq. 1 into the following ARDL model:
where
Any of the following three statistics can test the occurrence of long-run relations. First, the modified F test advanced by Pesaran et al. (2001) tests the joint null hypothesis of no cointegration. The null hypothesis of
Asymmetric Autoregressive Distributed Lagged
In recent time, the application of nonlinear framework has gained an apex position in evaluation of the relationship in empirical studies with a motivation to establish possible innovation in explaining the conventional connection (Qamruzzaman, 2021; Qamruzzaman et al., 2021; Zhang et al., 2021; Yang et al., 2021). Following the existing literature, the study has implemented the nonlinear framework to gauge the asymmetric effects of RE, EI, and TR on ES; the study uses a nonlinear framework widely known as NARDL, which was initiated by Shin et al. (2014), and the study generalizes the following asymmetric long-run regression.
where
The generalized form of the nonlinear empirical model is as follows;
The long-run elasticity can be figured through
The non-ARDL approach primarily relies on the bound test to investigate nonlinear cointegration, whereas the decision criteria for cointegration, alternative, and null hypothesis are similar to the linear ARDL. After investigating cointegration, we devise Eq. 11 to investigate the asymmetric effects of the variables included on the CO2.
Furthermore, we applied several diagnostics models to investigate the stability of symmetric and asymmetric models. We also used the Wald test to confirm that both regressors’ asymmetric effects are significant.
Lastly, we proceeded with the VECM to identify the causal association between variables through the following model:
In Eq. 11,
Estimation and Interpretation
The results of variables’ propriety detection are displayed in Table 4. It is apparent from the stationary test statistics that all the variables are stationary after the first difference I(1). However, neither variable is exposed to stationary properties after the second difference I(2). The established variables’ properties are valid for both country estimations.

TABLE 4. Results of conventional unit root test.
The study evaluated the stationary properties with unknown structural breaks by applying the framework proposed by Zivot and Andrews (2002), and test statistics are reported in Table 5 with panel A for Morocco and panel B for Tunisia. The study reveals that all the variables are stationary after the first difference with a break year; precisely, for the variables, ES reveals break year (large order) for Morocco 2013 (2) and for Tunisia 2000 (2), RE exposed stationary with break year (lag) for Morocco 2017 (3) and Tunisia 2015 (3), EI for Morocco 2015 (2) and Tunisia 2016 (1), for TR in Morocco 2001 (2) and in Tunisia 2013 (1), and finally economic growth in Morocco 2016 (2) and Tunisia 1997 (3), respectively.

TABLE 5. Unit root test with an unknown structural break.
Before implementing the prime target model for detecting long- and short-run coefficients, the long-run association was evaluated through the cointegration framework introduced by Bayer and Hanck (2013) with the hull hypothesis on cointegration among research units. From the test statistics of combined cointegration test reports shown in Table 6, it is evident that all the test statistics derived with Fisher’s effect are higher than the critical value at a 5% level, suggesting that the rejection of null hypothesis alternatively confirmed the long-run association between ES, RE, EI, TR, and Y, which is valid for both economies.
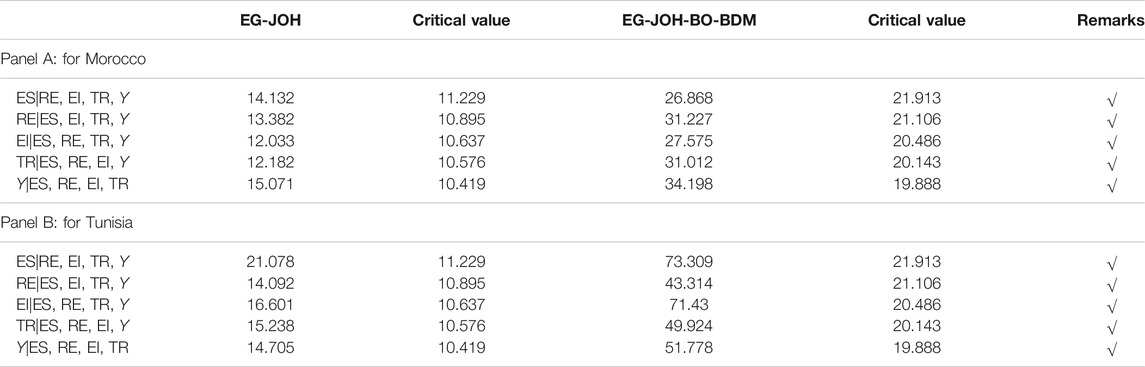
TABLE 6. Results of combined cointegration test.
Symmetry and Asymmetry Cointegration
The study used the symmetry and asymmetry cointegration tests by implementing three statistics: Fpass for bound testing, Wpass for joint probability test, and tBDM test. The results of the long-run cointegration test with three test statistics are displayed in Table 7 with panel A for Morocco and panel B for Tunisia. Referring to test statistics, it is apparent that all the test statistics regardless of estimation assumption that is symmetry or asymmetry are statistically significant at a 1% level, suggesting the long-run association between ES, RE, EI, TR, and Y with the integration of EKC hypothesis in the empirical assessment.

TABLE 7. Symmetry and asymmetry cointegration test.
Long- and Short-Run Assessments
Table 8 displays the long- and short-run coefficients under a symmetry environment for Morocco (Tunisia). Regarding the coefficient of economic growth on environment sustainability measured by carbon emission, it is statistically significantly positive at a 1% level with a coefficient of 0.225525 (0.3845). A study suggests that economic activity growth increases carbon emission, thus incurring additional costs of reducing environmental degradation to achieve ES in both Morocco and Tunisia. The nonlinear coefficient of economic growth (Y2) exposed negative statistical significance at a 1% level for Morocco (Tunisia) with a coefficient of −0.17417 (−0.2271). Study findings suggest that sustainable economic growth with specific periods plays an inductive role in integrating technological and energy efficiency. The positive coefficients for gross domestic product (GDP) and negative coefficient values for GDP2 validate the EKC hypothesis for Tunisia and Morocco. Our findings confirm that environmental quality initially deteriorates in both countries due to industrial activities but ultimately decreases after certain economic growth levels have been achieved.
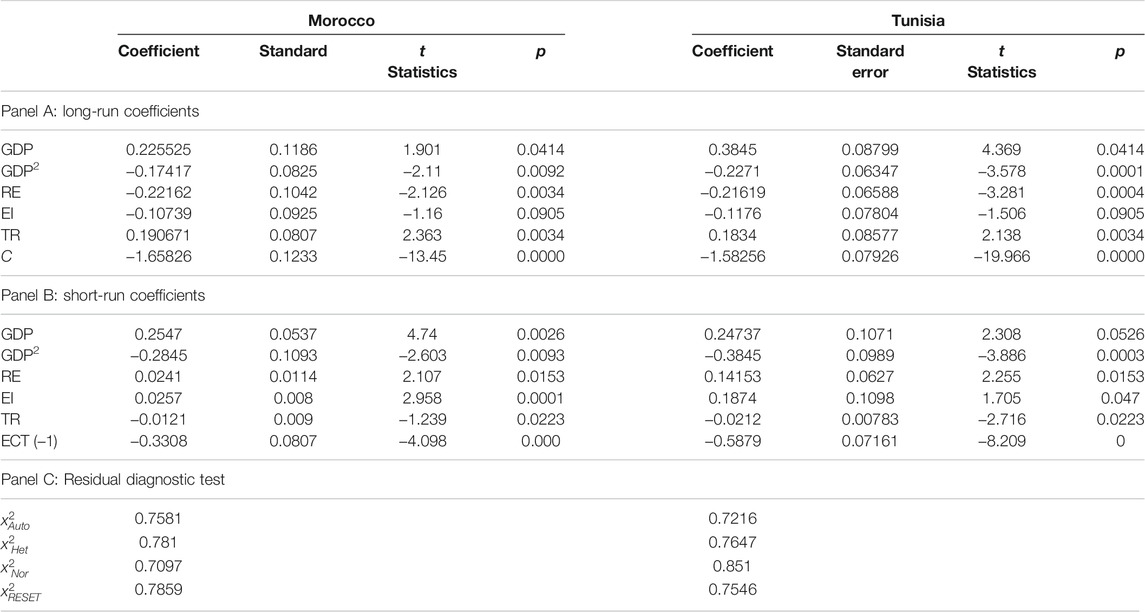
TABLE 8. Results of long- and short-run coefficients with symmetry assumption.
The significant impact from RE is evident in environmental quality in Morocco (Tunisia), suggesting a negative statistically significant linkage. More precisely, a 10% growth in RE integration in aggregate energy consumption increases ES by reducing the degree of carbon injected into the ecosystem by 2.216% (2.162%). Study findings suggest that establishing ecological balance in Morocco and Tunisia makes it imperative to initiate policy strategies for transition from fossil fuel dependency to RE integration and increase REC to avoid climate change and higher carbon emissions in the coming decades.
The coefficient value of EI is statistically significantly negative for environmental quality improvement through carbon emission reduction in Morocco (Tunisia) with a coefficient of −0.10739 (−0.1176). In particular, a 10% innovation in energy efficiency can decrease carbon emissions and accelerate ES by 1.073% (1.1176%). Environment innovation in RE technology innovation restricts the flows of carbon emission and augments the process of ecosystem improvement, eventually establishing ES (Wang and Zhu, 2020).
Next, we examined the linkage between TR and ES, and the study documented a statistically significant positive association in Morocco (Tunisia); specifically, a 10% development in TR can significantly decrease ES by 1.096% (1.834%) (TR). The symmetric ARDL illustrates that a 1% increase in COs emissions increases carbon emissions by 0.0041% and 0.0906% for Tunisia and Morocco.
For the short run, the coefficient of error correction terms is negative in sign and statistically significant at a 1% level, implying that the long-run disequilibrium due to short-run shock in independent variables will reach long-run convergence with a speed of 33.08% in Morocco and 58.79% in Tunisia.
The short-term findings for EI of symmetric ARDL highlight that innovations in the environmental and energy sector in Tunisia (Morocco) have led to lower (higher) carbon emissions in the short run with a coefficient of 0.0257. This is attributed to the allocation of research and development expenditures, significantly higher in Tunisia than in Morocco. Also, the recent focus on environmental and economic reforms means that Tunisia has paid significant attention to the developments in environmental technologies than the rest of the MENA countries, that us, Morocco. Lastly, trade (TR) negatively affects ES in both Tunisia (a coefficient of −0.0121) and Morocco (a coefficient of −0.0212), which is supported by the fact that the integration of globalization and technology transfer contributes to fewer carbon emissions in the short run and positively correlates with energy efficiency.
Moreover, for ensuring model internal consistency and efficiency in estimation, several residual diagnostics tests have been performed (panel C). according to the test statistics, empirical estimations are free from serial correlation, and residuals are normally distributed, with no issue regarding heteroscedasticity. The RESET test confirms stability in model construction. Furthermore, the CUSUM and CUSUM of square test establish coefficient stability and robustness (see, Figures 1, 2).
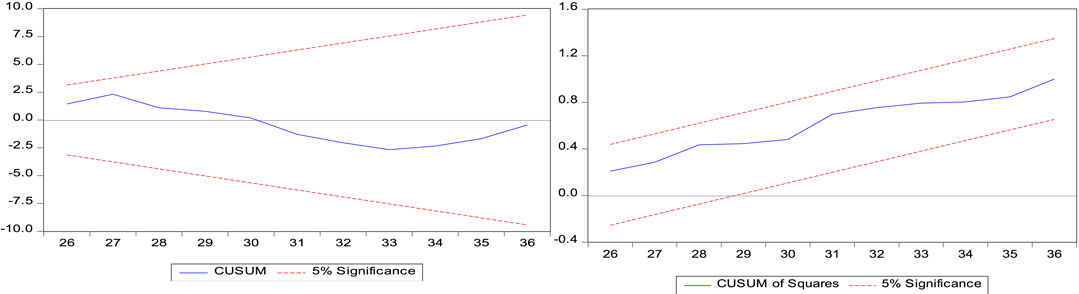
FIGURE 2. Linear ARDL CUSUM and CUSUMSQ graphs (Tunisia). Asymmetric long- and short-run coefficients.
Asymmetric Long-Run and Short-Run Coefficients
The study moved to gauge the asymmetric effects of positive and negative shocks in RE, EI, and TR on ES. The results are displayed in Table 9 with three panels of outputs.
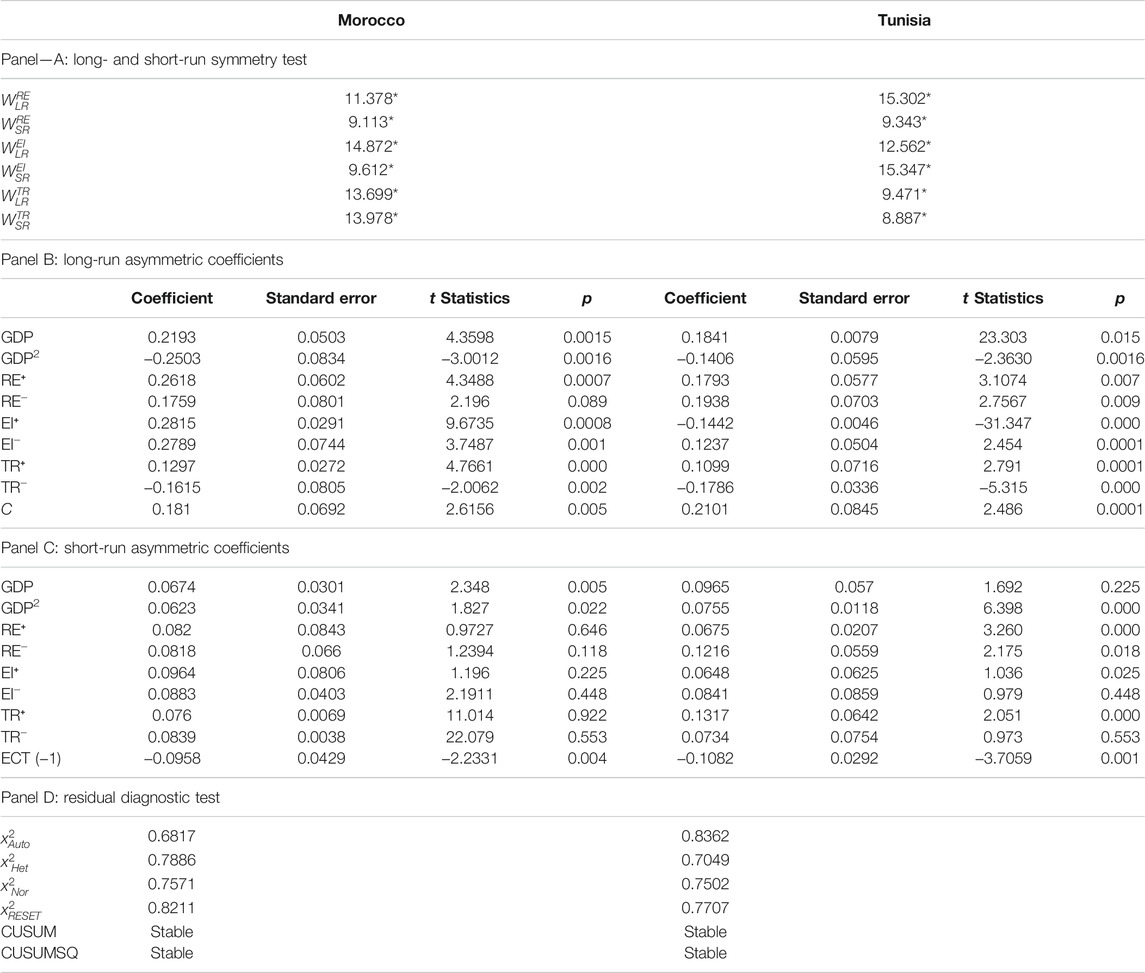
TABLE 9. Long- and short-run coefficient with asymmetric estimation.
Panel A contains the test statistics with the standard Wald test for the long- and short-run with the null hypothesis of “symmetry.” The test statistics for the long run (
Panel B reports the long-run asymmetric coefficients for Morocco (Tunisia). There is linkage between economic growth and ES, which is statistically significantly positive at a 1% level with a coefficient of 0.2193 (0.1841). The study established that the growth of economic activities increases the level of carbon emission, thus incurring additional costs of reducing environmental degradation to achieve ES in Morocco and Tunisia. The nonlinear coefficient of economic growth (Y2) exposed negative statistical significance at a 1% level for Morocco (Tunisia) with a coefficient of −0.2503 (−0.1406). Study findings signify that economic growth, in the long run, plays a multivalve role in environmental development with the integration of technological and energy efficiency. The positive coefficients for Y and negative coefficient values for GDP2 validate the EKC hypothesis for Tunisia and Morocco. Our findings confirm that environmental quality initially deteriorates in both countries due to industrial activities but ultimately decreases after certain economic growth levels have been achieved.
The asymmetric effect of REC, that is, positive and negative shocks, on ES reveals a negative statistically significant linkage in Morocco (Tunisia). Specifically, a 10% positive innovation in RE can increase environmental quality by reducing carbon emission in the ecosystem by 2.618% (1.793%), whereas a 10% adverse shock that decreases the integration of RE suggests reliance on fossil fuel, resulting in increasing carbon emission, hence deteriorating the environmental quality in Morocco (Tunisia) with a rate of 1.759% (1.938). Study findings postulated that in improving environmental quality to sustainability, the application and integration of RE emerged as critical in this regard. Therefore, effective energy policies focused on energy transition from fossil fuel to green energy to be the best alternative for Morocco and the Tunisian economy.
The analysis of EI’s positive and negative shocks presents rather exciting results. Panel B of Table 9 documents that positive shocks on EI have led to higher carbon emissions in Morocco (a coefficient of 0.2815). In contrast, the opposite is true for Tunisia (a coefficient of −0.1442). On the other hand, adverse shocks in EI hurt environmental quality in Morocco (a coefficient of 0.2789) and Tunisia (a coefficient of 0.1237). Study findings advocate that constant environmental concern induces the economy to invest in technological advancement, eventually improving environmental quality by lessening the ecological effects of excessive carbon emissions.
The findings of the NARDL approach suggest that 1% positive shocks in TR lead to higher carbon emissions in Morocco (a coefficient of 0.1297) and Tunisia (a coefficient of 0.1099). On the other hand, a negative shock in trade liberalization is responsible for higher environmental degradation as it increases carbon emissions into the atmosphere. However, the positive change has a much more profound impact. This is again evidence of the importance of using asymmetric methods in environmental economics.
Moreover, for ensuring model internal consistency and efficiency in estimation, several residual diagnostic tests have been performed (panel D); according to the test statistics, empirical estimations are free from serial correlation; residuals are normally distributed, there is no issue regarding heteroscedasticity, and the RESET test confirms stability in model construction. Furthermore, CUSUM and CUSUM of square test establish coefficients stability and robustness (see Figures 3, 4).
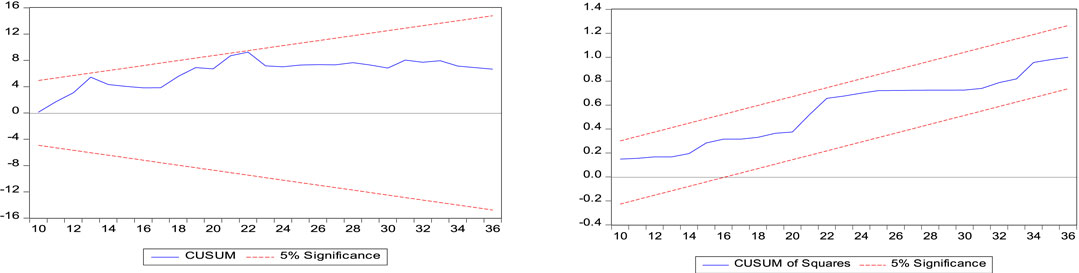
FIGURE 3. NARDL CUSUM and CUSUMSQ graphs (Morocco).
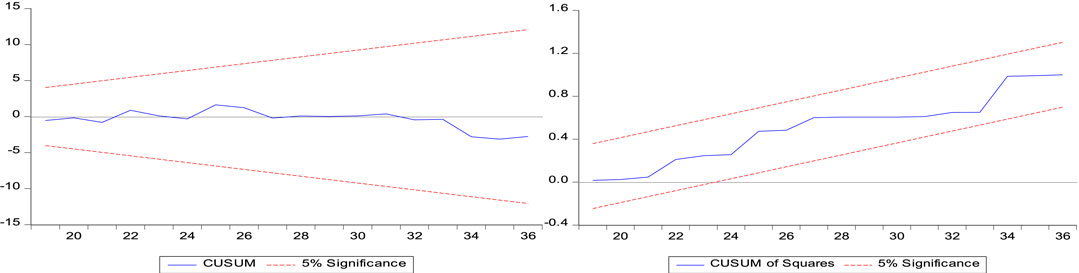
FIGURE 4. NARDL CUSUM and CUSUMSQ graphs (Tunisia).
The multipliers for both variables are plotted in Figures 5, 6, which portray adjustment to a new equilibrium after positive and negative shocks. The black dotted line indicates the nonlinear adjustment of CO2 to adverse shocks, whereas the solid black line portrays the adjustment of CO2 to a positive shock. The asymmetric pattern indicated by the red dotted line is the difference between both negative and positive shocks.
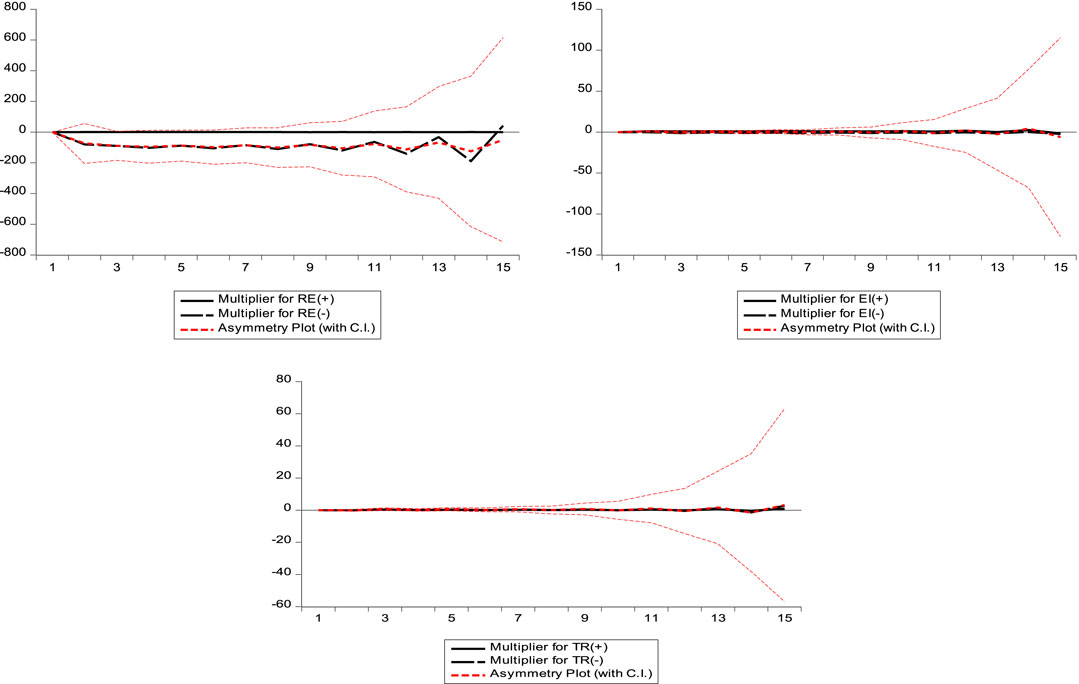
FIGURE 5. Nonlinear ARDL dynamic multiplier effect graphs (Morocco).
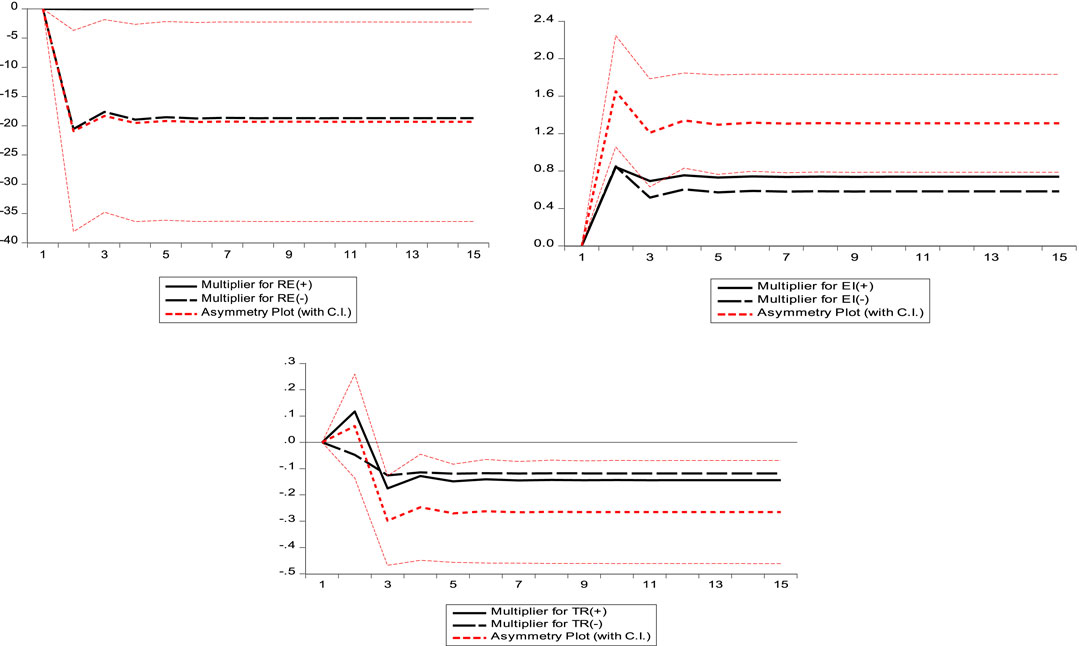
FIGURE 6. Nonlinear ARDL dynamic multiplier effect graphs (Tunisia).
Next, the study moved in gauging the directional associations between ES, RE, EI, TR, and economic growth by executing a vector error correction model. Granger causality test results under ECM are displayed in Table 10, consisting of panel A for Morocco and panel B for Tunisia.
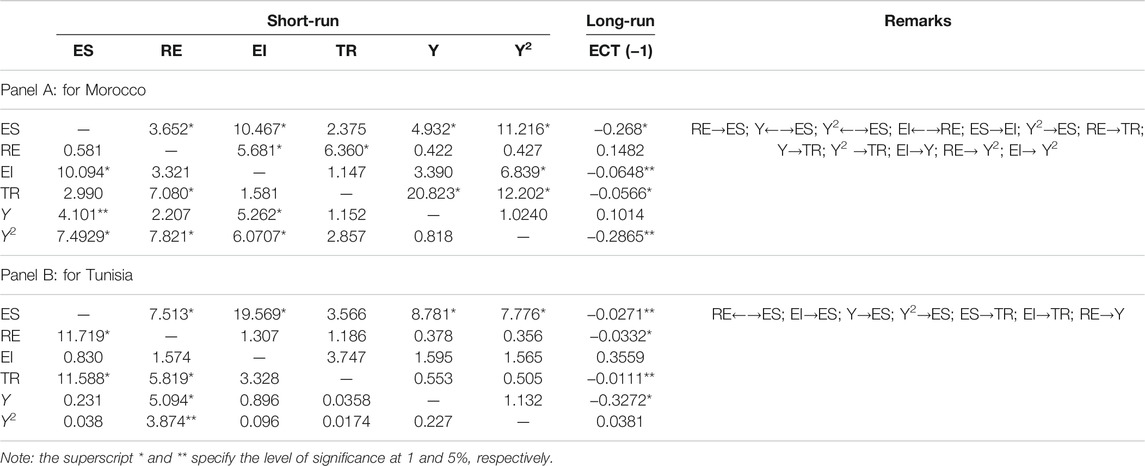
TABLE 10. Results of causality test under VECM.
The long-run causalities in empirical estimation was investigated through the lagged error correction term coefficient. For long-run causality, the coefficient of error correction term has to be negative in sign and statistically significant. The study documented that several ECT coefficients are statistically significantly negative, primarily ES treated as the dependent variable, suggesting the long-run causal effects available in the equation.
For the short-run, the study documented that several directional associations in the empirical assessment such as bidirectional causality prevail between economic growth and ES [Y←→ES], EI and REC [EI←→RE] in Morocco, whereas RE and ES [RE←→ES] in Tunisia. Furthermore, the study disclosed several unidirectional linkages between variables, especially to ES, including RE to ES [RE→ES] in Morocco, EI to ES [EI→ES], and economic growth to ES [Y→ES].
To ascertain the long-run impact of REC, EI, and trade on ES in Morocco and Tunisia, the study further implemented fully modified OLS introduced by Phillips and Hansen (1990) and dynamic OLS and canonical cointegrating regression (CCR) familiarized by Stock and Watson (1993). The results of the robustness test are displayed in Table 11. Study findings reveal the expected sign for each explanatory variable in explaining the association with ES. More precisely, the magnitudes of RE and EI exposed negative association, and trade augmentation revealed a positive role in carbon emission in Morocco and Tunisia.
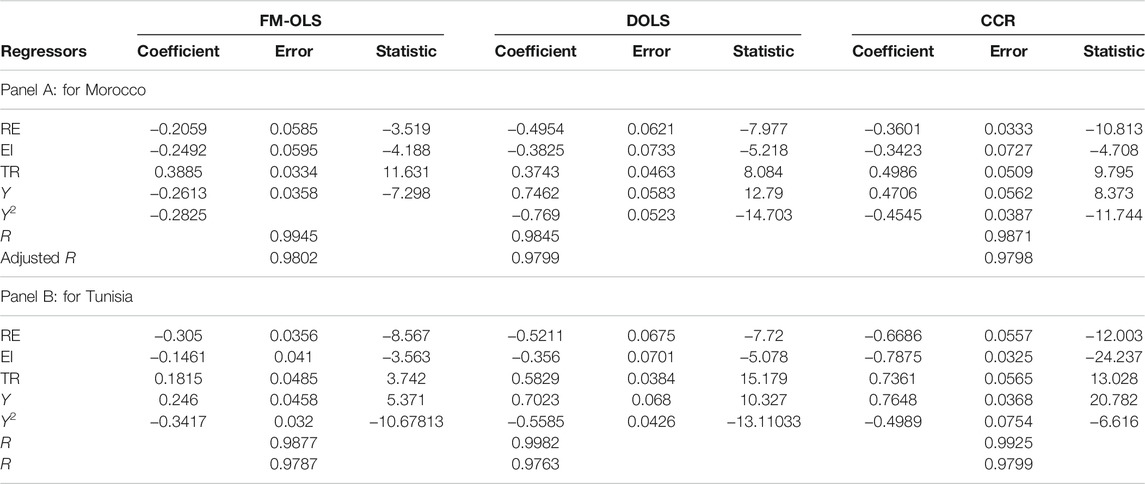
TABLE 11. Results of the empirical model robustness test.
Discussion of Results
The empirical evidence for the existence of the EKC hypothesis through symmetric and asymmetric methodologies is in contrast to Mrabet et al. (2017) and Charfeddine (2017). However, our findings align with Solarin et al. (2017), who investigate a panel of high-income countries. It is evident from empirical estimates that the GDP coefficients are positive, which documents that economic growth takes precedence in Tunisia and Morocco; it drives human demands and is also the primary reason for ecological problems. These outcomes were expected as the recent ecological footprint of Tunisia and Morocco has significantly increased along with its GDP. Also, these countries in recent years have overseen the transformation of the quality of life, and more and more people have access to better sanitation, health, food, and other necessities. However, this massive scale of economic progress has impacted daily lifestyles and has increased demand for natural resources beyond the necessities of basic needs; this, in turn, leads to pressure on environmental quality. The negative coefficient of GDP2 indicates that the achievement of specific economic goals and prosperity, environmental quality in Tunisia and Morocco can be improved through structural changes in the domestic economy, innovation in environmental technologies, and integration of environmental reform within the economic policies as Ulucak and Bilgili (2018) argued that advanced environmental technologies and stringent regulations minimize the ecological footprint in emerging economies.
The current study also presents interesting empirical outcomes between REC and carbon emissions in Tunisia and Morocco. In recent economic literature, several studies have provided support for REC to reduce environmental degradation. Among these, Bhattacharya et al. (2017) used a panel dataset for 85 developed and developing economies to articulate that growth in RE gas has a significant impact on environmental quality and economic growth especially in developing economies. Likewise, Hu et al. (2018) selected 25 developing economies and used FMOLS and DOLS to indicate that effective implementation of RE leads to lower carbon emissions over the long run. In support of these outcomes, (Dogan et al., 2010) selected SSA countries to explore the association between environmental pollution and RE during the time scale of 1980–2011. They found that higher fossil fuel consumption contributes to environmental pollution, whereas RE hurts environmental degradation. However, Apergis and Payne (2012) contradicted these findings for a panel of 29 developing economies to report that RE positively affects carbon emissions because of inadequate storage technology to deal with supply constraints. For Vietnam, Solarin et al. (2017) highlighted that a lower share of REC means that RE had no significant impact on carbon emissions. Khoshnevis Yazdi and Shakouri (2018) also reported similar outcomes.
Regarding EI and ES, the study documented a positive and statistically significant association, suggesting that clean energy integration in the aggregated productivity expansion boosts economic output and increases ES prospects by lowering carbon emission. Several empirical studies have recently explored the association between EI and carbon emission to capture the effects of RE with patents and R&D expenditure as the primary proxy variable being used. The findings of empirical literature remain inconclusive. In a comprehensive study, Fernández-Amador et al. (2019) investigated the association between carbon emission and innovation in environmental technologies to conclude that environmental technologies effectively reduce carbon emissions over the long and short run. In recent years, Awaworyi Churchill et al. (2019) and Petrović (1968) explored the association between RE, environmental technologies, and carbon emission to report mixed findings for different countries over the different periods and argued that the association between environmental technologies and carbon emissions is significantly dependent on the application of environmental legislation. Several studies such as those of Acemoglu et al. (2012) and Jaffe et al. (2002) have argued that limitation of carbon emissions through environmental technologies is dependent on country-specific characteristics and further explained that these effects rebound over time and negatively affect the accumulation of long-term environmental goals through innovation in green technologies (Braungardt et al., 2016). The energy structure of developing economies is based on the overexploitation of natural and fossil resources. However, in recent decades, this model has been altered by the increase in renewable sources and the implementation of innovations thought to be conducive to a more sustainable model in the energy sector. This new scenario represents an agreement on the need of increasing ES through the deployment of low-carbon technology. The efficacy and application of environmental rules will be critical in the long-term evolution of environmental pollution.
Lastly, we investigate the empirical association between carbon emissions and trade openness. In the last two decades, several studies have explored such association and how it affects economic growth over the long run. Obradović and Lojanica (2017) investigated the association between trade, carbon emissions, and energy consumption for southeastern European countries through the VECM approach to discover the long-run causal association between energy consumption, carbon emissions, and trade openness. However, the authors found no short-term causality between trade and carbon emissions for Bulgaria and Greece. Cherni and Essaber Jouini (2017) furthered the research by using the ARDL approach to examine how trade affects carbon emissions or vice versa for Tunisia. The researchers used the Granger causality test to report long- and short-term causal associations and their direction. The empirical analysis revealed the bidirectional causality between trade and carbon emissions and trade and REC; however, it found no causality between REC and carbon emissions. In another study, Kais and Sami (2016) investigated energy consumption and trade effects over carbon emissions for 58 emerging and developed economies from 1990 to 2012. The authors developed three panels, that is, Latin America and Caribbean, north Asian region, and Europe. The empirical analysis indicated that carbon emissions and energy consumption were positive for all three panels. The researchers reported similar trade and carbon emission estimates, and its statistical value was significant for north Asia and Europe. Lastly, the researchers also confirmed the existence of a U-shaped curve for trade and carbon emissions.
Conclusion
The current study has attempted to investigate the dynamic association between carbon emissions, trade openness, income, EI, and RE for Tunisia and Morocco. It compares the influence of the variables as mentioned previously in these emerging MENA economies. To analyze this nexus, we applied a series of unit root tests; next, symmetric and asymmetric cointegration was investigated. Afterward, unlike mainstream literature, we used both ARDL and NARDL methodologies to evaluate long-run elasticities comprehensively. We further investigate the impact of positive and negative changes in RE, EI, and trade and how it impacts environmental degradation in Tunisia and Morocco. Finally, we report causal analysis to evaluate the short- and long-run causal association between the variables included in the study.
Our empirical approach allows us to provide useful econometric findings. It is evident from the empirical estimates for asymmetric and symmetric ARDL approaches that GDP and GDP2 are significant under both empirical approaches. The positive coefficients for GDP and negative coefficient values for GDP2 validate the EKC hypothesis for Tunisia and Morocco. Initially, environmental quality deteriorates in both countries because of higher industrial activities but ultimately decreases after certain economic growth levels have been achieved. We further disclose that for Tunisia, RE and EI reduce carbon emissions, whereas trade (TR) has a positive association with environmental degradation. However, in the asymmetric ARDL findings, positive (RE⁺) and negative (EI−) contribute to environmental degradation. For Morocco, the empirical estimates (ARDL) for RE, EI, and TR report similar findings as Tunisia. However, the findings for NARDL reveal that adverse changes in trade (TR−) contribute to environmental degradation.
These findings suggest that policymakers in Tunisia and Morocco must introduce institutional and environmental reforms to achieve higher cohesiveness between domestic and foreign investors. These policies will also allow these emerging economies to take advantage of globalization and higher integration between international trade and FDI. In addition, policy changes aimed at lower tax, and related invectives will allow these investors to promote investments in green energy projects. However, higher taxation and restrictions on outdated technologies will prevent environmental degradation.
We further document that causality runs from GDP and RE toward CO2 emissions for Tunisia, whereas there is a causal association between EI and trade toward CO2 emissions for Morocco. This causal association allows us to propose that further environmental policies must promote energy efficiency and energy conservation through better environmental technologies. Furthermore, the share of RE in the energy mix must be increased to minimize the adverse effects on the ecological footprint. In this regard, higher investments in green energy technologies will effectively reduce environmental damage from fossil fuel consumption. In addition, the higher share of fossil fuels in the energy mix must be minimized by adding low pollution natural gas. Lastly, reforms in pricing strategies must be considered a policy mechanism to increase REC in both Tunisia and Morocco.
Finally, although the current study provides a significant contribution to the existing economic literature; however, we have been unable to account for the association between carbon emissions and structural changes in Tunisia and Morocco within the MENA region. These economies rely significantly on informal economies. Further research is required to evaluate the association between industrial competitiveness and microenterprises and how recent economic and environmental policies have affected them. Hence, we encourage future studies to evaluate these policies for MENA regions. Evaluating these policies is a crucial factor in reaching future international climate control agreements in developing economies.
Data Availability Statement
Publicly available datasets were analyzed in this study. This data can be found here: The World Bank Data Catalog, https://datacatalog.worldbank.org/search/dataset/0037712.
Author Contributions
AA: Introduction, methodology, and first draft preparation. MQ: Introduction, methodology, empirical model estimation, and final preparation. All authors contributed to the article and approved the submitted version.
Funding
The study has received financial support from the Institutions of advanced Researched (IAR) under project financing—IAR/2021/PUB/002.
Conflict of Interest
The authors declare that the research was conducted in the absence of any commercial or financial relationships that could be construed as a potential conflict of interest.
Publisher’s Note
All claims expressed in this article are solely those of the authors and do not necessarily represent those of their affiliated organizations, or those of the publisher, the editors and the reviewers. Any product that may be evaluated in this article, or claim that may be made by its manufacturer, is not guaranteed or endorsed by the publisher.
Acknowledgments
We would like to express our sincere heartfelt gratitude’s to the editor and two esteemed reviewers for their constructive suggestion and recommendations.
References
Acemoglu, D., Gancia, G., and Zilibotti, F. (2012). Competing Engines of Growth: Innovation and Standardization. J. Econ. Theor. 147 (2), 570–601. doi:10.1016/j.jet.2010.09.001
Afridi, M. A., Kehelwalatenna, S., Naseem, I., and Tahir, M. (2019). Per Capita income, Trade Openness, Urbanization, Energy Consumption, and CO2 Emissions: an Empirical Study on the SAARC Region. Environ. Sci. Pollut. Res. 26 (29), 29978–29990. doi:10.1007/s11356-019-06154-2
Ahmar, A. S., and del Val, E. B. (2020). SutteARIMA: Short-Term Forecasting Method, a Case: Covid-19 and Stock Market in Spain. Sci. Total Environ. 729. 138883. doi:10.1016/j.scitotenv.2020.138883
Ahmed, K., Rehman, M. U., and Ozturk, I. (2017). What Drives Carbon Dioxide Emissions in the Long-Run? Evidence from Selected South Asian Countries. Renew. Sustain. Energ. Rev. 70, 1142–1153. doi:10.1016/j.rser.2016.12.018
Al-Mulali, U., Ozturk, I., and Lean, H. H. (2015). The Influence of Economic Growth, Urbanization, Trade Openness, Financial Development, and Renewable Energy on Pollution in Europe. Nat. Hazards 79 (1), 621–644. doi:10.1007/s11069-015-1865-9
Alam, S., Rehman, S., and Butt, M. S. (2011). Trade Liberalization, Environmental Degradation and Sustainable Development in Pakistan. Eur. J. Soc. Sci. 19 (1), 84–96.
Ali, H. S., Law, S. H., and Zannah, T. I. (2016). Dynamic Impact of Urbanization, Economic Growth, Energy Consumption, and Trade Openness on CO 2 Emissions in Nigeria. Environ. Sci. Pollut. Res. 23 (12), 12435–12443. doi:10.1007/s11356-016-6437-3
Ali, S., Yusop, Z., Kaliappan, S. R., and Chin, L. (2021). Trade-environment Nexus in OIC Countries: Fresh Insights from Environmental Kuznets Curve Using GHG Emissions and Ecological Footprint. Environ. Sci. Pollut. Res. 28 (4), 4531–4548. doi:10.1007/s11356-020-10845-6
Antweiler, W., Copeland, B. R., and Taylor, M. S. (2001). Is Free Trade Good for the Environment?. Am. Econ. Rev. 91 (4), 877–908. doi:10.1257/aer.91.4.877
Anwar, N., and Elfaki, K. E. (2021). Examining the Relationship between Energy Consumption, Economic Growth and Environmental Degradation Indonesia: Do Capital and Trade Openness Matter?. Ijred 10 (4), 769–778. doi:10.14710/ijred.2021.37822
Apergis, N., and Payne, J. E. (2012). Renewable and Non-renewable Energy Consumption-Growth Nexus: Evidence from a Panel Error Correction Model. Energ. Econ. 34 (3), 733–738. doi:10.1016/j.eneco.2011.04.007
Awaworyi Churchill, S., Inekwe, J., Smyth, R., and Zhang, X. (2019). R&D Intensity and Carbon Emissions in the G7: 1870-2014. Energ. Econ. 80, 30–37. doi:10.1016/j.eneco.2018.12.020
Banerjee, A., Dolado, J., and Mestre, R. (1998). Error-correction Mechanism Tests for Cointegration in a Single-Equation Framework. J. time Ser. Anal. 19 (3), 267–283. doi:10.1111/1467-9892.00091
Bashir, M. F., Ma, B., Bilal, fnm., Komal, B., and Bashir, M. A. (2021). Analysis of Environmental Taxes Publications: a Bibliometric and Systematic Literature Review. Environ. Sci. Pollut. Res. 28 (16), 20700–20716. doi:10.1007/s11356-020-12123-x
Bashir, M. F., Ma, B., Shahbaz, M., and Jiao, Z. (2020). The Nexus between Environmental Tax and Carbon Emissions with the Roles of Environmental Technology and Financial Development. PLOS ONE 15 (11), e0242412. doi:10.1371/journal.pone.0242412
Bashir, M. F., Ma, B., Shahbaz, M., Shahzad, U., and Vo, X. V. (2021). Unveiling the Heterogeneous Impacts of Environmental Taxes on Energy Consumption and Energy Intensity: Empirical Evidence from OECD Countries. Energy 226, 120366. doi:10.1016/j.energy.2021.120366
Bayer, C., and Hanck, C. (2013). Combining Non-cointegration Tests. J. Time Ser. Anal. 34 (1), 83–95. doi:10.1111/j.1467-9892.2012.00814.x
Bekun, F. V., Alola, A. A., and Sarkodie, S. A. (2019). Toward a Sustainable Environment: Nexus between CO2 Emissions, Resource Rent, Renewable and Nonrenewable Energy in 16-EU Countries. Sci. Total Environ. 657, 1023–1029. doi:10.1016/j.scitotenv.2018.12.104
Belloumi, M. (2009). Energy Consumption and GDP in Tunisia: Cointegration and Causality Analysis. Energy Policy 37 (7), 2745–2753. doi:10.1016/j.enpol.2009.03.027
Ben Jebli, M., Ben Youssef, S., and Ozturk, I. (2016). Testing Environmental Kuznets Curve Hypothesis: The Role of Renewable and Non-renewable Energy Consumption and Trade in OECD Countries. Ecol. Indicators 60, 824–831. doi:10.1016/j.ecolind.2015.08.031
Bhattacharya, M., Awaworyi Churchill, S., and Paramati, S. R. (2017). The Dynamic Impact of Renewable Energy and Institutions on Economic Output and CO 2 Emissions across Regions. Renew. Energ. 111, 157–167. doi:10.1016/j.renene.2017.03.102
Bilgili, F., Koçak, E., and Bulut, Ü. (2016). The Dynamic Impact of Renewable Energy Consumption on CO 2 Emissions: A Revisited Environmental Kuznets Curve Approach. Renew. Sustain. Energ. Rev. 54, 838–845. doi:10.1016/j.rser.2015.10.080
Bölük, G., and Mert, M. (2015). The Renewable Energy, Growth and Environmental Kuznets Curve in Turkey: An ARDL Approach. Renew. Sustain. Energ. Rev. 52, 587–595.
Braungardt, S., Elsland, R., and Eichhammer, W. (2016). The Environmental Impact of Eco-Innovations: the Case of EU Residential Electricity Use. Environ. Econ. Pol. Stud 18 (2), 213–228. doi:10.1007/s10018-015-0129-y
Busu, M., and Nedelcu, A. C. (2021). Analyzing the Renewable Energy and CO2 Emission Levels Nexus at an EU Level: A Panel Data Regression Approach. Processes 9 (1), 130. doi:10.3390/pr9010130
Chang, S.-C. (2015). The Effects of Trade Liberalization on Environmental Degradation. Qual. Quant 49 (1), 235–253. doi:10.1007/s11135-013-9984-4
Charfeddine, L., and Ben Khediri, K. (2016). Financial Development and Environmental Quality in UAE: Cointegration with Structural Breaks. Renew. Sustain. Energ. Rev. 55, 1322–1335. doi:10.1016/j.rser.2015.07.059
Charfeddine, L. (2017). The Impact of Energy Consumption and Economic Development on Ecological Footprint and CO2 Emissions: Evidence from a Markov Switching Equilibrium Correction Model. Energ. Econ. 65, 355–374. doi:10.1016/j.eneco.2017.05.009
Chebbi, H. E., Olarreaga, M., and Zitouna, H. (2011). Trade Openness and CO 2 Emissions in Tunisia. Middle East Develop. J. 3 (01), 29–53. doi:10.1142/s1793812011000314
Cherni, A., and Essaber Jouini, S. (2017). An ARDL Approach to the CO2 Emissions, Renewable Energy and Economic Growth Nexus: Tunisian Evidence. Int. J. Hydrogen Energ. 42 (48), 29056–29066. doi:10.1016/j.ijhydene.2017.08.072
Copeland, B., and Taylor, M. S. (2001). International Trade and the Environment: A Framework for Analysis. No 8540, NBER Working Papers. Bureau of Economic Research, Inc. https://EconPapers.repec.org/RePEc:nbr:nberwo:8540.
Copeland, B. R., and Taylor, M. S. (1994). North-south Trade and the Environment. Q. J. Econ. 109 (3), 755–787. doi:10.2307/2118421
Danish, R. U., Ulucak, R., and Khan, S. U.-D. (2020). Determinants of the Ecological Footprint: Role of Renewable Energy, Natural Resources, and Urbanization. Sustain. Cities Soc. 54, 101996. doi:10.1016/j.scs.2019.101996
Danish, , Zhang, B., Wang, B., and Wang, Z. (2017). Role of Renewable Energy and Non-renewable Energy Consumption on EKC: Evidence from Pakistan. J. Clean. Prod. 156, 855–864. doi:10.1016/j.jclepro.2017.03.203
Dean, J. M. (2002). Does Trade Liberalization Harm the Environment? A New Test. Can. J Econ 35 (4), 819–842. doi:10.1111/0008-4085.00155
Destek, M. A., Balli, E., and Manga, M. (2016). The Relationship between CO2 Emission, Energy Consumption, Urbanization and Trade Openness for Selected CEECs. Res. World Economy 7 (1), 52–58. doi:10.5430/rwe.v7n1p52
Destek, M. A., Ulucak, R., and Dogan, E. (2018). Analyzing the Environmental Kuznets Curve for the EU Countries: the Role of Ecological Footprint. Environ. Sci. Pollut. Res. 25 (29), 29387–29396. doi:10.1007/s11356-018-2911-4
Dickey, D. A., and Fuller, W. A. (1979). Distribution of the Estimators for Autoregressive Time Series with a Unit Root. J. Am. Stat. Assoc. 74 (366a), 427–431. doi:10.1080/01621459.1979.10482531
Dogan, E., Inglesi‐Lotz, R., and Altinoz, B. (2010). Examining the Determinants of Renewable Energy Deployment: Does the Choice of Indicator Matter?. Int. J. Energ. Res..
Dogan, E., and Ozturk, I. (2017). The Influence of Renewable and Non-renewable Energy Consumption and Real Income on CO2 Emissions in the USA: Evidence from Structural Break Tests. Environ. Sci. Pollut. Res. 24 (11), 10846–10854. doi:10.1007/s11356-017-8786-y
Dogan, E., and Seker, F. (2016). Determinants of CO2 Emissions in the European Union: The Role of Renewable and Non-renewable Energy. Renew. Energ. 94, 429–439. doi:10.1016/j.renene.2016.03.078
Dogan, E., and Seker, F. (2016). The Influence of Real Output, Renewable and Non-renewable Energy, Trade and Financial Development on Carbon Emissions in the Top Renewable Energy Countries. Renew. Sustain. Energ. Rev. 60, 1074–1085. doi:10.1016/j.rser.2016.02.006
Dogan, E., Ulucak, R., Kocak, E., and Isik, C. (2020). The Use of Ecological Footprint in Estimating the Environmental Kuznets Curve Hypothesis for BRICST by Considering Cross-Section Dependence and Heterogeneity. Sci. Total Environ. 723, 138063. doi:10.1016/j.scitotenv.2020.138063
Dong, K., Sun, R., and Hochman, G. (2017). Do natural Gas and Renewable Energy Consumption lead to Less CO2 Emission? Empirical Evidence from a Panel of BRICS Countries. Energy 141, 1466–1478. doi:10.1016/j.energy.2017.11.092
Dong, K., Sun, R., Jiang, H., and Zeng, X. (2018). CO2 Emissions, Economic Growth, and the Environmental Kuznets Curve in China: What Roles Can Nuclear Energy and Renewable Energy Play?. J. Clean. Prod. 196, 51–63. doi:10.1016/j.jclepro.2018.05.271
Elliott, G., Rothenberg, T. J., and Stock, J. H. (1996). Efficient Tests for an Autoregressive Unit Root. Econometrica 64 (4), 813–836. doi:10.2307/2171846
Engin Balın, B., mumcu akan, H., and Altaylıgil, Y. B. (2018). Trade Liberalization and Environmental Degradation: A Time Series Analysis for Turkey.
Engle, R. F., and Granger, C. W. J. (1987). Co-integration and Error Correction: Representation, Estimation, and Testing. Econometrica 55, 251–276. doi:10.2307/1913236
Everett, T. (2010). Economic Growth and the Environment. MPRA Paper No. 23585. Munich Personal RePEc Archive. Available at: https://mpra.ub.uni-muenchen.de/23585/ (Accessed July 01, 2010).
Fernández-Amador, O., Oberdabernig, D. A., and Tomberger, P. (2019). Testing for Convergence in Carbon Dioxide Emissions Using a Bayesian Robust Structural Model. Environ. Resource Econ. 73 (4), 1265–1286.
Fodha, M., and Zaghdoud, O. (2010). Economic Growth and Pollutant Emissions in Tunisia: An Empirical Analysis of the Environmental Kuznets Curve. Energy Policy 38, 1150–1156. doi:10.1016/j.enpol.2009.11.002
Fotros, M. H., and Maaboudi, R. (2011). Trade Openness and Co2 Emissions in Iran, 1971-2008. International J Business Development Studies 3 (1), 73–84.
Grossman, G. M., and Krueger, A. B. (1995). Economic Growth and the Environment. Q. J. Econ. 110 (2), 353–377. doi:10.2307/2118443
Hakimi, A., and Hamdi, H. (2016). Trade Liberalization, FDI Inflows, Environmental Quality and Economic Growth: a Comparative Analysis between Tunisia and Morocco. Renew. Sustain. Energ. Rev. 58, 1445–1456. doi:10.1016/j.rser.2015.12.280
Hu, H., Xie, N., Fang, D., and Zhang, X. (2018). The Role of Renewable Energy Consumption and Commercial Services Trade in Carbon Dioxide Reduction: Evidence from 25 Developing Countries. Appl. Energ. 211, 1229–1244. doi:10.1016/j.apenergy.2017.12.019
Hussain, M., and Dogan, E. (2021). The Role of Institutional Quality and Environment-Related Technologies in Environmental Degradation for BRICS. J. Clean. Prod. 304, 127059. doi:10.1016/j.jclepro.2021.127059
Jabeen, A. (2015). Is Trade Liberalization, Economic Growth, Energy Consumption Good for the Environment?. Rom. J. Fiscal Pol. (Rjfp) 6 (2), 1–13.
Jaffe, A. B., Newell, R. G., and Stavins, R. N. (2002). Environmental Policy and Technological Change. Environ. Resource Econ. 22 (1), 41–70. doi:10.1023/a:1015519401088
Jia, Z. (2021). Economic Policy Uncertainty and Financial Innovation: Is There Any Affiliation?. Front. Psychol. 12, 1781. doi:10.3389/fpsyg.2021.631834
Johansen, S. (1991). Estimation and Hypothesis Testing of Cointegration Vectors in Gaussian Vector Autoregressive Models. Econometrica 59, 1551–1580. doi:10.2307/2938278
Johansen, S. (1995). Likelihood-Based Inference in Cointegrated Vector Autoregressive Models. Oxford: Oxford University Press.
Kais, S., and Sami, H. (2016). An Econometric Study of the Impact of Economic Growth and Energy Use on Carbon Emissions: Panel Data Evidence from Fifty Eight Countries. Renew. Sustain. Energ. Rev. 59, 1101–1110. doi:10.1016/j.rser.2016.01.054
Karl, T. R., Arguez, A., Huang, B., Lawrimore, J. H., McMahon, J. R., Menne, M. J., et al. (2015). Possible Artifacts of Data Biases in the Recent Global Surface Warming Hiatus. Science 348 (6242), 1469–1472. doi:10.1126/science.aaa5632
Khan, H. (2021). Renewable Energy Consumption, Trade Openness, and Environmental Degradation: A Panel Data Analysis of Developing and Developed Countries. Math. Probl. Eng. 2021, 6691046. doi:10.1155/2021/6691046
Khan, S. A. R., Yu, Z., Belhadi, A., and Mardani, A. (2020). Investigating the Effects of Renewable Energy on International Trade and Environmental Quality. J. Environ. Manage. 272, 111089. doi:10.1016/j.jenvman.2020.111089
Khan, S., and Gupta, S. (2020). International Trade, Economic Growth and Environmental Quality: An Empirical Evaluation of the Linkages with Reference to Environmental Kuznets Curve (Ekc) for Co2 Emission in India. J. Crit. Rev. 7 (19), 5167–5182.
Khattak, S. I., Ahmad, M., Khan, Z. U., and Khan, A. (2020). Exploring the Impact of Innovation, Renewable Energy Consumption, and Income on CO2 Emissions: New Evidence from the BRICS Economies. Environ. Sci. Pollut. Res. 27 (12), 13866–13881. doi:10.1007/s11356-020-07876-4
Khoshnevis Yazdi, S., and Shakouri, B. (2018). The Effect of Renewable Energy and Urbanization on CO2 Emissions: A Panel Data. Energ. Sourc. B: Econ. Plann. Pol. 13 (2), 121–127. doi:10.1080/15567249.2017.1400607
Kwiatkowski, D. (1992). Testing the Null Hypothesis of Stationarity against the Alternative of a Unit Root: How Sure Are We that Economic Time Series Have a Unit Root?. J. Econom. 54 (1-3), 159–178. doi:10.1016/0304-4076(92)90104-y
Le, T.-H., Chang, Y., and Park, D. (2016). Trade Openness and Environmental Quality: International Evidence. Energy policy 92, 45–55. doi:10.1016/j.enpol.2016.01.030
Liddle, B. (2014). Impact of Population, Age Structure, and Urbanization on Carbon Emissions/energy Consumption: Evidence from Macro-Level, Cross-Country Analyses. Popul. Environ. 35 (3), 286–304. doi:10.1007/s11111-013-0198-4
Ling, C. H., Ahmed, K., Binti Muhamad, R., and Shahbaz, M. (2015). Decomposing the Trade-Environment Nexus for Malaysia: what Do the Technique, Scale, Composition, and Comparative Advantage Effect Indicate?. Environ. Sci. Pollut. Res. 22 (24), 20131–20142. doi:10.1007/s11356-015-5217-9
Liu, X. (2021). The Impact of Renewable Energy, Trade, Economic Growth on CO2 Emissions in China. Int. J. Environ. Stud. 78 (4), 588–607.
Liu, X., Zhang, S., and Bae, J. (2017). The Nexus of Renewable Energy-Agriculture-Environment in BRICS. Appl. Energ. 204, 489–496. doi:10.1016/j.apenergy.2017.07.077
Mahrinasari, M., Haseeb, M., and Ammar, J. (2019). Is Trade Liberalization a hazard to Sustainable Environment?: Fresh Insight from ASEAN Countries. Polish J. Manage. Stud. 19 (1), 249–259.
Managi, S., Hibiki, A., and Tsurumi, T. (2009). Does Trade Openness Improve Environmental Quality?. J. Environ. Econ. Manag. 58 (3), 346–363. doi:10.1016/j.jeem.2009.04.008
Mehrara, M., and ali Rezaei, A. (2013). A Panel Estimation of the Relationship between Trade Liberalization, Economic Growth and CO2 Emissions in BRICS Countries. Hyperion Econ. J. 1 (4), 3–27.
Meo, M. (2021). Energy Consumption, Institutional Quality and Tourist Arrival in Pakistan: Is the Nexus (A)symmetric amidst Structural Breaks?. J. Public Aff. 21 (2), e2213. doi:10.1002/pa.2213
Mhenni, H. (2005). Economic Development, Adjustment and Environmental Quality: the Case of Tunisia for a Contingent Valuation Study. New Medit 4 (2), 36.
Mongo, M., Belaïd, F., and Ramdani, B. (2021). The Effects of Environmental Innovations on CO2 Emissions: Empirical Evidence from Europe. Environ. Sci. Pol. 118, 1–9. doi:10.1016/j.envsci.2020.12.004
Mrabet, Z., AlSamara, M., and Hezam Jarallah, S. (2017). The Impact of Economic Development on Environmental Degradation in Qatar. Environ. Ecol. Stat. 24 (1), 7–38. doi:10.1007/s10651-016-0359-6
Nasir, M., and Ur Rehman, F. (2011). Environmental Kuznets Curve for Carbon Emissions in Pakistan: an Empirical Investigation. Energy Policy 39 (3), 1857–1864. doi:10.1016/j.enpol.2011.01.025
Nathaniel, S. (2020). Energy Consumption, FDI, and Urbanization Linkage in Coastal Mediterranean Countries: Re-assessing the Pollution haven Hypothesis. Environ. Sci. Pollut. Res. 27, 35474–35487. doi:10.1007/s11356-020-09521-6
Nathaniel, S. P. (2021). Economic Complexity versus Ecological Footprint in the Era of Globalization: Evidence from ASEAN Countries. Environ. Sci. Pollut. Res. 28, 64871–64881. doi:10.1007/s11356-021-15360-w
Nathaniel, S. P. (2021). Natural Resources, Urbanisation, Economic Growth and the Ecological Footprint in South Africa: The Moderating Role of Human Capital. Quaestiones Geographicae 40 (2), 63–76. doi:10.2478/quageo-2021-0012
Nguyen, K. H., and Kakinaka, M. (2019). Renewable Energy Consumption, Carbon Emissions, and Development Stages: Some Evidence from Panel Cointegration Analysis. Renew. Energ. 132, 1049–1057. doi:10.1016/j.renene.2018.08.069
Noreen, S. (2020). Trade Liberalization, Economic Growth and Environmental Quality Nexus: An Empirical Evidence from Pakistan. J. Account. Finance Emerging Economies 6 (4). doi:10.26710/jafee.v6i4.1463
Obradović, S., and Lojanica, N. (2017). Energy Use, CO2 Emissions and Economic Growth–Causality on a Sample of SEE Countries. Econ. research-Ekonomska istraživanja 30 (1), 511–526.
Oktavilia, S., and Firmansyah, F. (2016). The Relationships of Environmental Degradation and Trade Openness in Indonesia. Int. J. Econ. Financial Issues 6 (6S), 125–129.
Panayotou, T. (1993). Empirical Tests and Policy Analysis of Environmental Degradation at Different Stages of Economic Development. ILO Working Papers 992927783402676. International Labour Organization. https://ideas.repec.org/p/ilo/ilowps/992927783402676.html.
Paramati, S. R., Mo, D., and Gupta, R. (2017). The Effects of Stock Market Growth and Renewable Energy Use on CO2 Emissions: Evidence from G20 Countries. Energ. Econ. 66, 360–371. doi:10.1016/j.eneco.2017.06.025
Park, Y., Meng, F., and Baloch, M. A. (2018). The Effect of ICT, Financial Development, Growth, and Trade Openness on CO2 Emissions: an Empirical Analysis. Environ. Sci. Pollut. Res. 25 (30), 30708–30719. doi:10.1007/s11356-018-3108-6
Pesaran, M. H., Shin, Y., and Smith, R. J. (2001). Bounds Testing Approaches to the Analysis of Level Relationships. J. Appl. Econ. 16, 289–326. doi:10.1002/jae.616
Peter Boswijk, H. (1994). Testing for an Unstable Root in Conditional and Structural Error Correction Models. J. Econom. 63 (1), 37–60. doi:10.1016/0304-4076(93)01560-9
Petrović, R. (1968). Optimization of Resource Allocation in Project Planning. Operations Res. 16 (3), 559–568.
Phillips, P. C. B., and Hansen, B. E. (1990). Statistical Inference in Instrumental Variables Regression with I(1) Processes. Rev. Econ. Stud. 57 (1), 99–125. doi:10.2307/2297545
Phillips, P. C. B., and Perron, P. (1988). Testing for a Unit Root in Time Series Regression. Biometrika 75 (2), 335–346. doi:10.1093/biomet/75.2.335
Qamruzzaman, M. (2021). Nexus between Environmental Quality, Institutional Quality and Trade Openness through the Channel of FDI: An Application of Common Correlated Effects Estimation (CCEE), NARDL, and Asymmetry Causality. Environ. Sci. Pollut. Res. 28, 52475–52498. doi:10.1007/s11356-021-14269-8
Qamruzzaman, M., Tayachi, T., Mehta, A. M., and Ali, M. (2021). Do International Capital Flows, Institutional Quality Matter for Innovation Output: The Mediating Role of Economic Policy Uncertainty. JOItmC 7 (2), 141. doi:10.3390/joitmc7020141
Rafindadi, A. A. (2016). Does the Need for Economic Growth Influence Energy Consumption and CO2 Emissions in Nigeria? Evidence from the Innovation Accounting Test. Renew. Sustain. Energ. Rev. 62, 1209–1225. doi:10.1016/j.rser.2016.05.028
Rahman, H.-u., Ghazali, A., Bhatti, G. A., and Khan, S. U. (2020). Role of Economic Growth, Financial Development, Trade, Energy and FDI in Environmental Kuznets Curve for Lithuania: Evidence from ARDL Bounds Testing Approach. Ee 31 (1), 39–49. doi:10.5755/j01.ee.31.1.22087
Rana, R., and Sharma, M. (2019). Dynamic Causality Testing for EKC Hypothesis, Pollution haven Hypothesis and International Trade in India. J. Int. Trade Econ. Develop. 28 (3), 348–364. doi:10.1080/09638199.2018.1542451
Salam, S., Sattar, A., and Gilani, S. (2015). An Empirical Research on Trade Libralization and Co2 Emission in Pakistan. J. Econ. Sustain. Develop. 6 (9), 39–46.
Sannassee, R. V., and Seetanah, B. (2016). “Trade Openness and CO2 Emission,” in Handbook of Environmental and Sustainable Finance. Editors V. Ramiah, and G. N. Gregoriou (San Diego: Academic Press), 165–177. doi:10.1016/b978-0-12-803615-0.00009-1
Shafiei, S., and Salim, R. A. (2014). Non-renewable and Renewable Energy Consumption and CO2 Emissions in OECD Countries: A Comparative Analysis. Energy Policy 66, 547–556. doi:10.1016/j.enpol.2013.10.064
Shahbaz, M., Kumar Tiwari, A., and Nasir, M. (2013). The Effects of Financial Development, Economic Growth, Coal Consumption and Trade Openness on CO2 Emissions in South Africa. Energy Policy 61, 1452–1459. doi:10.1016/j.enpol.2013.07.006
Shahbaz, M., Nasreen, S., Ahmed, K., and Hammoudeh, S. (2017). Trade Openness-Carbon Emissions Nexus: The Importance of Turning Points of Trade Openness for Country Panels. Energ. Econ. 61, 221–232. doi:10.1016/j.eneco.2016.11.008
Shahzad, S. J. H., Naifar, N., Hammoudeh, S., and Roubaud, D. (2017). Directional Predictability from Oil Market Uncertainty to Sovereign Credit Spreads of Oil-Exporting Countries: Evidence from Rolling Windows and Crossquantilogram Analysis. Energ. Econ. 68, 327–339. doi:10.1016/j.eneco.2017.10.001
Sherafatian-Jahromi, R., and Othman, M.-S. H. (2020). Macroeconomic Determinants of CO2 Emissions in Australia: Evidence from ARDL Bound Testing Approach. Asia-Pacific Soc. Sci. Rev. 20 (4), 32–43.
Shin, Y., Yu, B., and Greenwood-Nimmo, M. (2014). “Modelling Asymmetric Cointegration and Dynamic Multipliers in a Nonlinear ARDL Framework,” in Festschrift in Honor of Peter Schmidt (Springer), 281–314. doi:10.1007/978-1-4899-8008-3_9
Sinha, A., and Shahbaz, M. (2018). Estimation of Environmental Kuznets Curve for CO2 Emission: Role of Renewable Energy Generation in India. Renew. Energ. 119, 703–711. doi:10.1016/j.renene.2017.12.058
Solarin, S. A., Al-Mulali, U., Musah, I., and Ozturk, I. (2017). Investigating the Pollution haven Hypothesis in Ghana: an Empirical Investigation. Energy 124, 706–719. doi:10.1016/j.energy.2017.02.089
Stock, J. H., and Watson, M. W. (1993). A Simple Estimator of Cointegrating Vectors in Higher Order Integrated Systems. Econometrica 61 (4), 783–820. doi:10.2307/2951763
Talbi, B., et al. (2020). Does Economic Progress and Electricity price Induce Electricity Demand: A New Appraisal in Context of Tunisia. J. Public Aff., e2379. doi:10.1002/pa.2379
Tran, M. T., Gan, C., and Hu, B. (2019). Impacts of Trade Liberalisation on CO2 Emissions in Vietnam. Int. J. Business Econ. 18 (3), 265–286.
Ulucak, R., and Bilgili, F. (2018). A Reinvestigation of EKC Model by Ecological Footprint Measurement for High, Middle and Low Income Countries. J. Clean. Prod. 188, 144–157. doi:10.1016/j.jclepro.2018.03.191
Umer, F., Khoso, M., and Alam, S. (2014). Trade Openness, Public Sector Corruption, and Environment: a Panel Data Analysis for Asian Developing Countries. J. Business Econ. Pol. 1 (2), 2375–0766.
Wang, Z., and Zhu, Y. (2020). Do energy Technology Innovations Contribute to CO2 Emissions Abatement? A Spatial Perspective. Sci. Total Environ. 726, 138574. doi:10.1016/j.scitotenv.2020.138574
World Bank (2021). World Development Indicators. [cited 2017; Available at: http://data.worldbank.org/data-catalog/world-development-indicators.
Yang, B., Jahanger, A., and Ali, M. (2021). Remittance Inflows Affect the Ecological Footprint in BICS Countries: do Technological Innovation and financial Development Matter? Environ. Sci. Pollut. Res. 28, 23482–23500. doi:10.1007/s11356-021-12400-3
Yi, Y., Li, Y., and Qi, J. (2021). Impact of Sino-US Trade Liberalization on China’s Carbon Emissions and Future Works on Fractional Phenomenon. Discrete Dyn. Nat. Soc. 2021, 9961382. doi:10.1155/2021/9961382
Yu, C., Nataliia, D., Yoo, S.-J., and Hwang, Y.-S. (2019). Does Trade Openness Convey a Positive Impact for the Environmental Quality? Evidence from a Panel of CIS Countries. Eurasian Geogr. Econ. 60 (3), 333–356. doi:10.1080/15387216.2019.1670087
Zameer, H., Yasmeen, H., Zafar, M. W., Waheed, A., and Sinha, A. (2020). Analyzing the Association between Innovation, Economic Growth, and Environment: Divulging the Importance of FDI and Trade Openness in India. Environ. Sci. Pollut. Res. 27, 29539–29553. doi:10.1007/s11356-020-09112-5
Zamil, A. M. A., Furqan, M., and Mahmood, H. (2019). Trade Openness and CO2 Emissions Nexus in Oman. Jesi 7 (2), 1319–1329. doi:10.9770/jesi.2019.7.2(36)
Zandi, G., Haseeb, M., and Malaysia, J. T. S. J. S. (2019). The Role of Trade Liberalization in Carbon Dioxide Emission: Evidence from Heterogeneous Panel Estimations. Ijfr 10 (5), 228–240. doi:10.5430/ijfr.v10n5p228
Zhang, S., Liu, X., and Bae, J. (2017). Does Trade Openness Affect CO2 Emissions: Evidence from Ten Newly Industrialized Countries?. Environ. Sci. Pollut. Res. 24 (21), 17616–17625. doi:10.1007/s11356-017-9392-8
Zhang, Y., Qamruzzaman, M., Karim, S., and Jahan, I. (2021). Nexus between Economic Policy Uncertainty and Renewable Energy Consumption in BRIC Nations: The Mediating Role of Foreign Direct Investment and Financial Development. Energies 14 (15), 4687. doi:10.3390/en14154687
Zivot, E., and Andrews, D. W. K. (2002). Further Evidence on the Great Crash, the Oil-price Shock, and the Unit-Root Hypothesis. J. Business Econ. Stat. 20 (1), 25–44. doi:10.1198/073500102753410372
Keywords: environmental sustainability, renewable energy, energy innovation, trade, EKC, ARDL, NARDL
Citation: Andriamahery A and Qamruzzaman M (2022) A Symmetry and Asymmetry Investigation of the Nexus Between Environmental Sustainability, Renewable Energy, Energy Innovation, and Trade: Evidence From Environmental Kuznets Curve Hypothesis in Selected MENA Countries. Front. Energy Res. 9:778202. doi: 10.3389/fenrg.2021.778202
Received: 16 September 2021; Accepted: 23 November 2021;
Published: 03 January 2022.
Edited by:
Fateh Belaid, Lille Catholic University, FranceReviewed by:
Solomon Prince Nathaniel, University of Lagos, NigeriaTze-Haw Chan, Universiti Sains Malaysia (USM), Malaysia
Copyright © 2022 Andriamahery and Qamruzzaman. This is an open-access article distributed under the terms of the Creative Commons Attribution License (CC BY). The use, distribution or reproduction in other forums is permitted, provided the original author(s) and the copyright owner(s) are credited and that the original publication in this journal is cited, in accordance with accepted academic practice. No use, distribution or reproduction is permitted which does not comply with these terms.
*Correspondence: Anselme Andriamahery, dHplZGVrYW5kcmlhbWFoZXJ5QGhicHUuZWR1LmNu; Md. Qamruzzaman, emFtYW5fd3V0MTZAeWFob28uY29t, cWFtcnV6emFtYW5AYnVzLnVpdS5hYy5iZA==
†ORCID: Md. Qamruzzaman, orcid.org/0000-0002-0854-2600